1 Introduction
Energy Communities (EC) are a fundamental part of the energy policies of the European Union (EU). They offer a framework in which citizens are empowered to participate in the energy transition (Yiasoumas et al., 2023). An important activity of an EC is the provision of services to its members (Yiasoumas et al., 2023). However, these services should always consider the user’s experience and preferences. This paper presents the work performed, within the innovation project NEON, to assess the overall user experience and satisfaction of the users and members of the participating ECs in using NEON’s energy services. This approach aimed to improve these services and increase the overall user engagement
Evaluation processes are key to learning from innovative solutions, as well as understanding the viewpoint and experiences of end-users of energy (Parrish et al., 2020). For this purpose, a tailored methodology was designed, leveraging techniques from Social and Human Sciences, to reveal the expected or actual user experience (depending on the status of each CEC) with the solutions advanced within the framework of the project. The work was conducted in coordination with local stakeholders; the municipality and citizens of Berchidda (Italy), citizens and small and medium enterprises (SMEs) in Las Cabezas (Spain) and building managers of Stains City (France). The different topics assessed revolved around the operation and perceived comfort and benefits of NEON services, possible changes in energy habits and the creation and governance of CECs, among others.
The number of respondents and participants, although small, allows for a qualitative approach, to analyse said NEON services, as well as propose some key recommendations for their further operation and improvements, in favour of users, their engagement in energy communities and efficient use of energy, paving the way towards a clean energy transition where the needs and requirements of end-users are satisfied. Recommendations include suggestions to further evaluate the user experience in these use cases.
This paper focuses on gaining a deeper understanding of NEON project participants’ opinions on key issues and concepts such as demand response, energy saving and energy communities. It also offers valuable insights about certain attitudes towards energy saving, energy habits, willingness to use renewable energy sources and ways to improve energy management (Gohary et al., 2022; Komendantova, 2021). The feedback gathered from participants on their perspectives can assist those involved in establishing and managing energy communities. Additionally, it provides useful information for exploring scalable solutions for larger CECs and for leveraging technicians’ insights to enhance engagement with local residents.
Methods
The research was organised into three phases: the design of the evaluation, its implementation and the analysis of results. It was decided that direct enquires with users were appropriate to find out about the areas we wanted to explore. The inquire was performed by using two techniques: direct interviews and questionnaires. The interviews and questionnaire, which included various sections or sets of questions, were used to explore participants ideas on NEON services as experienced by end-users. These peerceptions refer to NEON services experienced as a whole and not distinguishing between all the different technologies that make up these services. It also explored general ideas on energy communities. These sections/services were: collective self-consumption from PV installations; heat pump systems; EV charging points; and local energy communities. Statistical analysis (descriptive statistics) followed once information was collected.
2 User experience evaluation
For a project to be successful it is necessary that its objectives are validated by the stakeholders involved. In the case of NEON, participants should be in tune with the solutions provided. Although the participation was not direct in terms of the usage of the solutions provided by NEON, it was related to the expectations the technology might have on their behaviour and their perception of both technology and the expected behavioural changes. To assess this and gather the necessary information that provides the requested insight into participants’ views and attitudes towards energy savings, green energy, energy management, and energy communities, several actions were undertaken (Broman Toft et al., 2014; Gohary et al., 2022; Michalakopoulos et al., 2024). The techniques used to extract this information were primarily focus groups, interviews and surveys. As these three tools have proven to be reliable, they were chosen to explore both the perception of the technology implemented (energy management, satisfaction, energy consumption, etc.) in the project and its various environments, as well as to evaluate users' satisfaction and their relationship with energy management (comfort, energy monitoring display, etc.).
Activities were carried out during several months when participants collaborated providing their views and perceptions on the energy concepts that are core to the project as well as their opinions about the implementation of the NEON technologies in the participating buildings.
2.1 Theoretical background
Context is one of the factors that sometimes is neglected and is potentially just as important as the user and the object when we are talking about user experience. In the case of NEON, the importance of context is highly noticeable as it is entangled with what can be perceived as the object too. Factors such as the location of the electric vehicle (EV) chargers, the location of the solar panels, the distance between the household and the desired technology to be used or benefited from affect how users perceive the technology in use or, in the case of NEON, the technology to be used. Context refers to the situation in which the interaction occurs. Time, location, culture, atmosphere, human presence, and environment, among other things in varying degrees contribute to the user’s experience. From a UX (User Experience) design perspective, it is necessary to think not only about the object itself and the user when you want to achieve a desired UX. It is equally important to consider the context factor, so it is necessary to consider all three contributors (Davis, 1989).
The adoption of energy management technology is crucially mediated by how the user decides to behave and thus energy transitions are somewhat dependent on households using technology to support the energy system. Several cases of evidence support the fact that installing technology does not guarantee its continued use. In that sense we tried to develop an easy-to-use application, so users did not reject it and would adopt and use effortlessly. This was done to improve the perceived performance of the technology, an important factor highlighted by Chadwick et al. (2022) literature review. Depending on the task or project and what experience we want to achieve, it might even be that one of the other contributors is more influential than the others.
To achieve a high-quality user experience in a software product there must be a seamless merging of the knowledge and best practices related to several disciplines, including engineering, computing, psychology, marketing, graphical design and interface design. This is what future developments will have to take into consideration and comply with, having in mind the results from the inquiry we performed in NEON pilots, among other sets of information.
Description of activities. The work performed to assess the UX in NEON CECs was organised into three phases: the design of the evaluation, its implementation and the analysis of results. The latter phase is developed in Section 4.
Design of the UX evaluation. The first step of this design process consisted of following up on the status of the implementation of, on the one hand, the NEON services and, on the other hand, the engagement strategies in each CEC, to ensure having services to ask about and end-users to ask.
After updating and understanding these statuses, the second step was the co-design of the UX evaluation by a NEON interdisciplinary team (formed by representatives of the NEON partners involved in this task) along with pilot leaders, following a mixed methods approach (mainly qualitative but also quantitative) as well as a tailored approach, that resulted in: i) a questionnaire with multiple choice and open questions for citizens of the municipalities of Berchidda and Villacañas (next to the CEC Las Cabezas), and ii)a structured interview with building managers (key informants) in the CEC Stains City.
Before its implementation, this standardised questionnaire (and interview script) was adjusted or tailored to each CEC specificities, again, by and in collaboration with pilot leaders, since NEON CECs are highly diverse, that is, a municipality (the aforementioned Berchidda), an industrial park which is Las Cabezas plus its neighbouring municipality of Villacañas, a business park in France (Stains City), and a residential and touristic community also in France (Domaine de la Source, see Implementation below).
Likewise, the UX questionnaire included various sections or sets of questions on NEON services as experienced by end-users, which meant as a whole and not distinguishing the different technologies that make up these services. These sections/services were: collective self-consumption from PV installations; heat pump systems; EV charging points; and local energy communities (see the table below). And the questions of these sections were mainly about the operation of these services, end-users' comfort and satisfaction, their energy habits, governance-related questions for energy communities, among others (see Section 4 Results, and Annexes).
In this sense, according to the tailored approach and this table, not all sections were part of the questionnaires of the four CECs, and not all questions were exactly the same between pilots (see Annexes). This tailoring responded to the already addressed diversity of pilots’ characteristics and contexts, as well as to the statuses of their NEON services since, by the third quarter of 2023, some key services were not yet operational. Given the delay in the implementation of the services, to carry out this evaluation, the wording of numerous questions was modified to find out about expectations (informing the recommendations component of this task) rather than looking for the (non-yet existent) experience of respondents, when applicable. For instance, in the case of the CEC Las Cabezas, their questions ended up asking for information necessary for the building of the energy-sharing agreement that they will sign with participant inhabitants of Villacañas, that is, starting to codesign with end-users of this CEC their future experience.
Implementation of the UX evaluation. This implementation phase implied the translation of the final version of the UX evaluation questionnaires and interview script1 (the latter for the CEC Stains City) into local languages, and its dissemination -through digital channels- to respondents, both actions (the translation and dissemination) led and/or directly executed by pilot leaders, except in the case of the CEC Domaine de la Source which was only able to partially complete the design phase (see Section 5 Deviations). Likewise, answers to open questions were translated back into English for their processing and analysis. The table below shows the number of respondents (who effectively completed the questionnaires they received) and the months of implementation of the questionnaire or interview per CEC.
It is worth noting that respondents in Berchidda were inhabitants of this municipality with high probabilities of becoming end-users of this CEC once formally created and operating. In Las Cabezas, respondents were inhabitants of Villacañas, the municipality that is next to this industrial park, who have consistently participated in engagement activities organised in this CEC, for which there is also a high probability that they become end-users of this energy community.
Precisely in CEC Las Cabezas, after implementing its questionnaire, they organised a workshop held on July 27, 2023, with some of said respondents, and with colleagues from the industrial park, to further explore and better understand the answers received, hence increasing the chances of building a successful energy-sharing agreement with the people interested in joining this CEC. This workshop was organised by designing messages and communication materials to effectively engage these attendees and sharing with pilot leaders of Las Cabezas a few facilitation techniques to promote an active participation in this workshop. Relevant insights from this activity are discussed also in Section 4 Results.
3 Results: User experience assessment and recommendations
The results from the fieldwork conducted show that perceptions of the energy community are generally favourable, and the economic incentive as previously demostrated (Algarvio, 2021; Pereira et al., 2021; Zwickl-Bernhard & Auer, 2021) is an important aspect, jointly with the ecological one. This economic incentive goes in line with the results from recent studies (Barney et al., 2023; Lennon et al., 2023). The preoccupation for the environment as an energy community driver is similarly reflected as in several studies (Lennon et al., 2023; Sainz Salces, 2023).
The data collected is not representative of the general population, as the sample is small in all three pilots, but it gives some indications about the general feeling from those in the community who replied to the questionnaire and have been in contact with the project developments.
3.1 Results from Berchidda
At Berchidda answers from 16 participants were collected, inhabitants of the municipality and hence potential end-users of this CEC. As can be seen from the demographic data, most of the respondents were male, nearly three out of four, and more than half of the respondents were over the age of 65 (Figure 1). This indicates that a very important part of the sample is men over the age of retirement, with a good level of education, as seen in Figure 2.
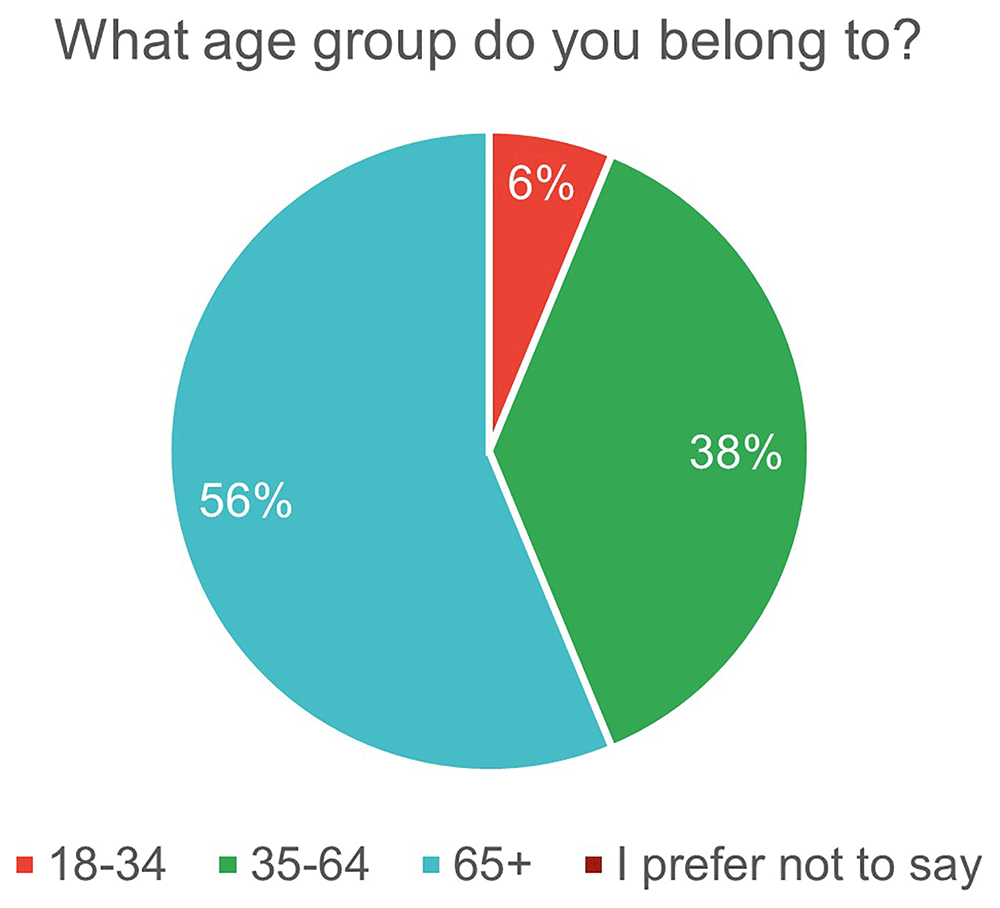
Figure 1. Demographics: age and gender distribution.
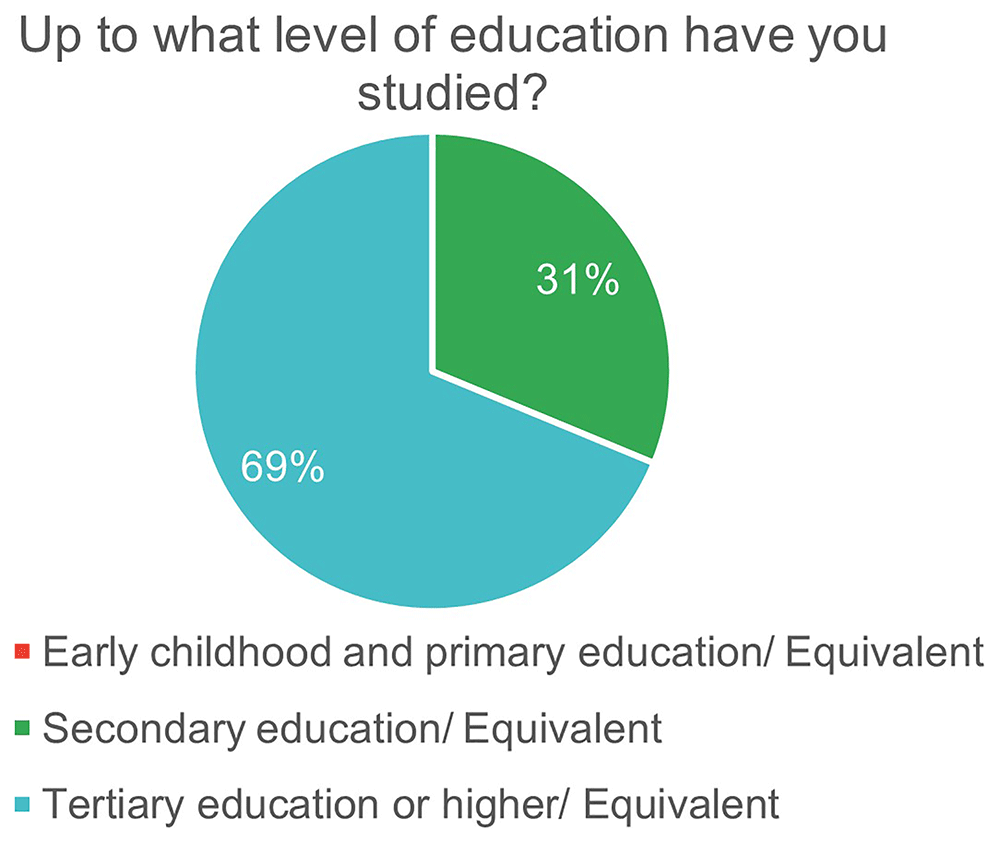
Figure 2. Demographics: education level.
Collective self-consumption. Issues about self-consumption were explored, starting with a question on self-consumption PV installations. Three-quarters of the respondents reported they have knowledge about shared self-consumption PV installations and exactly the same amount reported not being users of the service, as can be seen from Figure 3.
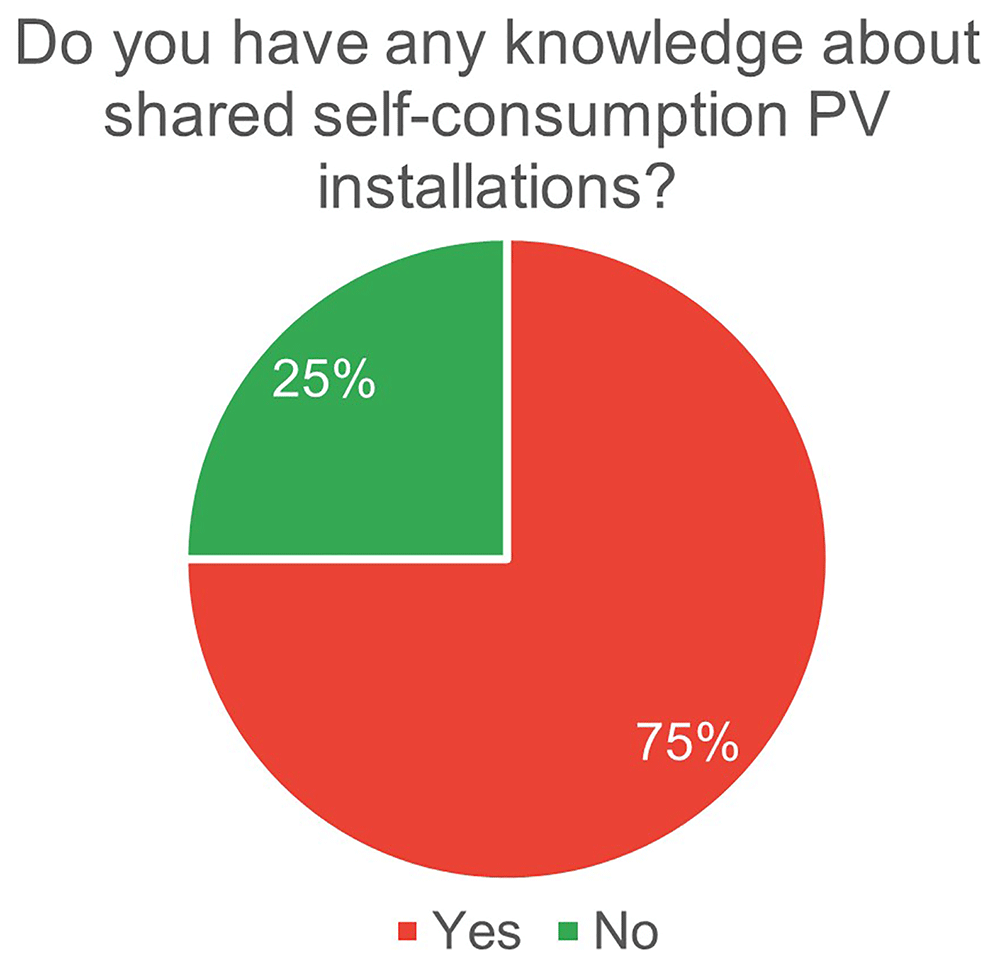
Figure 3. Satisfaction level with the services and behavioral change willingness.
Three out of five users replied that they didn’t experience any outages since the implementation of the service, and for those who experienced outages it affected their comfort mostly not severely (rated as 2 and 3) in 66% of the answers, and affected seriously in 34% of respondents (with a value of 8) considering the values are on a scale of 1 to 10 (Figure 4).
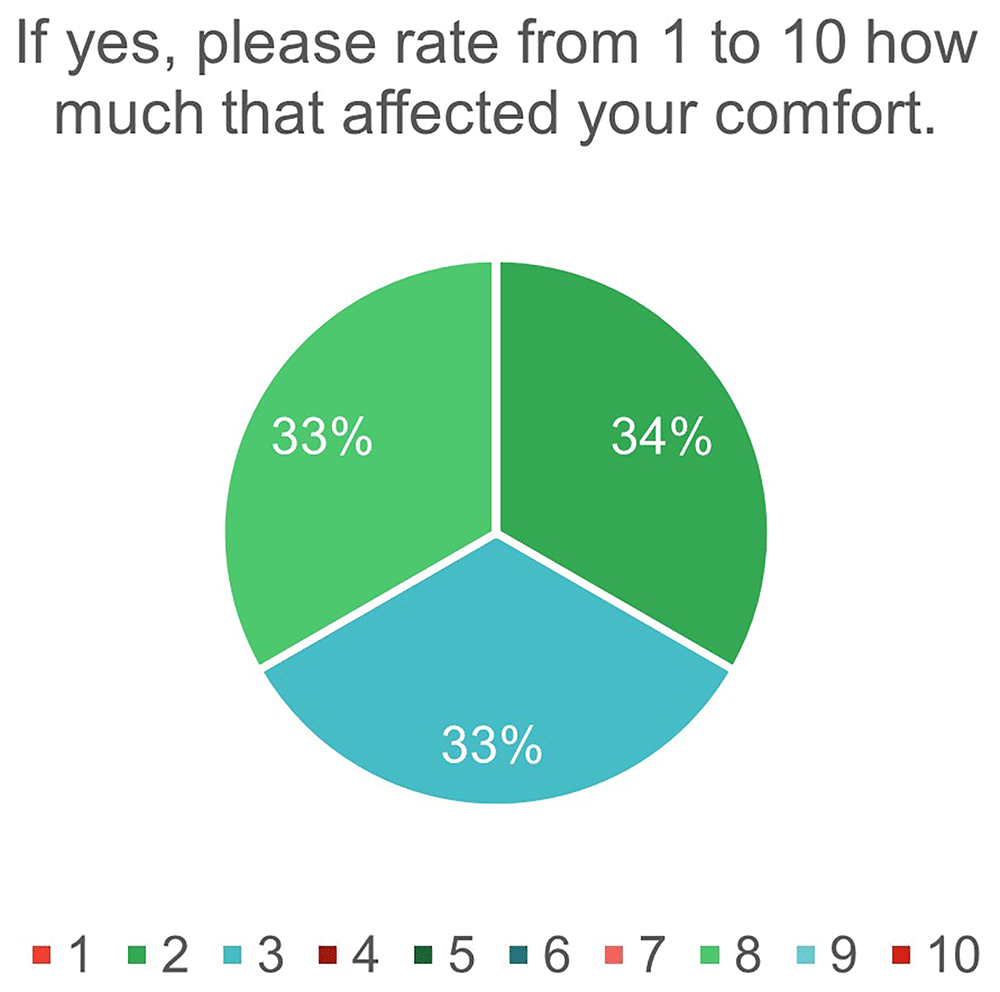
Figure 4. Satisfaction with running and maintenance costs and perceived changes about it.
When exploring the economic side of the service the results showed that three out of five reported an increase in the energy bill and again, the same proportion of respondents, reported that this has been a significant change for them (Figure 5).
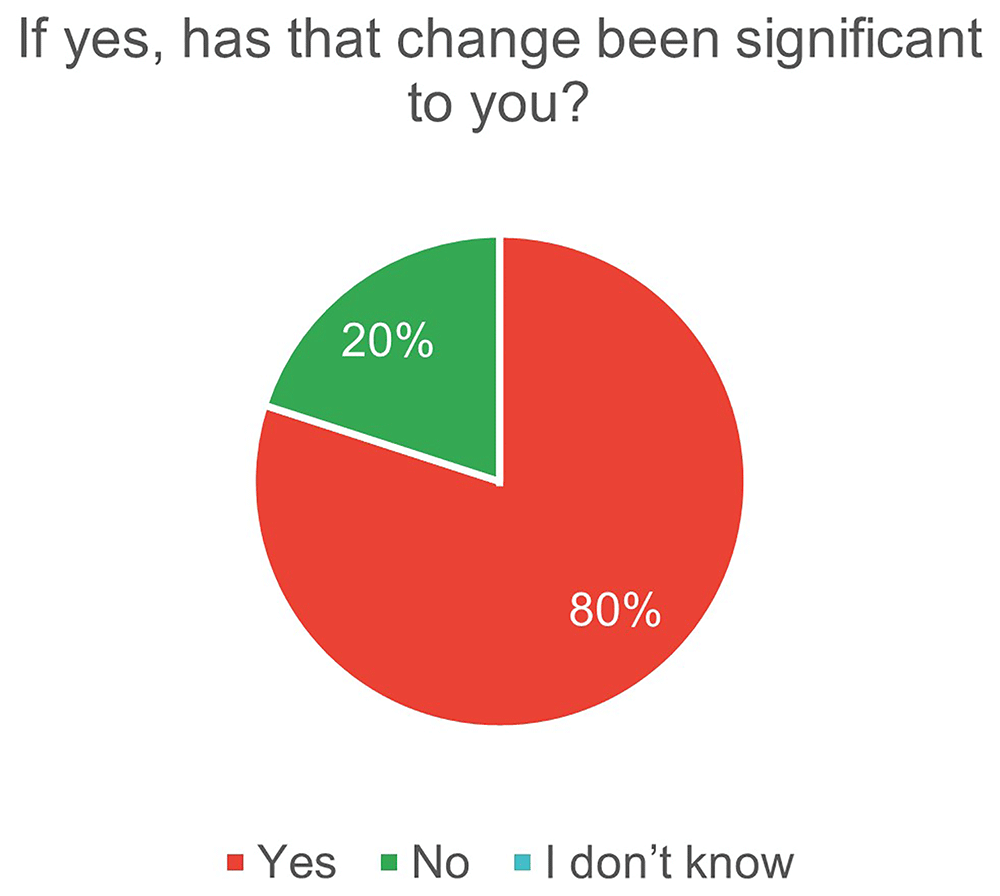
Figure 5. EV chargers experience.
It comes as no surprise after the previous questions that nearly two-thirds of the respondents were not very satisfied with the service. Another question though is the implication for behavioural changes on users: it seems that a staggering 87% of users will be willing to change their behaviour to lower energy consumption at home and workplace (Figure 6).
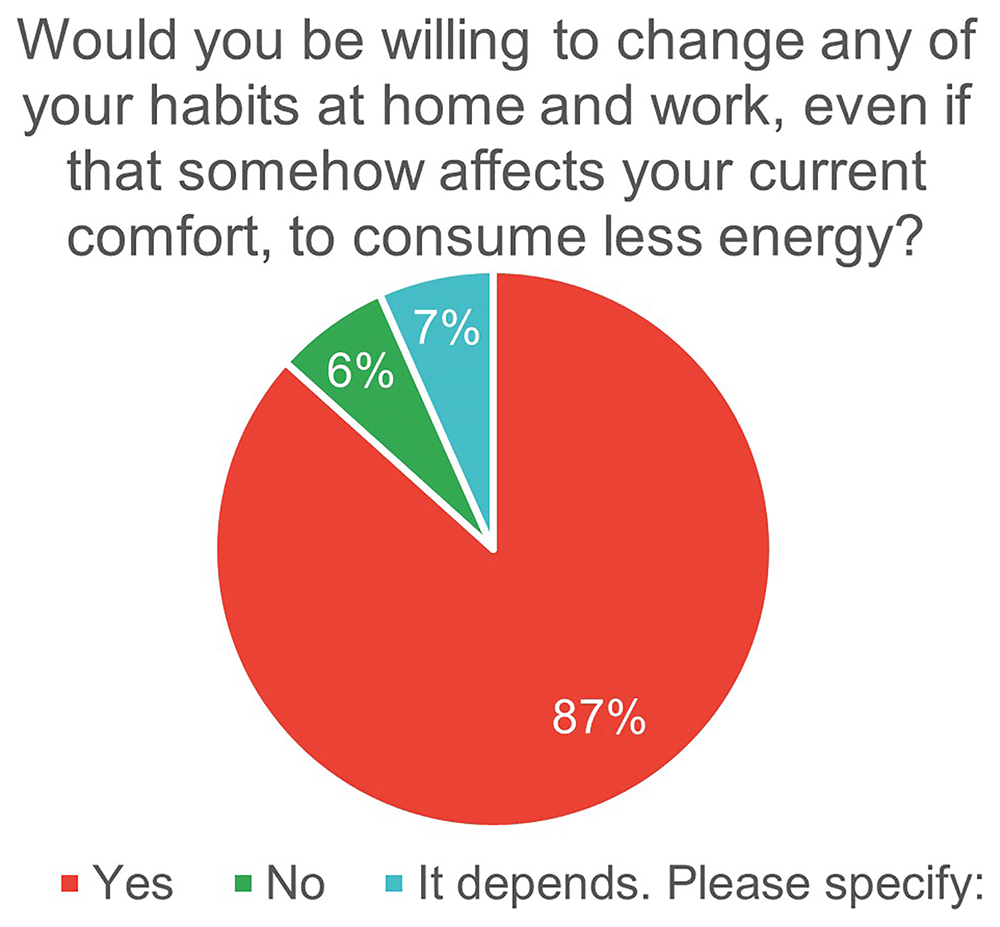
Figure 6. Interests in joining energy communities.
Heat pump systems. The number of users for the heat pump system was less than half (43%) of the responders and all reported that the heat pump was working properly. Curiously the same number of respondents said that the heating comfort stayed the same, while the remaining 57% stated that their comfort has improved after installing and using the heat pump system (Figure 7). It is worth noticing that none of the participants reported worsening on their comfort.
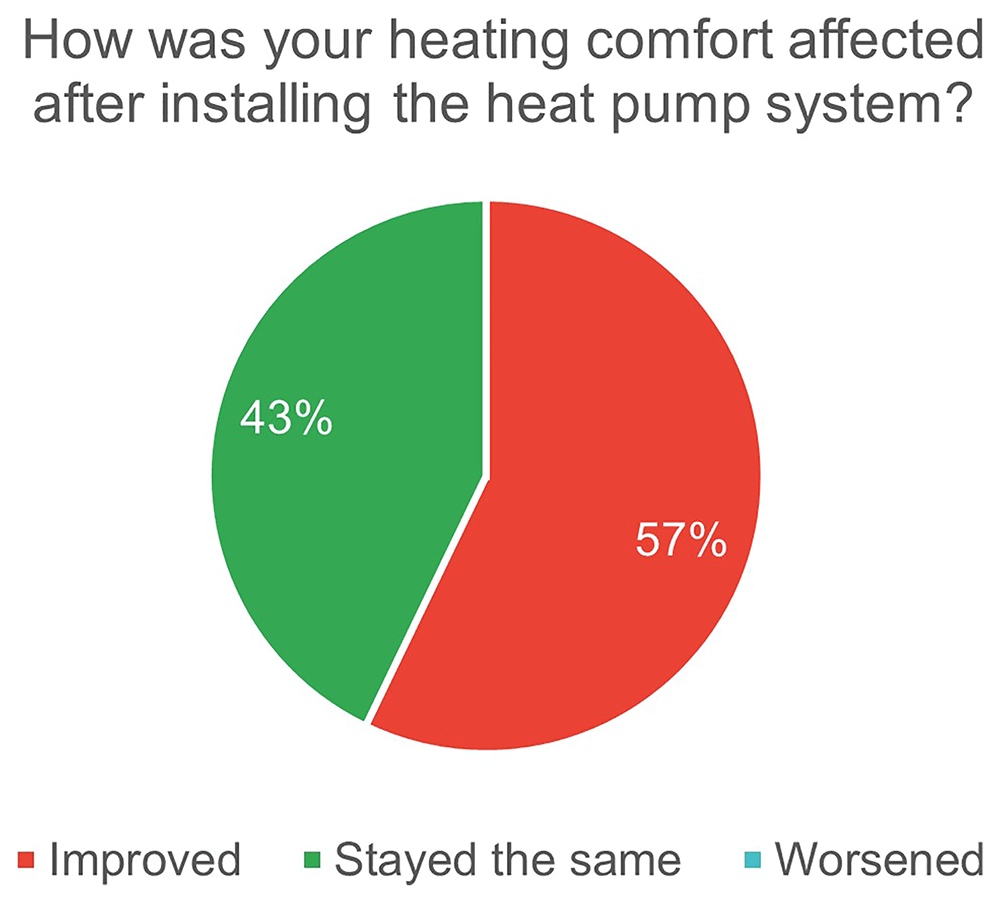
Figure 7. Membership type choice.
Most importantly the number of users who are dissatisfied with the maintenance and running costs of the heat pump system is less than a third of the users (Figure 8). This needs to be further explored as the reasons are yet unknown. It could be the running or the maintenance, or it can be related to a wide series of facts. The majority of users are satisfied but the satisfactory ratio could still be increased.
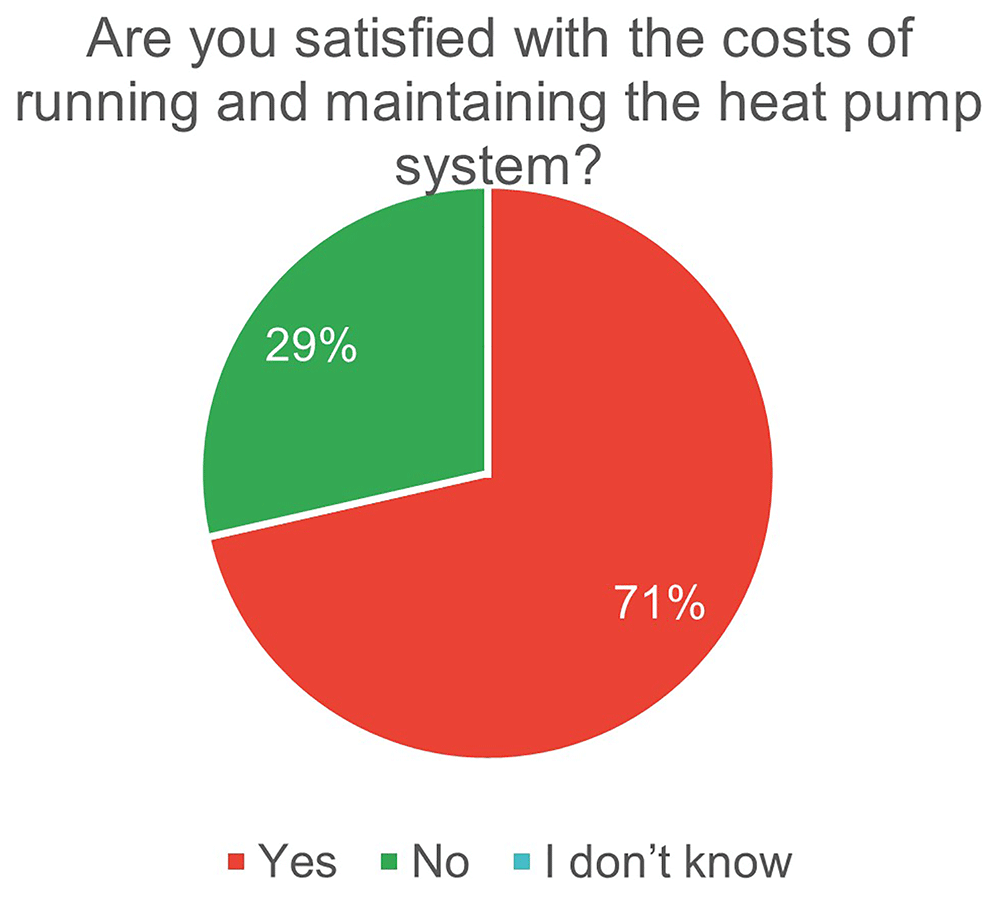
Figure 8. Membership conditions.
EV charging points. The EV charging points were also explored both in the assessment of previous experiences using a charging point and to the soon to be installed EV charging point in Berchidda. At the time of the questioning, none of the respondents were anEV user, and only 56% of them had certain knowledge about EVs. The remaining 44% don’t have knowledge about it. In addition, the majority of respondents (93%) didn’t know there was a plan to install EV chargers in the municipality (Figure 9) which indicates a lack of communication around the future service.
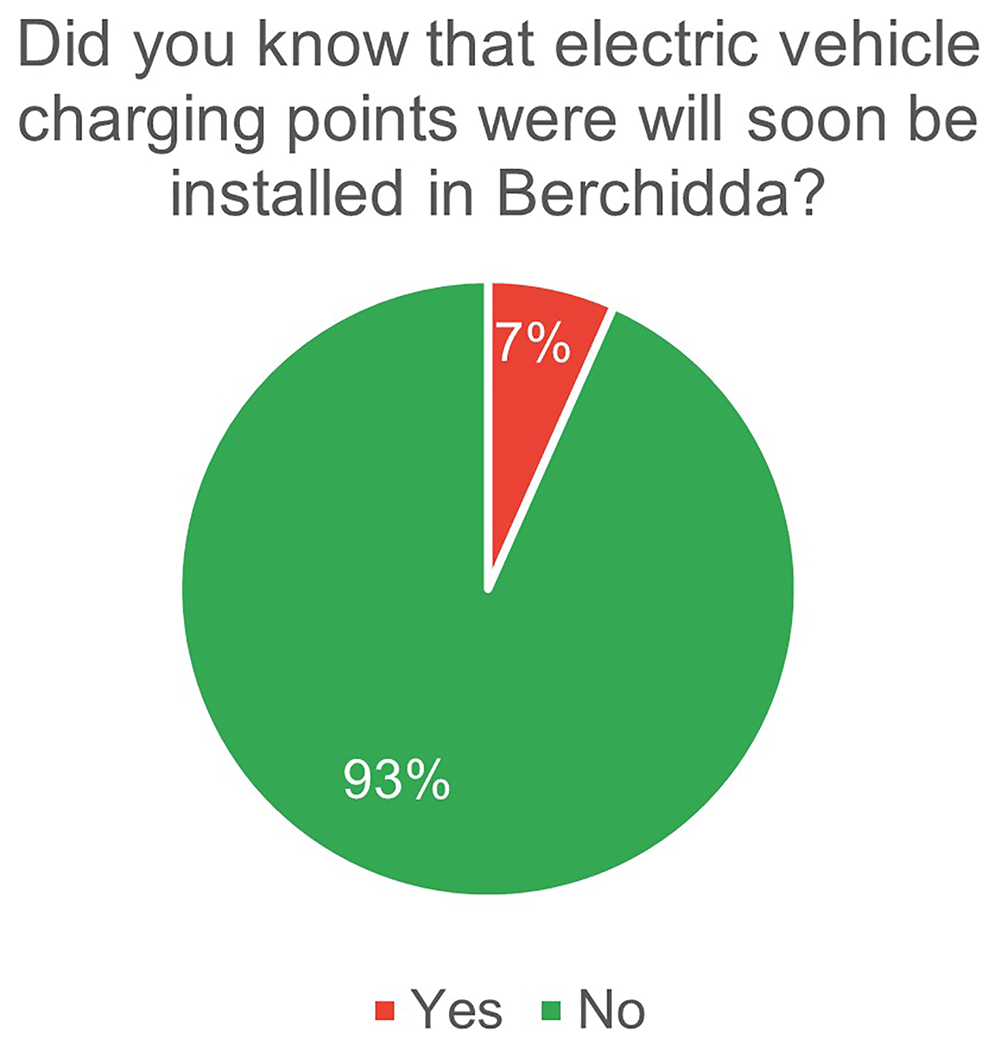
Figure 9. Interest groups for the energy community.
Local energy community. The interest in joining the energy community has been expressed by less than half of the people interviewed, however when asked about their intentions for the future regarding the possibility of joining an energy community, the answers were very promising. More than half (54%) chose the top option (represented by the wording: “Very likely option”) and the remaining 46% chose the “Probably” option as shown by Figure 10.
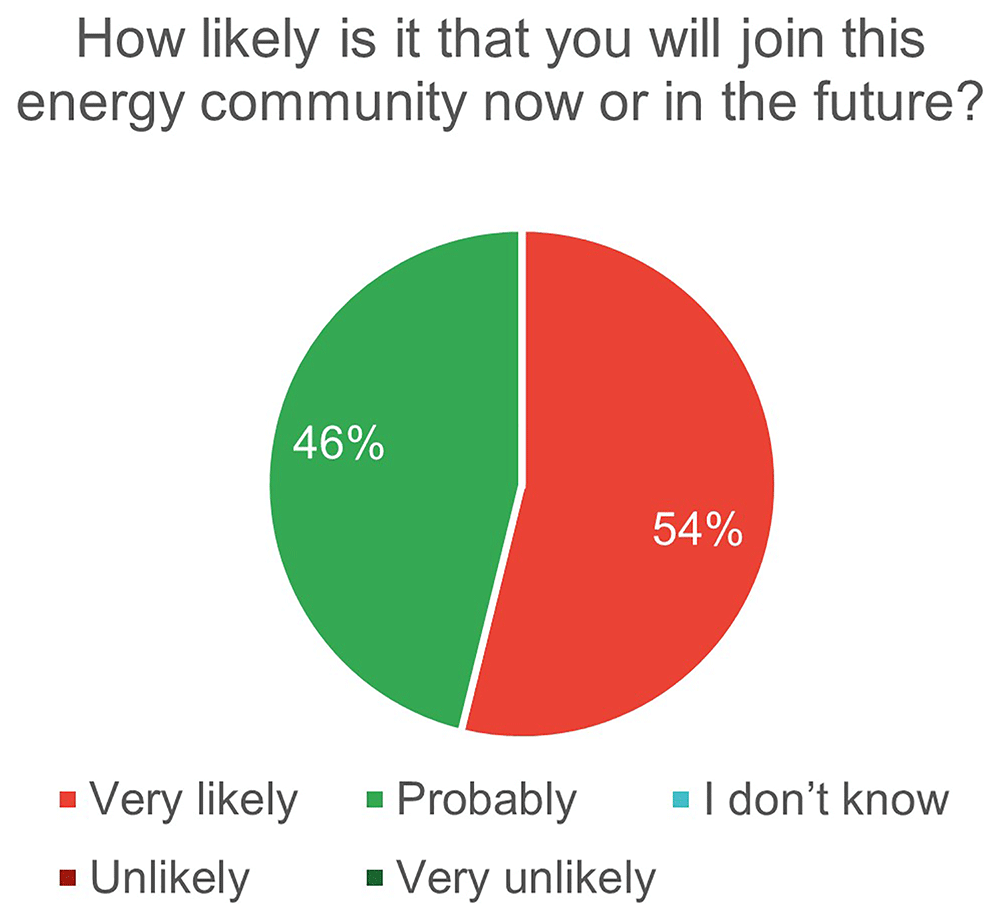
Figure 10. Benefits from the energy community.
To further understand the interest, knowledge and attitudes towards energy communities in the pilot site it was decided to ask them about their desired role and management of the energy community. More than half of the answers were inclined to be prosumers (57%), while more than a third decided to be consumers (36%) and a small percentage chose to be only producers (7%) (Figure 11).
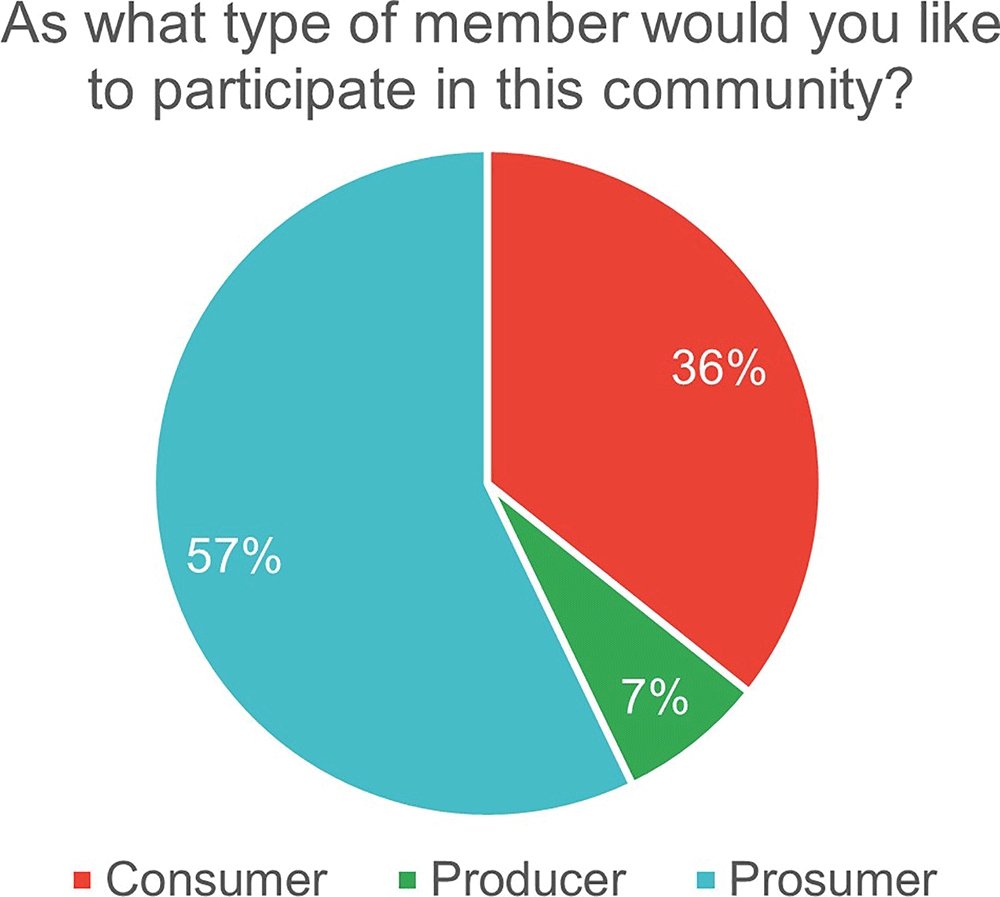
Figure 11. Demographics: gender and educational level.
The perception of the conditions in which members are part of the community depending on their duties was also explored. Half of the respondents thought there should not be a distinction between members of the community. Nearly a third of responses (29%) reflected a sense of differentiation depending on the nature of the member that is linked to rights and duties. A fifth (21%) of answers were conditional (Figure 12).
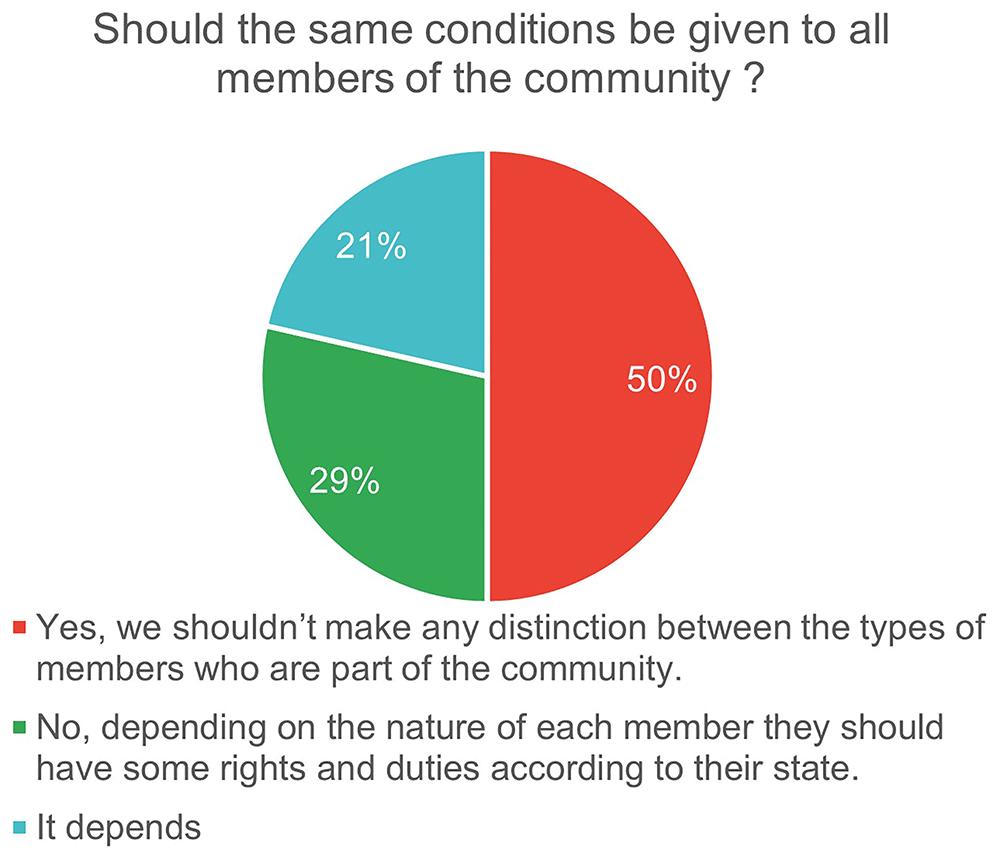
Figure 12. Energy habits modifications and comfort.
The identification of seven interest groups as possible actors that can have a positive role in the renewable energy community was confirmed by the values ascribed to them: all possible actors scored over 70% positive answers. Business owners were perceived by all respondents as having a potential positive effect on the energy community, while the political class, those in charge of legislation were seen as the least positive actors (still with a value of nearly 73%). Trade associations and tenant’s associations reached nearly 82% of their positive role in the energy community and homeowner’s associations, private financers/investors and energy supply companies scored over 90%, as seen in Figure 13. This data underscores the overall positive perception of these groups’ potential contributions to the energy community.
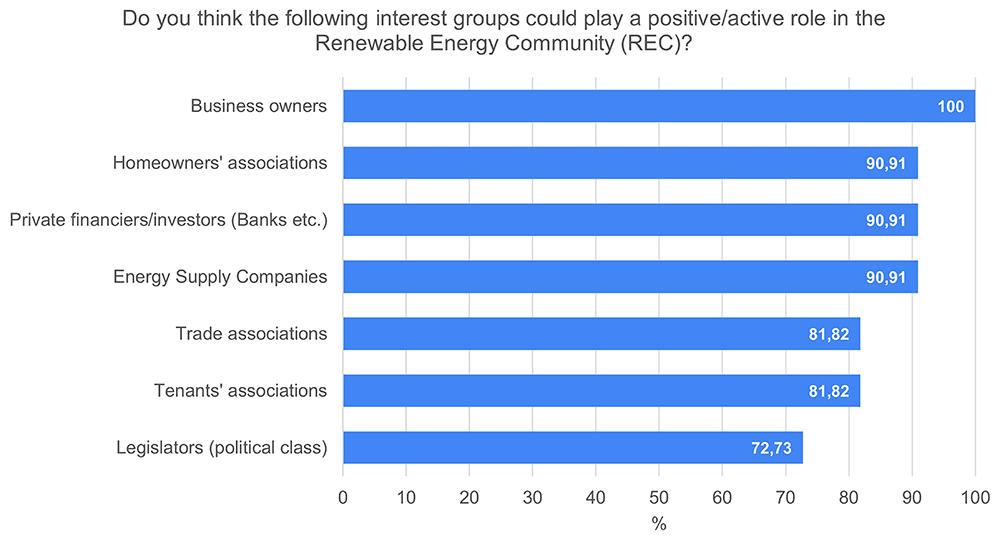
Figure 13. Energy distribution type for community members.
The drivers to promote the creation of energy communities have been investigated. Four main motivations for launching an energy community have been identified. All respondents agreed that the economic factor was a strong motivation. A very high percentage of them (93%) considered the environmental factor as very important too, together with the energy poverty reduction (87%), while social cohesion was perceived as the least relevant but still with a score of 68% as presented in Figure 14.
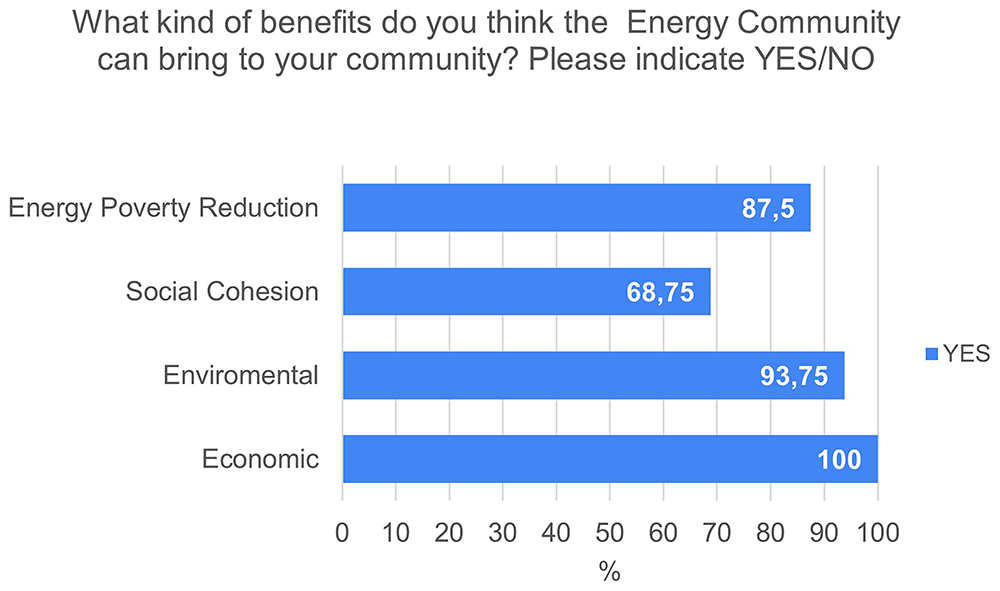
Figure 14. Preferred consumption interval measurement.
The fact that the majority of respondents didn’t even know about the EV chargers installation plan in Berchidda points to a lack of interest from the users or a need to better inform citizens of this plan, and probably other green energy planned actions. The interest in joining an energy community in the future might reflect the positive effects experienced in Berchidda by those who were aware of them.
It seems clear that answering these questions implies certain knowledge of the running of energy communities. The experience in the pilot, especially in Berchidda points to that. Perception of the actors that can benefit the energy community was mostly positive, pointing to a perception of external actors as possible entities that can support the energy community.
It was not a surprise that the economic motivation was perceived by all respondents as something key to the creation of the energy community, and probably an awareness of climate change and together in a less extent to the reduction of energy poverty and desired social cohesion.
3.2 Results from Las Cabezas
The enquire in Las Cabezas was answered by seven people who, as introduced in Section 3, are inhabitants of the municipality of Villacañas (next to this industrial park) that have consistently participated in NEON engagement activities, for which they can be considered as potential end-users of this CEC. All respondents were under the age of 34 and three-quarters were male. The level of education was high with 86% of the people who responded had higher education or equivalent as seen in Figure 15.
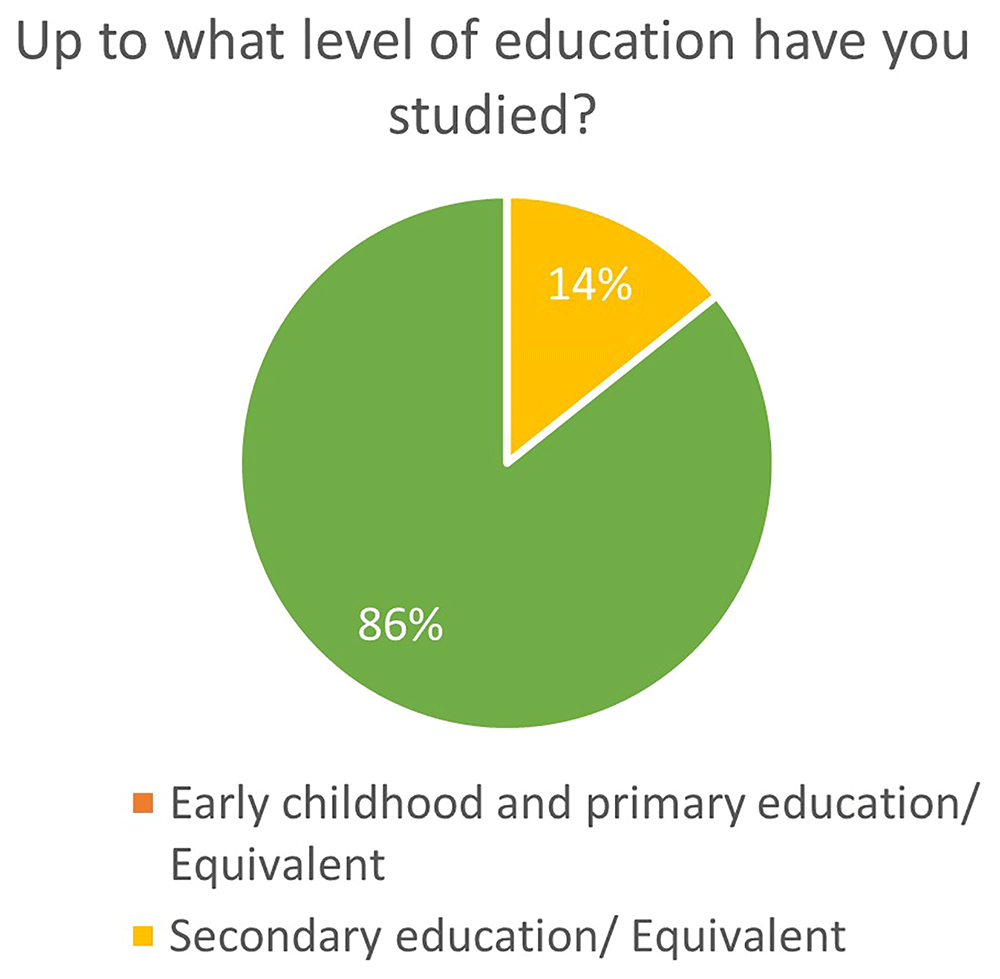
Figure 15. Conditions for members of the community.
Collective self-consumption. Regarding collective self-consumption, we must start pointing out the fact that all respondents said they have knowledge about shared self-consumption photovoltaic (PV) installations. It is also a good indicator that almost three quarters of respondents (72%) were willing to change their energy habits that could affect their comfort to improve the energy efficiency at their home and workplace, whilst 14% were not willing to do so and the same percentage would do depending on conditions as presented in Figure 16.
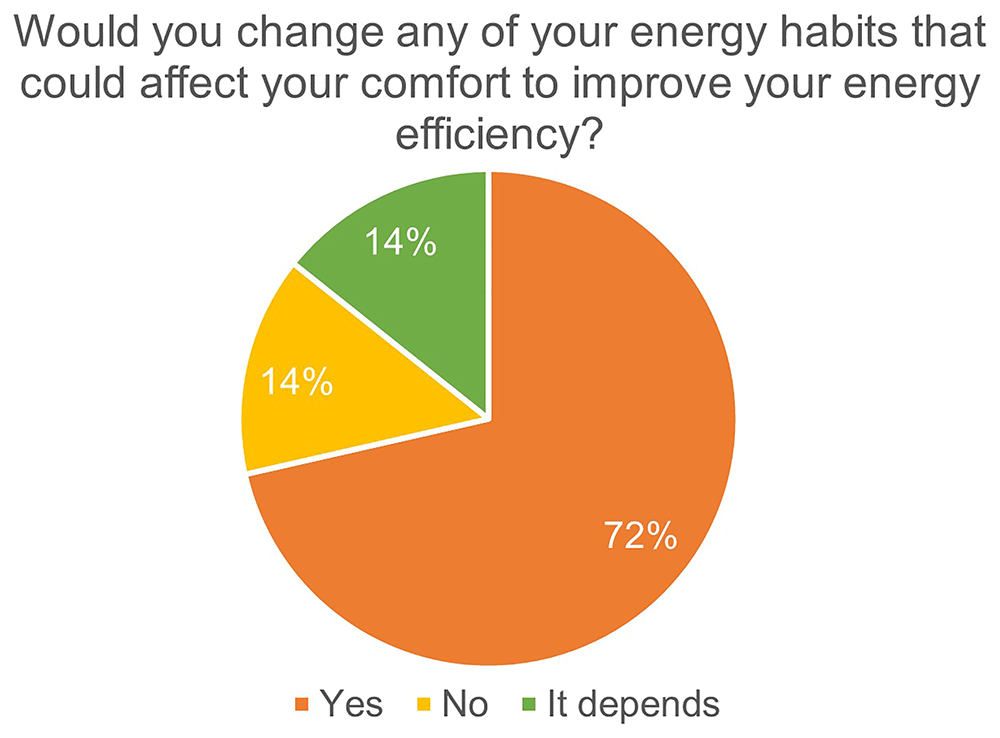
Figure 16. Energy consumption information and revision of energy community internal agreements preferred frequencies.
When asked about their preferences regarding the type of energy distribution they can have in the energy community as individual members the vast majority (86%) replied they preferred a power and energy-based distribution and the rest (14%) opted for a formula based on the energy consumed and distribution type, as illustrated in Figure 17.
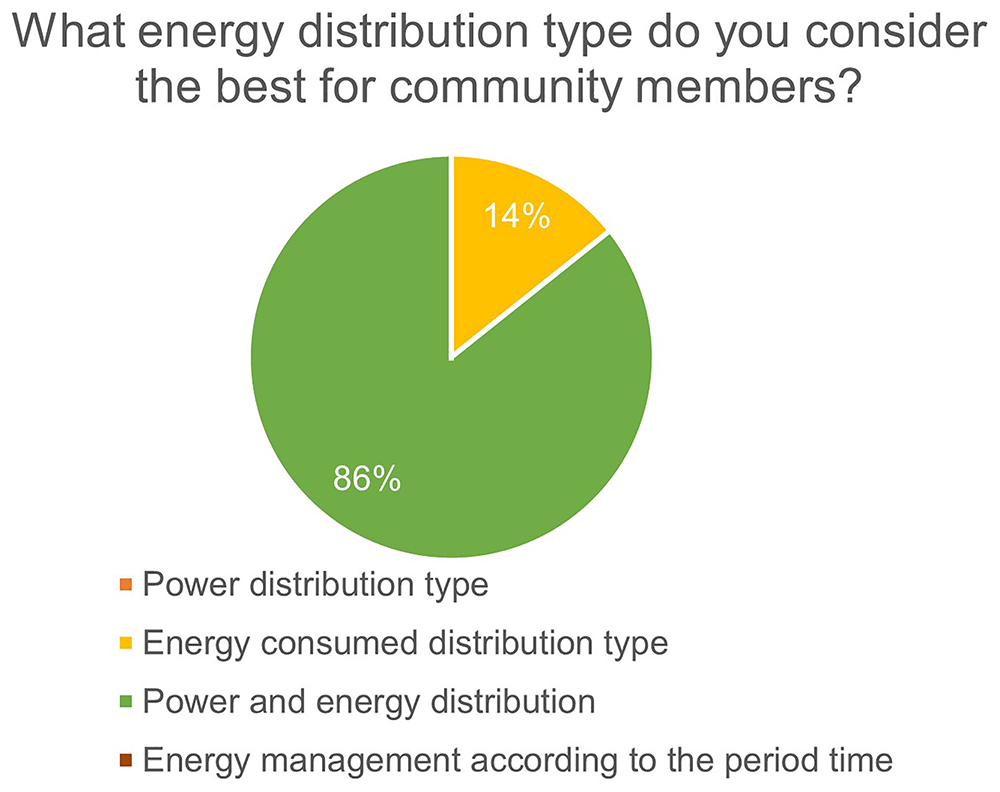
Figure 17. Role in the energy community and confidence in becoming part of an energy community.
When asked about the interval measure choice the preferences were quite different. Interestingly enough from the five options presented to them, nobody chose the 1-hour interval, while a staggering 29% chose to have it every minute, although me majority of respondents 43% preferred to have it every 15 minutes. The 30-minute choice as well as the daily choice amounted each to 14% of the answers (Figure 18). It seems the preferences are quite varied, and it should be interesting to understand the reasons.
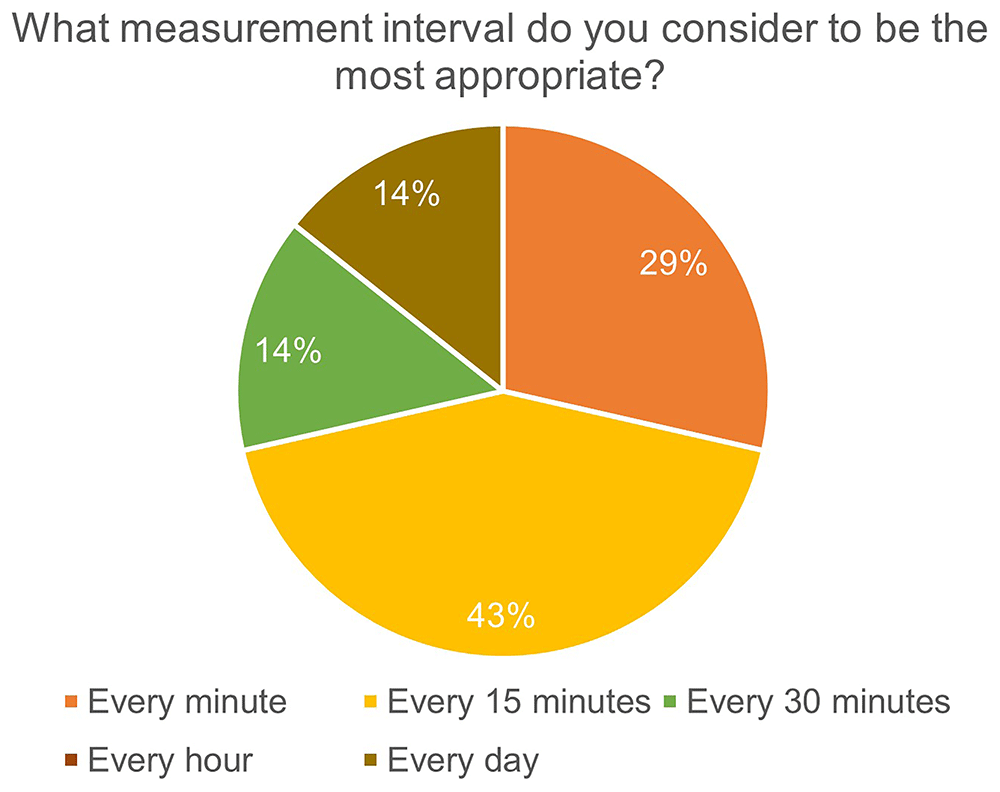
Figure 18. EV charger experience and opinion about the EV charger location in Las Cabezas.
When asked what conditions the different members of the local energy community service should have according to their nature in Las Cabezas, the majority (71%) thought they should have the same conditions regardless of their nature, the remaining 29% thought otherwise (Figure 19).
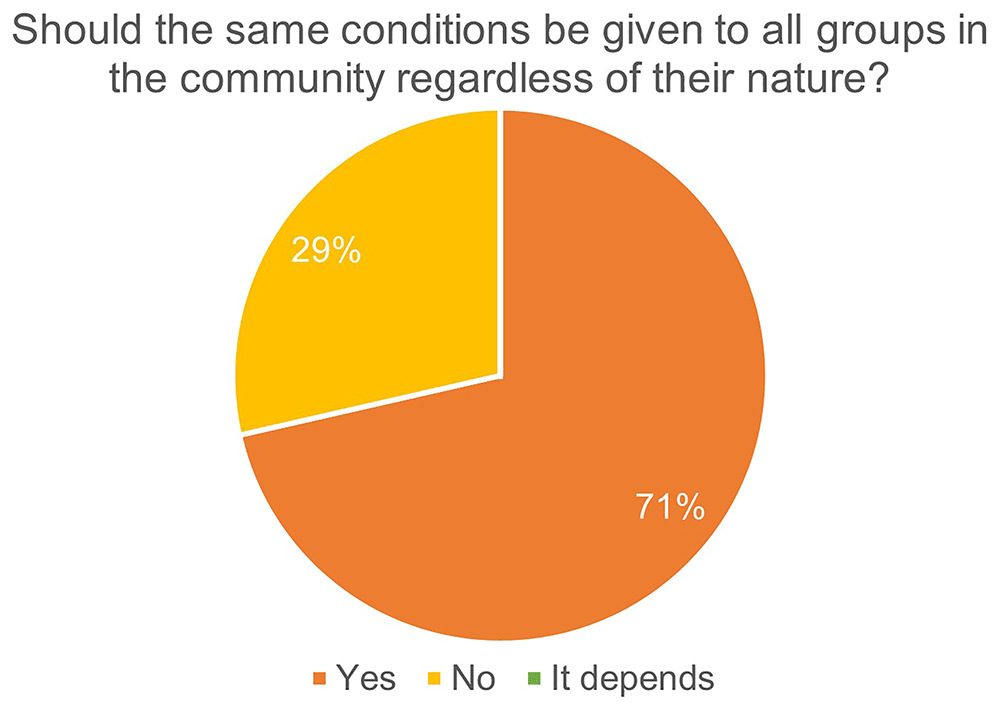
Figure 19. Perceptions on optimal and realistic charging time for EV.
The frequency preferred for information about the energy consumption in the Las Cabezas pilot was that of a monthly period by 86% of responses. Nobody chose the six months or yearly option and 14% expressed their preference for another frequency. In the case of the revision of the internal agreements the preferred length was the yearly one (71%) while the remaining 29% choose a six-month review option as seen in Figure 20.
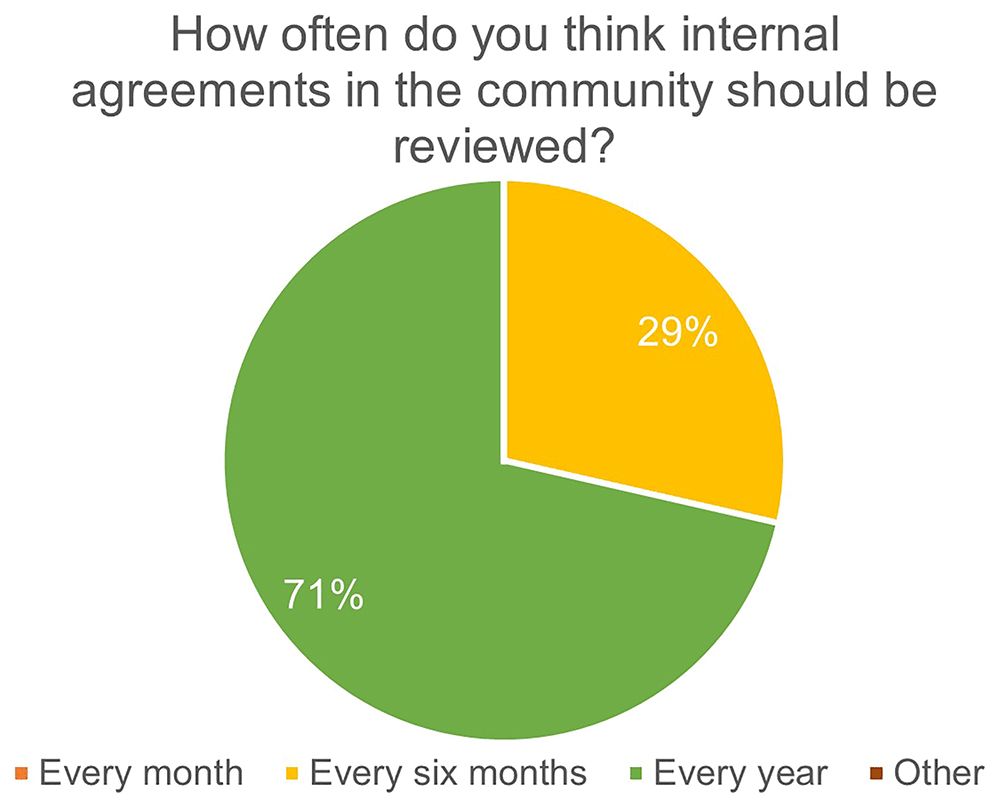
Figure 20. Workshop at CEC Las Cabezas on July 27, 2023.
Local energy community. Most respondents identified themselves as consumers in the energy community (57%) while the remaining percentage thought of themselves as prosumers (43%). When asked about their confidence in becoming part of the community there were no negative answers but almost half of them agreed with having some doubts (43%) while the rest (57%) were very confident about that option (Figure 21
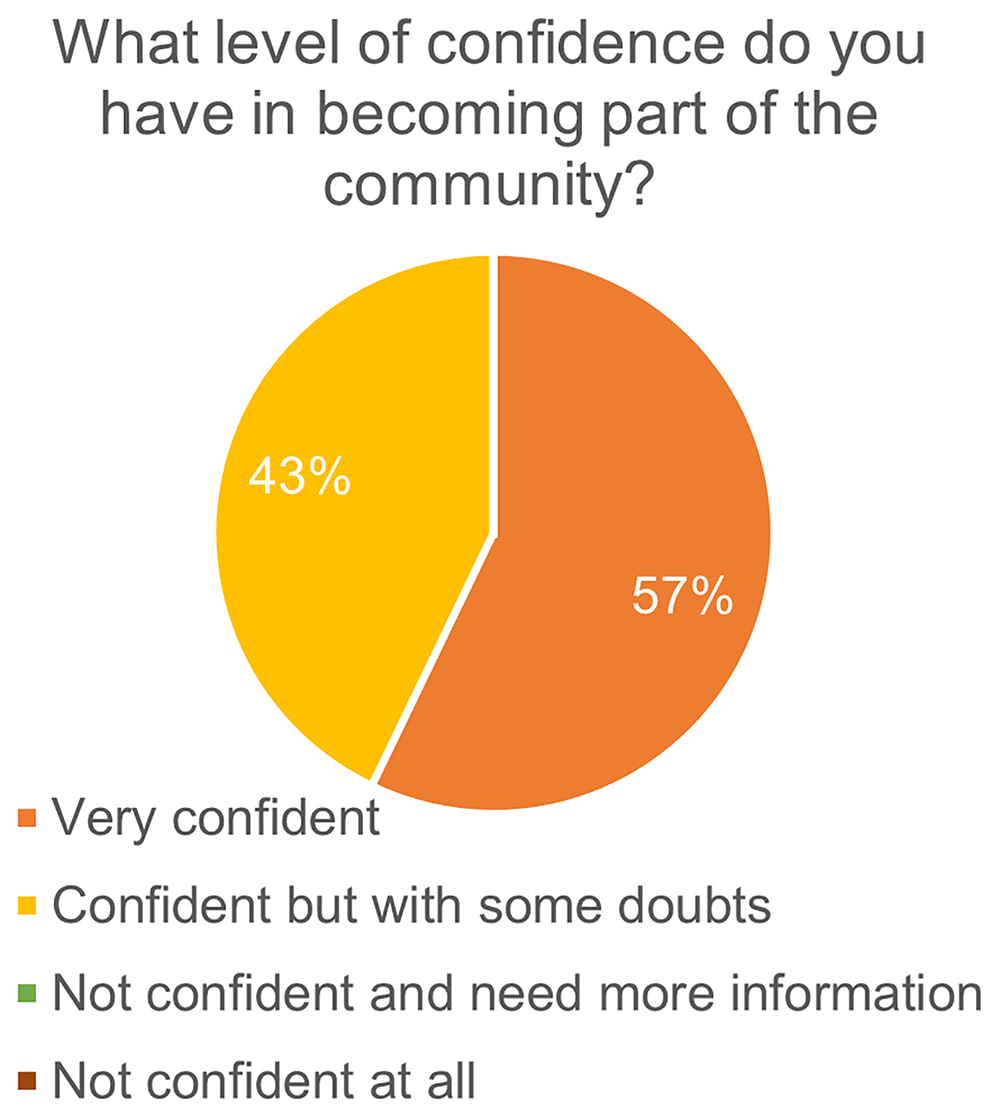
Figure 21. Confidence in becoming part of an energy community copia.
EV charging stations. The different experiences people have with EVs and their location was then explored. The majority of people from Las Cabezas do not have direct contact with EV chargers although they know more or less how it works (83%), less than a fifth of them do not have any knowledge about it (17%) and nobody is an EV charger user there (Figure 22). The knowledge or lack of it about the location of the EV charger was another explored issue. More than half (57%) of the sample didn’t know where the EV charge is and the rest either expressed that it was far away from their workplace (29%) or it was in a location that was of difficult access (14%) as can be seen from Figure 22.
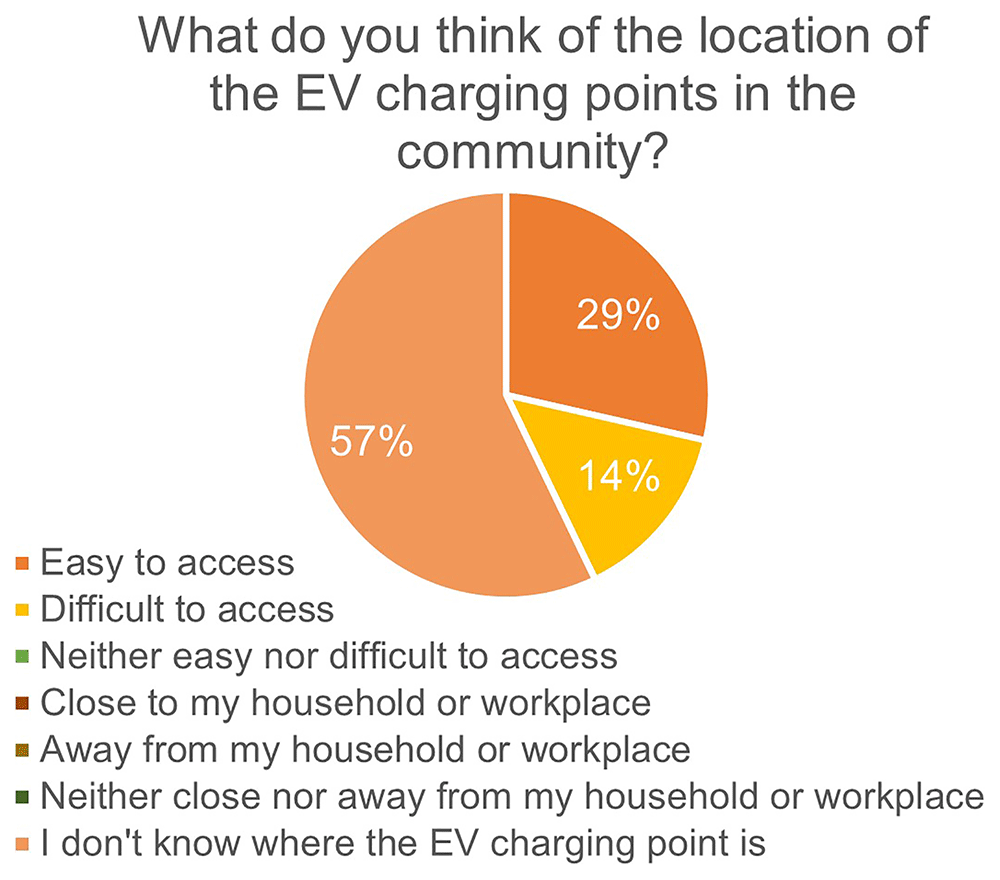
Figure 22. EV charger opinion about the EV charger location in Las Cabezas copia.
When asked if they think there should be different prices for the people who are part of the community and people who are out of it the answers were split exactly in between those that agreed and those who didn’t in equal numbers. Participants have different views regarding what they consider to be an optimal realistic time for recharging. Both 30 minutes and 2 hours were considered by 17% of respondents as an optimal time, while one hour and “Other” were preferred by a third of the respondents each (Figure 23).
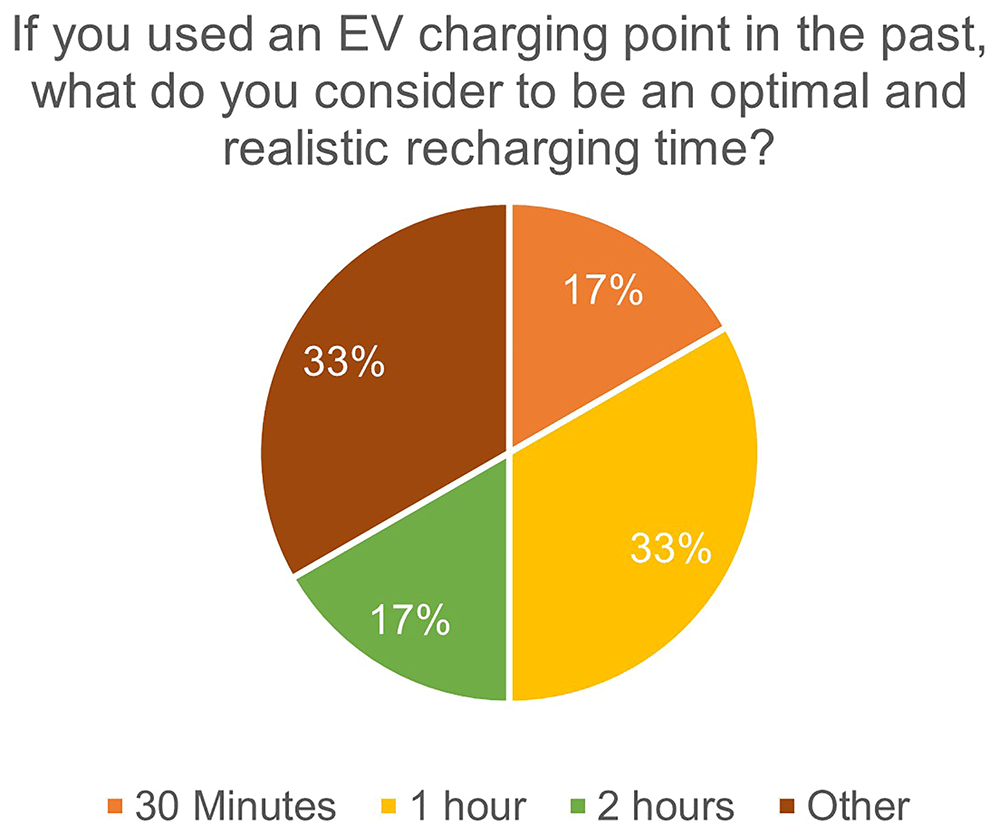
Figure 23. Perceptions on optimal and realistic charging time for EV copia.
The fact that almost three quarter of the interviewed in Las Cabezas were willing to change their energy habits even though this might affect their comfort indicates a commitment to the energy community. There was a wide variety of choices for the consumption measurement frequency that comes to show consumers and prosumers have different priorities and they should be catered for.
In the case of Las Cabezas, the different circumstances that apply to the groups that conform the energy community were not taken into consideration. It seems the perception of the energy community's treatment of users is plain with no room for variations. It is as if the different possible members or components of the energy community are perceived as equal by the majority of respondents.
The standard frequency for energy consumption in many countries is monthly (that also applies to Spain where Las Cabezas is located) and thus it seems that the fact that more than four fifths of the respondents preferred that frequency points at a continuation on the standard information procedure. The results from the inquiry on the EV charger only highlight the fact that most residents still do not need an EV charger most probably because they don’t have an electric vehicle. However, this situation can change in the future.
Results from the workshop. This workshop, held at the CEC Las Cabezas in July 2023, was facilitated by pilot leaders (with previous support from NEON partners) to an audience composed of some respondents whose answers were analysed above and representatives of other stakeholders who are part of this industrial park.
Discussions revolved around clarifying key concepts such as energy community and prosumer, and on the following topics (in no specific order): changes in energy habits and comfort conditions; energy consumption measurement intervals and energy distribution types; EV charging points, their quantity and charging time; energy community roles and implications (producer, consumer and prosumer); among others.
Particular attention was paid to the drivers for joining an energy community, especially the economic incentives that were mainly related to economic savings, and the virtual bag model for sharing energy (and achieving economic savings) that Las Cabezas is proposing and seeking to test. Potential users main concerns revolve around the economic side of the local energy community (economic savings, potential income). As a result, this workshop was an opportunity to further disseminate the NEON project and this CEC; and the main interests, concerns, and remaining doubts of its participants are being taken into account by pilot leaders for the drafting of Las Cabezas’ energy-sharing agreement.
3.3 Results from stains city
At Stains City, the user experience was evaluated through structured interviews about the creation and satisfaction with this energy community as well as the operation and effects of its PV installation. These interviews were implemented a few weeks after the formal creation and start of operations of this CEC. The interviewees were three key informants highly involved in the development of this energy community (two male and one female), who hold managerial positions in the two buildings that make up this energy community, which are Industreet, where the PV installation is located, and the Crigen (Engie) building.
As for the creation and operation of this CEC, it has been experienced from neutral (neither easy nor difficult) to very difficult, with identified difficulties mainly related to the complexity and costs of administrative processes; technical issues: “too difficult to adapt equipment to exchanges”; and "very long delays due to the connection to the grid for electricity injection”. However, the levels of satisfaction with this energy community range from neutral (neither satisfied nor dissatisfied) to satisfied.
Concerning the collective self-consumption from the PV installation of this CEC, at the time of these interviews, between 2 and 3 micro power outages had occurred with very low effects on the comfort of end-users. Regarding energy bills and changes in energy habits, the answers differ depending on the building in question.
In the Industreet building, they have seen significant changes in their energy bills and have taken several centralised actions to reduce energy consumption, such as "decrease of the temperature setpoint to 19°C; stop and modification of air handling units according to the activity and occupation in the building; blocking the access to setpoint modifications in chilled spaces; and decrease of the tolerance for modification (decrease or increase) of setpoints on the thermostats”.
In the Crigen building, at the time of these interviews, they have not seen any changes in their energy bills and expect a reduction in them. They have not taken any actions to reduce the building's energy consumption and/or change the energy behaviour of building occupants, this goes in line with previous studies showing lack of action (Brounen et al., 2013). Finally, the levels of satisfaction with this service also vary from neutral (neither satisfied nor dissatisfied) to satisfied.
3.4 Deviations
During the development of the research, the following three main deviations were identified, the management of which implied some changes in the design and implementation of the UX evaluation, considering also that it was more a perception of how participants would relate to the proposed solution in the future rather than actually interacting with all the installations and devices: Some key project services were not yet operational (mainly the setup of the energy community in Berchidda, and the Virtual bag model and its agreement in Las Cabezas), mostly because of legal and administrative barriers (among others). Due to this situation, in these cases, questions regarding the UX evaluation questionnaire were formulated to reveal potential end-users' expectations instead of real-life experiences, thus informing the recommendations addressed in the previous section and in the next section “Conclusions and recommendations”.
A partner left the consortium in September 2023 and affected greatly the implementation of this research task in Domaine de la Source. This partner was only able to participate up until the design of the standardised (not tailored nor translated) UX evaluation questionnaire for the CEC Domaine de la Source, which was not implemented, hence no evaluation could be carried out in this CEC.
On a similar note, the entity responsible for the CEC Berchidda changed; a change that involved a delay in the final steps of the design and in the implementation of the UX evaluation in this CEC, which was finally executed in month M27.
4 Conclusions and recommendations
From a methodological point of view, it should be noted that the self-perception or self-declaration of the participants in this evaluation must be contrasted with the actual consumption and installation data. It must also be clear that most questionnaires were answered by potential users, those who have not actually used the system, and therefore their responses are based on the knowledge, experience and perceptions they have about energy communities, PV panels, demand response, and other technologies. Some of them have little or no direct experience with these technologies (this applies especially to the EV chargers) as seen in Table 1.
Table 1. Sections of the UX evaluation questionnaire per CEC.
| Sections/CECs | Berchidda | Las
Cabezas | Domaine
de la
Source | Stains
City |
|---|
Collective self-
consumption
from PV
installations | | | | |
Heat pump
systems | | N/A | N/A | N/A |
EV charging
points | | | N/A | N/A |
Local energy
communities | | | | |
Further questions need to be explored. For instance, although the questionnaires included open questions to allow respondents to elaborate on any of their answers, none of the respondents explained why they would not use the charging points again? Also, is worth mentioning that self-reported surveys can be biased due to social compliance, personal and other factors. However, this is qualitative information that is useful and allows the recommendations to be drawn. Another issue is the number of interviewees, as it is a small number (see Table 2) and thus statistical analysis had to be constrained to descriptive statistics and no inferential statistics. Nevertheless, we can still gain insight into the issues addressed during the questionnaires and interviews. Based on the results of the evaluation the following recommendations were made for the participating energy communities:
Table 2. Implementation details of the UX evaluation per CEC.
| CECs/Details | Number of respondents/
interviewees | Months of
implementation |
|---|
| Berchidda | 16 | M27 |
| Las Cabezas | 7 | M22 |
| Stains City | 3 | M23 |
CEC Las Cabezas could benefit from engaging the City Council of Villacañas. In sister projects on energy communities, such as the H2020 projects Lightness, REACT and LocalRES, the involvement of local authorities has increased citizens’ confidence in the project as well as its reach, as these local authorities can contribute to engaging a greater diversity of local stakeholders (Guetlein & Schleich, 2023; Sainz Salces, 2023), including those who tend to be difficult to reach when addressing energy and climate issues (people and families in a situation of energy vulnerability, women, youth and the elderly, migrants, etc) (Campos et al., 2020). All this can help to fully realise the environmental and social advantages and objectives of this CEC. As reported from the REACT project, once residents are better informed about energy communities locals are interested in joining an energy community. Also, it is recommended some short of guidance on how the set up a community considering special needs and local policy circumstances as expressed in recent research (Barney et al., 2023; De Lotto et al., 2022; Lukkarinen et al., 2023).
For its part, CEC Stains City could consider engaging employees beyond the managers already involved, so that these employees become aware that they are part of an energy community -thus disseminating this decentralised model of organisation for a zero-kilometre clean energy production and exchange- and include them as active agents in the energy efficiency aspects or objectives of this CEC. For instance, promoting that employees improve their energy habits towards energy savings through gamification methods or incentives (like the 50/50 energy-saving method for buildings), which could have a positive spill-over effect on the families and households of these employees, increasing the also positive impacts of this energy community.
As noted by Kardooni et al. (2016) there seem to be places where for economic reasons renewable energy is not commercially viable and thus users are not interested in it. In the case of Domain de la Source a pilot site that left before the end of the project- that seems to be the case: the savings were not consistent with their way of life and the burdens of the installations and technology use seemed not to compensate their efforts. Also like in Malaysia it can be the case that the use of renewable energy is associated with a high level of effort and therefore has a negative attitude towards the use of renewable energy technology.
Engaging a diversity of local stakeholders is a critical challenge, to pave the way towards a clean but also fair energy transition. Through the fieldwork conducted, it is evidenced that most potential end-users of the CECs are men, aged 35 or more years of age, with at least a bachelor’s degree; that is, male adults with high education levels. Therefore, as of now, women, young people, or those with lower levels of education and income, are not as engaged in the CECs. A more intensive communication and engagement work is needed so that these diverse groups also understand the key concepts of energy communities and can benefit from the potential of clean energy, energy and economic savings, and community-led initiatives in the energy transition.
Ethics and consent
Ethical approval was not required. We obtained written informed consent from the people shown in the photo for this publication.








