Introduction
Modern banking is highly dependent on automation at both the software and hardware levels. Automated Teller Machines (ATMs) are integrated into our everyday lives and we are taking them for granted. ATMs are becoming increasingly widespread as banks expand their networks, and because of the higher number of machines and the distance between them, managing and supplying them becomes increasingly costly. The demand for constant maintenance and resupply is forcing banks to assume these costs to preserve client satisfaction, which shows little tolerance to ATM denials of service.
Owing to the vastness of modern day ATM networks, the generated monitoring data are becoming so large and complex that human employees have difficulty making real-time decisions and judgment calls about maintenance and supply tasks. This is an issue that can be tackled using machine learning and deep learning by training a set of models that can predict the maintenance or resupply need of ATMs. This predictive mechanism has a dual mission: it needs to balance its predictions between ensuring high availability and minimizing the cash tied to the ATMs, since these cash resources are withheld by the machines and unusable by the banks as long as they remain in them.
The solution presented in our work examines a set of classical machine learning algorithms and a set of configurations for a deep learning algorithm. The models created using all these algorithms were compared based on their accuracy and stability to identify the best configuration that solves the problem of predicting the optimal time of resupply for each ATM in our dataset. The results show that classical machine learning algorithms are powerful, managing to solve the problem with high accuracy. Deep learning also shows some promising results, but with a number of considerations that need to be considered.
The novelty of the proposed solution is its holistic approach, which tackles the ATM supply issue at multiple levels, thus enabling multiple optimization methods. The first level, provided by the prediction models, identifies the optimal supply schedule based on the demand and available supply of each machine. The results of the prediction models are then used by a multi-objective optimization algorithm, creating a second level of optimization, allowing the optimal planning of supply routes. To the best of our knowledge, this holistic, multilevel approach has not yet been presented in a unified solution, forming a robust and highly configurable pipeline.
The remainder of this paper is organized as follows. Section ‘Related Work’ presents an overview of the state of the art and related works relevant to the problem presented. Section ‘Datasets’ presents the datasets used during the experimental process as well as a set of statistical and preprocessing tasks performed on the datasets. Section ‘Problem Formulation’ defines the problem tackled by the presented work in a mathematical manner. Section ‘Experimental setup’ provides a detailed description of the implemented platform, its capabilities, limitations, and specifications. Section ‘Results’ presents the results of the experiments and evaluation conducted, and finally, the discussion and future work derived from the evaluation are presented.
Related work
A number of preprocessing and transformation studies that make machine learning models more efficient in training were identified during the literature survey on analyses and prediction models of similar characteristics. Specifically, we observe that the majority of researchers working on forecasting cash availability or demand in ATMs model the problem as a time-series analysis problem1–4. However, some examples analyze data as a series of independent observations using regression techniques5–7.
Classical, or "traditional" as they are commonly referred to in the literature, machine learning algorithms include algorithms that are based either on creating functions or tree structures. The first category describes the relationship between the training features and target variable using a function or equation. The second category addresses the same objective by creating tree structures based on specific branching criteria. In algorithms using mathematical functions, each feature is associated with a coefficient. Subsequently, all features and their coefficients are merged into a single function that uses the feature values as input and outputs the predicted target variable. Algorithms based on tree structures pre-define a set of branching criteria that help split the dataset records into branches. These criteria can be functions, thresholds, or a combination of them. Each leaf of a tree leads to a specific value or range of values after a number of splits and tree levels. This creates a path inside the tree created for each vector, representing a dataset record. This path leads to a leaf that contains the predicted value of the tree.
The Linear Regression (LR) algorithm is one of the most basic and simple algorithms based on functions and is the basis for most of the function-based algorithms presented in this section. The main purpose is to create a linear function consisting of pre-defined training features and a coefficient for each feature. This function aims to predictions pre-defined target variables. LR always produces a straight line that passes as closely as possible to the training data points, traditionally using the least-squares metric to minimize the error. Naturally, because it is a simple algorithm, it is the fastest and lightest, but it does not produce reliable predictions when the target variable does not have a linear relationship with the features8.
The Orthogonal Matching Pursuit (OMP) algorithm is a “greedy” algorithm that is primarily used with sparse data. Its goal is to create a linear function that relates a number of features to the target variable using a set of coefficients applied to the features. In each iteration of the algorithm, one of the features was chosen based on its degree of correlation with the target variable, and a coefficient was chosen using the least-squares technique. This process continues until each feature is assigned an optimal coefficient or the accuracy of the predictions does not improve based on the least-squares metric. This algorithm is quite fast and does not require significant computational power; however, it is vulnerable to non-homogeneous or noisy data9.
The Bayesian Ridge (BR) algorithm is also a linear correlation algorithm that creates a linear function. Unlike OMP, Bayesian Ridge implements Bayesian techniques derived from the domain of statistics. This algorithm assigns a set of randomized initial coefficients to the features using a Gaussian distribution. It then attempts to reduce the error in each iteration through Bayesian techniques, producing a different distribution for the feature coefficients. This algorithm is efficient with datasets that have many features and few samples but require more computational power, and it has difficulty handling data that do not follow common statistical distributions such as the Gaussian distribution10.
The Stochastic Gradient Descent (SGD) regressor is a linear regression algorithm that incorporates the SGD methodology to minimize its error during training. It is a fast and lightweight algorithm, as it does not use the entire dataset for training. Instead, it uses a small subset of data in each iteration. In more detail, it starts with random coefficients for the features and then tests its deviation from the actual target values, called errors, on a small subset of the training data. In each iteration, the coefficients are changed to reduce the error, each time a different subset is tested. It is a fast algorithm that easily finds high-accuracy solutions; however, it is vulnerable to local optima and noisy data11.
Lasso Least Angle Regression (Lasso-LARS) is an algorithm that combines Least Angle Regression (LARS) and Least Absolute Shrinkage and Selection Operator (LASSO). LARS is an algorithm that works similarly to OMP, building a set of features and coefficients in each iteration that affects the target variable and selecting these features and corresponding coefficients one by one. LASSO improves LARS by setting threshold criteria that reject some features and setting their coefficients to 0. This means that Lasso-LARS is a fast algorithm that creates sparse models with few features. The drawback is that datasets with multiple features are required to perform this selection. If the data has few features, important data may be discarded12.
A Decision Tree Regressor (DTR) is an algorithm based on tree structures. As previously mentioned, the goal of these algorithms is to create a tree structure in which each node is a split condition based on the features and their association with the target variable. Each tree leaf had an estimated value for the target variable. In DTR, each split is based on a cost function value, typically the mean squared error (MSE) or mean absolute error (MAE). These trees do not assume a linear relationship between features, nor do they require numeric features, making them effective on heterogeneous training datasets. Their main drawback is that they can easily overfit the training data and may fail to generalize to previously unseen data13.
Deep learning is a branch of machine learning based on multilayer neural networks, with many hidden layers between the input and output. Neural networks are networks composed of artificial neurons, called perceptrons, which decide whether to activate based on a function applied to the input features. If activated, each neuron sends transformed input features to the neurons in the next layer. Thus, a complex network capable of combining multiple functions, coefficients, and threshold values is formed to predict the target variable. These networks, in their simplest form, are called deep neural networks (DNN) and have existed for several decades14; however, they have only recently become widely used owing to advances in available computational power and RAM expansion15. Another achievement that has helped significantly is the introduction of graphics cards (GPUs) in model training, as GPUs can perform parallel tasks much faster than traditional processors, thereby improving training times even with large datasets. Figure 1 shows a graphical representation of this network with two hidden layers. In its traditional form, information flows from left to right (feed-forward network); however, in more modern networks, the flow direction can change.
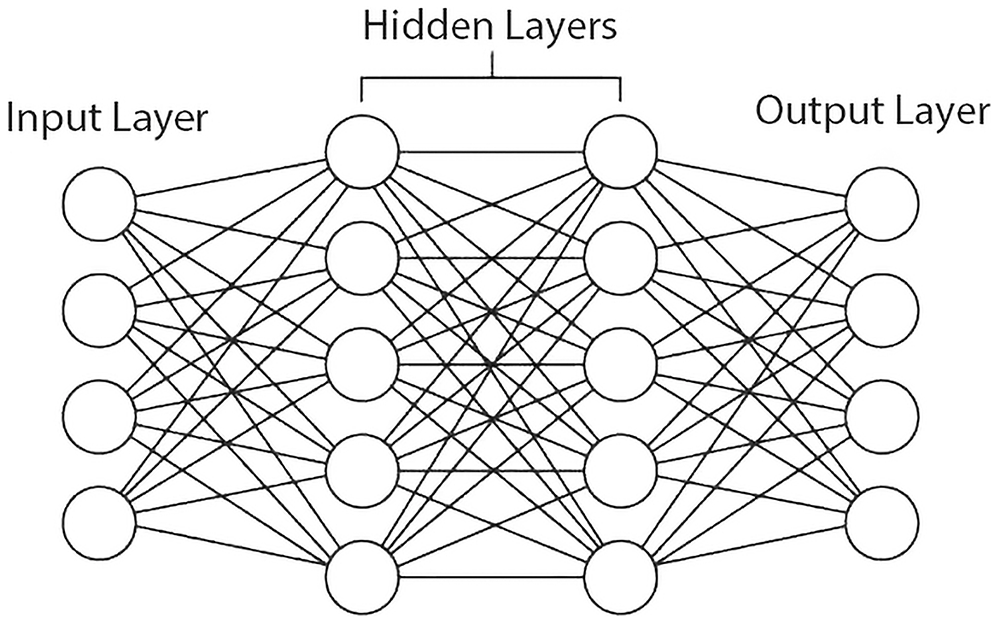
Figure 1. Visualization of a neural network.
A simple neural network is depicted showing a neural network of four layers. The nodes of the network, commonly known as perceptrons, are depicted as circles while the connections between them are depicted as lines connecting the circles. The four layers that comprise the network are the input layer, two hidden layers and the output layer. The input and output layers have four nodes each while the hidden layers have five nodes each, forming a realistic architecture for a neural network used in machine learning tasks.
Recurrent neural networks (RNNs) are an evolution of the classic DNNs. The main difference is that information can flow backward, allowing neurons that are not activated to have a second chance of activation. This capability makes them more efficient with data defined by a specific time sequence, such as time-series data, speech, natural language, or video16. The directed cycles created by the flow of information allow these networks to leverage features from previous time points and learn the cause-and-effect relationships between past feature values. Their drawback is that, because of these cycles, RNNs suffer from the vanishing gradient problem, which leads to some neurons being permanently deactivated owing to the gradual degradation of their function coefficients. To address this issue, a set of improvements to classic RNNs was developed.
One of the most popular RNN improvements is Long Short-Term Memory (LSTM) networks17. Their purpose is to avoid the vanishing gradient problem in classical RNNs, allowing network training with data over a longer time frame and revealing temporal correlations and patterns that are not visible in shorter time windows. This improvement essentially groups the neurons into cells that can learn, forget, and forward information. The ability to learn and selectively forget better regulates the data flow and learning impact within the network, making LSTMs highly effective with complex data patterns. However, LSTMs are more resource-demanding than RNNs, requiring more resources during their training, especially for large datasets. They are also vulnerable to overfitting, often creating models that cannot handle previously unknown data efficiently.
ATM supply has been addressed by a plethora of researchers for multiple years. The classical method of resolving the optimization of ATM supply scheduling is to use linear programming solutions that format the problem as a set of variables, constraints, and an optimization function that attempts to minimize or maximize1. Other researchers have attempted to create predictive models that estimate the optimal time schedules for ATM resupply actions, commonly using machine learning algorithms18. There are even cases that have attempted to optimize the geographical placement of ATMs using multi-objective optimization algorithms19. The novelty of the proposed solution is that none of the relevant works we identified seem to tackle the problem in a holistic approach, creating a unified system that attempts to optimize both the time scheduling of ATM supply actions and the route planning of supply vehicles, taking into consideration both the demand modeling and ATM geographic positions, as well as many other multi-objective optimization variables.
Datasets
The models use a database that pools data belonging to two distinct types: a) ATM supply data and b) ATM fault data. These two types of data were merged into a single database that contained both supply and fault data for each of the ATMs examined. The database contains 40016 records that span the year 2023 and 6123 records for the first two months of 2024. Separation per year is necessary because the data for the year 2023 are used as training data for the models, while the data from the year 2024 are used as test and evaluation data for the validation of the models' performance.
Each distinct record of the database has the following fields:
According to the science of mathematics, a time series is a series of data that are placed in chronological order. In machine learning, this definition is even more limiting, adding the limitation that these data points must have a causality relationship between them, especially data points that are temporal neighbors. Timeseries are classic examples of data used in machine learning training because of the easy and intuitive pattern extraction tied to their nature. Moreover, they make the stationary analysis process easier, revealing whether the data contain a pattern that repeats itself over regular time intervals. These patterns are extremely useful in machine learning model training because they enhance the predictive accuracy of the model. This type of data requires certain preprocessing steps so that they are reshaped into a form usable by machine learning models. In more detail, they need to be cleansed from redundant or erroneous information and analyzed in order to identify features that can be extracted from them, features that are directly related to the prediction target by a causal relation. Moreover, missing data should be handled using data-reconstruction techniques. These preprocessing steps will be analyzed into more detail in section ‘Preprocessing.’
On the other hand, independent data are also comprised of data points that are placed in chronological order, such as the time series, but these data points do not necessarily have strict time intervals between them, have no missing points between them, or even have a strict causality relationship between two temporal neighboring points. Algorithms trained on these datasets do not assume that there is a causal relationship tied to the temporal placement of the data points; instead, they look for patterns that reveal hidden correlations between the extracted features and the current value of the target variable. In other words, the main aim of machine learning algorithms is to create a function that takes as input a vector of feature values and gives a predicted value for the target variable as an output. As a result, these datasets demand a different preprocessing methodology and reformatting prior to the training process of the machine learning algorithms that will be presented in detail in section ‘Preprocessing.’
Statistical analysis
As a first step in evaluating the uniformity of the data per ATM, a histogram was created to visualize the total number of ATM supply records for each machine. A histogram is shown in Figure 2. By studying it, we can see that the vast majority of ATM have less than 80 distinct records, with most ATMs (123 machines) having 31-41 records. Moreover, we can see that only 13 ATMs have more than 130 records. This analysis provides the first outlook of the data, and the thresholds we can set regarding the number of records for a predictive model to be considered adequately trained. As will be presented shortly, the threshold selected during the data cleansing process was 20 records, meaning that most of the ATMs that belong to 1-11 bucket of the histogram will be cleansed out of the useful dataset. Some of the ATMs will be rescued owing to the data filling that will be performed and described in section ‘Preprocessing.’
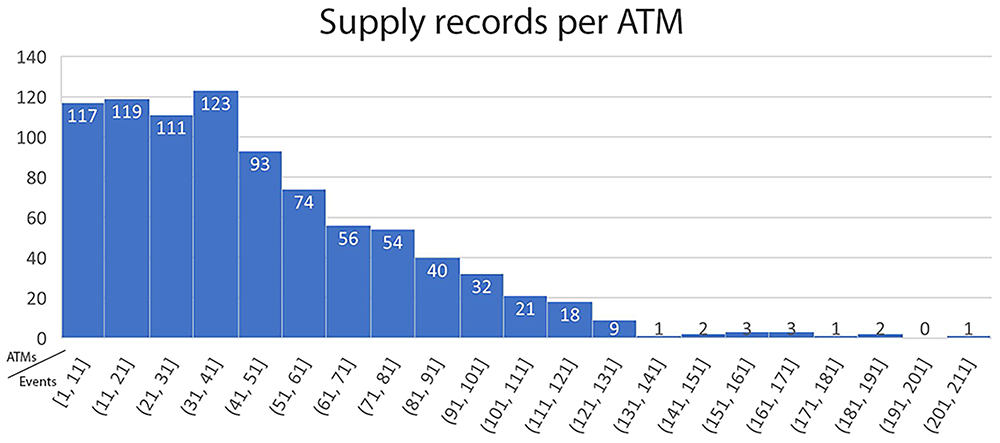
Figure 2. Histogram of supply data records per ATM.
The presented histogram is grouping the supply events in our dataset per ATM and then counts them. The total number of supply events per ATM is then separated into 21 buckets forming a histogram that aims at informing the reader about the distribution of how many training records there are for each ATM. It shows that the vast majority of ATM have less than 80 distinct records, with most ATMs (123 machines) having 31–41 records. Moreover, we can see that only 13 ATMs have more than 130 records. This analysis provides the first outlook of the data, and the thresholds we can set regarding the number of records for a predictive model to be considered adequately trained.
Figure 3 presents a histogram depicting the average distance in days between two neighboring events per ATM. This histogram shows that the vast majority of ATMs are supplied once every 1–4 days, with only 14 machines having an average interval of more than 6 days. This analysis reveals the time interval that the predictive models should target. In most cases, the prediction interval should be set to only one day, that is, the next day. As an extra mile, to cover even more cases, the models should be able to predict the need for supply for up to 3 days in the future.
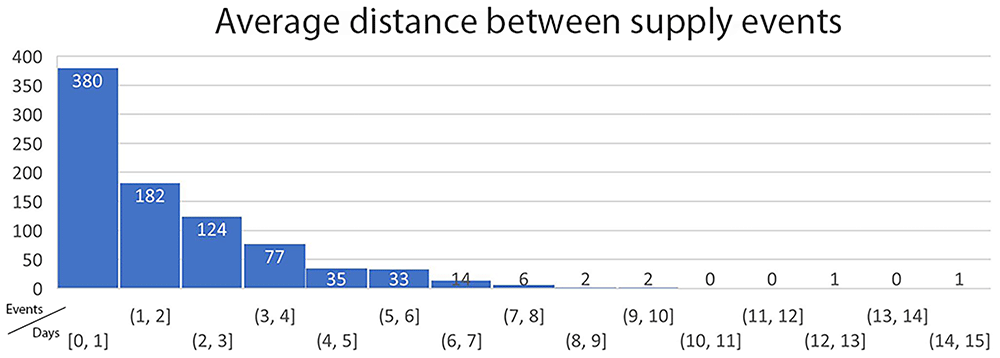
Figure 3. Average time interval between two supply events in days per ATM.
The presented histogram is grouping the supply events in our dataset per ATM and then counts the number of days between two sequential events. The average number of days between supply events per ATM is then separated into 15 buckets forming a histogram that aims at informing the reader about the distribution of how frequently the ATMs are being re-supplied. It shows that the vast majority of ATMs are supplied once every 1–4 days, with only 14 machines having an average interval of more than 6 days. This analysis reveals the time interval that the predictive models should target. In most cases, the prediction interval should be set to only one day, that is, the next day.
Figure 4 presents the last histogram for this analysis, which depicts the maximum time interval between supply events per ATM. The histogram reveals that almost half of the ATMs have a maximum time interval of only one day, meaning that they are supplied each day without exceptions. However, the dataset contains 370 ATMs that are supplied on rare occasions, even once every 24 days, almost once per month. According to the histogram presented in Figure 3 this is not the usual case, even for these machines, but they can still remain without a need for supply for many days under specific circumstances that are to be revealed by machine learning models.
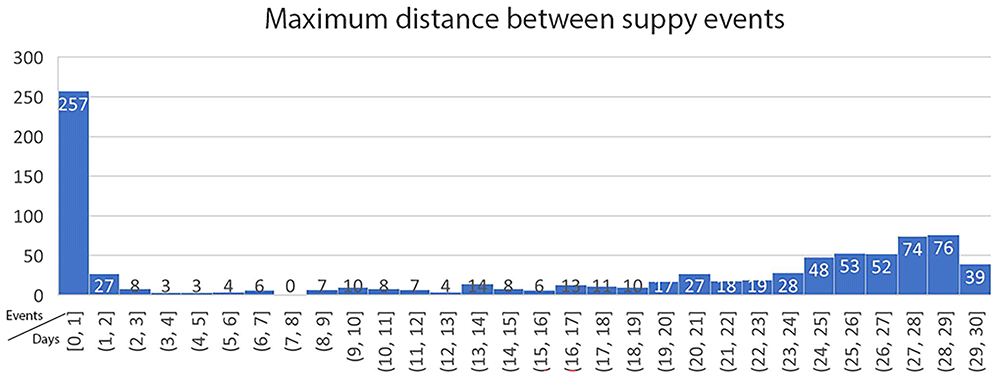
Figure 4. Maximum time interval between supply events in days per ATM.
The presented histogram is grouping the supply events in our dataset per ATM and then counts the number of days between two sequential events. The maximum number of days between supply events per ATM is then separated into 30 buckets forming a histogram that aims at informing the reader about the distribution of how frequently the ATMs are being re-supplied. It shows that almost half of the ATMs have a maximum time interval of only one day, meaning that they are supplied each day without exceptions. However, the dataset contains 370 ATMs that are supplied on rare occasions, even once every 24 days, almost once per month.
Stationary data analysis examines whether the values of the target variable have some form of repetition over time. It is a classic analysis that is executed in problems in this category20–22. The analysis of our target variable, which is the "value-t" variable describing the percentage of filled capacity of an ATM at time "t,” gave an average stationary score of 0,0018. This score means that the time series present a high ratio of stationarity at a weekly level, as it is much smaller than the 0,005 threshold that the literature as the validity threshold of the stationary analysis. This implies that the choice of this specific variable as the prediction target is completely justified, and a machine learning model can be successfully trained on the available data with high confidence rates.
Preprocessing
As the first step of pre-processing, the dataset was cleansed to remove records that were not useful to the models or could even confuse it during the training process. Two distinct categories of records were identified in this dataset.
Records that do not have sufficient widths. These include records of an ATM that fails to cover at least 70% of the year in the time interval between the first and last supply events.
Records that did not have sufficient volume. These include ATM records with fewer than 50 distinct records in the dataset.
Of the 863 ATMs in the complete dataset, 202 did not have more than 20 records, and were therefore considered unusable by the models. Of the 661 ATMs that remained, 18 did not cover 70% of the year between their first and last records, so they were also considered unusable, leaving 643 machines. The test data provided by the use-case owner covers the first two months of 2024 and includes records for only 24 of these 643. Thus, 24 different models were trained and evaluated, one for each ATM remaining in the dataset.
The next step was to enrich the records with external or secondary-derived data, creating more columns. These extra columns are used during the training of the models to uncover hidden patterns that affect the usage demand of ATMs. The columns created were as follows:
Day of the week: Monday up to Sunday.
Workday: true or false.
Holiday: true or false.
Capacity difference from previous day: real number from -1.0 to 1.0.
Days to next supply: natural number.
The next step of preprocessing is the transformation of the data in a time series format so that they can be used by the prediction model. Time series data, or just time series, are datasets that follow strict temporal order. In addition, the values observed in each time step are dependent on the values observed in the previous time steps. In order to transform the dataset into a time series, we just have to order the data points in chronological order, according to the record timestamps, and then fill the missing time steps, creating steady time intervals between the data points. This data-filling process was conducted using a simple linear function, assuming that the percentage of filled capacity of an ATM follows a linear degradation over time. For example, by using function 1, where Ct is the capacity at time step t, and Dt is the day at time step t. If an ATM is observed at 100% capacity on day 1 and then at 25% capacity on day 4, we assume that it has a reduction of (100 – 25)/3 = 25% per day. Therefore, on day 2, it would be at 75%, on day 3 it would be at 50%, and on day 4 it would be at 25%, as observed. This linear imputation method was chosen for two reasons: a) its extremely lightweight nature that allows us to contact a wide set of experiments including the ability to process streaming data in the future and b) the fact that the majority of the ATMs were supplied at extremely regular intervals, most of them daily or bi-daily, so a more complex imputation methodology would make much of a difference, especially due to the fact that our timeseries are recorded on a daily basis.
The last step of preprocessing is the transformation of the dataset into a form that can be used for deep learning training. This transformation creates a set of columns that correlates the data points of the previous time steps with the current value of the prediction target. This means that if the target is to predict the capacity percentage of the ATM for the next day, and we want to only consider the data of the current day, we would have a dataset consisting of the data points presented in Table 1. In detail, the data presented are translated by one day in the past, at time step t-1, while the prediction target, which is the valuet that remains at time step t, contains the capacity value of the next day. During the experimental process presented in the Results’section, this temporal translation was conducted for longer time intervals, up to seven days in the past.
Table 1. Data transformation before the deep learning model training.
| Label | Name | Description |
|---|
| day_of_weekt–1 | Day of the week (t-1) | The day of the week one day before the target time step. |
| day_of_montht–1 | Day of the month (t-1) | The day of the month one day before the target time step. |
| montht–1 | Month (t-1) | The month one day before the target time step. |
| workdayt–1 | Workday (t-1) | True if the day before the target time step is a workday. |
| holidayt–1 | Holiday (t-1) | True if the day before the target time step is a holiday. |
| valuet–1 | ATM capacity (t-1) | Percentage of filled ATM capacity the day before the target time step. |
| changet–1 | ATM capacity change (t-1) | Change of percentage of filled ATM capacity the day before the target time step. |
| lifespant–1 | Days until next supply (t-1) | Days remaining until next supply event the day before the target time step. |
| valuet | ATM capacity (t) | Percentage of filled ATM capacity at the target time step. |
A subset of these columns was selected as training features for the deep learning model based on our experience, practical experiments, and relevant literature. For a column to be selected as a feature, it is necessary to present the following characteristics.
Be balanced, without having unexplained and steep fluctuations.
Being correlated with the target variable means that changes in their value affect the value of the target variable either directly or indirectly.
Do not contain missing or erroneous data.
Be in or can be converted to numerical form.
Being independent between them, meaning that they are not directly correlated, because correlated values can be omitted to simplify the model, they do not offer new information to the model.
With these criteria in mind, the selected variable was valuet and the selected features were as follows:
day_of_weekt–1
day_of_montht–1
montht–1
workdayt–1
holidayt–1
valuet–1
A set of alternative feature tests was also conducted, separating the column day_of_weekt–1 into seven distinct Boolean features according to the relevant literature4, but it did not have any important effects on the evaluation of the models.
Problem formulation
Because the posed problem is complex, involving the prediction of ATM cash availability and the optimization of supply routing, we deem it necessary to clearly define the problem and its parameters in a formal fashion. Let A = {A1,A2, ... , AN} be the set of N ATMs that form an ATM network. Each ATM Ai ∈ A has a cash availability function di(t) which defines its cash availability rate over time.
Moreover, there is a set of supply vehicles V = {V1,V2, ... , VM}, where each vehicle Vj ∈ V has capacity Cj and operates within a pre-defined service window, forming the basis of a Capacitated Vehicle Routing Problem (CVRP). In our case, because we do not have any data regarding the capacity or the number of vehicles for security reasons, the set of supply vehicles can be considered large enough to cover each ATM and their capacity can be considered large enough to carry the maximum capacity of the ATMs for each vehicle. Under these assumptions, the CVRP can be simplified as a multiple Traveling Salesman Problem (mTSP), where each vehicle is a traveling salesman trying to cooperatively visit each ATM in the network.
The challenge posed is to determine the optimal supply plan, achieving three objectives:
Cash shortages are minimized allowing ATMs to serve client requests.
Operational costs are minimized, ensuring minimal costs for the National Bank of Greece during supply actions.
The total idle capital across the ATM network is minimized, thus avoiding excessive cash storage and bank liquidity problems.
Available cash forecasting
To create the available cash prediction model, we must define the di(t) function for each ATM. This function should take the prespecified feature set as an input and provide an estimate of the available cash at time t as an output. A critical cash threshold is defined for each ATM, setting the safety threshold under which cash shortages commonly occur. The function, based on the dataset described in section ‘Datasets,’ should have the following form:
where:
day_of_weekt is the day of the week at time t
day_of_montht is the day of the month at time t
montht is the month at time t
workdayt is 1 if the day at time t is a workday or 0 if not
holidayt is 1 if the day at time t is a holiday or 0 if not
valuet–1 is the value of filled capacity for the ATM at time t-1
ϵit is the prediction error for ATM Ai and time t
f(⬚) is the prediction model function as trained using a selected algorithm
Supply plan optimization
Forming the mTSP definition requires that the ATM network be formally defined as a graph G = (N, E) where N = {0,1, ... , V} is the set of nodes and E is the set of edges that represent roads from one node to another. The set of nodes N contains each ATM that must be supplied at time t and a central node 0, which represents the supply station from where the vehicles load their cash and start their route. An ATM Ai requires supply if and only if di(t) ≤ for time t. Each edge Eij is accompanied by a weight cij that represents the cost of using this path, which is equal to the physical distance of the path. With that in mind, we define a set of variables ∈ {0,1} which becomes 1 if vehicle Vu uses edge Eij and 0 if it does not. It is evident that for each time t, a new graph G is created, representing the state of the network at time t.
Optimizing the supply plan requires the definition of three functions that form the multi-objective optimization goal. These functions are defined as follows:
Minimization of operation costs:
Minimization of cash shortages:
Minimization of idle capital:
The functions 3, 4 and 5 are subject to the following constraints:
Each ATM is visited exactly once:
Each vehicle starts at the supply station:
Forcing single continuous routes for each vehicle, where ui is the position of ATM Ai in route
Gathering these objective functions, we can create a multi-objective optimization function as follows:
where aA, aB, aC are the weights assigned to each objective function, representing the importance of the function to the multi-objective optimization problem.
Experimental setup
The implementation of these models is quite complex because of the multiple data format options and algorithms forming the exploration space. Thus, it was decided to design and implement a system of three distinct components that are interconnected and assist in the process of data extraction, storage, analysis, and preprocessing, as well as in the configuration, training, and evaluation of classical machine learning models based on regression and mathematical models, but also in the configuration, training, and evaluation of machine learning models based on deep learning techniques. The high-level architecture of the proposed system is shown in Figure 5. The system consists of the following components.
Data Manager: component responsible for data extraction, storage, analysis, and preprocessing.
Machine Learning: the component responsible for the configuration, training, and evaluation of classical machine-learning models.
Deep Learning: the component responsible for the configuration, training, and evaluation of deep learning models.
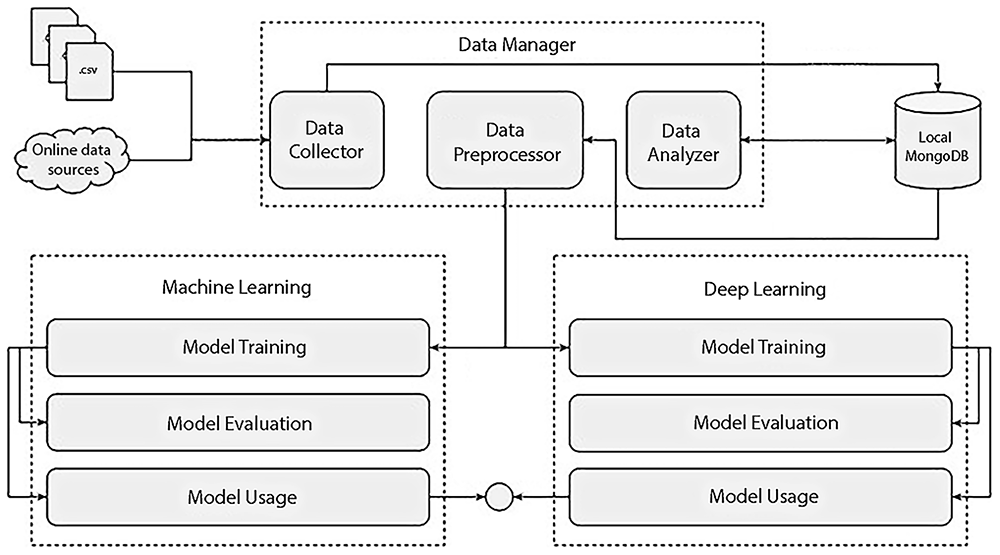
Figure 5. High level architecture of the proposed machine learning and data management system.
The figure depicts the high level architecture of the prediction models of the proposed solution, separating the prediction platform into three parts: a) Data Manager, b) Machine Learning and c) Deep Learning. Data Manager contains three sub-components: the Data Collector, the Data Preprocessor and the Data Analyzer. The Data Collector is connected to outside data sources like csv files and online data sources, reads the data and stores them into the local MongoDB instance. The Data Preprocessor is retrieving the data from the local MongoDB instance, pre-processes them and sends them to the Machine Learning and Deep Learning parts. The Data Analyzer is reading the data from the Local MongoDB and performs statistical analysis on them. Both the Machine Learning and Deep Learning parts have a pipeline consisting of three steps: Model Training, Model Evaluation and Model Usage, with the pre-processed data being fed to the Model Training sub-component, the results being fed to the Model Evaluation and it’s results in turn to the Model Usage. The Model Usage finally is connected to an external endpoint that enables it to push the results of the predictive models.
Specifically, the Data Manager aims to provide unified management of the entire course of data from data collection to machine learning model training. It also has a number of functions that help to store and analyze the results of the model evaluation. It starts with data collection by receiving data in the format provided by the National Bank of Greece (NBG). During the experiments in the presented work, the data were provided in CSV and EXCEL file formats. These files were read by the Data Manager, transformed into easily manageable data formats, such as Python dictionaries and Pandas DataFrames, and then stored in a local NoSQL database (MongoDB) in JSON format.
Data Manager, in addition to extracting and storing analyzed data, also provides data analysis mechanisms that are able to perform a set of a priori analyses presented in subsection ‘Statistical Analysis. ’ These tools consist of mathematical functions that aim to extract statistical information about the data to assess their quality and determine the necessary preprocessing steps and configuration. Finally, the Data Manager introduces data preprocessing methods utilizing the knowledge provided by the data analysis, as well as the literature, to clean, fill, and transform the data in such a way as to enhance the training of machine learning models. In addition, during the preprocessing phase, some secondary data were produced, which were later selected as features for training the models.
Machine learning implements the next step by providing various classical machine learning algorithms that attempt to create mathematical models and functions that connect the training data points to the respective values of the target variable. The models that have been tested and implemented on this platform are those provided by the Scikit-learn package of Python and are presented in detail in section ‘Related Work. ’ Specifically, the Machine Learning platform provides models created using the following algorithms and methodologies:
Orthogonal Matching Pursuit (OMP)
Bayesian Ridge
Stochastic Gradient Descent (SGD) Regressor
Lasso Least Angle Regression (Lasso-LARS)
Linear Regression
Decision Tree Regressor
To train one of these algorithms, creating the prediction model, we need to use the preprocessed data produced by the Data Manager as input, or training, data, and select the target variable (or column) of the model and the features to be used for training the models. These features constitute a subset of the available columns in the dataset. Feature selection was performed based on the evaluation and after many successive experiments with feature swaps and parameter optimization.
The deep-learning platform is the third and final platform of the proposed system. It implements machine-learning models based on deep learning, creating complex and multilayered networks of artificial neurons. During the experiments conducted in the context of the presented work, the platform implemented the long short-term memory (LSTM) algorithm, which in practice creates a Recurrent Neural Network (RNN), a subcategory of deep learning networks that has proven to be quite efficient in learning time series. As we will see in the Results’section, the evaluation of the model shows promising accuracy and general performance for the generated model.
The prediction target of the model was the percentage of filled capacity per ATM, denoted as f(⬚) in Function 2. By predicting this value, we can accurately calculate the day when the machine will need to be supplied in order to avoid a situation where the ATM does not have enough money to serve the demand, which is the main goal of objective function 4. During the evaluation, the available preprocessed data were grouped by ATM, transferring the prediction problem to the ATM level. This means that the demand forecast for each ATM is now a separate problem, independent of the others, and therefore requires the training of a separate machine learning model.
Results
Classical machine learning models
These 24 models were trained and evaluated six times, one for each algorithm on the exploration list. The results of the evaluation are shown in Figure 6. As the evaluation metric, we selected the Median Absolute Error (MAE), which is mentioned as the most fitting metric for this type of experiment in the relevant literature1,2,6. The most effective algorithms based on MAE were SVC, Random Forest regressor, and Bayesian ridge. In the chart presented in Figure 6, we can see three metrics for each algorithm: a) the minimum MAE, b) the average MAE, and c) the maximum MAE. These metrics provide a good estimation of the prediction error eit which is presented in Function 2.
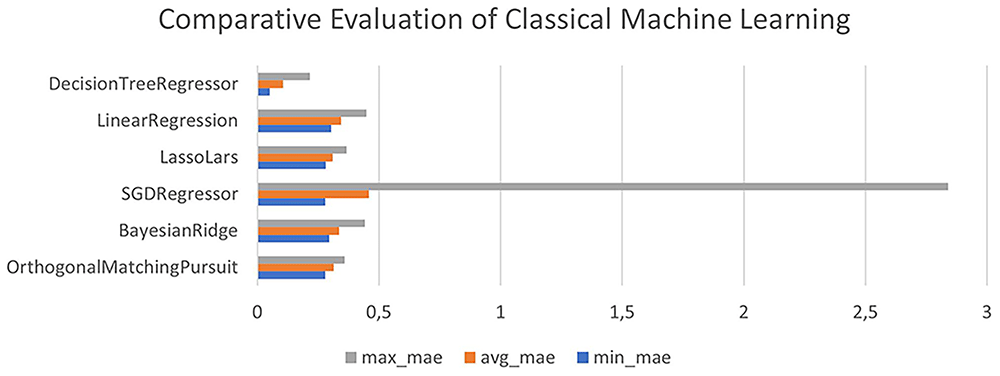
Figure 6. Comparative analysis of classical machine learning model prediction accuracy.
The figure presents a horizontal bar chart that compares three metrics for each of the tested classical machine learning algorithms. In detail, the metrics presented are maximum Median Absolute Error (MAE), average MAE and minimum MAE. The algorithms presented are Decision Tree Regressor, Linear Regression, Lasso Lars, SGD Regressor, Bayesian Ridge Regressor and Orthogonal Matching Pursuit. The results show that the Decision Tree Regressor far outperforms all other algorithms in all of the presented metrics since it has the smallest bars, meaning that it has the smallest median absolute error.
The Decision Tree Regressor minimizes all three metrics compared to the other algorithms, proving it to be the most accurate. Table 2 provides a more detailed description of the MAE values for each algorithm. In addition to the information presented in Figure 6, we can see that Lasso Lars is the most stable algorithm with the minimum standard deviation (STD).
Table 2. Comparative prediction accuracy analysis of classical machine learning models.
| Algorithm | avg_mae | min_mae | max_mae | std |
|---|
| Orthogonal Matching Pursuit | 27,97 | 31,30 | 35,82 | 2,25 |
| Bayesian Ridge | 29,48 | 33,59 | 44,33 | 3,89 |
| SGD Regressor | 27,91 | 45,85 | 283,97 | 49,93 |
| Lasso Lars | 28,12 | 31,07 | 36,76 | 2,21 |
| Linear Regression | 30,39 | 34,47 | 44,92 | 3,88 |
| Decision Tree Regressor | 5,03 | 10,68 | 21,69 | 3,49 |
Deep learning models
The deep learning models used the same dataset of 24 ATMs that was used for the models developed using classical machine learning algorithms. This led to the creation of 24 new models, one for each ATM, using the Long Short Term Memory (LSTM) algorithm. This algorithm allows us to define various time windows that can be considered during the training and inference phases. This ability led to the training of six variations of the algorithm, with time windows of size 1 up to six days in the past, the results of which are presented in Figure 7–Figure 12. The Figures present the evolution of the average MAE through the training epochs or iterations of the model of a random ATM selected for visualization purposes. One epoch or iteration consists of a full round of LSTM training, allowing all neurons of the deep neural network to be trained into the values of the presented dataset. One of the conclusions we can extract from the presented Figures is that as the time windows grow larger, the algorithms become more erratic, presenting many fluctuations in accuracy. For example, Figure 7 shows that the lines are fairly stable, following a convergence course after epoch 80. However, Figure 8 shows that the line has a more "wavy" form, presenting greater instability in its accuracy. This observation has two main applications: a) it shows that predicting the capacity of an ATM for the next day is more stable and accurate than predicting its capacity for the next six days, and b) it shows that having the daily data as input for the next inference is more effective than having data from a wider historical window.
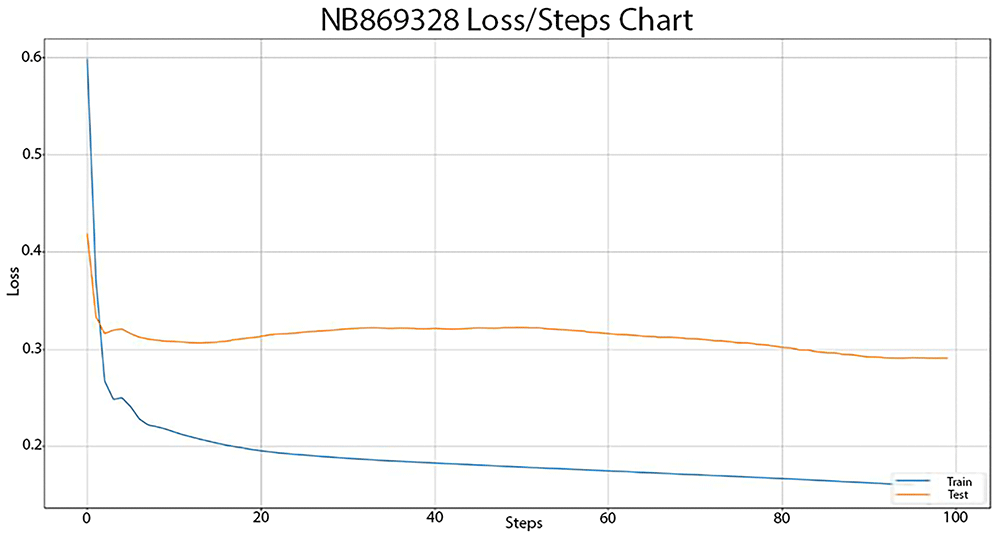
Figure 7. Error cost evaluation during LSTM training with 1 day window.
The line chart presented associates the loss of the prediction model and the steps of its training process. After each step of its training process, the algorithm is evaluated internally, calculating the loss score for this step. The loss score is calculated using the pre-defined loss function of the algorithm that estimates how accurately the algorithm can predict its target. This chart is used to observe how the training of the algorithm progresses, if it manages to learn the patterns of the data and if it is over-trained. The algorithm was trained using 1-day window of data, meaning that the input of the training only considered the data regarding the previous day of the day we requested it to predict. The lines show that the algorithm is steadily learning from the dataset without reaching the over-training threshold, meaning that it requires more data to be efficiently trained.
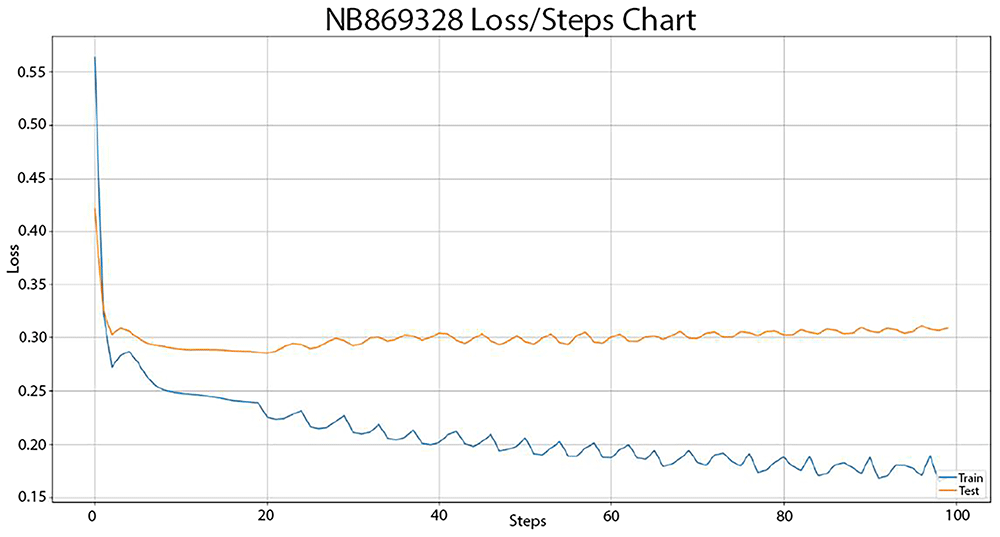
Figure 8. Error cost evaluation during LSTM training with 2 day window.
The line chart presented associates the loss of the prediction model and the steps of its training process. After each step of its training process, the algorithm is evaluated internally, calculating the loss score for this step. The loss score is calculated using the pre-defined loss function of the algorithm that estimates how accurately the algorithm can predict its target. This chart is used to observe how the training of the algorithm progresses, if it manages to learn the patterns of the data and if it is over-trained. The algorithm was trained using 2-day window of data, meaning that the input of the training only considered the data regarding the previous 2 days of the day we requested it to predict. The lines show that the algorithm is learning from the dataset in a somewhat erratic fashion, having many fluctuations in its loss score, without reaching the over-training threshold, meaning that it requires more data to be efficiently trained.
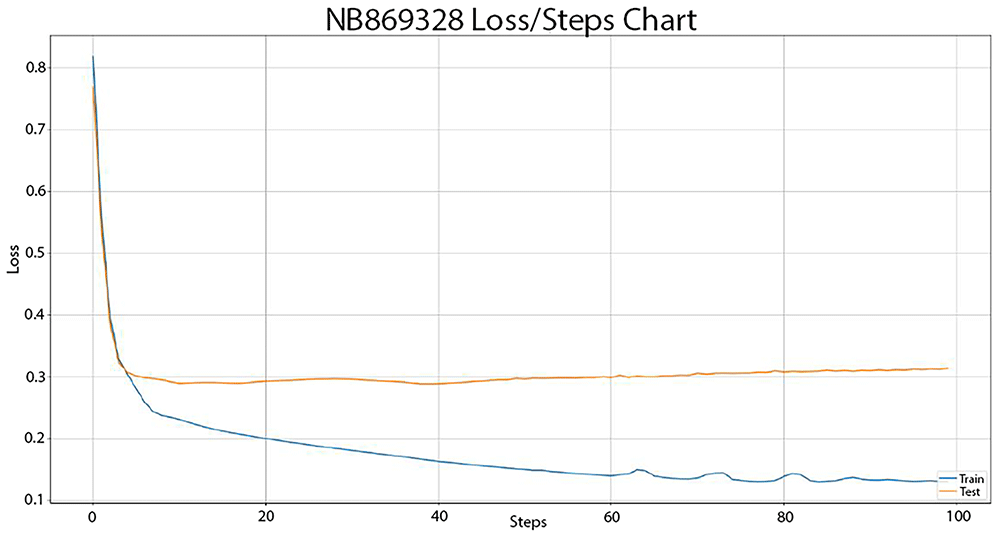
Figure 9. Error cost evaluation during LSTM training with 3 day window.
The line chart presented associates the loss of the prediction model and the steps of its training process. After each step of its training process, the algorithm is evaluated internally, calculating the loss score for this step. The loss score is calculated using the pre-defined loss function of the algorithm that estimates how accurately the algorithm can predict its target. This chart is used to observe how the training of the algorithm progresses, if it manages to learn the patterns of the data and if it is over-trained. The algorithm was trained using 3-day window of data, meaning that the input of the training only considered the data regarding the previous 3 days of the day we requested it to predict. The lines show that the algorithm is steadily learning from the dataset without reaching the over-training threshold, meaning that it requires more data to be efficiently trained.
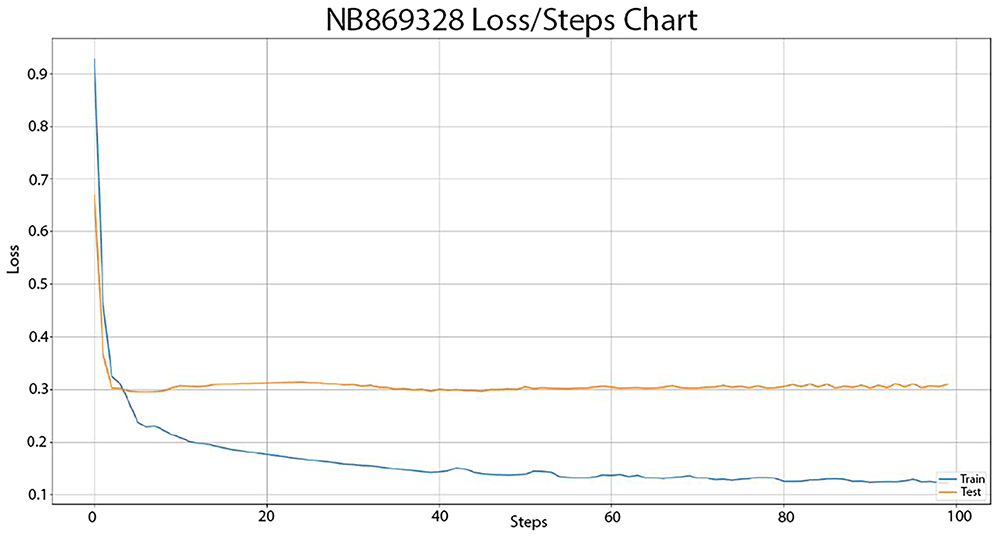
Figure 10. Error cost evaluation during LSTM training with 4 day window.
The line chart presented associates the loss of the prediction model and the steps of its training process. After each step of its training process, the algorithm is evaluated internally, calculating the loss score for this step. The loss score is calculated using the pre-defined loss function of the algorithm that estimates how accurately the algorithm can predict its target. This chart is used to observe how the training of the algorithm progresses, if it manages to learn the patterns of the data and if it is over-trained. The algorithm was trained using 4-day window of data, meaning that the input of the training only considered the data regarding the previous 4 days of the day we requested it to predict. The lines show that the algorithm is steadily learning from the dataset without reaching the over-training threshold, meaning that it requires more data to be efficiently trained. We also have to note that after step 70 the algorithm begins to show fluctuations in its loss score, showing a more erratic behavior.
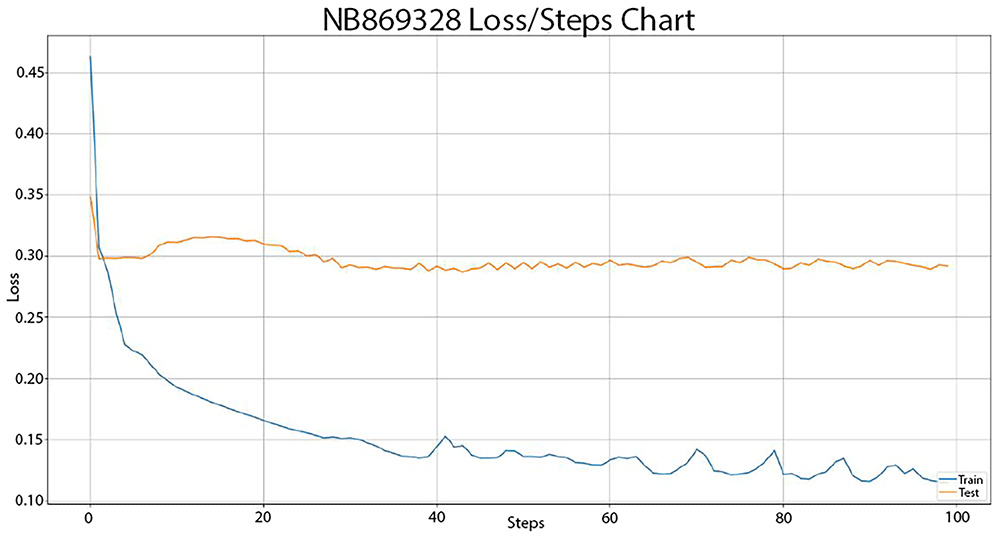
Figure 11. Error cost evaluation during LSTM training with 5 day window.
The line chart presented associates the loss of the prediction model and the steps of its training process. After each step of its training process, the algorithm is evaluated internally, calculating the loss score for this step. The loss score is calculated using the pre-defined loss function of the algorithm that estimates how accurately the algorithm can predict its target. This chart is used to observe how the training of the algorithm progresses, if it manages to learn the patterns of the data and if it is over-trained. The algorithm was trained using 5-day window of data, meaning that the input of the training only considered the data regarding the previous 5 days of the day we requested it to predict. The lines show that the algorithm is learning from the dataset in a heavily erratic fashion, having many fluctuations in its loss score, without reaching the over-training threshold, meaning that it requires more data to be efficiently trained.
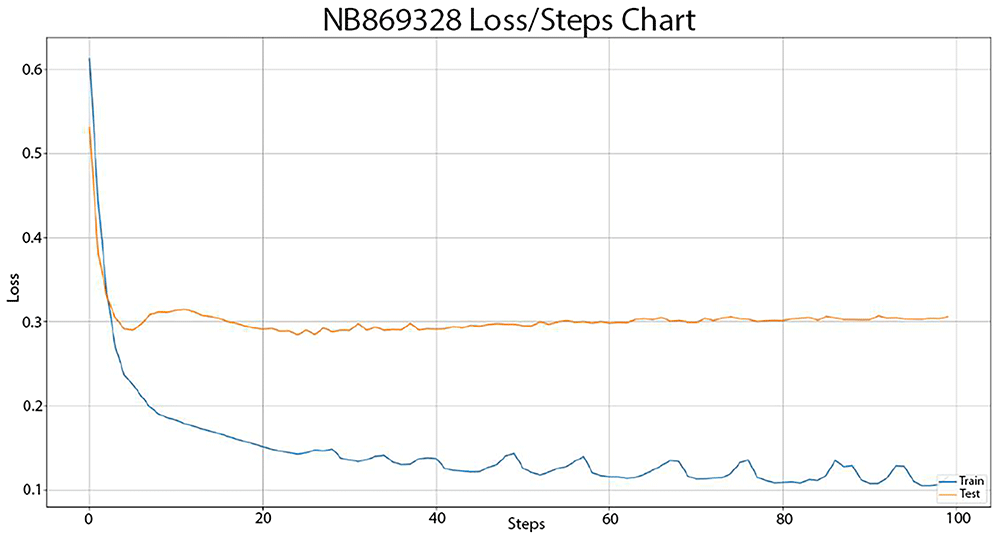
Figure 12. Error cost evaluation during LSTM training with 6 day window.
The line chart presented associates the loss of the prediction model and the steps of its training process. After each step of its training process, the algorithm is evaluated internally, calculating the loss score for this step. The loss score is calculated using the pre-defined loss function of the algorithm that estimates how accurately the algorithm can predict its target. This chart is used to observe how the training of the algorithm progresses, if it manages to learn the patterns of the data and if it is over-trained. The algorithm was trained using 6-day window of data, meaning that the input of the training only considered the data regarding the previous 6 days of the day we requested it to predict. The lines show that the algorithm is learning from the dataset in a somewhat erratic fashion, having many fluctuations in its loss score, without reaching the over-training threshold, meaning that it requires more data to be efficiently trained.
Table 3 presents a detailed analysis of MAE metrics for each time window. The values were normalized in the range 0–100 for easier comparison. First, as the time window increased, the model became more accurate, reducing the error margin. This is because as the time window grows, the model receives more data, enhancing its opportunities to uncover hidden patterns and learning the causality relationships between the features and the target variable, especially if we consider that the stationary analysis presented in Section ‘Statistical Analysis’ reveals a pattern repetition in weekly intervals. This may appear to conflict with the instability observed in Figure 7–Figure 12 but it does not because the instability we observed is during the training of the model, making it more erratic during training. The accuracy observed here is during evaluation, making it more accurate after the training. The Figures show how sensitive the model is to feature variations, while Table 3 shows the accuracy of its predictions.
Table 3. MAE values comparison for the LSTM models.
| Window size in days | avg_mae | min_mae | max_mae | std |
|---|
| 1 | 35,11 | 29,06 | 48,00 | 5,24 |
| 2 | 31,50 | 27,77 | 41,45 | 3,34 |
| 3 | 30,54 | 26,36 | 44,79 | 3,86 |
| 4 | 29,74 | 24,05 | 38,18 | 3,28 |
| 5 | 30,06 | 23,46 | 38,94 | 3,38 |
| 6 | 29,24 | 23,93 | 35,07 | 2,97 |
Use case evaluation
To evaluate the real-world application of the models, an experiment using the test data was conducted. The scenario of this experiment is that NBG personnel use the models to determine the list of ATMs that need to be supplied the next day. For this test, we used the test and evaluation datasets described in previous sections. The data used spanned the first two months of 2024, with 24 different ATMs. Regarding the model used, we decided to use the most accurate model identified during the tests presented in Subsections ‘Classical Machine Learning Models’ and ‘Deep Learning Models’ of the present section, that is, the Decision Tree Regressor. Figure 13 presents the prediction course for the Decision Tree Regressor during the use case evaluation for reference. The dotted line represents the actual capacity values, whereas the solid line represents the predicted values.
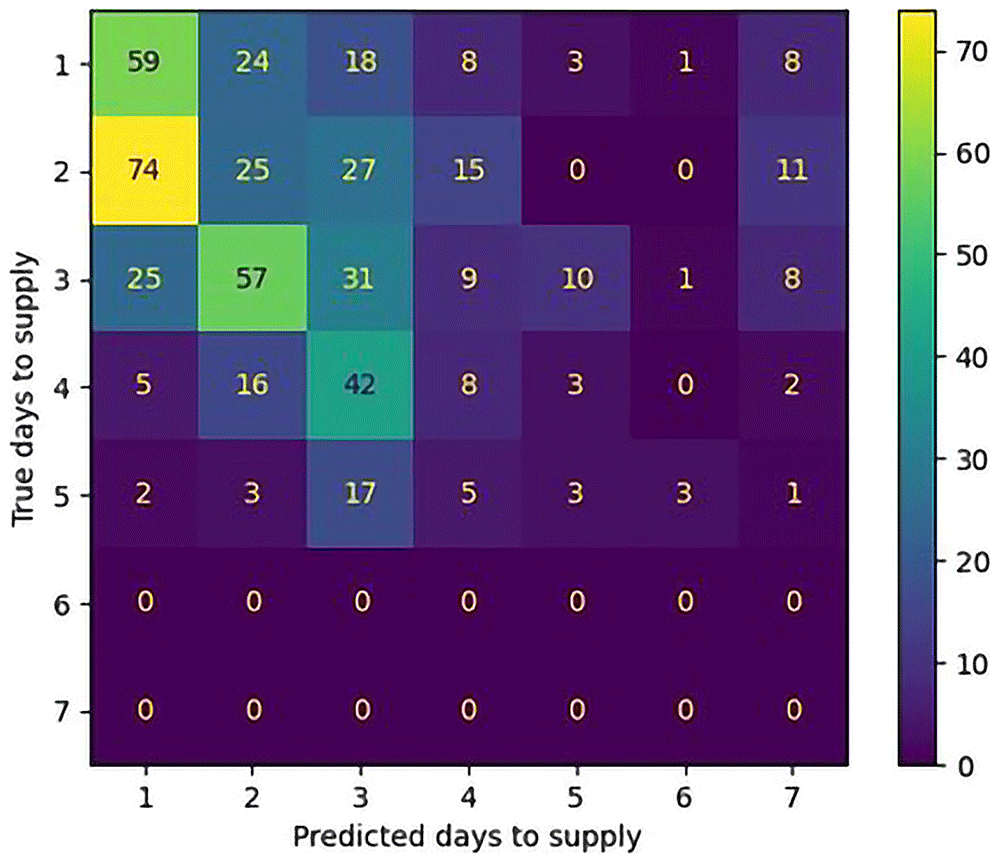
Figure 13. Prediction of percentage capacity per day for Decision Tree Regressor.
The line chart presented correlates two values. On the horizontal axis it shows the dates of the evaluated duration while the vertical axis shows the percentage of ATM capacity from 20% to 100% since it never dropped below 20% capacity. It shows two lines; the blue line represents the predicted capacity while the orange line represents the actual capacity recorded in our database. The comparison of the two lines shows that the model manages to capture the periodical nature of the capacity fluctuations to a good extent, making some limited mistakes.
The results of the evaluation show that there is an average-to-good performance of the model, caused mainly by the small volume of training data, limiting the training effectiveness of the models. leading to the assumption that as the model is used and more historical data are being collected, the accuracy of the model would improve. For success, we define the state that the model accurately predicts that an ATM will need supply the following day, while as a deviation of X days, we define the prediction that an ATM will need supply X days later or sooner than the actual need.
During the evaluation, we observed an accuracy of approximately 49% for the next-day prediction, approximately 20% for 1 day deviations, approximately 15% 2 days deviations and approximately 25% for more than 2 days deviations. These accuracy metrics show that the models created try to preserve the QoS requirements, preferring to make a supply decision sooner than needed at the expense of more frequent supply runs and more idle capital, showing a percentage of 83.59% of predictions that are either on the actual supply day or up to two days sooner than required. Figure 14 shows the confusion matrix of the predictions for the entire evaluation dataset. The vertical column presents the actual number of days until the next supply event, whereas the horizontal column presents the predicted values. The cells of the matrix contain the number of events corresponding to each row and column of the matrix. We can see that the model is biased toward more secure predictions, ensuring that the ATMs have sufficient capacity to serve their clients, often providing 1 or 2 day deviations sooner than the actual supply need. This means that the model achieves the goal of high availability while prioritizing the secondary goal of minimizing the amount of cash stored in the ATM network.
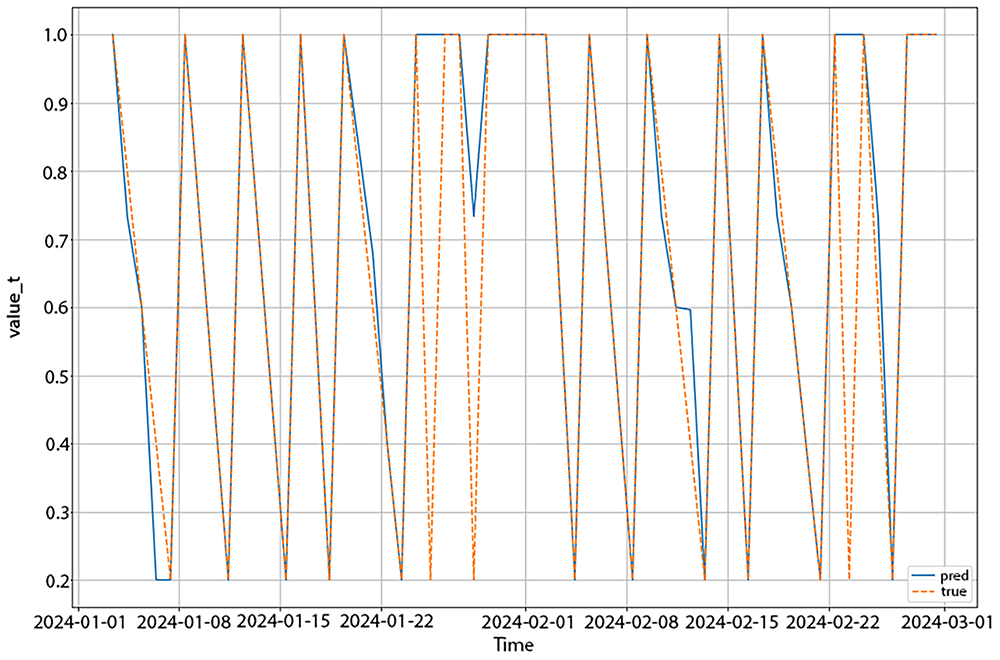
Figure 14. Confusion matrix of use case evaluation for next day predictions.
The two-dimensional table presented shows the actual and predicted day until the next re-supply event. Each cell of the table shows the number of occurrences of the combination of the horizontal and vertical axis of days. The color of the cell forms a heatmap, showing more yellow colors towards higher concentrations and more blue colors towards lower concentrations. The confusion matrix proves that the models used are prioritizing the quality of service, taking a careful approach and choosing to supply ATMs sooner rather than later to limit quality of service violations as much as possible.
In parallel with the analysis of the predictive accuracy of the algorithms, a multi-objective optimization evaluation was executed based on the optimization goals defined in Section ‘Problem Formulation’ and, more specifically, Functions 3,4 and 5. The evaluation was conducted by comparing the values of these functions for the historical data present in our test dataset with the data provided by the predictive and optimization models for each time slot t. The results show that the value of Function 4 (B(t)) was always 0, both in the historical and evaluation data, essentially removing it from the multi-objective function. Figure 15 provides a visualization of the comparison of the values of function 5 (C(t)). We can see that the proposed platform managed to reduce the total amount of idle capital by approximately 42.9% when compared to historical data. Specifically, the average percentage of idle capital capacity per ATM is 16.54% in the historical data, while the cash availability model, using the decision tree regressor, managed to reduce it to 9.44%.
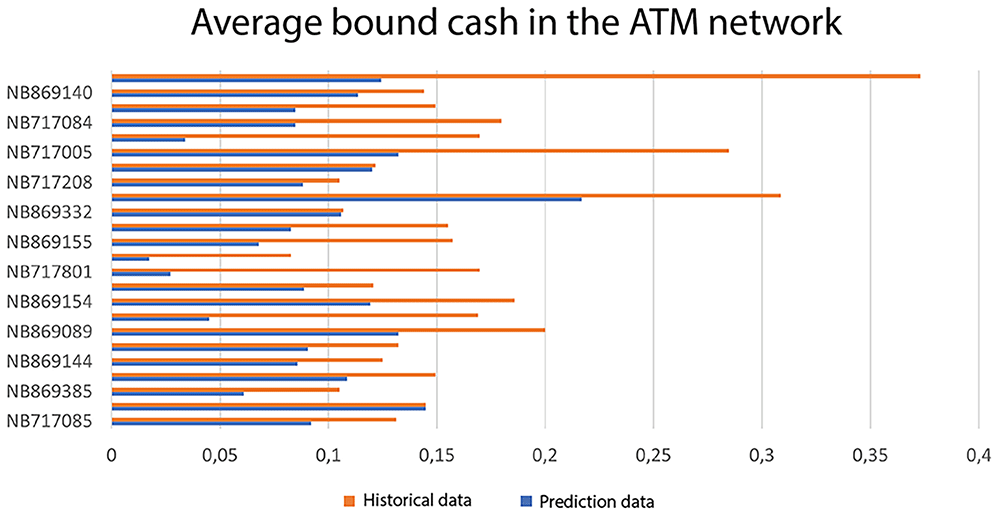
Figure 15. Average idle capital in the ATM network as a percentage of the maximum ATM capacity.
The horizontal bar chart presented showcases 24 ATMs that were evaluated using the actual use case requested by the bank. The bars show a comparison between the predicted and actual idle, or bound, cash that remains “trapped” in the ATMs and is unusable by the bank, incurring additional costs. We can see that the prediction models manage to reduce the bound cash in almost all cases by an impressive amount.
To evaluate the effectiveness of the models in minimizing the operational costs of supply plans, according to Function 3 (A(t)), we measured the maximum percentile of optimal solutions discoverable by each algorithm for each time t. The algorithms used were three common algorithms in multiple traveling salesman problems: ILP, Greedy and Genetic. We observed that the ILP algorithm provided an optimal solution, placing the value of A(t) in the top 0.5% of the possible solution space when the possible solutions were ranked from minimum to maximum based on the value of A(t). For comparison, we also tested the Greedy and Genetic algorithms to provide more lightweight options that allow real-time optimizations in contrast to the slow and resource-demanding optimizations performed by the ILP. The Genetic algorithm achieved scores placed in the top 5% of solutions, while the greedy algorithm achieved scores at 16% of the top solutions.
By combining these scores into multi-objective Function 9, we obtain the scores presented in Table 4, setting all three weights aA, aB and aC to 1 for equal objective priority. The table shows that the combination of the decision tree regressor and the ILP provides the best combination for the platform.
Table 4. Multi-objective scores for each combination of models.
| Optimizer | A(t) | B(t) | C(t) | Combined |
|---|
| ILP | 0.5 | 0 | 9.44 | 9.94 |
| Genetic | 5 | 0 | 9.44 | 14.44 |
| Greedy | 16 | 0 | 9.44 | 25.44 |
Discussion
It is worth mentioning that even though the LSTM model appears to be quite efficient in terms of both prediction accuracy and stability, with small standard deviation scores, it does not outperform some classical machine learning algorithms. Specifically, we observe that the Decision Tree Regressor algorithm is by far the most efficient for this specific dataset, as its average error is approximately six times smaller than that of the LSTM. This may be due to the small number of records that simplify the problem to a simple linear equation, making the LSTM too complex to solve this problem.
If the dataset included several years and additional external factors, perhaps deep learning would provide better solutions, but this is not the case here. This hypothesis, as well as a larger number of possible deep learning technologies, will be examined in the second version of the model, which is planned for future work. These new data points provide greater depth and complexity to the patterns that emerge, bringing the model closer to the real world. This additional complexity is expected to reduce the performance of classic machine learning technologies and increase the performance of deep learning models while considering more complex phenomena and currently unexpected deviations.
Route planning optimization seems to cover the needs of the presented use case, allowing the ATMs scheduled for supply to be efficiently re-supplied, thus minimizing the time and distance that the supply vehicles are required to cover. The main highlight of the evaluation was the significant reduction of idle capital bound in the ATM network by almost 43%, allowing us to expect a significant reduction in the costs of the bank. Moreover, the route optimization algorithms showed that the solutions selected were optimal or near-optimal in all cases, even for lightweight algorithms that can be run in real time.
In future work, we plan to improve this scenario by allowing the capacity prediction models and route optimization algorithms to interact, enabling the route planning algorithms to alter the time schedule of ATM capacity predictors. This will enable further optimization of supply planning because ATMs are expected to be more efficiently grouped, minimizing supply costs with the tradeoff of more idle capital being present in the ATM network or a limited number of cash out events. These trade-offs need to be clearly defined to balance their costs against the cost of supply events. The main method of interaction between the algorithms is envisioned as a pipeline that generates a wide set of "what if" scenarios of delayed or early supply actions on some of the ATMs and performs a cost comparison on the optimal routes of each scenario in order to find the optimal balance, even if some QoS infringements occur, relaxing some of our strict resupply conditions such as the 20% capacity limit.
Ethics and consent
Ethical approval and consent were not required.
Data and software availability
Data availability
The data used in the present work are provided by the National Bank of Greece and deemed confidential because their publication could endanger the day-to-day operations of the bank. A special request and permission are required to access the data, according to the bank’s policies and Greek and European Union legislations. For more information about the process required please contact the contact author for this work, Evangelos Psomakelis (vpsomak@hua.gr)
Faculty Opinions recommendedReferences
- 1.
Ekinci Y, Serban N, Duman E:
Optimal ATM replenishment policies under demand uncertainty.
Oper Res.
2021; 21(2): 999–1029. Publisher Full Text
- 2.
Rafi M, Wahab MT, Khan MB, et al.:
ATM cash prediction using time series approach. In: 2020 3rd International Conference on Computing, Mathematics and Engineering Technologies (iCoMET). IEEE, 2020; 1–6. Publisher Full Text
- 3.
Rafi M, Wahab MT, Khan MB, et al.:
Towards optimal ATM cash replenishment using time series analysis.
J Intell Fuzzy Syst.
2021; 41(6): 5915–5927. Publisher Full Text
- 4.
Sarveswararao V, Ravi V, Vivek Y:
ATM cash demand forecasting in an Indian bank with chaos and hybrid deep learning networks.
Expert Syst Appl.
2023; 211: 118645. Publisher Full Text
- 5.
Tang J, Wang S, Bai T, et al.:
Intelligent ATM replenishment optimization based on hybrid genetic algorithm. In: 2022 24th International Conference on Advanced Communication Technology (ICACT).
2022; 469–475. Publisher Full Text
- 6.
Rajwani A, Syed T, Khan B, et al.:
Regression analysis for ATM cash flow prediction. In: 2017 International Conference on Frontiers of Information Technology (FIT). IEEE, 2017; 212–217. Publisher Full Text
- 7.
Joseph HR:
Combining traditional optimization and modern machine learning: a case in ATM replenishment optimization. In: Progress in Industrial Mathematics at ECMI 2014. G. Russo, V. Capasso, G. Nicosia, and V. Romano, Eds., in Mathematics in Industry. Cham: Springer International Publishing, 2016; 22. : 1047–1055. Publisher Full Text
- 8.
James G, Witten D, Hastie T, et al.:
Linear regression. In: An introduction to statistical learning: with applications in python, Springer, 2023; 69–134. Publisher Full Text
- 9.
Mallat SG, Zhang Z:
Matching pursuits with time-frequency dictionaries.
IEEE Trans Signal Process.
1993; 41(12): 3397–3415. Publisher Full Text
- 10.
Bishop CM, Nasrabadi NM:
Pattern recognition and machine learning. Springer, 2006; 4. . Reference Source
- 11.
Lizhen W, Yifan Z, Gang W, et al.:
A novel short-term load forecasting method based on mini-batch stochastic gradient descent regression model.
Electr Power Syst Res.
2022; 211: 108226. Publisher Full Text
- 12.
Song S, Li S, Zhang T, et al.:
Research on time series characteristics of the gas drainage evaluation index based on lasso regression.
Sci Rep.
2021; 11(1): 20593. PubMed Abstract
| Publisher Full Text
| Free Full Text
- 13.
Rady E, Fawzy H, Fattah AMA:
Time series forecasting using tree based methods.
J Stat Appl Probab.
2021; 10(1): 229–244. Publisher Full Text
- 14.
Hopfield JJ:
Neural networks and physical systems with emergent collective computational abilities.
Proc Natl Acad Sci U S A.
1982; 79(8): 2554–2558. PubMed Abstract
| Publisher Full Text
| Free Full Text
- 15.
Haykin S:
Neural networks: a comprehensive foundation. New York: Macmillan College Publishing, 1994. Reference Source
- 16.
Zhang J, Man KF:
Time series prediction using RNN in multi-dimension embedding phase space. In: SMC’98 Conference Proceedings. 1998 IEEE International Conference on Systems, Man, and Cybernetics (Cat. No. 98CH36218). IEEE, 1998; 1868–1873. Publisher Full Text
- 17.
Gers FA, Schmidhuber J, Cummins F:
Learning to forget: continual prediction with LSTM.
Neural Comput.
2000; 12(10): 2451–2471. PubMed Abstract
| Publisher Full Text
- 18.
Riabykh A, Suleimanov I, Surzhko D, et al.:
ATM cash flow prediction using local and global model approaches in cash management optimization.
Pattern Recognit Image Anal.
2022; 32(4): 803–820. Publisher Full Text
- 19.
Denstad A, Ulsund E, Christiansen M, et al.:
Multi-objective optimization for a strategic ATM network redesign problem.
Ann Oper Res.
2021; 296(1): 7–33. Publisher Full Text
- 20.
Rhif M, Ben Abbes A, Martinez B, et al.:
A deep learning approach for forecasting non-stationary big remote sensing time series.
Arab J Geosci.
2020; 13(22): 1174. Publisher Full Text
- 21.
Dixit A, Jain S:
Effect of stationarity on traditional machine learning models: time series analysis. In: Proceedings of the 2021 Thirteenth International Conference on Contemporary Computing, 2021; 303–308. Publisher Full Text
- 22.
Schnaubelt M:
A comparison of machine learning model validation schemes for non-stationary time series data. FAU Discussion Papers in Economics, 2019. Publisher Full Text







