6.1 Exploratory data analysis
This section shows how topic modelling (see Section 5.1) can be used to extract the main topics from the 89 CEANITA reports and the 549 UKAB reports and how clustering analysis is able to group the LoS events in a meaningful way, in both the sets of data considered.
6.1.1 Topic modelling on CEANITA reports. The application of LDA for topic modelling on CEANITA reports led to the identification of 12 main topics. These 12 topics can be defined by lists of words and bigrams, to which the FARO experts have associated representative labels (see Table 2). The selection of the topics was performed through both automated procedures (i.e., relying on coherence metrics) and more handcrafted adjustments (i.e., consulting the FARO experts, which filtered the topics and retained the most meaningful and coherent ones according to their knowledge of the domain).
Table 2. Words and bigrams of the 12 topics extracted with LDA from CEANITA reports, together with the representative label associated to each topic by FARO’s experts (English translation from Spanish).
| Words/Bigrams | Topic |
|---|
| helicopter | drop | water | fires | extinguishing | coordination | drop area | fire |
| load | work | high | alone | workload | instructions | previous | workload |
| departure | to take off | aircraft climb | runway | to take off
aircraft | rate | they are | departure |
| wind | tail | down-wind | leg | wind leg | right tail | runway | traffic circuit |
| weather | adverse | adverse weather | detours | meteorologic
conditions | due to weather | thunderstorm | weather |
| runway | go around | go | around | to take off | to land | aircraft
established | go around |
| sectors | sector aircraft | frequency sector | high | coordination | transfer | limit | sector
operations |
| answer | received | finally | decided | they saw | communication | visual contact | communication |
| clearance | course descent | aircraft to descend | descent rate | sector to
descend | aircraft to
maintain | rate | descent |
| received | coordinating | confirming | to confirm
receipt | maintaining
formation | sector informs | receipt | coordination |
| alert | early | early alert | activation function | activation | function | alert function | alert |
| military | military
formation | formation | military
aircraft | defence | air defence | main centre | military |
Topic modelling results enable the description of the reports at a higher resolution then simple descriptive statistics. For instance, while the main causes of the incident are identified just by looking at variables described in Section 4.1 (e.g., if a wrong ATCo clearance was responsible), topic modelling also provides additional information (e.g., if the ATCo’s behaviour that led to the wrong clearance might have been affected by an excessive workload or an emergency situation). Indeed, this technique also outputs the probability of finding a certain topic—namely, the topic’s prevalence — in each report, thus generating for every document a set of numerical features quantitatively describing its content. Figure 2 shows the average prevalence of each topic over the CEANITA reports. Observing Figure 2 it can be seen that exogenous factors like fire-extinguishing emergencies or adverse-weather problems are quite rare (only about 10% of the incidents contain one of these topics), while workload is present in almost 40% of the reports.
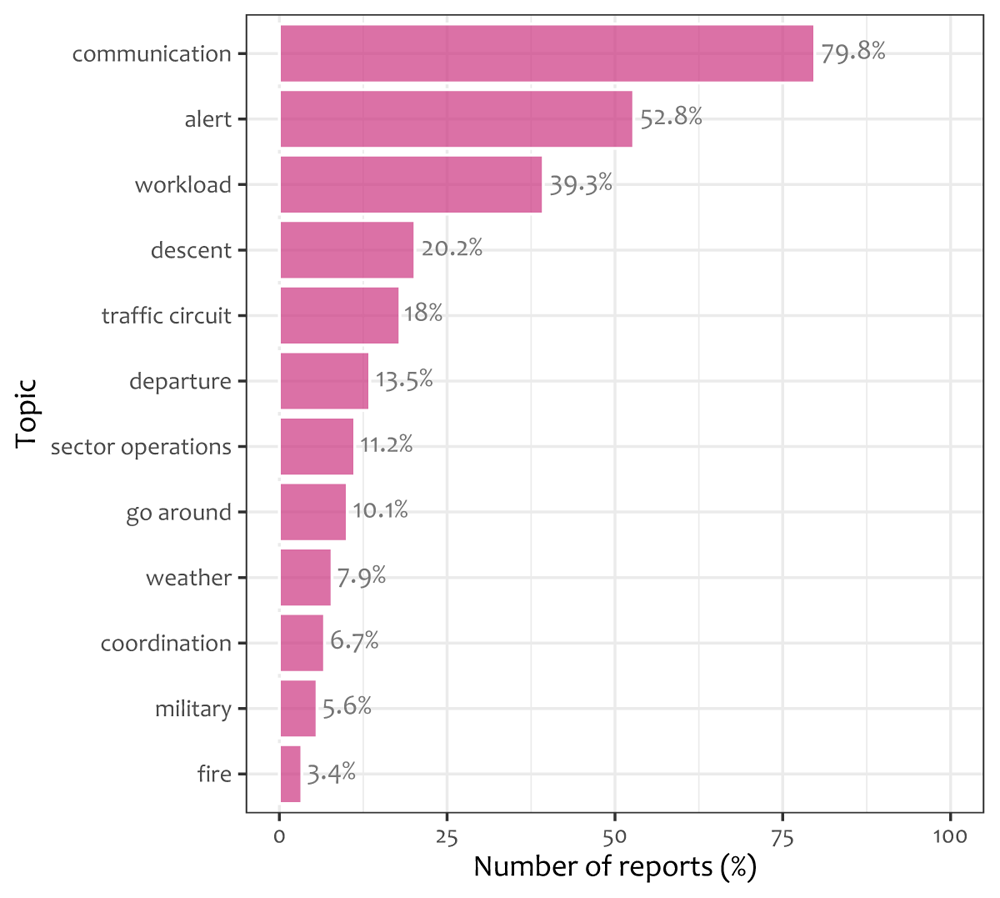
Figure 2. Average prevalence of each of the 12 topics of Table 2 over CEANITA reports.
6.1.2 Topic modelling on UKAB reports. The application of LDA for topic modelling on UKAB reports led to the identification of 20 main topics, whose description in terms of words and bigrams in Table 3. Figure 3 shows the average prevalence of each topic over the UKAB reports. There is some significant heterogeneity in prevalence: for instance, communication, late sighting, and downwind leg are quite frequent (around 30%) while topics about parachuting, weather or training are quite rare (around 2%).
Table 3. Words and bigrams of the 20 topics extracted with LDA from UKAB reports, together with the representative label associated to each topic by FARO’s experts.
| Words/Bigrams | Topic |
|---|
| overhead | join | joining | deadside | overhead
join | crosswind | circuit | overhead join |
| student | instructor | student pilot | training | solo | hand | control | training |
| advised | requested | acknowledged | asked | received | inbound | passed pilot | communication |
| fast | military | jet | high | fast jet | range | manoeuvres | military jet |
| survey | manoeuvring | company | operations | conducting | aerobatics | manoeuvres | manoeuvres |
| runway | go around | go | around | to take off | to land | aircraft
established | go around |
| sectors | sector aircraft | frequency sector | high | coordination | transfer | limit | sector
operations |
| answer | received | finally | decided | they saw | communication | visual
contact | communication |
| site | gliding | winch | glider | launch | active | sites | glider |
| departure | departing | climb | climbing | airborne | departed | depart | departure |
| converging | sighting pilot | required give | late sighting | pilot
required | considered
converging | converging
pilot | late sighting |
| descent | descend | descending | altitude | descended | feet | vertical | descent |
| trainee | ojti | handover | clearance | instruction | cleared | training | training |
| helicopter | site | helicopters | helicopter
pilot | wing | landing | lifting | helicopter |
| service | altitude | cloud | weather | receiving | altitude ft | condition | weather |
| transponder | primary | primary contact | twin | selected | serviceable | equipped | transponder |
| approach | final | runway | instructed | landing | final approach | leg | final approach |
| monitor | traffic information | required monitor | warning | definite risk | monitor flight | definite | monitoring |
| para | drop | parachuting | dropping | parachute | site | para
dropping | parachuting |
| busy | workload | high | working | handover | controlling | inbound | workload |
| paraglider | paramotor | flypast | paragliders | paraglider
pilot | paramotor pilot | paraglider
pilots | paraglider |
| concerned | normal | concerned
proximity | standards | pilot
concerned | safety standards | pertained | concern |
| circuit | downwind | visual circuit | leg | pattern | ahead | circuit traffic | downwind leg |
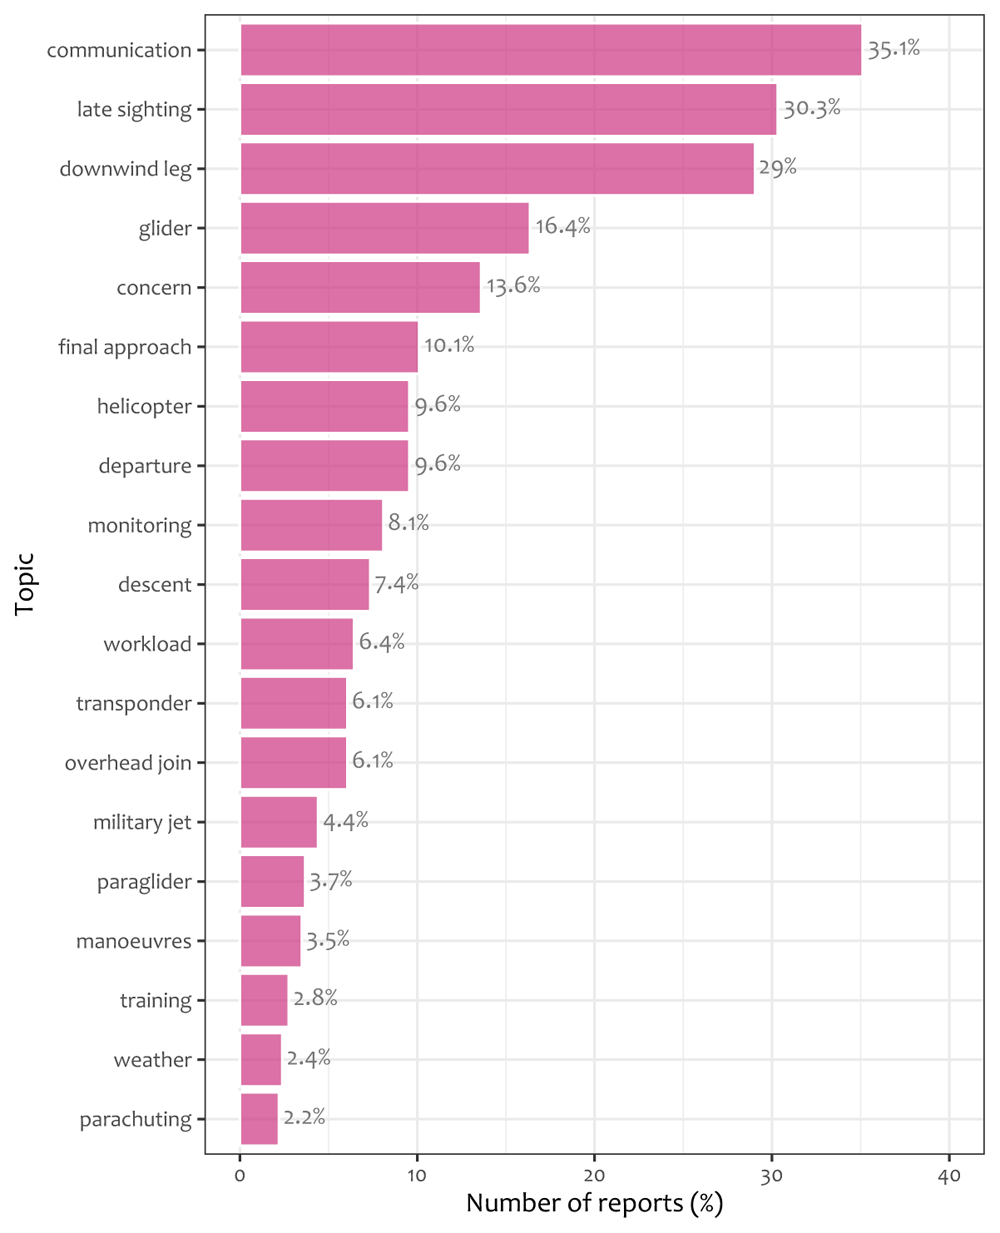
Figure 3. Average prevalence of each of the 20 topics of Table 3 over UKAB reports.
6.1.3 Clustering analysis on CEANITA reports. In order to identify the relations between the topics’ prevalence and the other contextual information (i.e., the main causes of the LoS and the pilots’ and ATCo’s contribution to the incident), a further analysis was then conducted by applying clustering analysis (see Section 5.2). For this purpose, for each CEANITA report, a feature set was created, composed of the prevalence of the 12 topics, the main causes, and the level of pilots’ and ATCo’s contribution to the LoS. Hierarchical clustering with Ward distance was then applied on the resulting dataset. After visualising different statistical metrics through dendrograms and screeplots (i.e., the two most common methods for cluster selection) and jointly consulting the FARO experts, 8 different clusters were identified. As shown in Figure 4, they strongly differ in size and normalised frequency of the features. Indeed, looking at Figure 4 some observations arise:
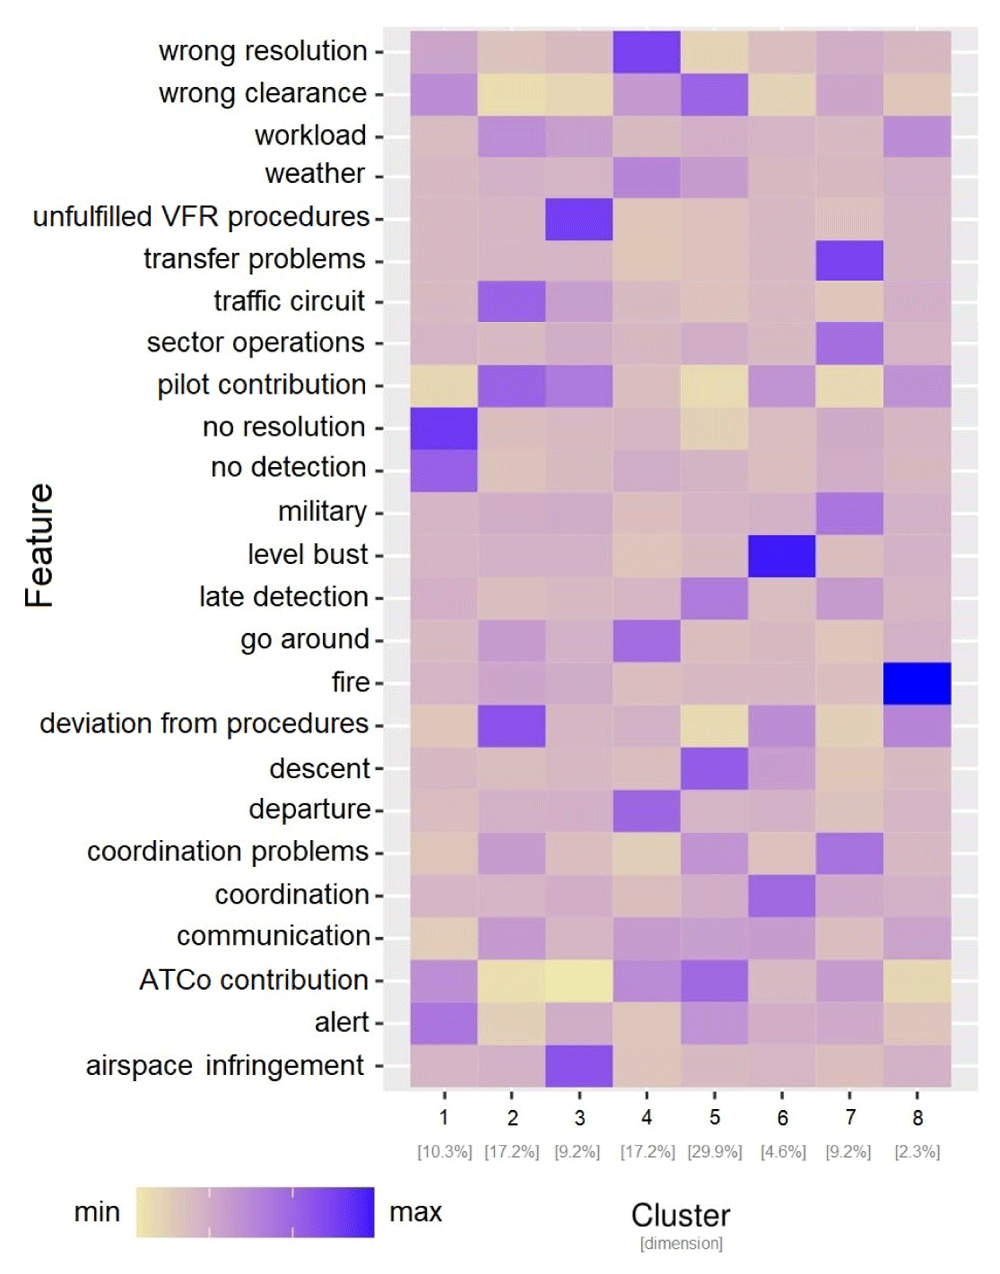
Figure 4. Characterisation of the 8 clusters in CEANITA reports through the size and the normalised relative frequency of each feature.
Two very small subgroups (Clusters 6 and 8) are identified as particularly different from the others. In particular, Cluster 8 is composed of two LoS events where the main topic is “fire” (indeed, they are the reports referred to Llutxent fire in summer 2018); Cluster 6 instead contains the four incidents caused by level bust (and, as expected, according to the heatmap, the main contribution was from the pilots and the other main conclusion was “deviation from procedures”).
The the highest frequency of ATCo contribution and an interesting high prevalence of “descent” topic largest cluster (Cluster 5) is mainly composed of wrong-clearance and late-detection incidents, with clearly.
Cluster 4 contains incidents mainly caused by “wrong resolution” of the ATCo, with high prevalence of topics related to go-around, departure, and weather.
Cluster 7 is composed of incidents caused mainly by transfer or coordination problems. The most frequent topics here are “sector operations” and “military”.
Incidents in Cluster 3 are essentially due to Pilots’ errors, in particular to airspace infringement and unfulfillment of the Visual Flight Rules (VFR).
Cluster 2 is characterised by incidents due to Pilots’ deviations from procedures, especially in the landing phase (see topic “traffic circuit”).
Cluster 1 is composed of incidents due to ATCo inability to both detect and resolve the LoS. This cluster is interestingly characterised by high values of the topic “alert”;
Interestingly some topics (e.g., workload and communication) are almost homogeneously distributed in all the clusters, without peaks in their relative-frequency values.
6.1.4 Clustering analysis on UKAB reports. An analogous analysis was conducted on UKAB reports: the feature set in this use case is composed of the prevalence of the 20 topics and the safety barriers. Also in this corpus 8 clusters were identified, differing in size and features (see Figure 5). Figure 5 shows that:
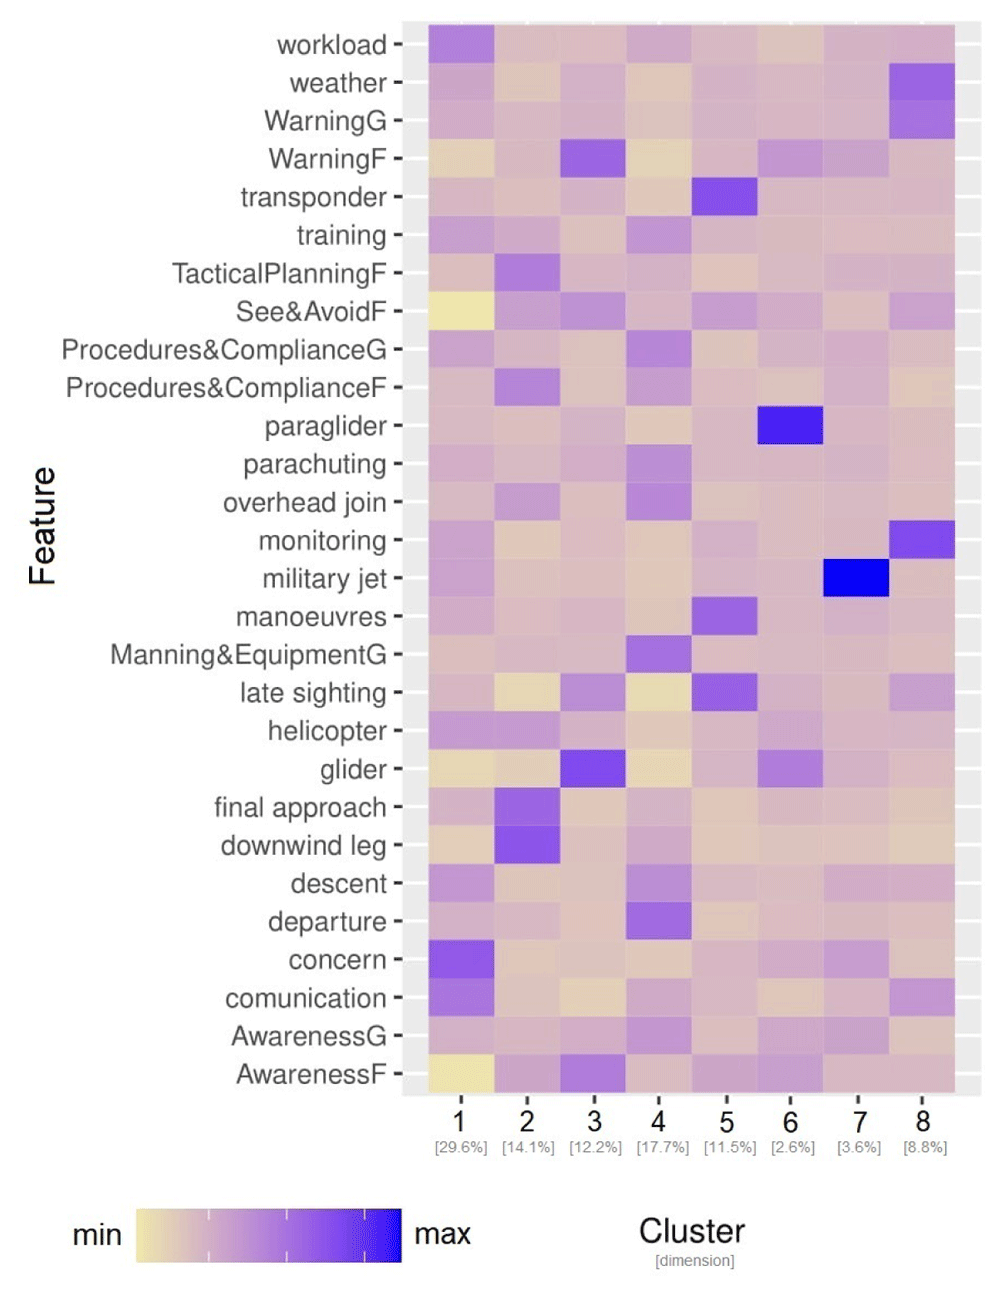
Figure 5. Characterisation of the 8 clusters in UKAB reports through the size and the normalised relative frequency of each feature.
Also in this use case, two relatively small clusters (Cluster 6 and Cluster 7) are easily identifiable as sort of “outliers”: one is essentially described by the absolute prevalence of the topic “paragliders” and the other one by the topic “military jets”, without other particularly evident features.
Cluster 8 is interestingly characterised by three main topics/factors: weather, monitoring and electronic warning system at ground level, which may be correlated in some way.
Cluster 1, even being the largest one, seems to reunite the incidents where the responsibility is rarely attributed to the pilot: most of the Safety Barriers related to flight level have lower levels than the average, while the darkest colours on the heatmap correspond to concern, communication, and workload, highlighting a significant human component.
Cluster 2 is mainly formed by incidents happened during landings, with a slight correlation with procedures compliance, tactical planning and execution ascribed to pilots.
Cluster 3 mostly contains late-sighting incidents, correlated with factors like lack of situational awareness of the pilot and electronic warning problems; interestingly, this cluster is the one with higher prevalence of the glider topic.
Cluster 4 is formed by low-altitude incidents: the heatmap highlights both departure, descent, overhead join, and parachuting topics; the main causal factor seems to be Manning & Equipment at ground level.
Cluster 5 is again about late-sighting incidents, with particular focus on two topics: transponder and manoeuvres.
In order to sum up, at the end of this section reporting EDA results on both CEANITA and UKAB reports, it is interesting to notice that the identification of topics and clusters in the two corpora reveal both clear differences (e.g., various topics found in UKAB reports – like “paraglider”, “glider”, or “parachuting” – did not emerge in the CEANITA ones, and even for some common topics – like “workload” or “descent” – there are in fact differences in frequencies) and strong similarities (e.g., topics like “communication” or “weather” have very similar prevalence in the two corpora, and many of the clusters identified follow a similar logic). While similarities are somehow easily expected, there may be various reasons behind the differences, which can be summarised in these two points:
A difference in the context and type of the reported events: in particular, as described in Section 4, the vast majority of the incidents reported in the UKAB sample happened in class G while the incidents in the CEANITA sample are mostly from airspace classes C, D, and A. The different nature of the incidents reported implies great differences in flight rules and in the role of air traffic control, which may justify differences in the dynamics of the LoS and, consequently, in the reports’ content;
A difference in the way incidents (even when similar) are described: UKAB and CEANITA reports are clearly different in terms of reporting logic and culture, and unsupervised NLP techniques do not extract necessarily what was important in the incident but what the authors of the text considered important when writing the report.
6.2 Automatic extraction of TOKAI taxonomy factors
While topic modelling enabled a higher-resolution insight into the reports with respect to the simple descriptive statistics, knowledge expressed by topics can still be vague and potentially misleading (e.g., while the topic “workload” can intuitively be assumed to appear only when workload was high, “communication” for example can suggest very different scenarios, ranging from lack of communication to perfect communication). The exploitation of syntactic analysis represents an attempt to dig deeper and extract even more precise information.
Syntactic analysis (see Section 5.3) is a powerful tool to identify the text structure and meaning, and, in particular, in this work it enabled the association of each considered report to the corresponding TOKAI taxonomy factors. Specifically, for the purposes of this research, only Part A of the TOKAI taxonomy was exploited (i.e., the one related to the personnel), since the actions reported in the paragraphs of interest from both the CEANITA and the UKAB reports are usually more related to this subject. To have a clearer picture of the considered taxonomy factors, Table 4 reports Part A of the TOKAI taxonomy together with factors’ specifications11 and examples of sentences associated to them through the algorithm developed by the authors.
Table 4. Part A of the TOKAI taxonomy factors: specifications and examples of sentences associated to the taxonomy by the developed tool.
| Factor | Specifications | Example |
|---|
| A-1. Perception | See - identification; See - detection; Hear - identification; Hear -
detection; Perceive visual information - accuracy; Perceive auditory
information - accuracy. | Sector CAO authorised aircraft 1 without
detecting aircraft 2. |
| A-2. Memory | Remember to monitor or check; Remember to act; Remember previous
actions; Recall information from working memory; Recall information
from long-term memory. | Aircraft 2 was authorised by the Sector,
not remembering presence of Aircraft 1. |
| A-3. Decision | Judge/Project; Decide/Plan. | APP LEMG planned the approximation
sequence incorrectly. |
| A-4. Action | Select/Position manually; Convey/Record information. | Aircraft 1 did not communicate its
position correctly. |
| A-5. Conformance | Deliberate or malicious act; Individual conformance with rules or
procedures; Team conformance with rules or procedures. | Aircraft 2 did not comply with the
instruction. |
The algorithm to link the report text to the TOKAI taxonomy factors can now be illustrated in detail (see Algorithm 1).
6.2.1 Outcomes on CEANITA reports. The proposed algorithm (Algorithm 1) has then been applied to the conclusive section of each CEANITA report. This portion of text summarises the dynamics of the LoS based on the main actions of pilots and ATCos. There follows an example from report 067/18 (translated from Spanish to English):
“According to what stated by the executive controller of ACC Barcelona Sector CCC, different conflicts were going on: due to this, he did not plan the descent of Aircraft 1, which ended up in conflict with the trajectory of Aircraft 2. When Aircraft 1 asked for descent, he did not check if the traffic around Aircraft 1 was in potential conflict with it and authorised it to descend at FL310. This produced the loss of separation between Aircraft1 and Aircraft 2. The planning controller of Sector CCC immediately informed the executive controller of the conflict, but this did not prevent the airprox.
On the other hand, Sector CCC provided incomplete traffic information to Aircraft 2.”
Algorithm 1: Algorithm to link the report text to the TOKAI taxonomy factors exploiting Syntactic Analysis
Input: 1. The sequences of verbs/actions in the base form for each factor (e.g., for factor A-1, the list “see”, “identify”, “detect”, “hear”, etc.). This sequences can be created directly by human operators, which can be supported by automatic tools. Possibly, two sequences can be created for each factor, a positive and a negative one (e.g., for A-2, “remember” is in the positive sequence, while “forget” in the negative one).
2. The text of the conclusive section of the report of interest.
Output: For each of the factors (i.e., A-1, A-2, etc. in Table 4) and for each subject (e.g., pilot or controller) the number of positive and negative occurrences.
The text of the report is processed via UDPipe (see Section 5.3 and Table 2 as reference);
In the UDPipe output (i.e., the result of lemmatisation, part-of-speech tagging, and dependency parsing) we search, for each of the factors, the verbs in factor’s lists (both for the positive and negative lists);
For each of the identified verb, the subject is retrieved, also taking into account passive forms where the subject is the agent;
A check for negative forms or adverbs (e.g., “incorrectly”) is performed in the identified sentence to cope with the inversion of meaning (i.e., positive verbs become negative if a negative form or adverb is present);
The application of Algorithm 1 on these sections of CEANITA reports produced a rich output (i.e., multiple TOKAI factors were found in most of the papers). To have a more comprehensive look at the results, factors’ subjects can be grouped into flight elements (i.e., aircraft, pilot, etc.) and ground elements (i.e., controller, sector, etc.); it is then possible to estimate for each CEANITA report how the five factors are distributed between the subjects, both in terms of positive and negative occurrences. Please note that in this section the words “negative” and “positive” should be intended in a purely linguistic sense (i.e., “he did not perform an action” is negative and “he performed an action” is positive, independently of the positive or negative impact or evaluation of that action).
Figure 6 shows the global distribution (i.e., the sum over the different reports) of negative occurrences of each TOKAI-taxonomy factor by group of subjects. Figure 6 suggests that the main omissions — namely, the actions reported in negative form in the text — for the flight subjects are classified as factor A-4 (i.e., problems with action) and A-5 (i.e., problems with conformance with rules), while for the ground subjects they are again mostly classified as factor A-4 and, to a lesser extent, as factor A-1 (i.e., problems with perception). Interestingly, further analysing the data, it is possible to discover that almost all the problems with factor A-4 are relative to (lack of) conveyance of information, for both flight and ground elements.
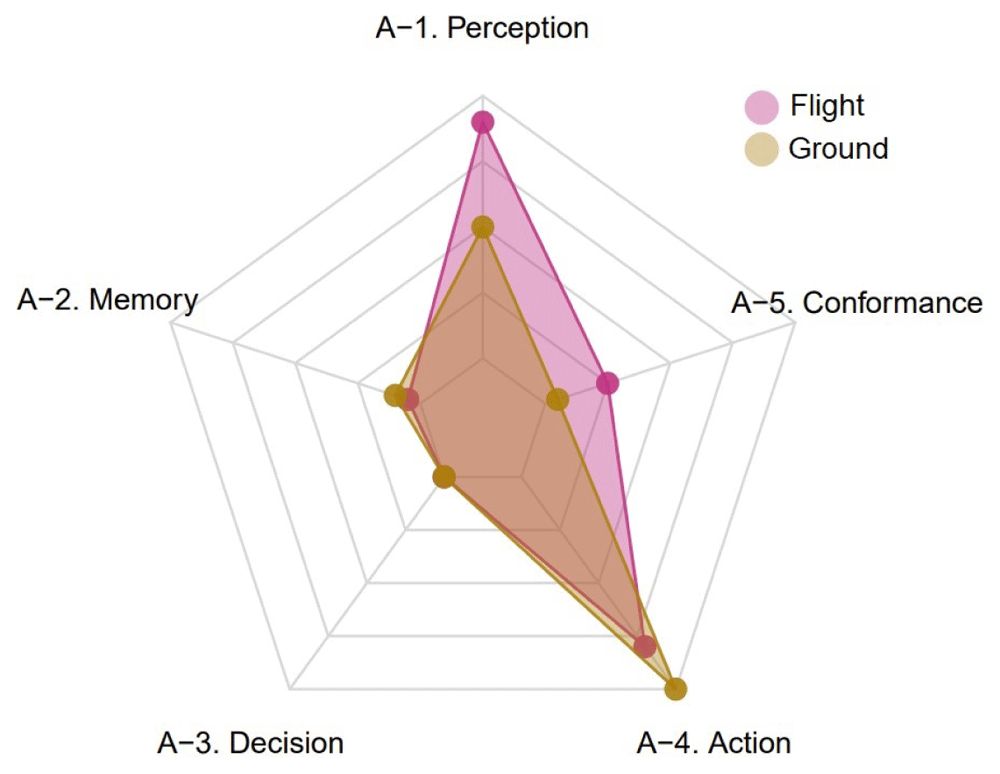
Figure 6. Global distribution of negative occurrences of each TOKAI-taxonomy factor by group of subjects (CEANITA reports).
To assess the reliability of the proposed syntactic-analysis-based algorithm (Algorithm 1) on CEANITA reports, an indirect validation was performed: indeed, it could not be validated in the standard way since there is no ground truth i.e., the correct classification in terms of TOKAI taxonomy does not exist for the considered reports. Thus, a simple predictive model was developed to predict the main contribution (ATCo or pilots) in a LoS, based on the extracted number of positive and negative occurrences of each taxonomy factor (i.e., the output of Algorithm 1). The idea behind this validation is that a good performance of this predictive model would indicate that the extracted information is reasonably accurate, since TOKAI taxonomy factors should well describe the ATCo’s and pilots’ contribution to the event. Specifically, for each LoS, the goal was to predict:
the pilots’ contribution, i.e., classified as direct or not;
the ATCos’ contribution, i.e., classified as direct or not;
based on:
the number of positive and negative occurrences of each taxonomy factor (the outputs of Algorithm 1);
the differences in prevalence between flight and ground subjects for each taxonomy factor;
the airspace class (in fact, similar behaviours of ATCo and pilots can lead to different contribution assessments in different airspace classes, due to different regulations).
Note that ATCo and pilots can be both indicated in the reports as directly responsible to the incident.
Table 5 and Table 6 report the confusion matrices of the developed predictive models, developed according to what described in Section 5.4).
Table 5. Confusion matrices (%) on the dummy predictive problem of estimating pilots’ direct contribution based on outputs of Algorithm 1) via SVM to validate Algorithm 1 on CEANITA reports.
| Pred. |
|---|
| No | Yes |
|---|
| Truth | No | 51.6±0.1 | 12.4±0.1 |
| Yes | 4.5±0.3 | 31.5±0.3 |
Table 6. Confusion matrices (%) on the dummy predictive problem of estimating ATCo’s direct contribution based on outputs of Algorithm 1) via SVM to validate Algorithm 1 on CEANITA reports.
| Pred. |
|---|
| No | Yes |
|---|
| Truth | No | 25.8±0.2 | 3.4±0.2 |
| Yes | 11.2±0.2 | 59.6±0.2 |
Confusion matrices in Table 5 and Table 6 appear reasonably balanced, especially considering that the classes are highly unbalanced. The global accuracy of the prediction is ≈83% for pilots contribution and ≈85% for ATCo contribution. Therefore, it can be stated that:
the proposed approach is able to automatically link each CEANITA report to the TOKAI taxonomy factors exploiting syntactic analysis;
the indirect validation performed through a dummy prediction problem showed promising performance supporting the quality of the proposed approach;
as a side result of this indirect validation, the extracted link between CEANITA reports and TOKAI taxonomy appears to be a good proxy of the contribution assessment.
6.2.2 Outcomes on UKAB reports. Algorithm 1 has been further applied to the conclusive sections of some UKAB reports. Indeed, as the structure of UKAB reports has evolved during the years, only a subsample of them (in particular, the reports written in 2017 and a small part of the 2018 ones — the complete list is available in the output dataset35) contains this free-text summary of the contributory factors.
An example of the analysed text from report 2017002 reads:
Despite the fact that the considered text in UKAB reports is quite different from the one in CEANITA reports, the output of Algorithm 1 is again of great interest. In particular, Figure 7 shows the global distribution of negative occurrences of each TOKAI-taxonomy factor in the selected UKAB reports by group of subjects. Figure 7 suggests that, similarly to the CEANITA use case, the most frequent factor is factor A-4, for both pilots and ATCos, while factors A-2 and A-3 are the least mentioned and factor A-5 is mostly associated with the flight subjects. Nevertheless, there is a huge difference in the prevalence of factor A-1: indeed, in UKAB reports problems with perception seem to be reported much more often, in particular for flight subjects. The comparison between Figure 6 and Figure 7 reveals another interesting detail: the shape of the yellow polygon — corresponding to the ground subjects — is almost identical in both the graphs, while the pink one differs essentially for the peak in A-1. This seems in line with what emerged in the data description (Section 4), as the two samples of reports are very different in terms of contribution assessment: in the CEANITA corpus, the majority of the LoS events is associated to ATCo’s contribution, while, in the UKAB sample, the safety barriers suggest pilots’ actions are assessed as contributory in the vast majority of the cases and, in particular, they are mostly classified as Situational Awareness and See & Avoid problems, which may indeed be related with A-1 factor in the TOKAI taxonomy.
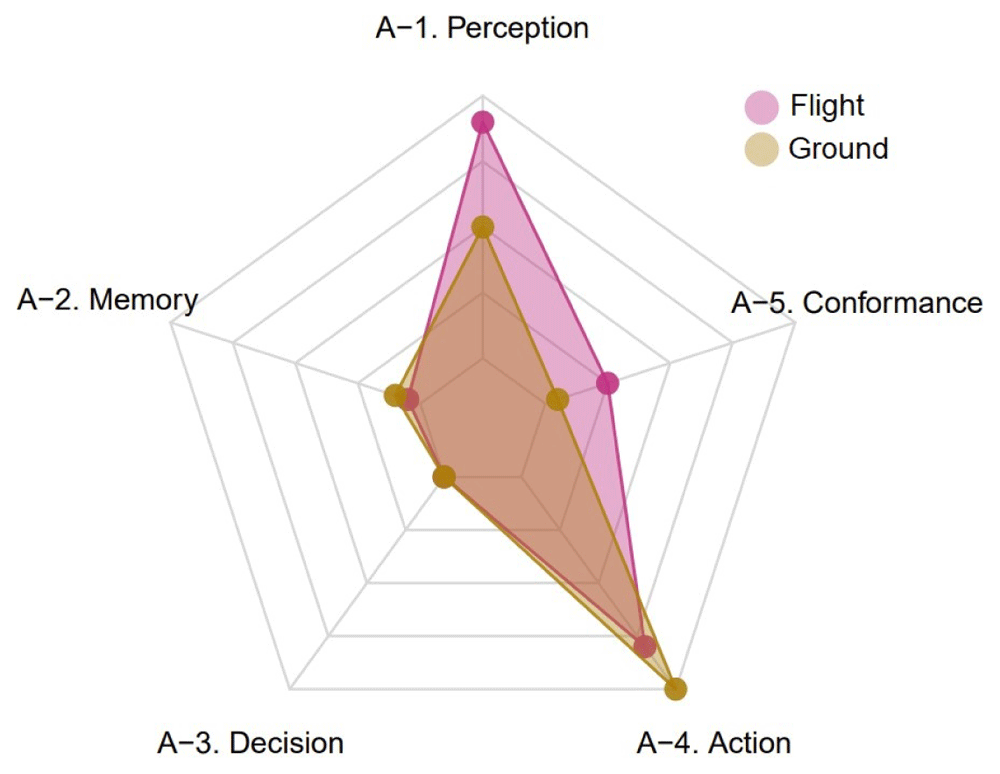
Figure 7. Global distribution of negative occurrences of each TOKAI-taxonomy factor by group of subjects (UKAB reports).
Analogously to the CEANITA use case, to assess the reliability of the proposed Syntactic-Analysis-based algorithm (Algorithm 1) on UKAB reports a simple predictive model was developed. Since UKAB reports do not contain the same neat indication of ATCos’ or pilots’ contribution, two similar variables considered:
the presence of flight safety barriers, roughly corresponding to pilots’ contribution;
the presence of ground safety barriers, roughly corresponding to ATCos’ contribution;
according to their definition in Figure 1. Similarly to the CEANITA scenario, the predictors were based on the Algorithm 1 output and on the airspace class.
Table 7 and Table 8 report the confusion matrices of the predictive models trained on the 127 UKAB reports (developed analogously to the CEANITA use case).
Table 7. Confusion matrices (%) on the dummy predictive problem of estimating pilots’ direct contribution based on outputs of Algorithm 1) via SVM to validate Algorithm 1 on UKAB reports.
| Pred. |
|---|
| No | Yes |
|---|
| Truth | No | 9.1±0.5 | 9.1±0.5 |
| Yes | 10.6±0.5 | 71.2±0.5 |
Table 8. Confusion matrices (%) on the dummy predictive problem of estimating ATCo’s direct contribution based on outputs of Algorithm 1) via SVM to validate Algorithm 1 on UKAB reports.
| Pred. |
|---|
| No | Yes |
|---|
| Truth | No | 15.2±0.3 | 12.1±0.3 |
| Yes | 12.1±0.3 | 60.6±0.3 |
Also in this case, despite the classes being highly unbalanced, the confusion matrices appear quite balanced. The global accuracy of the prediction is ≈80% for pilots’ contribution and ≈76% for ATCos’ contribution.
When looking at the accuracy of CEANITA and UKAB validation models, it is fundamental not to consider these numbers completely comparable, i.e., the lower accuracy of the UKAB model is not necessarily associated with a lower accuracy in the outcome of Algorithm 1 on the UKAB sample. Indeed, by reading some of the reports, it is evident that, while the CEANITA conclusive text is strictly associated with the final contribution assessment, the text considered in the UKAB reports does not focus exactly on the same aspects evaluated in the Safety Barriers assessment. Therefore, the fact that the TOKAI factors extracted from the UKAB reports are less predictive than those ones extracted from the CEANITA reports in terms of pilots’ and ATCos’ contribution might be due to the different settings of the two dummy predictive problems exploited for validation purposes.