Introduction
Electroencephalography (EEG) is a direct measure of aggregated neuronal oscillatory activity at high temporal resolution1,2. This technique is often used in developmental research owing to freedom of movement, acceptability of the method by participants, feasibility, and scalability. Variations in brain responses and development measured by EEG in individuals with neurodevelopmental conditions may have clinical utility as biomarkers or markers of target engagement in the context of clinical trials, for example, for autism3,4. EEG is typically measured during an event-related or continuous paradigm. The recorded signal is pre-processed, and metrics of interest are extracted, such as the amplitude and latency of event-related components or spectral power and connectivity in continuous paradigms. One important step in the analysis of EEG data is the pre-processing of the collected EEG data. This step remains a challenge in the field due to the lack of specific guidelines and researcher freedom5. This lack of harmonization in the pre-processing of EEG is a big issue for building evidence in the field and translational science, where we move from lab-based research to clinical utility.
The primary aim of EEG pre-processing is to remove any signals with a non-neural origin from the signal to ensure that any observed effects in the EEG statistical analyses arise from brain processing. This step also increases the signal-to-noise ratio, thereby increasing the likelihood of detecting effects in EEG studies. Examples of signals with non-neural origins, also termed artifacts, are flat signals, jumps or drifts, and signals resulting from sweating, head movements, eye blinks, heart rate, and excessive muscle movement5. Artifacts can be identified based on visual inspection or automated algorithms. Once signals containing artifacts are identified, they are sometimes excluded from further analyses and sometimes corrected for by interpolating the signal from surrounding electrodes or by calculating the contribution of the artifacts to the signal and subsequently subtracting the artifactual components from the recorded signal. Pre-processing pipelines also tend to include filtering the raw data, segmenting the artifact-free data, and re-referencing the EEG data (typically to the average signal across all electrodes)5. The specific order and parameters for the different pre-processing steps vary widely.
EEG analysis is particularly challenging for data collected from clinical groups, such as individuals with neurodevelopmental conditions. Clinical studies often include individuals across a broad age range and range of cognitive functioning6. High inclusion rates and high quality of the EEG data are important as information about brain function needs to be based on and be generalizable to a broad population rather than a subsample of individuals with high-quality EEG data who were very attentive and compliant during the EEG assessment7. Due to the heterogeneity in such samples, the amount of noise, blinks, jumps, and muscle noise in the EEG signal varies between participants. The length of the data recording may also vary due to variability in attention spans, with typically more data available in adults than in children. A pre-processing pipeline would ideally be able to handle this heterogeneity and correctly identify artifacts in each individual dataset, resulting in a representative sample.
The traditional gold-standard approach to the identification of EEG artifacts within the developmental and clinical literature has been to include human inspection of the data8–11. Visual inspection involves manually or visually inspecting the EEG signal or its independent components by an expert. This expert goes through the data manually and identifies any occurrences of noise, blinks, jumps, muscle noise, and other bad signals in each dataset. This approach has been widely used for datasets characterized by heterogeneity, for example, in infant data or in individuals with autism (e.g. 3,12,13). In a recent clinical study, Garcés and colleagues investigated EEG spectral power and connectivity in autism. They used a partially manual approach to pre-process EEG data recorded during a resting state (eyes open/eyes closed) paradigm in a sample of 411 6–30-year-olds with and without an autism diagnosis13. The EEG pre-processing steps included visual inspection and rejection of bad (or artifacted) EEG data and ICA components (containing cardiac, muscular, ocular, or other artifacts) for each of the EEG datasets. Although it is typically considered the gold standard in the field14, this manual approach has several limitations. Visual inspection of EEG data is time-consuming and may take up to 1 hour per recording. This is particularly challenging for the scalability of EEG analyses in large-sample studies or datasets recorded with high-density EEG channel layouts. In addition, visual inspection is subjective, where the identification performance may vary with the researcher’s experience and criteria used in the laboratory. The subjective nature of the decision during the data cleaning process could impact the reproducibility. Variability in decisions about data quality and potential bias if raters are unblinded to the diagnostic group or condition could lead to variability in the resulting metrics and affect the consistency of the results. Furthermore, the process is difficult to describe and operationalize. Thus, the standardization of EEG pre-processing is an important step for the field.
Automated EEG pipelines speed up the pre-processing of EEG data and can provide an objective approach that may be uniformly applied to all participants in the clinical dataset. Automated EEG pipelines are characterized by the automated identification of artifacts, such as thresholding, z-scoring, or algorithms that automatically select independent components that represent artifacts from the ICA5. A wide range of automated approaches have been proposed (e.g., MADE15, miniMADE16, HAPPE17, HAPPILEE18, HAPPE+ER19, APICE20, and DISCOVER-EEG21). However, despite the promise of standardization, existing pipelines vary substantially in the order and parameters of different pre-processing steps. Many pipelines are either adult- or infant-specific; however, two pipelines have recently become more widely used for pediatric data in the field of autism research and are thus particularly relevant to investigation15,17. Understanding the comparability of the results of these pipelines with each other and with more traditional manual approaches is important to understand the contribution of preprocessing differences to heterogeneity in the literature, and to the importance of pipeline standardization moving forward.
Developed in 2020, the Maryland Analysis of Developmental EEG pipeline is one of the widely used pipelines (MADE15,16,22,23). The MADE pipeline uses the FASTER algorithm for bad channel identification24, adjusted-ADJUST to identify bad independent components25, and a trial-level channel interpolation. The pipeline was validated on datasets from 10 1-year-old infants, 10 3- to 6-year-old children, and 10 16-year-old adolescents without neurodevelopmental conditions. The EEG datasets were recorded with 64 and 128 channel layouts during event-related and resting-state paradigms. The results showed that higher percentages of epochs were retained using the MADE pipeline compared to the two traditional pipelines, where one excluded FASTER and the ICA but included trial-level interpolation, and the other pipeline excluded the interpolation.
The second pipeline that has been most frequently used in paediatric samples is the Harvard Automated Processing Pipeline for EEG (HAPPE17–19). The HAPPE has been applied in studies examining infants with a family history of autism26–28 and clinical trials (Autism Biomarkers Consortium for Clinical Trials4,7) and was first developed in 2018. The HAPPE was specifically developed for datasets with many artifacts and short durations of EEG recordings from young children or individuals with neurodevelopmental conditions. The pipeline was initially created to analyze continuous data recorded with a 64 or 128 channel layout. It is characterized by the wavelet-enhanced independent component analysis (wICA29) correction and the multiple artifact rejection algorithm (MARA30) to identify artifactual independent components. The pipeline was validated on a dataset from an autism infant sibling study with 867 EEG recordings (64 or 128 channel layout) of an infant resting-state paradigm at 3, 6, 9, 12, 18, 24, and 36 months of age. The HAPPE pipeline rejected a larger proportion of artifacts and retained more data compared to the other approaches.
These automated pipelines show a high potential for use in large cohorts with neurodevelopmental conditions. However, the performance of these pipelines in heterogeneous samples from an age range spanning childhood to adulthood has not yet been evaluated. Furthermore, the method of validation for these two pipelines varied. The HAPPE was tested using infant and toddler data, whereas the MADE pipeline was tested using infant, child, and adolescent data. The authors of the MADE pipeline compared this pipeline with traditional pipelines with and without ICA artifact identification but not with a manual pipeline. For the HAPPE, outputs were compared to those of seven alternative pipelines, including pipelines with MARA, FASTER, and ADJUST algorithms, and a manual step where segments were manually rejected. The performance of pipelines is typically evaluated based on the percentage of data or the number of epochs retained. High inclusion rates are important for clinical studies; therefore, they are often used as a metric to assess pipeline performance. However, another important step is to examine the consistency of the EEG metrics of interest across different pipelines. Such metrics should furthermore show consistent estimates within a session by demonstrating high split-half reliability. In addition, there is increasing interest in the use of lower-density EEG systems to measure brain activity, that is, systems with 32 or fewer channels. Therefore, it is important to also examine the consistency of EEG metrics in automated pipelines for low-density layouts. These lower-density systems are typically more mobile and wearable due to their wireless connection with the recording computer. These characteristics make them highly attractive for large-scale studies and across settings, such as at home and in the clinics. Both the HAPPE and MADE pipelines have adapted versions of their pipeline for use with lower density layouts: HAPPILEE (Harvard Automated Pre-processing Pipeline Including Low-Electrode Encephalography)18 and miniMADE16. HAPPILEE was optimized for the analysis of 30 resting-state EEG datasets collected with a system using 12 tin electrodes from young children aged between 6 and 30 months. The miniMADE pipeline was developed in the context of in-home EEG data collection in infants for data quality assessment of resting-state EEG data collected with a 20-channel layout EEG system.
Aims of the current study
In the current study, we tested the consistency of spectral power and connectivity estimates across different EEG pipelines applied to EEG recorded during the natural viewing of dynamic videos in the LEAP study31. This task consists of videos of social (women singing nursery rhymes) and non-social naturalistic stimuli (spinning toys)10. Brain responses during dynamic videos have previously yielded more robust estimates of individual differences than traditional resting-state paradigms32. We first applied the manual pipeline of Garcés and colleagues to a subsample of the data. We chose this pipeline because manual pre-processing is considered the gold standard in the field and because it has been successfully applied to EEG recordings from the current study population in a different task. We then compared the spectral power and connectivity estimates to those from EEG data preprocessed with automated paediatric pipelines: the MADE pipeline and the HAPPE pipeline. We also adapted the MADE pipeline to improve the inclusion rates and suitability for network connectivity analyses and termed this pipeline the MADE-BOND pipeline. During our analyses, a newer version of HAPPE was released. Therefore, we included both the HAPPE version 1 (legacy version, which has been used in previous studies4,7,26–28) and the newer version of HAPPE version 4. Finally, we tested the feasibility of pipelines on low-density layouts. We selected a subset of 19 channels for these analyses. This layout is consistent with other ongoing projects that use the same task (Braintools33, a clinical trial34, and the South African Safe Passage Study35). We tested the outputs of the MADE-BOND, HAPPILEE, and miniMADE pipelines in a low-density layout.
After preprocessing the data using eight different pipelines, we first examined the inclusion rates for each pipeline. High inclusion rates suggest that most of the participants could be included in subsequent statistical analyses, resulting in higher statistical power to detect a small effect, including a broader range of participants with varying ages and neurodevelopmental backgrounds. Second, we calculated the intraclass correlations between each of the pipelines for spectral power and connectivity within the canonical delta, theta, alpha, and beta frequency bands across all epochs and for condition differences. We focused on these EEG metrics, as they have been commonly used in research on neurodevelopmental conditions. High intraclass correlations between pipelines would suggest consistency in EEG estimates across pipelines. Finally, we calculated the split-half reliability for the power for each EEG pipeline. High split-half reliability indicates the stability of estimates across EEG recordings. Our overall aim was to identify an automated pipeline with high inclusion rates and high consistency and stability in power and connectivity estimates compared with the manual pipeline in a heterogeneous sample with a large age range.
Methods
Participants
Data were collected as part of the EU-AIMS Longitudinal European Autism Project (LEAP). This project aimed to collect a large sample of deep-phenotyped data from autistic and non-autistic individuals across multiple sites in Europe. Individuals between 6 and 30 years of age were invited to participate in a series of assessments focused on cognition, clinical traits, EEG, fMRI, and eye tracking. For more information on the design and clinical characterization of LEAP, we refer the reader to 31,36. The collection sites were the Central Institute of Mental Health (CIMH, Mannheim, Germany), King’s College London (KCL in Londen, United Kingdom), Radboud University Medical Centre (RUMCU in Nijmegen, the Netherlands), University Campus BioMedico (UCBM in Rome, Italy), and University Medical Centre Utrecht (UMCU in Utrecht, the Netherlands). This study was approved by the independent ethics committees at the collection sites (site(s), ethics committee name, ethics approval number, date of approval): for CIMH: UMM Universitätsmedizin Mannheim, Medizinische Ethik Kommission II (UMM University Medical Mannheim, Medical Ethics Commission II), 2014-540N-MA, 2014; for KCL: London-Central and Queen Square Health Research Authority Research Ethics Committee, 13/LO/1156, 2013; for RUMCU and UMCU: Radboud universitair medisch centrum Instituut Waarborging Kwaliteit en Veiligheid Commissie Mensgebonden Onderzoek Regio Arnhem-Nijmegen (Radboud University Medical Centre Institute Ensuring Quality and Safety Committee on Research Involving Human Subjects Arnhem-Nijmegen), 2013/455, 2013; for UCBM: Universita Campus Bio-Medica De Roma Comitato Etico (University Campus Bio-Medical Ethics Committee De Roma), 18/14 PAR ComET CBM, 2014. Written informed consent was given by the participants (and caregivers where appropriate) at the start of each session.
We randomly selected approximately 20% of the datasets from those participants with available EEG data for the dynamic videos task (blind to participant characteristics such as age, sex, recruitment group, and diagnosis) to balance the time investment for manual cleaning and automated cleaning. This resulted in a random selection of 131 datasets (out of 539 datasets) for the comparison of the pre-processing pipelines. The included datasets were recorded from 76 (18 females) autistic and 55 (25 females) non-autistic participants (age 7 –31 years, mean = 17, standard deviation = 6).
EEG task and data collection
The EEG battery included a wide range of tasks. The current report focuses on the dynamic videos within this battery. The ‘social’ video consists of women singing nursery rhymes, while the ‘toy’ video consists of spinning toys (duration: 60sec each). The videos were presented twice at the end of a 30-minute EEG session containing other tasks not reported here. The toy video was identical across sites, as in 10. The social video varied by site, with women singing nursery rhymes in the native language of the site (in Dutch for RUNMC and UMCU, German for CIMH, and Italian for UCBM), while the other site used the original English videos (KCL), as in 10.
The EEG recording systems and software varied by site. Each site recorded EEG with a 10–20 layout cap. Data were recorded using Brainvision (with a sampling frequency of 2000 Hz at CIMH and 5000 Hz at KCL and RUNMC), Biosemi (at 2048 Hz at UMCU), and Micromed (at 256–1000 Hz at UCBM) using different montages with varying numbers of channels (60–70 electrodes). Our EEG analyses focused on the 59 channels, for which data were recorded at all sites.
Data pre-processing with different pipelines
EEG data from the different sites were first harmonized and segmented from the start to the end of the dynamic video task. Data were downsampled to 1000 Hz if the sampling rate exceeded 1000 Hz. Data were saved in EEGLAB format and shared for further pre-processing.
The data were preprocessed using eight different versions of three pipelines: a manual pipeline, MADE, and HAPPE. We ran different versions of the pipelines to examine their robustness for connectivity analyses and analyses for lower-density layouts. We aimed to keep as close as possible to the original pipelines, except for some changes necessary to fit with our data format and paradigm, and fair comparison to the manual pipeline. The parameters and settings used in the pipelines are underlined in the pipeline descriptions below. We used the following pipelines: manual, MADE, MADE-BOND, HAPPE version 1, HAPPE version 4, MADE-BOND on low-density, HAPPILEE, and miniMADE. Figure 1 presents an overview of the different steps used in the current study for each pipeline.
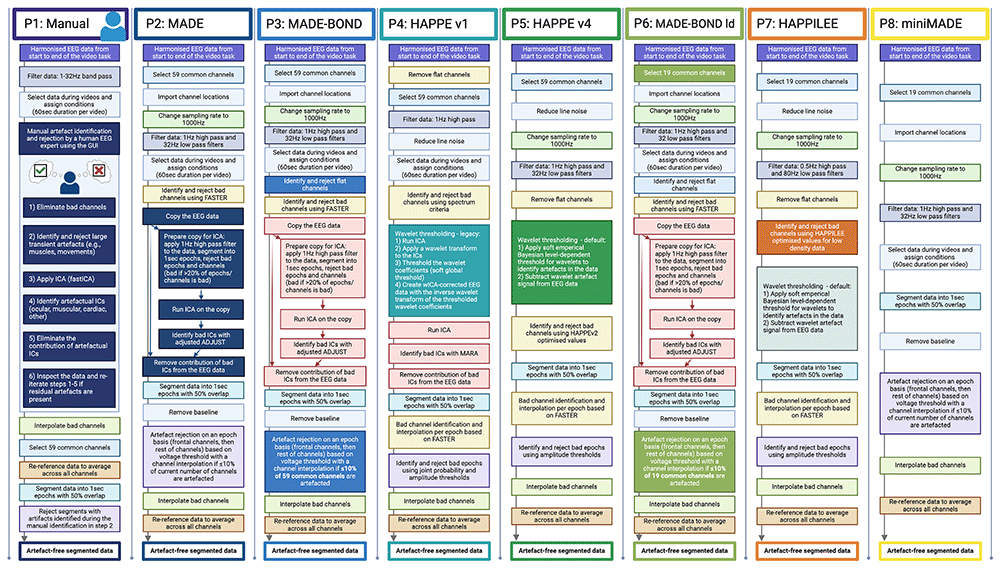
Figure 1. Steps of examined EEG pipelines.
Steps for each pipeline for the manual, MADE, MADE-BOND, HAPPEv1, HAPPEv4, MADE-BONDld, HAPPILEE, and miniMADE pipelines (from left to right). Created in BioRender. Haartsen, R. (2025) https://BioRender.com/v89p034.
The manual pipeline (pipeline 1–P1) is identical to the pipeline used by Garcés and colleagues in the eyes open and eyes closed resting state of the EEG task in LEAP, and is based on MATLAB and EEGLAB functions13,37. First, sampling rates are changed to 1000 Hz if they are different (for datasets with lower sampling rates to ensure that ICAs would be run across data with identical sampling rates). A 1–32 Hz bandpass filter is applied (including 2sec of padding on each side). We then select the data during which the videos were presented from stimulus onset to 60seconds after the stimulus onset (resulting in 4 60sec epochs if the participant sat through the whole session) and assigned the condition to the segments (social or toy condition). Next, manual artifact rejection is applied by an experienced researcher as follows: 1) bad channels are manually identified and eliminated, 2) large transient artifacts (muscles, movement) are identified and rejected, 3) a fast independent component analysis (fastICA) is applied, 4) artifactual ICs (independent components) are identified (e.g., ocular, muscular, cardiac, other artifacts), 5) the contribution of bad ICs is eliminated, 6) data is inspected, and steps 1 through 5 are repeated if any residual artifacts are present. When the data are artifact-free, bad channels are interpolated. We then selected the 59 channels common to all datasets to ensure that re-referencing to the average reference occurs across the same number of channels for all datasets. Finally, the video epochs are segmented into 1second epochs with a 50% overlap.
The Maryland analysis of developmental EEG (MADE) pipeline (here, pipeline 2 – P2) is built with EEGLAB37 functions and other algorithms, and has been designed for paediatric EEG data15. We aimed to use similar parameters for the user inputs as in the manual pipeline for a fair comparison and ran the pipeline without further adjustments in the settings (except for adjustments for epoching, see later). First, we selected 59 common channels in the dataset and changed the sampling rate to 1000 Hz if the sampling rate was different. The data are filtered with the highpass setting at 1 Hz and the lowpass setting at 32 Hz. As in the manual pipeline, we select the data during which the videos were presented (60seconds duration per video) and assign the conditions (social, toy). The pipeline then identifies bad channels using the FASTER algorithm24, and rejects these channels before ICA. Channels are bad if any of the absolute z-scores based on the Hurst exponent, correlation, and variance across the channels are greater than three. Next, a copy of the EEG data is prepared for ICA, which includes applying a 1 Hz high pass filter, segmenting the data into 1sec epochs, and removing any bad epochs (bad if ≥20% of the channels are bad, i.e., 30% of the 59 channels in the layout contain artifacts) or bad channels (bad if ≥20% of the total number of epochs are bad, i.e., if 50% of epochs for channel P7 are bad) from the data. An ICA is applied to the clean EEG data copy, and bad ICs are identified using the adjusted ADJUST algorithm25. Then, the bad channels from the copy and the contribution of the bad ICs are removed from the filtered pre-copy EEG data (before the copy was created). We further segment the data as continuous EEG data (following the script the authors created for an eyes open/closed paradigm with the following settings: task_eeg setting at 2, rest_video_length at 60, rest_epoch_length at 1, and overlap_epochs at 1 for 50% overlap). We correct the baseline across the entire epoch to correct for the offset of the signal in the epochs. Voltage threshold artifact rejection ([-100, 100] µV) and channel interpolation were applied on an epoch-by-epoch basis (with F8, AF8, Fp1, Fp1, AF7, and F7 defined as frontal_channels). The entire epoch is rejected if more than 10% of the current number of channels is bad (note that the current number here is 59 channels subtracted by n channels rejected by FASTER and the ICA in this pipeline). Otherwise, the channels for that epoch are interpolated using spherical spline interpolation. Finally, bad channels identified by FASTER and ICA are interpolated before the data are re-referenced to the average.
During the application of the MADE pipeline, we noticed that it did not perform well in cases with several flat channels in the dataset. Therefore, we adopted the MADE pipeline by identifying flat channels before identifying bad channels using the FASTER algorithm. In addition, the interpolation of channels can inflate connectivity estimates, and is therefore often thresholded at 10% of the channels in the layout12,38. The MADE pipeline applies a threshold of 10% to the channels after removing the bad channels identified by FASTER and ICA. Thus, the MADE pipeline may interpolate more channels and inflate connectivity estimates. Therefore, we adjusted the threshold to 10% of the 59 common channels in the LEAP EEG datasets. For ease, we named this in-house pipeline the MADE-BOND pipeline (pipeline 3 – P3, after the Building the Ontogeny of Neurodiversity (BOND) lab.
The fourth pipeline (P4) is the Harvard Automated Pre-processing Pipeline for EEG (HAPPE17). This pipeline is also based on EEGLAB functions and has been developed to accommodate infant EEG data with high levels of artifacts or very short durations of EEG recordings. We used HAPPE version 1.0, as this pipeline is available and has been used in previous studies focusing on autism4,7,26–28. The pipeline first removes the flat channels, and then selects the channels of interest. Here, we list 59 common channels as channels_of_interest. Data are filtered with a 1 Hz high-pass filter, and line noise is reduced using the Cleanline algorithm from EEGLAB (the line_noise_freq setting was set at 50 Hz). We select the data recorded during which the videos were played, resulting in four 60second video segments, and assigned the conditions. Next, bad channels are identified using the joint probability of the average log power from 1 Hz to 125 Hz. The wICA method is applied after bad channel rejection29. First, a traditional ICA is run on the data. A wavelet transform is applied to the time series of the ICs. The coefficients of the wavelets are then thresholded, and the inverse wavelet transform of the thresholded coefficients is calculated. An inverse wavelet is used to compose wICA-corrected EEG data. After wICA, a second ICA is applied to the data, and the multiple artifact rejection algorithm (MARA30) is used to identify bad ICs. MARA identifies bad ICs based on mean local skewness, log alpha power (8–12 Hz), lambda, fit error, range within the pattern, and current density norm). The contribution of bad ICs identified by MARA are removed before the data is segmented into 1sec epochs with a 50% overlap. On an epoch-by-epoch basis, the pipeline identifies bad channels using FASTER24, and interpolates the bad channels using spherical spline interpolation. Bad epochs are then identified and rejected using amplitude thresholds (set to default at [-40, 40] µV) and joint probability. The final two steps of the pipeline are interpolating the bad channels identified before wICA across all epochs and re-referencing the data to the average across all channels.
Since the start of this research project, HAPPE was updated in a newer version. We decided to additionally include this newer version of HAPPE as pipeline 5 (P5) in our comparisons to examine how the results compared to the manual pipeline. HAPPE version 4 allows for more options to specify the data analyses than HAPPE version 1. The new version also uses a different wavelet thresholding method. First, 59 common channels are selected. Density was set to ‘High (> 30 channels)’ and we used ‘Resting State’ as the paradigm option. The line noise was reduced using the ‘CleanLine – Default’ option at 50 Hz and 100 and 150 Hz as additional frequencies, which is an improved version of the EEGLAB plugin created by the HAPPE developers for HAPPEv2. Data were resampled to 1000 Hz and filtered with a low-pass cut-off of 32 Hz and a high-pass cut-off of 1 Hz using the EEGLAB FIR filter type. Next, wavelet thresholding was applied using the ‘wdenoise’ function from the MATLAB wavelet toolbox. The default method from HAPPEv4 uses a soft empirical Bayesian level-dependent threshold for the wavelets18,19. As our paradigm is resting state, the wavelet family was ‘bior4.4’, the threshold rule was ‘Hard,’ and the wavelet level was 10 for the wavelet thresholding approach. The artifacted wavelet signals were then subtracted from the EEG signals. After this cleaning step, bad channels were detected using the ‘default’ option that calls the Clean Rawdata function using optimized criteria for the HAPPE v2 pipeline (Bad Channel Detection parameter was ‘On’ with the’ Order’ set to ‘After Wavelet Thresholding’). Note that the steps ‘ECGone’ and ‘MuscIL’ were turned off due to the computational time. Data were segmented into 1 second epochs with a 50% overlap and another round of artifact identification followed where we set ‘Interpolation’ and ‘Segment Rejection’ to ‘On’. We used the ‘Amplitude criteria only’ setting with -150 and 150 as Minimum and Maximum Segment Rejection Thresholds respectively, and Segment Rejections based on ‘All’ channels instead of ROI to identify bad segments. Bad segments were interpolated on a channel-by-segment basis, followed by interpolation of the previously identified bad channels across all the epochs. Finally, Re-Referencing was ‘On’ with the ‘Method’ set to ‘average’ as the final pre-processing step. ‘Visualizations’ were off, and data were saved to. ’.set file formats for further analysis.
There is increasing interest in EEG with low-density layouts. Therefore, we applied pipelines to a subset of 19 channels34: FCz, AF7, AF8, F3, F4, T7, C3, Cz, C4, T8, P7, P3, Pz, P4, P8, PO7, PO8, and Oz. We first tested the MADE-BOND pipeline (P6) using this subset of data. We selected 19 channels at the start of the pipeline, but did not make any other changes compared to the MADE-BOND pipeline applied to the 59 channels (MADE-BOND on low density, abbreviation: MADE-BONDld – P6). The next pipeline we applied was the HAPPILEE pipeline18 (Harvard Automated Pre-processing Pipeline Including Low-Electrode Encephalography (HAPPILEE) pipeline (P7), which is a version of the HAPPE pipeline version 4 designed for layouts with fewer than 30 channels. Again, we select data from the 19 channels listed above for further analysis. Data are filtered with 0.5 Hz high pass, and 80 Hz low pass filter. Bad channels are identified and rejected before wavelet thresholding using the criteria optimized by the HAPPILEE developers. Data are segmented into 1 second epochs with a 50% overlap after wavelet thresholding. The other steps are identical to those of the HAPPEv4 pipeline (P5). Finally, the miniMADE pipeline16 (P8) was applied to the data. This pipeline involves selecting the 19 common channels and importing their locations. Then, the sampling rate is changed to 1000 Hz, and the signal is filtered with a 1 Hz high-pass and 32 Hz low-pass filter. Data are segmented around the videos and then re-segmented into 1 second epochs with a 50% overlap. The baseline across the entire epoch is removed before artifact rejection based on voltage thresholds and flat signals on a channel-by-epoch basis. Segments with more than 10% bad channels are rejected. After artifact rejection, bad channels are interpolated, and the data are re-referenced to the average across all channels.
After pre-processing the data with the pipelines, the output of each pipeline consists of data that are segmented, interpolated, and re-referenced. Further calculations of the measures of interest were identical for the output data between pipelines.
Extraction of measures of interest
We converted the EEGLAB data to the Fieldtrip format for further analyses39. For the epochs across all conditions, during the social condition only, and during the toy condition only, we calculated the power using the Fast Fourier transform with a Hanning window for 1 to 32 Hz in steps of 1 Hz for each epoch (ft_freqanalysis). Power values were log-transformed, averaged across epochs of interest, and averaged across all channels. We focused on log-transformed power values, as in studies utilizing this paradigm10,11. The number of epochs of interest varied with the statistical analyses. For comparison between pipelines, values were averaged across epochs for all conditions to examine the overall metrics and within conditions to examine condition differences. For comparisons within pipelines, we used split-half reliability, and the values were averaged across all even and odd epochs across all conditions (social and toy), and within conditions (social only, and toy only).
We calculated connectivity across the epochs of interest (as described for power) using the debiased weighted phase lag index (dbWPLI)40 using in-house scripts11,38,41,42 based on Fourier coefficients after applying a Fast Fourier transform to the data (1 to 32 Hz in steps of 1 Hz). We chose to use this measure because of its robustness to volume conduction and noise40, high test-retest reliability with relatively low numbers of epochs42, and consistency with previous developmental studies focusing on autism using this measure11,13,38,41. We calculated the global dbWPLI per frequency as the average dbWPLI across all possible channel pairs under the diagonal.
Power and connectivity were averaged across frequencies within canonical bands. Previous studies using this paradigm with dynamic videos have focused on the theta and alpha frequency bands. We also included delta and beta frequencies for completeness. We did not include any higher gamma frequencies because of their susceptibility to myogenic artifacts43. The following frequency bands were used: 1) delta δ: 2–3 Hz, 2) theta θ: 4–6 Hz, 3) alpha α: 7–12 Hz, 4) beta β: 13–30 Hz5.
Statistical analyses
We compared the inclusion rates across the eight pipelines using the Cochran’s Q test. We tested differences between proportions of included and excluded participants for connectivity analysis, where participants would be included if they had 90 or more artifact-free epochs across all epochs. We repeated these analyses using a threshold of 20 epochs which is the threshold for including participants in power analyses. We further repeated these analyses for condition differences, where participants would be included if they had sufficient data for both social and toy conditions (20 or 90 epochs for each condition). If the comparison across the eight pipelines revealed a significant difference in the proportions of inclusion, we followed up with pairwise McNemar tests with a Bonferroni correction among the high-density and low-density pipelines separately (using a significance level of .005 for pairwise comparisons among the high-density pipelines, and of .017 among the low-density pipelines).
Comparisons between pipelines were examined using the intraclass correlation (ICC), type ‘C-k’, to calculate the degree of consistency for average scores44–46. We estimated the consistency between the values for the frequency bands from the different pipelines for both power and connectivity across all available epochs and for the condition difference (where values for the toy condition were subtracted from the singing condition10,11). Participants were included if the number of clean epochs per condition was sufficient (≥20 for spectral power and ≥90 for connectivity). The following ICC ranges were considered: poor - ICC <.40, fair – .40 ≥ ICC <.60, good – .60 ≥ ICC <.75, and excellent - ICC ≥.75. Negative ICC values were set at 0.
Next, we tested whether some automated pipelines displayed stronger consistency with the manual pipeline than other pipelines. We first focused on comparing the ICCs between the manual and automated pipelines for high-density layouts. We opted for this test because the ICCs we compared contain identical values from the manual pipeline, that is, comparing the ICC between the manual and MADE pipeline versus the ICC between the manual and MADE-BOND pipeline (for ICC P1-P2 vs. ICC P1-P3, abbreviation used: 12 vs. 13). Second, we tested the differences in ICCs between high- and low-density pipelines, that is, comparing the ICC between the MADE and miniMADE pipelines versus the ICC between the HAPPEv4 and HAPPILEE pipelines (28 vs. 57). Table 1 provides an overview of these nine ICC comparisons. For comparisons of ICCs including common pipelines (e.g., 12 vs. 13, where P1 is common), we used Hotelling’s T2 tests, whereas we used Z-difference scores between ICCs for comparisons without common pipelines (e.g., 28 vs. 57)47,48. All tests were 2-tailed. The results were considered significant if the p-value exceeded .0056 (Bonferroni correction: .05/9). We report the absolute test statistic as an indication of the size of ICC differences.
Table 1. Overview of between pipeline comparisons made.
| Abbreviation | ICC1 | ICC2 | Test
statistic |
|---|
| Manual pipeline |
| 12 vs 13 | Manual | MADE | Manual | MADE-BOND | Hotelling’s T2 |
| 12 vs 14 | Manual | MADE | Manual | HAPPEv1 | Hotelling’s T2 |
| 12 vs 15 | Manual | MADE | Manual | HAPPEv4 | Hotelling’s T2 |
| 13 vs 14 | Manual | MADE-BOND | Manual | HAPPEv1 | Hotelling’s T2 |
| 13 vs 15 | Manual | MADE-BOND | Manual | HAPPEv4 | Hotelling’s T2 |
| 14 vs 15 | Manual | HAPPEv1 | Manual | HAPPEv4 | Hotelling’s T2 |
| Low vs high density within pipeline families |
| 28 vs 57 | MADE | miniMADE | HAPPEv4 | HAPPILEE | Z-difference |
| 38 vs 57 | MADE-BOND | miniMADE | HAPPEv4 | HAPPILEE | Z-difference |
| 36 vs 83 | MADE-BOND | MADE-BONDld | MADE-BOND | miniMADE | Hotelling’s T2 |
Finally, we compared the consistency of the power estimates within pipelines using the split-half reliability. We calculated the Pearson correlation between the values extracted from the odd and even epochs for the different frequency bands and pipelines (the corrcoef function in MATLAB, as in 49). For the analyses between pipelines, we considered the following ICC ranges: poor - ICC <.40, fair – .40 ≥ ICC <.60, good – .60 ≥ ICC <.75, and excellent – ICC ≥.75. Again, we ran these analyses for values across conditions and condition differences for those with sufficient data in both conditions (N = 103). We did not run these split-half reliability analyses for the connectivity estimates because of the low availability of high numbers of epochs (56 participants with sufficient data).
Results
Inclusion rates
The inclusion rates for the different analyses and pipelines varied between 85% and 99% (Table 2). For analysis across all epochs, inclusion rates between pipelines varied for both connectivity (χ2(7) = 48.50, p < .0001), and spectral power (χ2(7) = 52.37, p < .0001). Inclusion rates for connectivity were similar across the high-density pipelines (93 – 99%, p’s ≥ .009). Among the low-density pipelines, the inclusion rates for MADE-BONDld were lower than those for both HAPPILEE and miniMADE (87% for MADE-BONDld, 98% for both HAPPILEE and miniMADE, p’s = .0001). The same pattern was observed for inclusion rates for spectral power, with lower inclusion rates for MADE-BONDld than for the other low-density pipelines (88 vs. 98%, p’s = .0001), and no differences among the high-density pipelines (94–99%, p’s ≥ .016).
Table 2. Inclusion rates out of 131 participants (numbers and percentages).
| All epochs | For connectivity | For power | Insufficient
data | No data |
|---|
| P1 – Manual | 129 / 98% | 129 / 98% | 0 / 0% | 2 / 2% |
| P2 – MADE | 124 / 95% | 127 / 97% | 2 / 2% | 2 / 2% |
| P3 – MADE-BOND | 126 / 96% | 127 / 97% | 0 / 0% | 4 / 3% |
| P4 – HAPPE v1 | 122 / 93% | 123 / 94% | 0 / 0% | 8 / 6% |
| P5 – HAPPE v4 | 130 / 99% | 130 / 99% | 0 / 0% | 1 / 1% |
| P6 – MADE-BOND ld | 114 / 87% | 115 / 88% | 0 / 0% | 16 / 12% |
| P7 – HAPPILEE | 129 / 98% | 129 / 98% | 0 / 0% | 2 / 2% |
| P8 – miniMADE | 128 / 98% | 129 / 98% | 0 / 0% | 2 / 2% |
| Condition differences | For connectivity | For power | Insufficient
data | No data
for both
conditions |
|---|
| P1 – Manual | 128 / 98% | 128 / 98% | 1 / 1% | 2 / 2% |
| P2 – MADE | 114 / 87% | 124 / 95% | 5 / 4% | 2 / 2% |
| P3 – MADE-BOND | 121 / 92% | 125 / 95% | 2 / 2% | 4 / 3% |
| P4 – HAPPE v1 | 121 / 92% | 121 / 92% | 2 / 2% | 8 / 6% |
| P5 – HAPPE v4 | 129 / 98% | 129 / 98% | 1 / 1% | 1 / 1% |
| P6 – MADE-BOND ld | 111 / 85% | 113 / 86% | 2 / 2% | 16 / 12% |
| P7 – HAPPILEE | 128 / 98% | 128 / 98% | 1 / 1% | 2 / 2% |
| P8 – miniMADE | 120 / 92% | 127 / 97% | 2 / 2% | 2 / 2% |
For analyses focusing on condition differences, inclusion rates differed between pipelines for both connectivity (χ2(7) = 53.25, p < .0001), and spectral power (χ2(7) = 49.63, p < .0001). Inclusion rates using connectivity pre-processed with MADE (87%) were lower than those for the manual pipeline (98%, p = .0005) and HAPPEv4 (98%, p = .0001), with no other differences among the high-density pipelines. Among the low-density pipelines, the inclusion rates were lower for the MADE-BONDld pipeline than for the HAPPILEE pipeline (85 vs. 98%, p < .0001). For spectral power, the inclusion rates were similar among the high-density pipelines (92–98%, p’s ≥ .009). The low-density MADE-BONDld pipeline (86%) displayed lower inclusion rates than both HAPPILEE (98%) and miniMADE (97%, p’s = .0001).
Comparisons between pipelines
An overview of the power and connectivity spectra and individual output metrics per frequency band from each pipeline is presented in Figure 2. Figure 3 displays the ICCs for power and connectivity across all epochs and for condition differences.
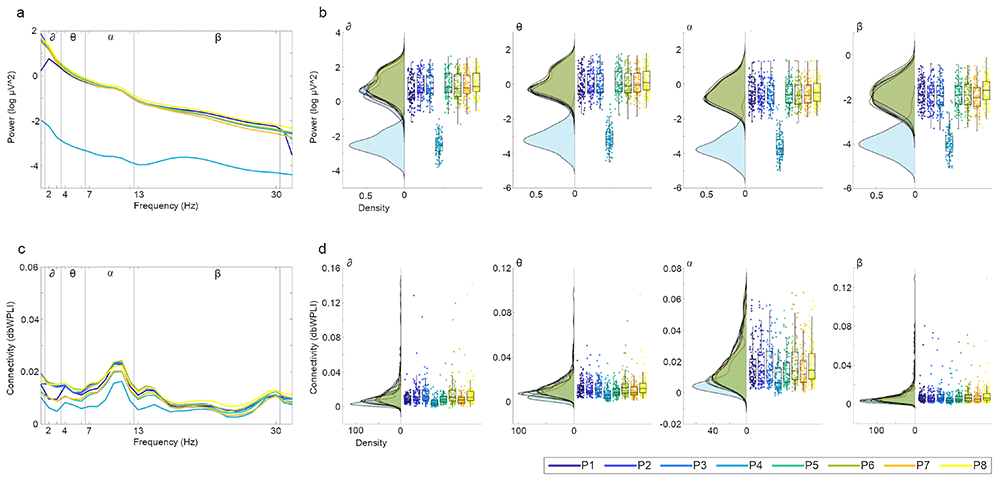
Figure 2. Global power and connectivity output metrics across pipelines.
a) Power spectrum (log, 1–32Hz) across all channels and conditions for each pipeline, averaged across the sample. b) Distributions of individual-level mean power across channels and condition within canonical delta (δ), theta (θ), alpha (α), and beta (β) frequency bands. c) Connectivity spectrum (dbWPLI, 1–32Hz) across all channel pairs and conditions for each pipeline, averaged across the sample. d) Distributions of individual-level mean connectivity across all channel pairs and conditions within canonical delta (δ), theta (θ), alpha (α), and beta (β) frequency bands. Colours represent different pipelines: P1 – manual, P2 – MADE, P3 – MADE-BOND, P4 – HAPPEv1, P5 – HAPPEv4, P6 – MADE-BONDld, P7 – HAPPILEE, and P8 – miniMADE. Panels b and d were made using 50.
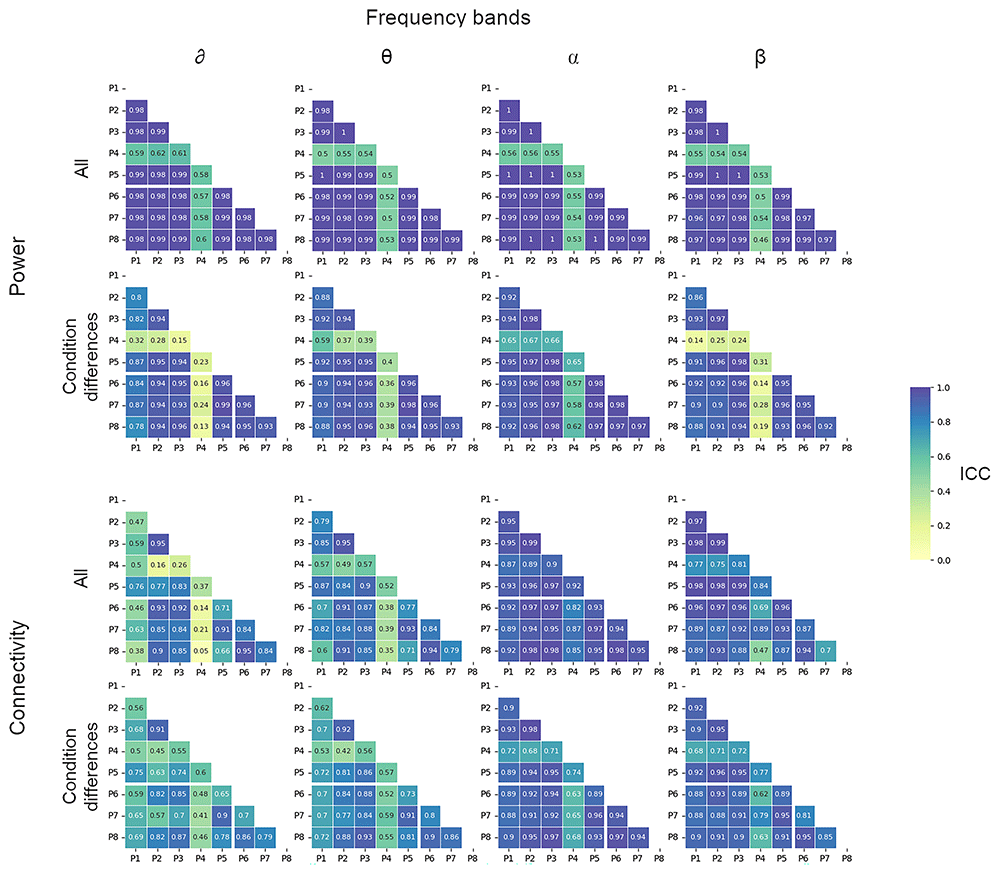
Figure 3. Comparisons between pipelines.
Intra-class correlation values for spectral power (log transformed) across conditions (first row) and for condition differences (social – non-social, second), and for connectivity (dbWPLI) across conditions (third), and for condition differences (fourth row) between pipelines for delta (δ), theta (θ), alpha (α), and beta (β) frequency bands (across columns). P# represent pipelines: P1 – manual, P2 – MADE, P3 – MADE-BOND, P4 – HAPPEv1, P5 – HAPPEv4, P6 – MADE-BONDld, P7 – HAPPILEE, and P8 – miniMADE.
Spectral power. A total of 105 participants had sufficient artifact-free epochs across and within separate conditions for data pre-processed with all eight pipelines for spectral power analyses (≥ 20 epochs). Across all epochs, ICCs were excellent between all pipelines across the different frequency bands, except for ICCs including HAPPEv1 (Figure 3, top half). The ICCs with HAPPEv1 (P4) and other pipelines are in the fair and good range (.50 ≥ ICCs ≥ .61) rather than the excellent range. Comparisons among the other seven pipelines showed very high consistency (.97≥ ICCs ≥ 1). For condition differences, ICCs among the seven pipelines showed excellent ICCs (.77 ≥ ICCs ≥ .98), whereas those including HAPPEv1 (P4) showed ICCs in the fair to good range for alpha band power (.57 ≥ ICCs ≥ .67), poor to fair range for theta band power (.36 ≥ ICCs ≥ .59), and poor range for delta and beta band power (.13 ≥ ICCs ≥ .32).
Statistical comparisons between the ICCs among the high-density pipelines revealed that the ICCs between the manual and HAPPEv1 pipeline were lower than the ICCs between the manual and the other high-density pipelines for different frequency bands across all epochs and for condition differences (5.14 ≤ test statistic ≤ 20.06, p’s < .0001, Figure 4, top half). The ICCs between the manual and MADE pipelines were very similar to the ICCs between the manual and HAPPEv5 pipeline, particularly for beta and alpha frequency bands across all epochs (0.15 ≤ test statistic ≤ 2.11, p’s ≥ .037). The ICC between the manual and MADE-BOND pipelines showed similar consistency with the manual vs. MADE pipeline across all epochs (0.15 ≤ test statistic ≤ 2.74, p’s ≥ .007), but higher ICCs with the manual pipeline for theta, alpha, and beta frequencies for condition differences (3.28 ≤ test statistic ≤ 8.45, p’s ≤ .001). For low vs. high-density pipelines, the ICCs between the MADE and MADE-BOND vs. miniMADE pipelines were similar to the ICC between the HAPPEv4 and HAPPILEE pipelines for all epochs and condition differences (0.03≤ test statistic ≤ 0.85, p’s ≥ .394). When comparing the MADE-BOND pipeline with the MADE-BONDld and miniMADE pipelines, miniMADE provided higher consistency with MADE-BOND than MADE-BONDld for delta, theta, and alpha across all epochs (3.01 ≤ test statistic ≤ 5.71, p’s ≤ .003), but higher consistency for beta for condition differences (test statistic = 3.74, p = .003).
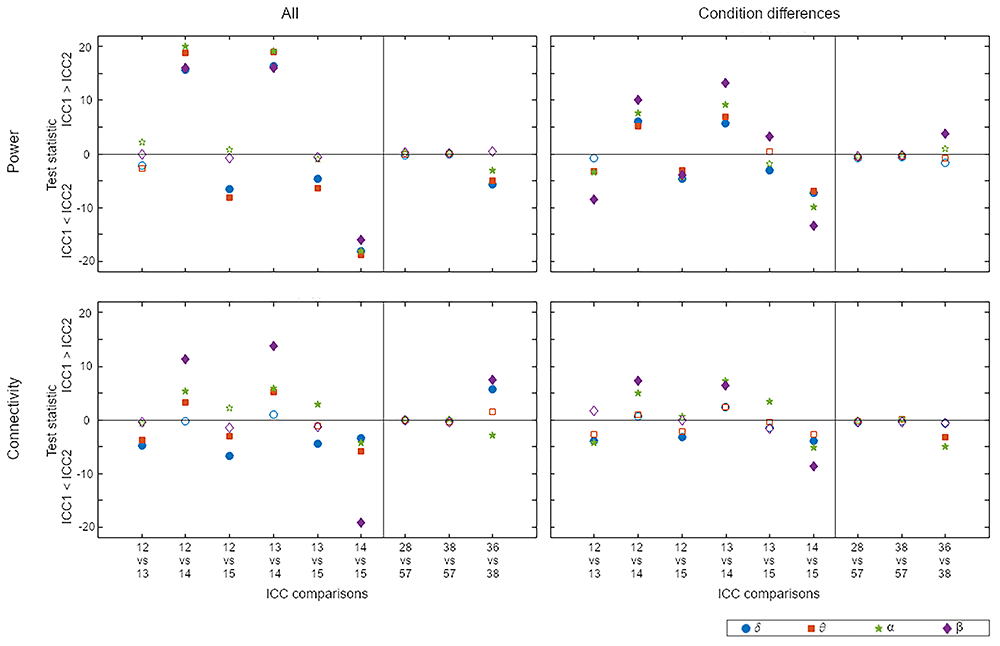
Figure 4. Comparison of ICCs.
Test statistics between ICCs from different pipeline combinations for power (top row) and connectivity (bottom row) across all epochs (left column) and for condition differences (right column) for each of the pipeline combinations for different frequency bands (delta (δ) in blue circles, theta (θ) in red squares, alpha (α) in green pentagrams, and beta (β) in purple diamonds). Filled markers represent comparisons reaching significance after Bonferroni correction. Numbers on the x-axis represent comparisons of ICCs between pipeline: e.g. 12 vs 13 reflects the z-difference between the ICCs between pipeline 1 and 2 vs pipeline 1 and 3, where 1 – manual, 2 – MADE, 3 – MADE-BOND, 4 – HAPPEv1, 5 – HAPPEv4, 6 – MADE-BONDld, 7 – HAPPILEE, and 8 – miniMADE..
These results suggest that the output of the newer version of the HAPPE is more consistent with the output from other pipelines than the HAPPE legacy version. Patterns were consistent between the power calculated across all conditions and for the condition differences. In addition, the adapted MADE-BOND pipeline shows comparable results to the MADE pipeline when comparing consistencies with the manual pipeline on a high-density layout, but lower consistency on low-density layout.
Functional connectivity. Comparisons of functional connectivity were based on a sample of 98 participants with sufficient artifact-free epochs across and within separate conditions for all eight pipelines (≥90 epochs). For connectivity across all epochs, ICCs were excellent overall between all eight pipelines in the alpha and beta frequency bands (.70 ≥ ICCs ≥ .99), apart from the beta band between HAPPEv1 and miniMADE with a fair ICC (ICCP4 vs P8 = .47, see Figure 3, bottom half). In the theta band, ICC values with HAPPEv1 were in the fair range (.35 ≥ ICCs ≥ .57), whereas the other combinations were in the good to excellent range (.60 ≥ ICCs ≥ .95). ICCs in the delta band revealed lower values: ICCs were between .38 and .76 for comparisons including the manual pipeline (P1) and varying from .05 to .37 in the poor range for comparisons including HAPPEv1 (P4). Comparisons among the other automated pipelines were within the good to excellent range (.66 ≥ ICCs ≥ .95).
For condition differences, ICC values were in the good to excellent range in the alpha and beta bands for comparisons including HAPPEv1 (P4: .62 ≥ ICCs ≥ .79) and in the excellent range for comparisons among the other seven pipelines (.81 ≥ ICCs ≥ .98, also see Figure 4, bottom half). In the delta and theta frequency bands, ICCs varied more ranging between .41 and .93. Comparisons including the manual pipeline (P1) comparisons were slightly lower than values between pairs of the automated pipelines (excluding HAPPEv1), although this was in the fair to good range: .56 ≥ ICCsDelta ≥ .75 and .62 ≥ ICCsTheta ≥ .72 for comparisons with P1, and .57 ≥ ICCsDelta ≥ .91 and .73 ≥ ICCsTheta ≥ .93 for comparisons with the other pipelines. Finally, the values for comparisons including HAPPEv1 (P4) were in the fair to good range: .41 ≥ ICCsDelta ≥ .60 and .42 ≥ ICCsTheta ≥ .57.
Statistical comparisons between the connectivity ICCs with the manual pipeline and others revealed a similar pattern to those for spectral power, but with less extreme values for the test statistics. The ICCs between the manual pipeline and HAPPEv1 were overall lower than those of the other high-density pipelines for most frequency bands across all epochs and for alpha and beta frequencies for condition differences (3.31 ≤ absolute test statistic ≤ 19.17, p’s ≤ .001). The ICCs between the manual and MADE-BOND pipeline were higher than with the MADE pipeline for delta and theta across all epochs (3.65 ≤ absolute test statistic ≤ 4.80, p’s < .0001), and for delta and alpha for condition differences (2.75 ≤ absolute test statistic ≤ 3.83, p’s ≤ .007). As with power values, ICCs with the manual pipeline were higher for the newer HAPPEv4 than HAPPEv1 for across all epochs and condition differences (3.40 ≤ absolute test statistic ≤ 19.17, p’s ≤ .0001), except for theta connectivity differences (test statistic = -2.71, p = .008). For low vs high-density pipelines, the ICCs between the MADE and MADE-BOND vs. miniMADE pipelines showed no differences compared to the ICC between the HAPPEv4 and HAPPILEE pipeline for both all epochs and condition differences (0.04 ≤ absolute test statistic ≤ 0.39, p’s ≥ .693).
These findings suggest that the resulting connectivity values from the MADE and newer HAPPE pipelines are consistent with those from the manual pipeline, particularly for lower frequencies. The adapted MADE-BOND pipeline showed higher consistency with the manual pipeline than with the original MADE pipeline.
Comparisons within pipelines
Figure 5 presents the results of the split-half reliability analyses for power in a sample of 103 participants with sufficient data. Correlations between power values within pipelines were excellent when calculated across all epochs and for all frequency bands (Spearman’s ρ = .99 or 1 for all comparisons). For split-half reliability for condition differences, correlations were in the poor to excellent range and overall increased with the frequency band (delta < theta < alpha < beta). For the manual pipeline (P1), the correlations were in the poor to excellent range (.35 ≥ Spearman’s ρ ≤ .94). HAPPEv1 (P4) exhibited correlations in the poor to good range (.28 ≥ Spearman’s ρ ≤ .59). Correlations for split half in the other automated high-density and all low-density pipelines (MADE, MADE-BOND, HAPPEv4, MADE-BONDld, HAPPILEE, and miniMADE) were consistently in the good to excellent range, varying between ρ = .59 and ρ = .95.
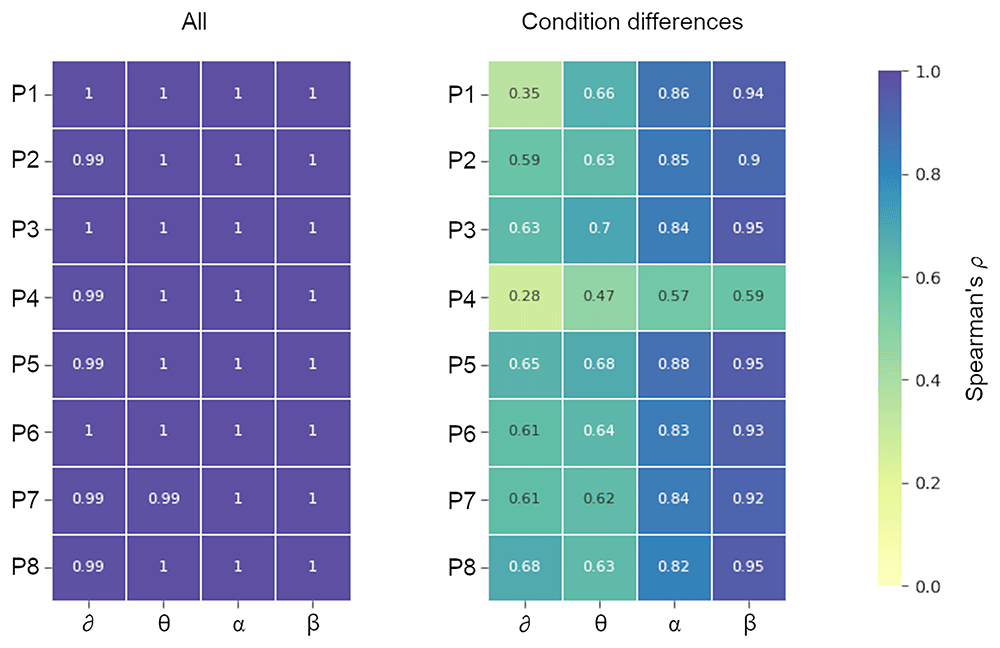
Figure 5. Comparisons within pipelines.
Spearman’s correlation coefficients for spectral power (log-transformed) calculated from odd and even epochs across all conditions (left) and for condition differences (social – non-social, right) for the delta, theta, alpha, and beta frequency bands. P# represent pipelines: P1 – manual, P2 – MADE, P3 – MADE-BOND, P4 – HAPPEv1, P5 – HAPPEv4, P6 – MADE-BONDld, P7 – HAPPILEE, and P8 – miniMADE.
Discussion
The neuroimaging method EEG is becoming an increasing focus in the search for biomarkers for neurodevelopmental conditions owing to the low cost and scalability of the method. This emphasizes the need to develop analytic approaches that are standardized and accessible to researchers. Compared to manual pipelines, automated EEG pipelines decrease researcher bias and pre-processing time, while providing a more objective approach to artifact identification. It is important to understand how the choice of pipeline affects the resulting EEG metrics to further biomarker discovery research.
A comparison of different pipelines raises the philosophical question of how to determine which pipeline performs optimally. The MADE and HAPPE pipelines were developed and validated using data from relatively small samples15,17. Researchers typically calculate the percentage of data retained, the presence of residual artifacts, or inclusion rates as proof of the validity of their pipeline. However, the effects of different pipelines on EEG values going into the statistical analyses have often been overlooked. This is essential to consider for the scientific field as we are integrating and comparing findings from different studies for biomarker research. Metrics should ideally be stable across repeated measurements, that is, they should show good test-retest reliability. Furthermore, they should show stability within a session, that is, showing good split-half reliability51. The degree of reliability is critical, because it affects the likelihood of finding significant associations. True correlations are attenuated by the degree of reliability, such that metrics with low reliability limit the size of the observable correlation52. To illustrate, if 2 metrics both have a reliability of ICC = .60, and the true correlation is r = .50, then the observable correlation will be r = .3053. Researchers will be limited by the reliability of the measures used. Another option to increase the likelihood of detecting brain–behavior associations would be to increase the sample size to thousands of participants54,55. However, a recent study suggested that this is valid only for measures with high reliability56.
Excellent reliability however may not be the answer to the issue of detecting individual differences and strong replicable brain-behavior associations. According to findings from cognitive psychology, there is a reliability paradox53. Measures from robust paradigms with high reliability are typically not suitable for correlational research because they result in low variance between individuals and an inability to distinguish between individuals. This high reliability may be related to confounding factors other than the construct the measure is supposed to reflect, which, in turn, would affect construct validity51. For example, the high reliability between EEG metrics can result from residual artifacts that are highly stable, such as volume conduction, scalp thickness, or cardiac activity57. This low intra-individual variance is problematic for biomarker research, where researchers aim to identify associations between the brain and clinical behavior. Overall, this suggests that the scientific field should more carefully consider the different features of measurements, such as inclusion and reliability for biomarker research.
In the current study, we compared both the inclusion rates and the reliability of EEG metrics from EEG data preprocessed using different automated approaches. Researchers typically face a trade-off between data quality (maximizing data quality while decreasing inclusion rates) and data quantity (maximizing inclusion rates at the expense of data quality14). In clinical neurodevelopmental studies, participants are difficult to recruit, and researchers typically want to prioritize data quantity (particularly for studies focusing on rare conditions such as Neurofibromatosis 1, Phelan-McDermid Syndrome, or NRXN1 deletions). High inclusion rates additionally reflect more representative samples due to the lack of inclusion biases towards participants with certain characteristics (e.g., very attentive and sitting still), and an increased likelihood of detecting small effects due to larger sample sizes. Our results suggest that inclusion rates are very similar across the high-density pipelines, including the manual pipeline. Among the low-density pipelines, the miniMADE and HAPPILEE pipelines provided similar inclusion rates, which were higher than that of the MADE-BONDld pipeline. However, caution should be exercised when selecting pipelines based only on the inclusion rates. There is a risk that excessive cleaning and artifact rejection might result in the removal of the brain signal from the data and loss of statistical power58. The inclusion rate for the manual pipeline is 98%, suggesting that not all artifacts can be sufficiently corrected for. It would be useful to consider other metrics, in addition to data quantity, when selecting pipelines and interpreting the differences in findings across studies.
Other metrics to consider would be the consistency of outcome values compared to golden standard pipelines using intraclass correlations and within pipelines using split-half reliability. Our findings revealed that EEG metrics are generally consistent between the manual and automated pipelines, and within the pipelines, with the exception of HAPPEv1. This is likely due to the different approach used for wavelet thresholding in the legacy pipeline compared with the newer versions of the HAPPE pipeline18, resulting in a flatter power spectrum with a lower offset for HAPPEv1 than for the other pipelines. Other settings in HAPPEv1 may also have resulted in lower between and within pipeline reliability, such as the use of MARA, default amplitude threshold, or filter settings. For the other automated high-density pipelines, the EEG metrics showed good consistency with the manual pipeline for between-pipeline comparisons and for EEG metrics within sessions. The resulting EEG metrics between the MADE and HAPPE family pipelines are largely comparable, even when using different approaches and algorithms (FASTER24, adjusted-ADJUST25, and wavelet thresholding18). Our adapted MADE-BOND pipeline also showed ICCs similar to those of the manual pipeline and the other high-density pipelines. This indicates that the results from automated pipelines can be highly comparable to those of manual pipelines considered as the gold standard. Moreover, the results of different biomarker studies using these high-density pipelines may be relatively comparable.
Low-density pipelines were also included in this study to complement our high-density pipelines. Low-density EEG is more often used in developmental studies, as there is increased interest in EEG methodology, and recent technological developments allow for wireless and mobile systems. Our between pipeline analyses revealed that the ICCs between the low- and high-density versions of the MADE and HAPPE pipeline families were very similar. The split-half reliabilities of HAPPILEE and miniMADE also showed high values. This suggests that the adaptations made from HAPPE and MADE for lower-density layouts provide similar results. Indeed, running the MADE-BOND pipeline on a lower-density layout without any adjustments demonstrated lower inclusion rates and lower consistency with miniMADE and HAPPILEE. This highlights the importance of using pre-processing pipelines developed for similar density layouts as the recorded data59.
Consistent with previous studies, we also observed general patterns in the reliabilities of different EEG metrics of interest. First, there is variability in the reliabilities of frequency bands of interest. There were stronger differences between pipelines for beta and alpha frequencies than for theta and delta frequencies, as previously found59–62. Alpha band oscillations typically have a higher signal-to-noise ratio than other frequency bands63,64. Beta oscillations are traditionally more difficult to measure because of their susceptibility to muscle artifacts43. However, we find that after rejecting artifacts, oscillations in the beta range are more reliable. Different pipelines may have different cleaning performances, resulting in varying signal-to-noise ratios at different frequencies. From a mathematical perspective, the relatively short 1-second segments may be less accurate in picking up lower frequencies than higher alpha and beta band frequencies65. Second, spectral power metrics revealed an overall higher reliability between pipelines than connectivity metrics, as in previous findings59. We used the debiased weighted phase lag index as the connectivity measure in this study. It is possible that this phase-based measure is affected differently by the varying approaches to identify and correct or reject artifacts compared to spectral power, which is based on both the amplitude and phase of the signal. Third, we found stronger differences between ICCs with the manual pipeline across all epochs compared to ICCs for condition differences. This is inconsistent with previous neuroimaging findings that show higher test-retest correlations for direct estimates than for derived estimates33,61,66. However, our findings are in line with the guidelines in autism developmental research advising the examination of condition differences rather than values from one condition14. Together, these patterns highlight the need for consistency across laboratories and pipelines in clinical and developmental research, particularly when the focus is on alpha and beta frequency activity7,13,38,67–70.
We note that the current study only included a comparison of a manual pipeline and the original and adapted versions of two well-known automated pipeline families. We opted for these two pipeline families as they were the ones most frequently used and promising in clinical samples at the start of this project7,22,23,26,27. In addition, they were suitable for the analyses of continuous paradigms, such as resting state and dynamic videos, and their validated datasets were collected in more similar age groups as the current dataset. For example, the EEG Integrated Platform Lossless (EEG-IP-L) pipeline was validated on a dataset with 7-month-old infants during an event-related paradigm71, whereas the Automated Pipeline for Infants Continuous EEG (APICE) was validated on event-related data from neonates and 5-month-olds20. APICE uses a new algorithm named iMARA that has been developed specifically for infants and demonstrates better artifact identification in infant data compared to the MARA algorithm72. Recently, the DISCOVER-EEG pipeline has been developed to examine potential biomarkers in clinical research21. We further note that the focus of the current study was the variation of the resulting EEG metrics, and we therefore did not compare commonly used metrics of pipeline performance, such as percentage of epochs retained, percentage of ICs removed, or estimates of variance retained. However, we included the number of artifact-free epochs sufficient for the extraction of the metrics of interest. In addition, this information is not readily available as an output from the manual pipeline. Future studies should focus on the convergence of EEG metrics, inclusion rates, and data quantity retained in heterogeneous developmental populations when validating novel pipelines. The field may also benefit from developing a large test dataset, including EEG data with varying artifact levels, recorded with different EEG layouts, both continuous and event-related paradigms, and participants from a wide background73. Another direction for future research is to conduct multiple analyses and map the interrelations between results from different analytic pipelines and parameter decisions, as has been previously done for fMRI neuroimaging methods74. However, the current findings suggest that the metrics produced by the different pipelines are not radically different.
Conclusions
There is increasing concern about how different analytic approaches to neuroimaging data map on each other and may lead to similar or different outcome metrics. Our current findings revealed high consistency between both high- and low-density pipelines for EEG data and good internal consistency, reflected by high split-half reliability. Overall, this suggests the robustness of EEG measures.
Furthermore, the resulting EEG metrics from EEG pre-processing pipelines and their reliability should be evaluated when developing pipelines for studies. The effect of different pre-processing steps on metrics is masked if researchers focus only on the inclusion rates and percentages of data retained. We argue that more attention should be paid to the key metrics that researchers are interested in while developing and validating EEG pre-processing pipelines. Our study suggests that a developmental EEG pre-processing pipeline, such as MADE or the latest version of HAPPE, is sufficiently robust to perform well in a sample that includes a wide age range. In contrast, we do not recommend using the legacy HAPPEv1 for application to EEG data that is not recorded in infants or toddlers. Ideally, EEG pipelines will be able to handle EEG data pre-processing across a wide range of situations, for datasets collected in participants from infancy to adulthood and diverse neurodevelopmental backgrounds, for low- and high-density EEG recordings, and for both event-related and resting state paradigms, but different approaches may be needed for different EEG metrics. An important next step is to explore the parameter space and test how different analytic decisions affect the resulting EEG metrics using a multiverse approach74.
Ethics and consent
This study and data sharing protocol was approved by the independent ethics committees at the collection sites (site(s), ethics committee name, ethics approval number, date of approval): for CIMH: UMM Universitätsmedizin Mannheim, Medizinische Ethik Kommission II (UMM University Medical Mannheim, Medical Ethics Commission II), 2014-540N-MA, 24th of June, 2014; for KCL: London-Central and Queen Square Health Research Authority Research Ethics Committee, 13/LO/1156, 3rd of October, 2013; for RUMCU and UMCU: Radboud universitair medisch centrum Instituut Waarborging Kwaliteit en Veiligheid Commissie Mensgebonden Onderzoek Regio Arnhem-Nijmegen (Radboud University Medical Centre Institute Ensuring Quality and Safety Committee on Research Involving Human Subjects Arnhem-Nijmegen), 2013/455, 15th of November, 2013 ; for UCBM: Universita Campus Bio-Medica De Roma Comitato Etico (University Campus Bio-Medical Ethics Committee De Roma), 18/14 PAR ComET CBM, 25th of February, 2014. Written informed consent was given by the participants (and caregivers where appropriate) at the start of each session.
Written informed consent was obtained from the participants (where appropriate) and their parent/legal guardians prior to the start of the study. Study protocol was in adherence with the Declaration of Helsinki.
Data availability
Underlying data
This project contains the following underlying data:
Following funder requirements, LEAP data is shared based on participant consent for ethical reasons. AIMS LEAP participants were asked for their consent preferences regarding data sharing beyond the AIMS consortium. For those who indicated 'No' to data sharing beyond the AIMS consortium, their data are restricted and cannot be shared. For those who indicated 'Yes' to data sharing beyond the AIMS consortium, their data will be shared via ELIXIR-LU. The consortium liaised to have a shared set of consent documentation. Consent forms for participants allowing for this differentiation for data sharing beyond the consortium were reviewed and approved by the ethics committee at each site.
Those who wish to access AIMS LEAP data via ELIXIR-LU (anticipated to launch by July 2025) will need to submit a project proposal via the ELIXIR-LU platform. In the meantime, individual requests for data access specific to this manuscript can be made in writing to the authors (Prof. Emily J.H. Jones via e.jones@bbk.ac.uk) and will be considered on a case-by-case basis.
Extended data
Repository name: Extended Data for ‘Comparison of EEG pre-processing pipelines for spontaneous EEG data in a large neurodivergent cohort’. https://osf.io/yh8vf/75
This project contains the following extended data:
Example consent forms (English for KCL in the United Kingdom, German for CIMH in Germany, and Dutch for RUMC and UMCU in the Netherlands).
Example information forms (English for KCL in the United Kingdom, German for CIMH in Germany, and Dutch for RUMC and UMCU in the Netherlands).
The dynamic videos used during the EEG battery are not shared publicly but can be acquired via a request made in writing to the last author (Prof. Emily J.H. Jones via e.jones@bbk.ac.uk). The videos cannot be shared via the platform due the protection of the privacy of the actors in them.
Software availability
- MATLAB Source code available from: Github76, version v1.0.1. Note, this is adapted code used for this study specific analysis and figure. For the original code for the EEG pipelines, we refer the reader to the corresponding scientific publications: the manual pipeline13, the MADE and miniMADE pipelines15,16, and the HAPPEv1, HAPPEv4, and HAPPILEE pipelines17–19.
- Archived software available from: 10.5281/zenodo.15112005
- License: GNU General Public License v3.0 only
Acknowledgements
We thank all participants and their families for participating in this study. We also gratefully acknowledge the contributions of all the members of the EU-AIMS LEAP group.
The EU-AIMS LEAP group authorship: Jumana Ahmad, Sara Ambrosino, Bonnie Auyeung, Tobias Banaschewski, Simon Baron-Cohen, Sarah Baumeister, Christian F. Beckmann, Sven Bölte, Thomas Bourgeron, Carsten Bours, Michael Brammer, Daniel Brandeis, Claudia Brogna, Yvette de Bruijn, Bhismadev Chakrabarti, Tony Charman, Ineke Cornelissen, Daisy Crawley, Flavio Dell’Acqua, Guillaume Dumas, Sarah Durston, Christine Ecker, Jessica Faulkner, Vincent Frouin, David Goyard, Lindsay Ham, Hannah Hayward, Rosemary Holt, Prantik Kundu, Meng-Chuan Lai, Xavier Liogier D’ardhuy, Michael V. Lombardo, David J. Lythgoe, René Mandl, Andre Marquand, Maarten Mennes, Andreas Meyer-Lindenberg, Carolin Moessnang, Nico Mueller, Bethany Oakley, Laurence O’Dwyer, Marianne Oldehinkel, Bob Oranje, Gahan Pandina, Antonio M. Persico, Barbara Ruggeri, Amber Ruigrok, Jessica Sabet, Roberto Sacco, Antonia San José Cáceres, Emily Simonoff, Will Spooren, Julian Tillmann, Roberto Toro, Heike Tost, Jack Waldman, Steve C.R.Williams, Caroline Wooldridge, and Marcel P. Zwiers.
Faculty Opinions recommendedReferences
- 1.
Pfurtscheller G, Lopes Da Silva FH:
Event-related EEG/MEG synchronization and desynchronization: basic principles.
Clin Neurophysiol.
1999; 110(11): 1842–1857. PubMed Abstract
| Publisher Full Text
- 2.
Buzsáki G, Anastassiou CA, Koch C:
The origin of extracellular fields and currents--EEG, ECoG, LFP and spikes.
Nat Rev Neurosci.
2012; 13(6): 407–420. PubMed Abstract
| Publisher Full Text
| Free Full Text
- 3.
Mason L, Moessnang C, Chatham C, et al.:
Stratifying the autistic phenotype using electrophysiological indices of social perception.
Sci Transl Med.
2022; 14(658): eabf8987. PubMed Abstract
| Publisher Full Text
- 4.
Webb SJ, Shic F, Murias M, et al.:
Biomarker acquisition and Quality Control for multi-site studies: the Autism Biomarkers Consortium for Clinical Trials.
Front Integr Neurosci.
2020; 13: 71. PubMed Abstract
| Publisher Full Text
| Free Full Text
- 5.
Pernet C, Garrido MI, Gramfort A, et al.:
Issues and recommendations from the OHBM COBIDAS MEEG committee for reproducible EEG and MEG research.
Nat Neurosci.
2020; 23(12): 1473–1483. PubMed Abstract
| Publisher Full Text
- 6.
Parellada M, San José Cáceres A, Palmer M, et al.:
A phase II randomized, double-blind, placebo-controlled study of the efficacy, safety, and tolerability of arbaclofen administered for the treatment of social function in children and adolescents with Autism Spectrum Disorders: study protocol for AIMS-2-TRIALS-CT1.
Front Psychiatry.
2021; 12: 701729. PubMed Abstract
| Publisher Full Text
| Free Full Text
- 7.
Levin AR, Naples AJ, Scheffler AW, et al.:
Day-to-day test-retest reliability of EEG profiles in children with Autism Spectrum Disorder and Typical Development.
Front Integr Neurosci.
2020; 14: 21. PubMed Abstract
| Publisher Full Text
| Free Full Text
- 8.
Webb SJ, Jones EJH, Merkle K, et al.:
Response to familiar faces, newly familiar faces, and novel faces as assessed by ERPs is intact in adults with Autism Spectrum Disorders.
Int J Psychophysiol.
2010; 77(2): 106–117. PubMed Abstract
| Publisher Full Text
| Free Full Text
- 9.
Webb SJ, Merkle K, Murias M, et al.:
ERP responses differentiate inverted but not upright face processing in adults with ASD.
Soc Cogn Affect Neurosci.
2012; 7(5): 578–587. PubMed Abstract
| Publisher Full Text
| Free Full Text
- 10.
Jones EJH, Venema K, Lowy R, et al.:
Developmental changes in infant brain activity during naturalistic social experiences.
Dev Psychobiol.
2015; 57(7): 842–853. PubMed Abstract
| Publisher Full Text
| Free Full Text
- 11.
Haartsen R, Charman T, Pasco G, et al.:
Modulation of EEG theta by naturalistic social content is not altered in infants with family history of autism.
Sci Rep.
2022; 12(1): 20758. PubMed Abstract
| Publisher Full Text
| Free Full Text
- 12.
Haartsen R, Jones EJH, Orekhova EV, et al.:
Functional EEG connectivity in infants associates with later restricted and repetitive behaviours in autism; a replication study.
Transl Psychiatry.
2019; 9(1): 66. PubMed Abstract
| Publisher Full Text
| Free Full Text
- 13.
Garcés P, Baumeister S, Mason L, et al.:
Resting state EEG power spectrum and functional connectivity in autism: a cross-sectional analysis.
Mol Autism.
2022; 13(1): 22. PubMed Abstract
| Publisher Full Text
| Free Full Text
- 14.
Webb SJ, Bernier R, Henderson HA, et al.:
Guidelines and best practices for electrophysiological data collection, analysis and reporting in autism.
J Autism Dev Disord.
2015; 45(2): 425–43. PubMed Abstract
| Publisher Full Text
| Free Full Text
- 15.
Debnath R, Buzzell GA, Morales S, et al.:
The Maryland Analysis of Developmental EEG (MADE) pipeline.
Psychophysiology.
2020; 57(6): e13580. PubMed Abstract
| Publisher Full Text
- 16.
Troller-Renfree SV, Morales S, Leach SC, et al.:
Feasibility of assessing brain activity using mobile, in-home collection of Electroencephalography: methods and analysis.
Dev Psychobiol.
2021; 63(6): e22128. PubMed Abstract
| Publisher Full Text
| Free Full Text
- 17.
Gabard-Durnam LJ, Mendez Leal AS, Wilkinson CL, et al.:
The Harvard Automated Processing Pipeline for Electroencephalography (HAPPE): standardized processing software for developmental and high-artifact data.
Front Neurosci.
2018; 12: 97. PubMed Abstract
| Publisher Full Text
| Free Full Text
- 18.
Lopez KL, Monachino AD, Morales S, et al.:
HAPPILEE: HAPPE In Low Electrode Electroencephalography, a standardized pre-processing software for lower density recordings.
NeuroImage.
2022; 260: 119390. PubMed Abstract
| Publisher Full Text
| Free Full Text
- 19.
Monachino AD, Lopez KL, Pierce LJ, et al.:
The HAPPE plus Event-Related (HAPPE+ER) software: a standardized preprocessing pipeline for event-related potential analyses.
Dev Cogn Neurosci.
2022; 57: 101140. PubMed Abstract
| Publisher Full Text
| Free Full Text
- 20.
Fló A, Gennari G, Benjamin L, et al.:
Automated Pipeline for Infants Continuous EEG (APICE): a flexible pipeline for developmental cognitive studies.
Dev Cogn Neurosci.
2022; 54: 101077. PubMed Abstract
| Publisher Full Text
| Free Full Text
- 21.
Ávila CG, Bott FS, Tiemann L, et al.:
DISCOVER-EEG: an open, fully automated EEG pipeline for biomarker discovery in clinical neuroscience.
Sci Data.
2023; 10(1): 613. PubMed Abstract
| Publisher Full Text
| Free Full Text
- 22.
Troller-Renfree SV, Brito NH, Desai PM, et al.:
Infants of mothers with higher physiological stress show alterations in brain function.
Dev Sci.
2020; 23(6): e12976. PubMed Abstract
| Publisher Full Text
| Free Full Text
- 23.
Hwang HG, Debnath R, Meyer M, et al.:
Neighborhood racial demographics predict infants’ neural responses to people of different races.
Dev Sci.
2021; 24(4): e13070. PubMed Abstract
| Publisher Full Text
| Free Full Text
- 24.
Nolan H, Whelan R, Reilly RB:
FASTER: Fully Automated Statistical Thresholding for EEG artifact Rejection.
J Neurosci Methods.
2010; 192(1): 152–162. PubMed Abstract
| Publisher Full Text
- 25.
Leach SC, Morales S, Bowers ME, et al.:
Adjusting ADJUST: optimizing the ADJUST algorithm for pediatric data using geodesic nets.
Psychophysiology.
2020; 57(8): e13566. PubMed Abstract
| Publisher Full Text
| Free Full Text
- 26.
Gabard-Durnam LJ, Wilkinson C, Kapur K, et al.:
Longitudinal EEG power in the first postnatal year differentiates autism outcomes.
Nat Commun.
2019; 10(1): 4188. PubMed Abstract
| Publisher Full Text
| Free Full Text
- 27.
Wilkinson CL, Gabard-Durnam LL, Kapur K, et al.:
Use of longitudinal EEG measures in estimating language development in infants with and without familial risk for Autism Spectrum Disorder.
Neurobiol Lang (Camb).
2020; 1(1): 33–53. PubMed Abstract
| Publisher Full Text
| Free Full Text
- 28.
Glauser J, Wilkinson CL, Gabard-Durnam LJ, et al.:
Neural correlates of face processing associated with development of social communication in 12-month infants with familial risk of Autism Spectrum Disorder.
J Neurodev Disord.
2022; 14(1): 6. PubMed Abstract
| Publisher Full Text
| Free Full Text
- 29.
Castellanos NP, Makarov VA:
Recovering EEG brain signals: artifact suppression with wavelet enhanced Independent Component Analysis.
J Neurosci Methods.
2006; 158(2): 300–312. PubMed Abstract
| Publisher Full Text
- 30.
Winkler I, Haufe S, Tangermann M:
Automatic classification of artifactual ICA-components for artifact removal in EEG signals.
Behav Brain Funct.
2011; 7: 30. PubMed Abstract
| Publisher Full Text
| Free Full Text
- 31.
Loth E, Charman T, Mason L, et al.:
The EU-AIMS Longitudinal European Autism Project (LEAP): design and methodologies to identify and validate stratification biomarkers for Autism Spectrum Disorders.
Mol Autism.
2017; 8: 24. PubMed Abstract
| Publisher Full Text
| Free Full Text
- 32.
Byrge L, Kliemann D, He Y, et al.:
Video-evoked fMRI BOLD responses are highly consistent across different data acquisition sites.
Hum Brain Mapp.
2022; 43(9): 2972–2991. PubMed Abstract
| Publisher Full Text
| Free Full Text
- 33.
Haartsen R, Mason L, Braithwaite EK, et al.:
Reliability of an automated gaze-controlled paradigm for capturing neural responses during visual and face processing in toddlerhood.
Dev Psychobiol.
2021; 63(7): e22157. PubMed Abstract
| Publisher Full Text
| Free Full Text
- 34.
Del Bianco T, Haartsen R, Jones EJH:
A phase II randomised, double blind, placebo-controlled study of effects of arbaclofen on periodic, aperiodic and event-related measures of EEG in autistic children and adolescents: pre-registration of processing and analysis plan. Open Science Framework. 2023. Publisher Full Text
- 35.
Del Bianco T, et al.:
The importance of decomposing periodic and aperiodic EEG signals for assessment of brain function in a global context.
PsyArXiv.
2023.
- 36.
Charman T, Loth E, Tillmann J, et al.:
The EU-AIMS Longitudinal European Autism Project (LEAP): clinical characterisation.
Mol Autism.
2017; 8: 27. PubMed Abstract
| Publisher Full Text
| Free Full Text
- 37.
Delorme A, Makeig S:
EEGLAB: an open source toolbox for analysis of single-trial EEG dynamics including Independent Component Analysis.
J Neurosci Methods.
2004; 134(1): 9–21. PubMed Abstract
| Publisher Full Text
- 38.
Orekhova EV, Elsabbagh M, Jones EJ, et al.:
EEG hyper-connectivity in high-risk infants is associated with later autism.
J Neurodev Disord.
2014; 6(1): 40. PubMed Abstract
| Publisher Full Text
| Free Full Text
- 39.
Oostenveld R, Fries P, Maris E, et al.:
FieldTrip: open source software for advanced analysis of MEG, EEG, and invasive electrophysiological data.
Comput Intell Neurosci.
2011; 2011: 156869. PubMed Abstract
| Publisher Full Text
| Free Full Text
- 40.
Vinck M, Oostenveld R, van Wingerden M, et al.:
An improved index of phase-synchronization for electrophysiological data in the presence of volume-conduction, noise and sample-size bias.
NeuroImage.
2011; 55(4): 1548–1565. PubMed Abstract
| Publisher Full Text
- 41.
Haartsen R, Jones EJH, Orekhova EV, et al.:
Functional EEG connectivity in infants associates with later restricted and repetitive behaviours in autism; a replication study.
Transl Psychiatry.
2019; 9(1): 66. PubMed Abstract
| Publisher Full Text
| Free Full Text
- 42.
Haartsen R, van der Velde B, Jones EJH, et al.:
Using multiple short epochs optimises the stability of infant EEG connectivity parameters.
Sci Rep.
2020; 10(1): 12703. PubMed Abstract
| Publisher Full Text
| Free Full Text
- 43.
Muthukumaraswamy SD:
High-frequency brain activity and muscle artifacts in MEG/EEG: a review and recommendations.
Front Hum Neurosci.
2013; 7: 138. PubMed Abstract
| Publisher Full Text
| Free Full Text
- 44.
McGraw KO, Wong SP:
Forming inferences about some intraclass correlation coefficients.
Psychol Methods.
1996; 1(1): 30–46. Publisher Full Text
- 45.
Field AP:
Intraclass correlation. In: Encyclopedia of statistics in behavioral science. (eds. Everitt, B. S. & Howell, D. C.) John Wiley & Sons, Ltd, Chichester, 2005; 2. : 948–954. Publisher Full Text
- 46.
Salarian A:
Intraclass Correlation Coefficient (ICC). MATLAB central file exchange, 2016. Reference Source
- 47.
Steiger JH:
Tests for comparing elements of a correlation matrix.
Psychol Bull.
1980; 87(2): 245–251. Publisher Full Text
- 48.
Williams EJ:
The comparison of regression variables.
J R Stat Soc Series B Stat Methodol.
1959; 21(2): 396–399. Publisher Full Text
- 49.
Luking KR, Nelson BD, Infantolino ZP, et al.:
Internal consistency of functional magnetic resonance imaging and electroencephalography measures of reward in late childhood and early adolescence.
Biol Psychiatry Cogn Neurosci Neuroimaging.
2017; 2(3): 289–297. PubMed Abstract
| Publisher Full Text
| Free Full Text
- 50.
Allen M, Poggiali D, Whitaker K, et al.:
Raincloud plots: a multi-platform tool for robust data visualization [version 1; peer review: 2 approved].
Wellcome Open Res.
2021; 4: 63. Publisher Full Text
- 51.
Karvelis P, Paulus MP, Diaconescu AO:
Individual differences in computational psychiatry: a review of current challenges.
Neurosci Biobehav Rev.
2023; 148: 105137. PubMed Abstract
| Publisher Full Text
- 52.
Spearman C:
The proof and measurement of association between two things.
Am J Psychol.
1904; 15(1): 72–101. Publisher Full Text
- 53.
Hedge C, Powell G, Sumner P:
The reliability paradox: why robust cognitive tasks do not produce reliable individual differences.
Behav Res Methods.
2018; 50(3): 1166–1186. PubMed Abstract
| Publisher Full Text
| Free Full Text
- 54.
Marek S, Tervo-Clemmens B, Calabro FJ, et al.:
Reproducible brain-wide association studies require thousands of individuals.
Nature.
2022; 603(7902): 654–660. PubMed Abstract
| Publisher Full Text
| Free Full Text
- 55.
Button KS, Ioannidis JPA, Mokrysz C, et al.:
Power failure: why small sample size undermines the reliability of neuroscience.
Nat Rev Neurosci.
2013; 14(5): 365–376. PubMed Abstract
| Publisher Full Text
- 56.
Gell M, Eickhoff SB, Omidvarnia A, et al.:
The burden of reliability: how measurement noise limits brain-behaviour predictions.
bioRxiv.
2023. Publisher Full Text
- 57.
Schmidt F, Danböck SK, Trinka E, et al.:
Age-related changes in “cortical” 1/f dynamics are linked to cardiac activity.
eLife.
2024. Publisher Full Text
- 58.
Delorme A:
EEG is better left alone.
Sci Rep.
2023; 13(1): 2372. PubMed Abstract
| Publisher Full Text
| Free Full Text
- 59.
Rolle CE, Narayan M, Wu W, et al.:
Functional connectivity using high density EEG shows competitive reliability and agreement across test/retest sessions.
J Neurosci Methods.
2022; 367: 109424. PubMed Abstract
| Publisher Full Text
- 60.
Hardmeier M, Hatz F, Bousleiman H, et al.:
Reproducibility of functional connectivity and graph measures based on the Phase Lag Index (PLI) and weighted Phase Lag Index (wPLI) derived from high resolution EEG.
PLoS One.
2014; 9(10): e108648. PubMed Abstract
| Publisher Full Text
| Free Full Text
- 61.
van der Velde B, Haartsen R, Kemner C:
Test-retest reliability of EEG network characteristics in infants.
Brain Behav.
2019; 9(5): e01269. PubMed Abstract
| Publisher Full Text
| Free Full Text
- 62.
Moezzi B, Hordacre B, Berryman C, et al.:
Test-retest reliability of functional brain network characteristics using resting-state EEG and graph theory.
bioRxiv.
2018; 385302. Publisher Full Text
- 63.
Bazanova OM, Vernon D:
Interpreting EEG alpha activity.
Neurosci Biobehav Rev.
2014; 44: 94–110. PubMed Abstract
| Publisher Full Text
- 64.
Salinsky MC, Oken BS, Morehead L:
Test-retest reliability in EEG frequency analysis.
Electroencephalogr Clin Neurophysiol.
1991; 79(5): 382–392. PubMed Abstract
| Publisher Full Text
- 65.
Cohen MX:
Analyzing neural time series data: theory and practice. MIT Press, Cambridge, Massachusetts, 2014. Publisher Full Text
- 66.
Deuker L, Bullmore ET, Smith M, et al.:
Reproducibility of graph metrics of human brain functional networks.
NeuroImage.
2009; 47(4): 1460–1468. PubMed Abstract
| Publisher Full Text
- 67.
Tran XA, McDonald N, Dickinson A, et al.:
Functional connectivity during language processing in 3-month-old infants at familial risk for Autism Spectrum Disorder.
Eur J Neurosci.
2021; 53(5): 1621–1637. PubMed Abstract
| Publisher Full Text
- 68.
Juarez-Martinez EL, Sprengers JJ, Cristian G, et al.:
Prediction of behavioral improvement through resting-state electroencephalography and clinical severity in a Randomized Controlled Trial testing bumetanide in Autism Spectrum Disorder.
Biol Psychiatry Cogn Neurosci Neuroimaging.
2023; 8(3): 251–261. PubMed Abstract
| Publisher Full Text
- 69.
Saby JN, Marshall PJ:
The utility of EEG band power analysis in the study of infancy and early childhood.
Dev Neuropsychol.
2012; 37(3): 253–273. PubMed Abstract
| Publisher Full Text
| Free Full Text
- 70.
Marshall PJ, Bar-Haim Y, Fox NA:
Development of the EEG from 5 months to 4 years of age.
Clin Neurophysiol.
2002; 113(8): 1199–1208. PubMed Abstract
| Publisher Full Text
- 71.
Desjardins JA, van Noordt S, Huberty S, et al.:
EEG Integrated Platform Lossless (EEG-IP-L) pre-processing pipeline for objective signal quality assessment incorporating data annotation and blind source separation.
J Neurosci Methods.
2021; 347: 108961. PubMed Abstract
| Publisher Full Text
- 72.
Marriot Haresign I, Phillips E, Whitehorn M, et al.:
Automatic classification of ICA components from infant EEG using MARA.
Dev Cogn Neurosci.
2021; 52: 101024. PubMed Abstract
| Publisher Full Text
| Free Full Text
- 73.
Lopez KL, Monachino AD, Vincent KM, et al.:
Stability, change, and reliable individual differences in electroencephalography measures: a lifespan perspective on progress and opportunities.
NeuroImage.
2023; 275: 120116. PubMed Abstract
| Publisher Full Text
| Free Full Text
- 74.
Dafflon J, Da Costa PF, Váša F, et al.:
A guided multiverse study of neuroimaging analyses.
Nat Commun.
2022; 13(1): 3758. PubMed Abstract
| Publisher Full Text
| Free Full Text
- 75.
Haartsen R:
Extended Data for ‘Comparison of EEG pre-processing pipelines for spontaneous EEG data in a large neurodivergent cohort’. 2025. https://osf.io/yh8vf/
- 76.
Haartsen R:
LEAP social/non-social videos task: EEG pipeline comparisons - Code used. Github. 2025. http://www.doi.org/10.5281/zenodo.15112005








