Introduction
Forest regeneration is a critical component of ecosystem recovery, particularly following disturbances such as windstorms, which can have long-term impacts and potentially severe consequences for ecosystem services (Romagnoli et al., 2023). Monitoring and quantifying forest regeneration plays a vital role in sustainable forest management and adaptive planning (Miina et al., 2006; Witzmann et al., 2025). Traditionally, optical remote sensing techniques such as satellite and aerial imagery (Lin et al., 2024), multispectral sensors (Panuju et al., 2020), and vegetation indices like NDVI (Huang et al., 2021) have been widely applied to assess regeneration at broad spatial scales. However, these methods are limited in their ability to detect subcanopy structure, individual saplings, or early-stage regeneration (Johnston et al., 2018; Pontius et al., 2020). Wind disturbance is currently the most significant natural disturbance affecting European forests (Seidl et al., 2014), causing widespread tree damage and influencing microclimatic conditions (Palm-Hellenurm et al., 2024). In mountain forests, such disturbances can result in long-lasting ecological consequences, including altered regeneration trajectories and shifts in forest composition (Romagnoli et al., 2023). One of the most impactful examples is Storm Vaia (October 27–30, 2018), which severely affected Northern Italy, damaging more than 42,500 hectares of forest with wind gusts exceeding 200 km/h (Barbagallo et al., 2024; Chirici et al., 2019). Understanding natural regeneration in such contexts is essential for designing post-disturbance management strategies that foster ecosystem recovery and resilience (Taeroe et al., 2019). In recent years, TLS has become an important tool for detailed structural analysis of forests, producing high-resolution 3D point clouds that allow direct measurements of canopy height, stem density, leaf area index (LAI), and vertical profiles (Liang et al., 2016). TLS enables the detection of saplings, small trees, and even herbaceous layers (Åkerblom & Kaitaniemi, 2021; Vicari et al., 2019; Wilkes et al., 2017). The aim of this study is to evaluate the potential of TLS in characterizing forest regeneration and to identify which structural characteristics can be detected with TLS but not with optical remote sensing methods. This paper combines a systematic literature review with original TLS and remote sensing data collected from a regenerating forest plot affected by Storm Vaia 2018, demonstrating the practical application of TLS for assessing structural features in forest recovery.
This study was guided by the following objectives:
1. To conduct a systematic literature review to determine the key structural characteristics of forest regeneration that are more accurately captured by terrestrial laser scanning (TLS) than by optical remote sensing methods.
2. To demonstrate the application of TLS through experimental field data to assess parameters such as tree segmentation, height distribution analysis, and leaf area index (LAI) in a regenerating forest plot.
Material and methods
Systematic Literature Review
A systematic literature review (SLR) was conducted through targeted searches in academic databases, including Scopus, Web of Science, Research Gate, using keywords such as "LiDAR", "Terrestrial Laser Scanning", "Forest Regeneration", and "Optical Sensing". Each query consisted of different keywords, and related synonyms were combined through logical operators (i.e., “AND”, “OR”). To capture recent advancements in the field, the search was restricted to peer-reviewed articles published between 2020 and 2025. The key structural characteristics of forest regeneration between the application of TLS and optical remote sensing were identified based on the final sample of 34 articles from the total database of 68 papers after thorough reading.
Experimental data collection and TLS sampling
TLS data were collected using a RIEGL (RIEGL Laser Measurement Systems, 2023) ground-based scanner from multiple positions and processed in RiSCAN PRO (RIEGL, Austria) for cleaning, alignment, and georeferencing. The registered 3D point cloud was exported to CloudCompare version 2.12.4 (GPL software, 2022) (64-bit), where a Cloth Simulation Filter (CSF) was applied to separate ground and vegetation points, producing a Digital Terrain Model (DTM) and an off-ground canopy point cloud. A scalar field derived from cloud-to-mesh (C2M) distance was used to quantify vegetation height, and its distribution was analysed with CloudCompare’s histogram tool. Vegetation <2 m was removed to exclude shrubs and ground clutter, focusing on tree canopy structure. Remaining canopy points were segmented into individual crowns using connected component labeling. Each cluster was visually inspected and colorized by height, with one representative tree selected for detailed vertical profile analysis and height distribution assessment. Field observations documented vegetation composition, sapling height, and regeneration density, supported by photographs to aid interpretation of TLS data. To complement the structural metrics, NDVI and EVI were derived from Sentinel-2 Level-2A imagery (2018–2025) in Google Earth Engine (Gorelick et al., 2017). These indices provided information on canopy greenness and photosynthetic activity, enabling an integrated assessment of forest structure and condition. This combined approach supports repeatable, multi-season monitoring of regeneration dynamics and post-disturbance recovery.
Results
Results from literature review
Across the literature, TLS proved more effective than optical remote sensing for capturing detailed structural attributes of regenerating forests, especially in early successional stages. Common TLS-derived metrics included canopy height (29 studies), individual tree detection and stem density (25), LAI (18), and vertical structure including subcanopy layers (21). Optical methods more often provided NDVI and related indices (31), broad canopy cover estimates (19), and vegetation health assessments (14). TLS offers direct structural measurements, while optical methods primarily yield indirect estimates from spectral data. Studies consistently report that TLS offers superior performance in detecting early-stage regeneration and subcanopy structure compared to optical methods. Table 1 compares regeneration parameters, showing TLS’s clear advantage in detecting fine-scale details such as saplings and subcanopy structure. The table highlights TLS's superior performance in capturing fine-scale structural details that are typically missed by optical sensors.
Table 1. Comparison of forest regeneration characteristics as measured by TLS and optical remote sensing techniques.
Regeneration
Parameter | TLS | Optical RS | References |
|---|
| Canopy Structure | Direct measurement | Indirect estimation | Santos et al., 2022; Wardius & Hein (2024), |
Tree detection- Stem
density | High accuracy, including
saplings | Limited, often missed in
dense canopy | Bogdanovic et al., 2021; Calders et al., 2020; Wardius & Hein, 2024 |
| LAI | Calculated from structural
data | Indirect estimation via
NDVI or models | Tian et al., 2025; Wang & Fang, 2020; Wei et al., 2020 |
| NDVI -Vegetation Indices | Not applicable | Commonly used for
spectral data | Liang et al., 2025; Montero et al., 2023 |
| Vertical structure | Full 3D profile, including
multiple layers | Limited to upper canopy | Muumbe et al., 2021; Schraik et al., 2023 |
Understory-Subcanopy
detection | Clearly captured with high
detail | Rarely detected below
canopy | Adhikari et al., 2023; Puletti et al., 2021 |
Results from experimental plot
Tree segmentation, height distribution analysis and CHM
The TLS-derived point cloud revealed detailed information on forest structure at both stand and individual tree levels. As shown in Figure 1, the colorized point cloud illustrates substantial spatial variability in canopy height across the plot, with isolated taller individuals emerging from a predominantly low-stature vegetative matrix. The accompanying histogram confirms a highly skewed height distribution, with the majority of points concentrated below 2 meters typical of early regeneration stages. In contrast, Figure 2 focuses on a segmented individual tree extracted using connected component analysis. The 3D point cloud reveals a well-defined vertical profile, while its height distribution shows multiple peaks, suggesting structural differentiation within the canopy.
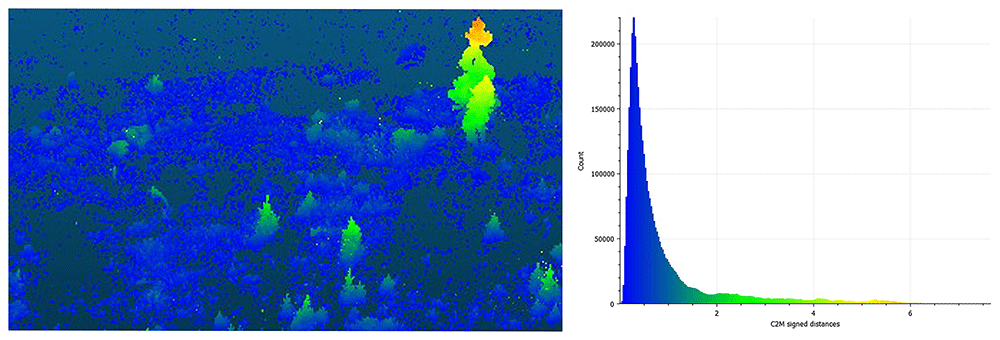
Figure 1. Left: Point cloud colorized by C2M signed distance showing above-ground vegetation structure. Right: Canopy height distribution histogram, showing the frequency of point heights derived from the C2M model.
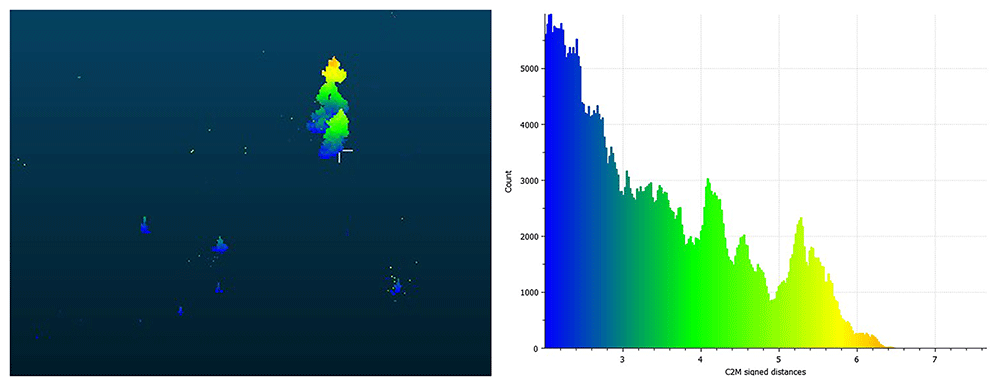
Figure 2. Individual tree extracted from TLS point cloud using connected component segmentation. Left: tree crown point cloud colorized by height (C2M signed distance). Right: vertical distribution of points within the tree, representing the canopy structure and height range.
Figure 3 shows CHM generated from TLS data, presented as a rasterized grid. The color gradient represents vegetation height in meters, with blue indicating lower vegetation and red representing taller canopy structures. Black cross markers (+) denote the locations of treetops identified using a local maximum filter applied to the CHM. This spatial representation reveals pronounced heterogeneity in vertical structure across the regenerating plot, with clusters of taller individuals embedded within a predominantly low-stature matrix. The CHM not only supports visualization of canopy development but also enables tree counting and spatial pattern analysis, contributing to a more detailed assessment of regeneration dynamics.
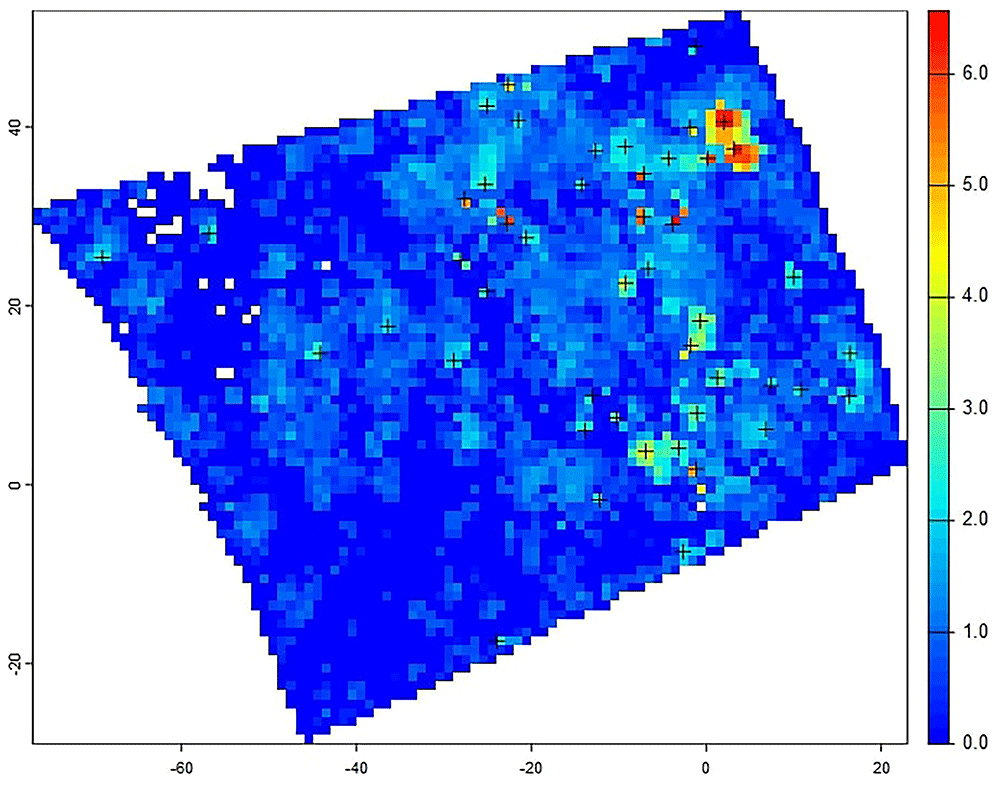
Figure 3. CHM generated from TLS data, showing canopy height (in meters) and detected individual treetops (black crosses) based on local maxima analysis.
Spatial and temporal patterns in vegetation indices
In 2025, NDVI values (0–1) reflected vegetation greenness, while LAI values (0–6) indicated canopy density (Figure 4). Both maps showed high spatial heterogeneity, with patches of dense, green canopy interspersed among sparsely vegetated areas typical of early-stage regeneration. Time-series analysis of NDVI and EVI (2018–2025) revealed clear seasonal cycles, with peaks in the growing season and lows in winter (Figure 5). NDVI was consistently higher, reflecting greater sensitivity to canopy greenness, whereas EVI was more conservative due to reduced atmospheric and soil background effects.
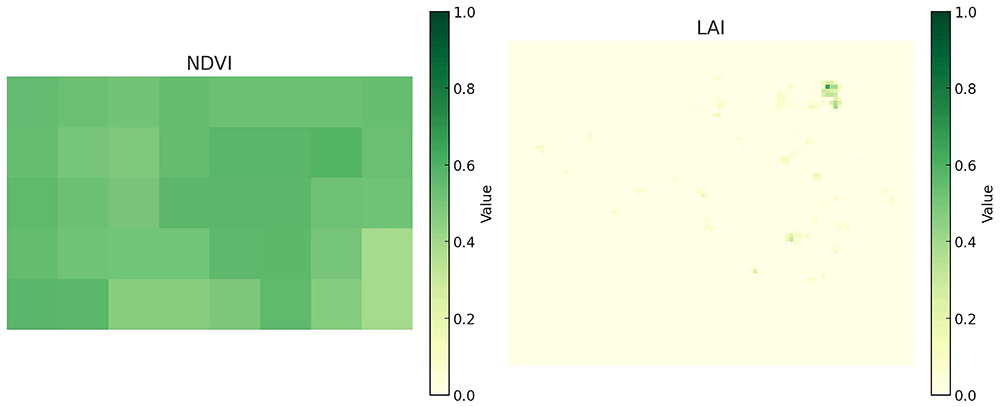
Figure 4. Mapped distribution of NDVI and LAI across the study area in 2025. The left panel shows NDVI (0–1) and the right panel shows LAI (0–6), derived from remote sensing data.
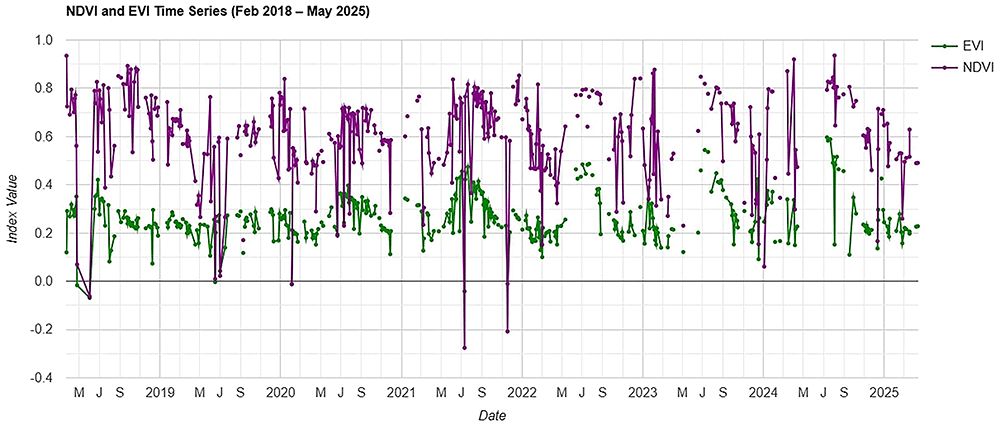
Figure 5. Time series of NDVI and EVI for the study area.
Interannual variation was linked to climate, phenology, and disturbance events, with occasional outliers from residual cloud or atmospheric noise. Together, these indices provided complementary insights into spatial structure and temporal dynamics when integrated with TLS measurements.
Conclusion
This study highlights the value of TLS as a high-resolution tool for monitoring forest regeneration, particularly in structurally complex or early successional stands. Our literature review and case study show that TLS captures canopy height, stem density, and vertical structure often missed by optical remote sensing. The integration of TLS-derived structural metrics with spectral indices such as NDVI and EVI allowed for a more comprehensive assessment of vegetation condition, capturing both physiological and architectural aspects of forest recovery. Our findings support the growing body of evidence advocating for the use of TLS in forest ecology and suggest that combining structural and spectral data can enhance the accuracy and interpretability of regeneration assessments. TLS should be considered a complementary component in multi-source monitoring strategies aimed at evaluating post-disturbance forest dynamics and informing sustainable forest management.
Ethics and consent
Ethical approval and consent were not required.
Data availability
The datasets used in this study, including NDVI and LAI raster files and TLS point-cloud data, are openly available on Zenodo: https://doi.org/10.5281/zenodo.15762119 (Petrovic et al., 2025). The version used in this article is https://doi.org/10.5281/zenodo.17349048 (Petrovic et al., 2025; Version 3). All files are released under a Creative Commons Attribution 4.0 International (CC BY 4.0) licence and are freely accessible without login or embargo. The Zenodo repository contains all processed outputs of the study, including NDVI and LAI raster files (GeoTIFF format), NDVI and EVI time series data (CSV format), TLS point cloud data (LAS format), representative figures (JPEG), and a README file describing the workflow. For transparency and reproducibility, the Google Earth Engine script used for NDVI/EVI processing is archived in the repository as a standalone JavaScript file. All data and code can be downloaded directly from Zenodo.
Software availability
Al software and scripts used in this study are openly available to ensure transparency and reproducibility.
Remote sensing data processing
Google Earth Engine scripts for NDVI and EVI computation (JavaScript API) are provided in the Zenodo repository (https://doi.org/10.5281/zenodo.17349048) (Petrovic et al., 2025). Time series were generated using mean values across the area of interest at 10 m spatial resolution.
Data is available under the terms of the Creative Commons Attribution 4.0 International
TLS data processing
RiSCAN PRO (RIEGL, Austria) was used for point cloud registration and georeferencing. CloudCompare v2.12.4 (https://www.cloudcompare.org) was used for ground filtering, height calculations, tree segmentation, and visualization.
Data is available under the terms of the GNU General Public License (GPL)
Authors’ contributions
All authors contributed to the project’s conceptualization, methodology, data collection, and visualization. B.P contributed to TLS data collection, analysis, and manuscript writing. A.C and C.G contributed to data analysis and interpretation. M.S.F supported visualization and manuscript review. E.T supervised the project. All authors approved the final manuscript.
Acknowledgements
The author thanks the Free University of Bozen-Bolzano for hosting her during the Short-Term Scientific Mission, and for providing access to research infrastructure and field equipment.
Faculty Opinions recommendedReferences
- Adhikari A, Peduzzi A, Montes CR, et al.:
Assessment of understory vegetation in a plantation forest of the southeastern United States using Terrestrial Laser Scanning.
Ecol Inform.
2023; 77: 102254. Publisher Full Text
- Åkerblom M, Kaitaniemi P:
Terrestrial Laser Scanning: a new standard of forest measuring and modelling?
Ann Bot.
2021; 128(6): 653–662. PubMed Abstract
| Publisher Full Text
| Free Full Text
- Barbagallo B, Rocca N, Cresi L, et al.:
Enhanced impacts of extreme weather events on forest: the upper Valtellina (Italy) case study.
Remote Sens.
2024; 16(19): 3692. Publisher Full Text
- Bogdanovic E, Perez-Priego O, El-Madany TS, et al.:
Using Terrestrial Laser Scanning for characterizing tree structural parameters and their changes under different management in a Mediterranean open woodland.
For Ecol Manage.
2021; 482: 118945. Publisher Full Text
- Calders K, Adams J, Armston J, et al.:
Terrestrial Laser Scanning in forest ecology: expanding the horizon.
Remote Sens Environ.
2020; 251: 112102. Publisher Full Text
- Chirici G, Giannetti F, Travaglini D, et al.:
Stima dei danni della tempesta "Vaia" alle foreste in Italia.
Forest@.
2019; 16: 3–9. Publisher Full Text
- CloudCompare (version 2.12.4) [GPL software]. 2022. Reference Source
- Gorelick N, Hancher M, Dixon M, et al.:
Google earth engine: planetary-scale geospatial analysis for everyone.
Remote Sens Environ.
2017; 202: 18–27. Publisher Full Text
- Huang S, Tang L, Hupy JP, et al.:
A commentary review on the use of Normalized Difference Vegetation Index (NDVI) in the era of popular remote sensing.
J For Res.
2021; 32(5): 1–6. Publisher Full Text
- Johnston JM, Johnston LM, Wooster MJ, et al.:
Satellite detection limitations of sub-canopy smouldering wildfires in the North American boreal forest.
Fire.
2018; 1(2): 28. Publisher Full Text
- Liang D, Cao B, Wang Q, et al.:
A new remote sensing index for the detection of multi-type forest anomalies based on sentinel-2 imagery.
Forests.
2025; 16(3): 497. Publisher Full Text
- Liang X, Kankare V, Hyyppä J, et al.:
Terrestrial Laser Scanning in forest inventories.
ISPRS J Photogramm Remote Sens.
2016; 115: 63–77. Publisher Full Text
- Lin FC, Shiu YS, Wang PJ, et al.:
A model for forest type identification and forest regeneration monitoring based on deep learning and hyperspectral imagery.
Ecol Inform.
2024; 80: 102507. Publisher Full Text
- Miina J, Eerikäinen K, Hasenauer H:
Modeling forest regeneration. In: Hasenauer, H. (eds) Sustainable forest management. Springer, Berlin, Heidelberg, 2006. Publisher Full Text
- Montero D, Aybar C, Mahecha MD, et al.:
A standardized catalogue of spectral indices to advance the use of remote sensing in Earth system research.
Sci Data.
2023; 10(1): 197. PubMed Abstract
| Publisher Full Text
| Free Full Text
- Muumbe TP, Baade J, Singh J, et al.:
Terrestrial Laser Scanning for vegetation analyses with a special focus on Savannas.
Remote Sens.
2021; 13(3): 507. Publisher Full Text
- Palm-Hellenurm K, Tullus T, Vodde F, et al.:
Delayed response of bryophytes to wind disturbance and salvage logging in hemiboreal mixed forests.
For Ecol Manage.
2024; 555: 121718. Publisher Full Text
- Panuju DR, Paull DJ, Griffin AL:
Change detection techniques based on multispectral images for investigating land cover dynamics.
Remote Sens.
2020; 12(11): 1781. Publisher Full Text
- Petrovic B, Candotti A, Grande C, et al.:
NDVI, LAI, and TLS data for forest regeneration study (2025). dataset.
Zenodo. Version 3, 2025. http://www.doi.org/10.5281/zenodo.17349048
- Pontius J, Schaberg P, Hanavan R:
Remote sensing for early, detailed, and accurate detection of forest disturbance and decline for protection of biodiversity. In: Cavender-Bares, J., Gamon, J.A., Townsend, P.A. (eds) Remote Sensing of Plant Biodiversity. Springer, Cham, 2020. Publisher Full Text
- Puletti N, Galluzzi M, Grotti M, et al.:
Characterizing subcanopy structure of Mediterranean forests by Terrestrial Laser Scanning data.
Remote Sens Appl.
2021; 24: 100620. Publisher Full Text
- RIEGL Laser Measurement Systems: RiSCAN PRO – RIEGL’s 3D point cloud processing software. 2023. Reference Source
- Romagnoli F, Cadei A, Costa M, et al.:
Windstorm impacts on European forest-related systems: an interdisciplinary perspective.
For Ecol Manage.
2023; 541: 121048. Publisher Full Text
- Santos EG, Nunes MH, Jackson T, et al.:
Quantifying tropical forest disturbances using canopy structural traits derived from Terrestrial Laser Scanning.
For Ecol Manage.
2022; 524: 120546. Publisher Full Text
- Schraik D, Wang D, Hovi A, et al.:
Quantifying stand-level clumping of boreal, hemiboreal and temperate European forest stands using Terrestrial Laser Scanning.
Agric For Meteorol.
2023; 339: 109564. Publisher Full Text
- Seidl R, Schelhaas MJ, Rammer W, et al.:
Increasing forest disturbances in Europe and their impact on carbon storage.
Nat Clim Chang.
2014; 4(9): 806–810. PubMed Abstract
| Publisher Full Text
| Free Full Text
- Taeroe A, de Koning JHCC, Löf M, et al.:
Recovery of temperate and boreal forests after windthrow and the impacts of salvage logging: a quantitative review.
For Ecol Manage.
2019; 446: 304–316. Publisher Full Text
- Tian X, Jia X, Da Y, et al.:
Evaluating the sensitivity of vegetation indices to leaf area index variability at individual tree level using multispectral drone acquisitions.
Agric For Meteorol.
2025; 364: 110441. Publisher Full Text
- Vicari MB, Calders K, Burt A, et al.:
Leaf and wood classification framework for terrestrial LiDAR point clouds.
Methods Ecol Evol.
2019; 10(5): 680–694. Publisher Full Text
- Wang Y, Fang H:
Estimation of LAI with the LiDAR technology: a review.
Remote Sens.
2020; 12(20): 3457. Publisher Full Text
- Wardius Y, Hein S:
Terrestrial Laser Scanning vs. manual methods for assessing complex forest stand structure: a comparative analysis on plenter forests.
Eur J Forest Res.
2024; 143: 635–649. Publisher Full Text
- Wei S, Yin T, Dissegna MA, et al.:
An assessment study of three indirect methods for estimating leaf area density and leaf area index of individual trees.
Agric For Meteorol.
2020; 292–293: 108101. Publisher Full Text
- Wilkes P, Lau A, Disney M, et al.:
Data acquisition considerations for Terrestrial Laser Scanning of forest plots.
Remote Sens Environ.
2017; 196: 140–153. Publisher Full Text
- Witzmann S, Gollob C, Kraßnitzer R, et al.:
Quantification of forest regeneration on forest inventory sample plots using point clouds from personal laser scanning.
Remote Sens.
2025; 17(2): 269. Publisher Full Text