1.
Introduction
The global prevalence of diet-related chronic non-communicable diseases, particularly obesity, cardiovascular disease, and type 2 diabetes, represents a critical clinical and public health challenge.1 To mitigate this medical burden, healthcare professionals and public authorities increasingly advocate for preventative, population-level interventions. Among these, front-of-pack labeling (FOPL) systems have emerged as a vital tool for facilitating healthier dietary choices by translating complex nutritional information into easily interpretable visual cues at the point of purchase.2
The Health Star Rating (HSR) system, implemented in Australia and New Zealand, is one such FOPL scheme. Similar to other systems, such as the Nutri-Score widely used in European countries, HSR aims to support consumer decision-making and reduce the incidence of metabolic disorders by providing a clear, standardized indication of a product’s overall nutritional profile. These labels typically appear on packaged foods and range from 0.5 to 5 stars. Despite the broad clinical and policy relevance of HSR, access to large-scale, structured datasets of HSR-labeled products remains limited, restricting the potential for comprehensive research and data-driven healthcare policy evaluation.
Existing datasets such as Open Food Facts, FoodSwitch, and AUSNUT 2023 primarily focus on providing nutrient information, either as open data or through consumer-oriented applications that promote healthier food choices. However, a gap remains, as none of these datasets specifically emphasize or comprehensively capture HSR information.
To address this gap, we introduce OpenHSR, the first open and publicly available dataset dedicated to the Health Star Rating system. The dataset aggregates information from multiple Australian supermarkets and includes each product’s name, nutritional composition per 100 g or 100 mL, HSR category, and assigned Health Star Rating. Our dataset has been developed in accordance with the FAIR principles Findable, Accessible, Interoperable, and Reusable to ensure high-quality data management and research reproducibility. By making this dataset openly accessible, our goal is to enable reproducible analyses of nutritional trends, facilitate evaluation of the HSR system’s scoring consistency, and support further research in nutrition science, food policy, and machine learning applications for health-related
data.
In
Section 2, we describe the HSR system in detail.
Section 3 introduces the datasets available for nutritional analysis, including publicly accessible ones for the Nutri-Score, but none for HSR. In
Section 4, we present our dataset and its diversity in HSR coverage. Finally,
Section 6 introduces machine learning–based regression algorithms to predict HSR from nutritional values, enabling the creation of our own HSR calculator and checking of the coherence between the actual calculation and the theoretical guidelines.
2.
Health star rating system introduction
The Health Star Rating (HSR) system, jointly implemented by the Australian and New Zealand governments, assigns packaged foods a rating from
to
stars.3 Higher ratings indicate a healthier overall nutritional profile. The HSR is computed using the official HSR Calculator, which applies the Nutrient Profiling Scoring Criterion (NPSC) to determine a product’s category-specific score.
To account for fundamental differences in how nutrient profiles should be evaluated across different types of products, the algorithm first assigns a food item to one of six primary categories:
•
Category 1: Non-dairy beverages, jellies, and water-based ice confections
•
Category 1D: Milk and dairy beverages
•
Category 2: General foods
•
Category 2D: Dairy foods
•
Category 3: Oils and spreads
•
Category 3D: Cheese
Once categorized, the system routes the product into one of two distinct calculation pathways to determine its baseline score:
Pathway A (Categories 1D, 2, 2D, 3, and 3D): For general foods, dairy, oils, and cheeses, the baseline score is calculated by evaluating four “negative” components associated with increased risk of chronic diseases: energy, saturated fat, sodium, and total sugars.
Pathway B (Category 1): For non-dairy beverages, the nutritional expectations are structurally different. Therefore, the baseline score is determined by evaluating only two negative components: energy and total sugars.
For both pathways, the calculated baseline score is subsequently adjusted by subtracting points for the presence of “positive” components, specifically protein content, dietary fiber, and the proportion of fruits, vegetables, nuts, and legumes (FVNL). This final adjusted score is then mapped to the standardized
–
star scale, yielding a single value that reflects the product’s overall nutritional quality.
3.
Related datasets
Open Food Facts is an open-source, publicly available dataset accessible at https://fr.openfoodfacts.org/,4 containing metadata, Nutri-Score, NOVA classification, and Green Score for a wide variety of food products. The primary method of data collection relies on user submissions from around the world. While Health Star Rating (HSR) information is available for some products, there are often missing values in the metadata. Moreover, HSR data is not included in the downloadable version of the dataset, which limits its reusability for research purposes.
FoodSwitch is primarily a mobile phone application designed to help consumers make healthier food choices while enabling crowdsourcing of national food composition data.5 Although the app includes Front-of-Pack nutrition labels such as the Health Star Rating (HSR), the underlying dataset is not directly accessible. Access requires submitting a request and demonstrating a research purpose, which limits its usability for broader projects. Consequently, the dataset does not fully comply with FAIR principles, as it is not readily findable, accessible, or reusable for a wide range of users.
The AUSNUT dataset is a comprehensive collection of detailed food supply data that supports the 2023 National Nutrition and Physical Activity Survey6 and is accessible at https://www.foodstandards.gov.au/science-data/food-nutrient-databases/ausnut. Classification or coding systems are employed to group similar foods for reporting intakes and tracking trends over time. The study utilized three classification schemes to report:
− Foods, dietary supplements, and nutrient intakes
− Intake of discretionary versus non-discretionary foods
− Nutrient intakes relative to the Australian Dietary Guidelines
However, this dataset does not include Health Star Rating (HSR) information, limiting its applicability for analyses that rely on front-of-pack nutritional labeling metrics.
4.
Dataset description
Overview
4.1
The OpenHSR dataset comprises 246 unique food products available in Australian retail chains in 2025.7 Each record contains approximately 20 fields, which can be grouped into three main categories:
Nutrient composition includes energy (kJ and kcal), protein, total fat, saturated fat, carbohydrate, sugars, fiber, and sodium. Metadata includes product name, brand, product type, category, serving size, package weight, country of origin, retailer, date collected, allergens, ingredients, and data source. Health Star Rating (HSR) is provided as a score from 0.5 to 5, reflecting overall nutritional quality.
Data collection process
4.2
The data was manually obtained from the package images of products from retailers websites and Brand-specific online pages such as Coles, Woolworths, Kellogg’s, Aldi and Fourntwenty. A part of the data was also similarly obtained from Open data facts’ website. Using the packaging information is known to be more reliable especially in the case of open data facts where the written information on their website differed from the information on the packaging in some instances, decreasing the risk of human-induced errors.
Manual collection ensured accuracy and consistency in variable representation, while metadata fields were harmonized to allow cross-product comparisons.
Data validation
4.3
The dataset is provided in a tabular format (CSV), where each row represents a product and each column corresponds to a distinct variable. The dataset has no missing values in numerical entries.
Both manual and computational double-checks of nutritional panels and Health Star Ratings (HSR) were conducted to ensure a high-quality dataset.
The dataset also integrates the FAIR principles to support reproducibility and facilitate future research use:
Findable: Each product record is uniquely identified, and the dataset is assigned a DOI via Open Research Europe.
Accessible: The dataset is openly available under a CC BY 4.0 license, with direct download access.
Interoperable: Standardized units, consistent variable names, and harmonized categories enable integration with other datasets and computational pipelines.
Reusable: Comprehensive metadata, data dictionaries, and clear documentation support reproducibility, machine learning applications, and policy evaluations.
We described every variable gathered in the OpenHSR dataset in the software code on our github repository of the Appendix.
5.
Exploratory analysis
The dataset exhibits sufficient diversity in HSR, which has enabled the development of a transparent, interpretable white-box HSR calculator.
The distribution of product categories across HSR reveals how nutritional quality varies within and between categories, as observed in
Figure 1a. Some categories tend to achieve higher HSRs like the 1D category, while other like the 2D category tend to have lower ratings, reflecting differences in their nutrient profiles. This analysis highlights the relationship between product type and nutritional quality.
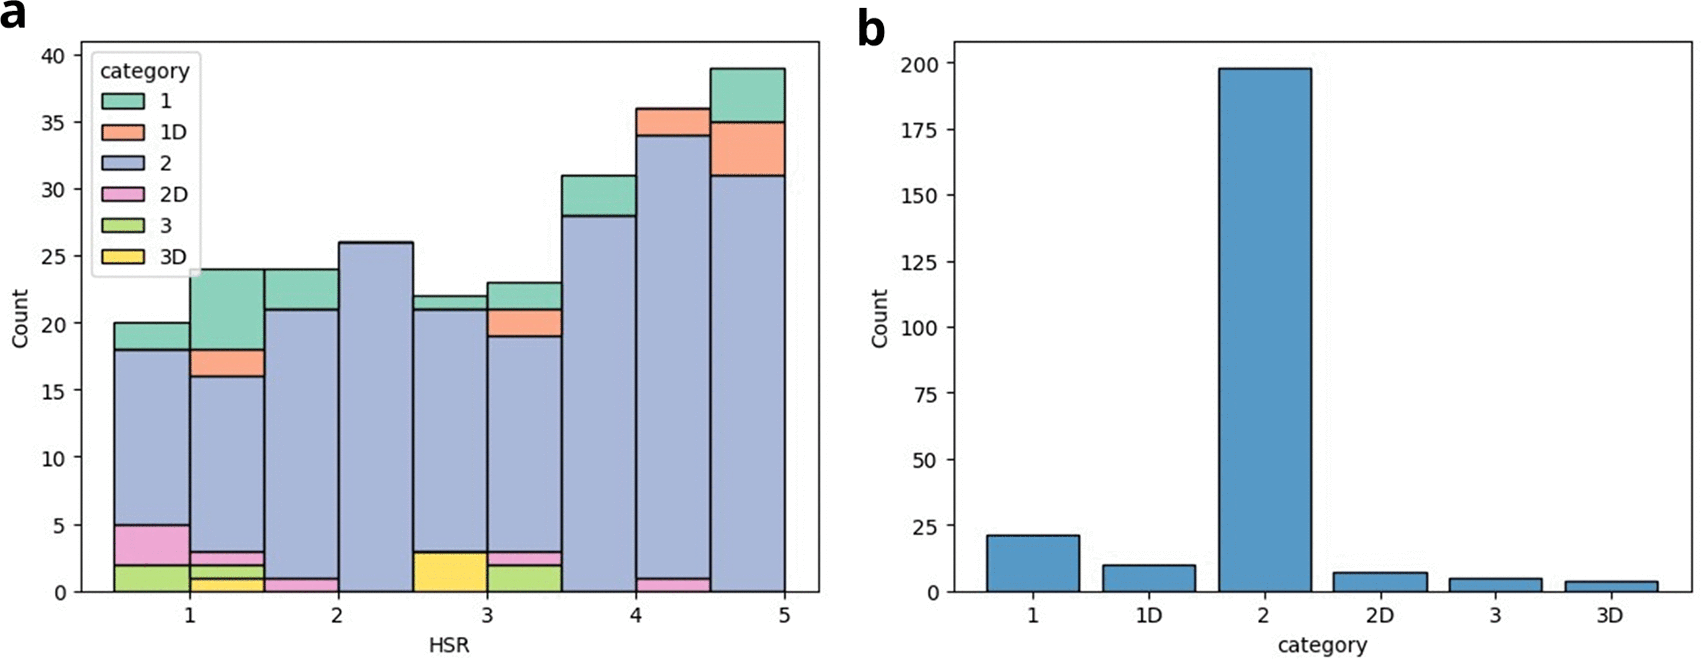
Figure 1. Descriptive statistics of the OpenHSR.
(a) Distribution of product categories across HSR. (b) Distribution of categories across the dataset.
Figure 1b shows the categories’ distribution in the dataset, it provides insight into its overall composition. The distribution of the different categories are heterogeneous; however, this is not a characteristic of our dataset but the general distribution in supermarket. Indeed, we do not expect the same number of product in the ‘2’ category being Food as in the ‘3D’ category, which is Cheese.
We refer to
Figure 2a for the nutritional values’ distributions across the dataset, they confirm the variability among the recorded food items. Moreover, a clear relationship is observed between energy content and HSR, products with higher calories per 100 g tend to have lower HSRs, and conversely, products with lower calorie content tend to have higher HSRs. In
Figure 2b, lighter-colored points represent lower HSRs, which occur less frequently but correspond to higher energy content per 100 g.
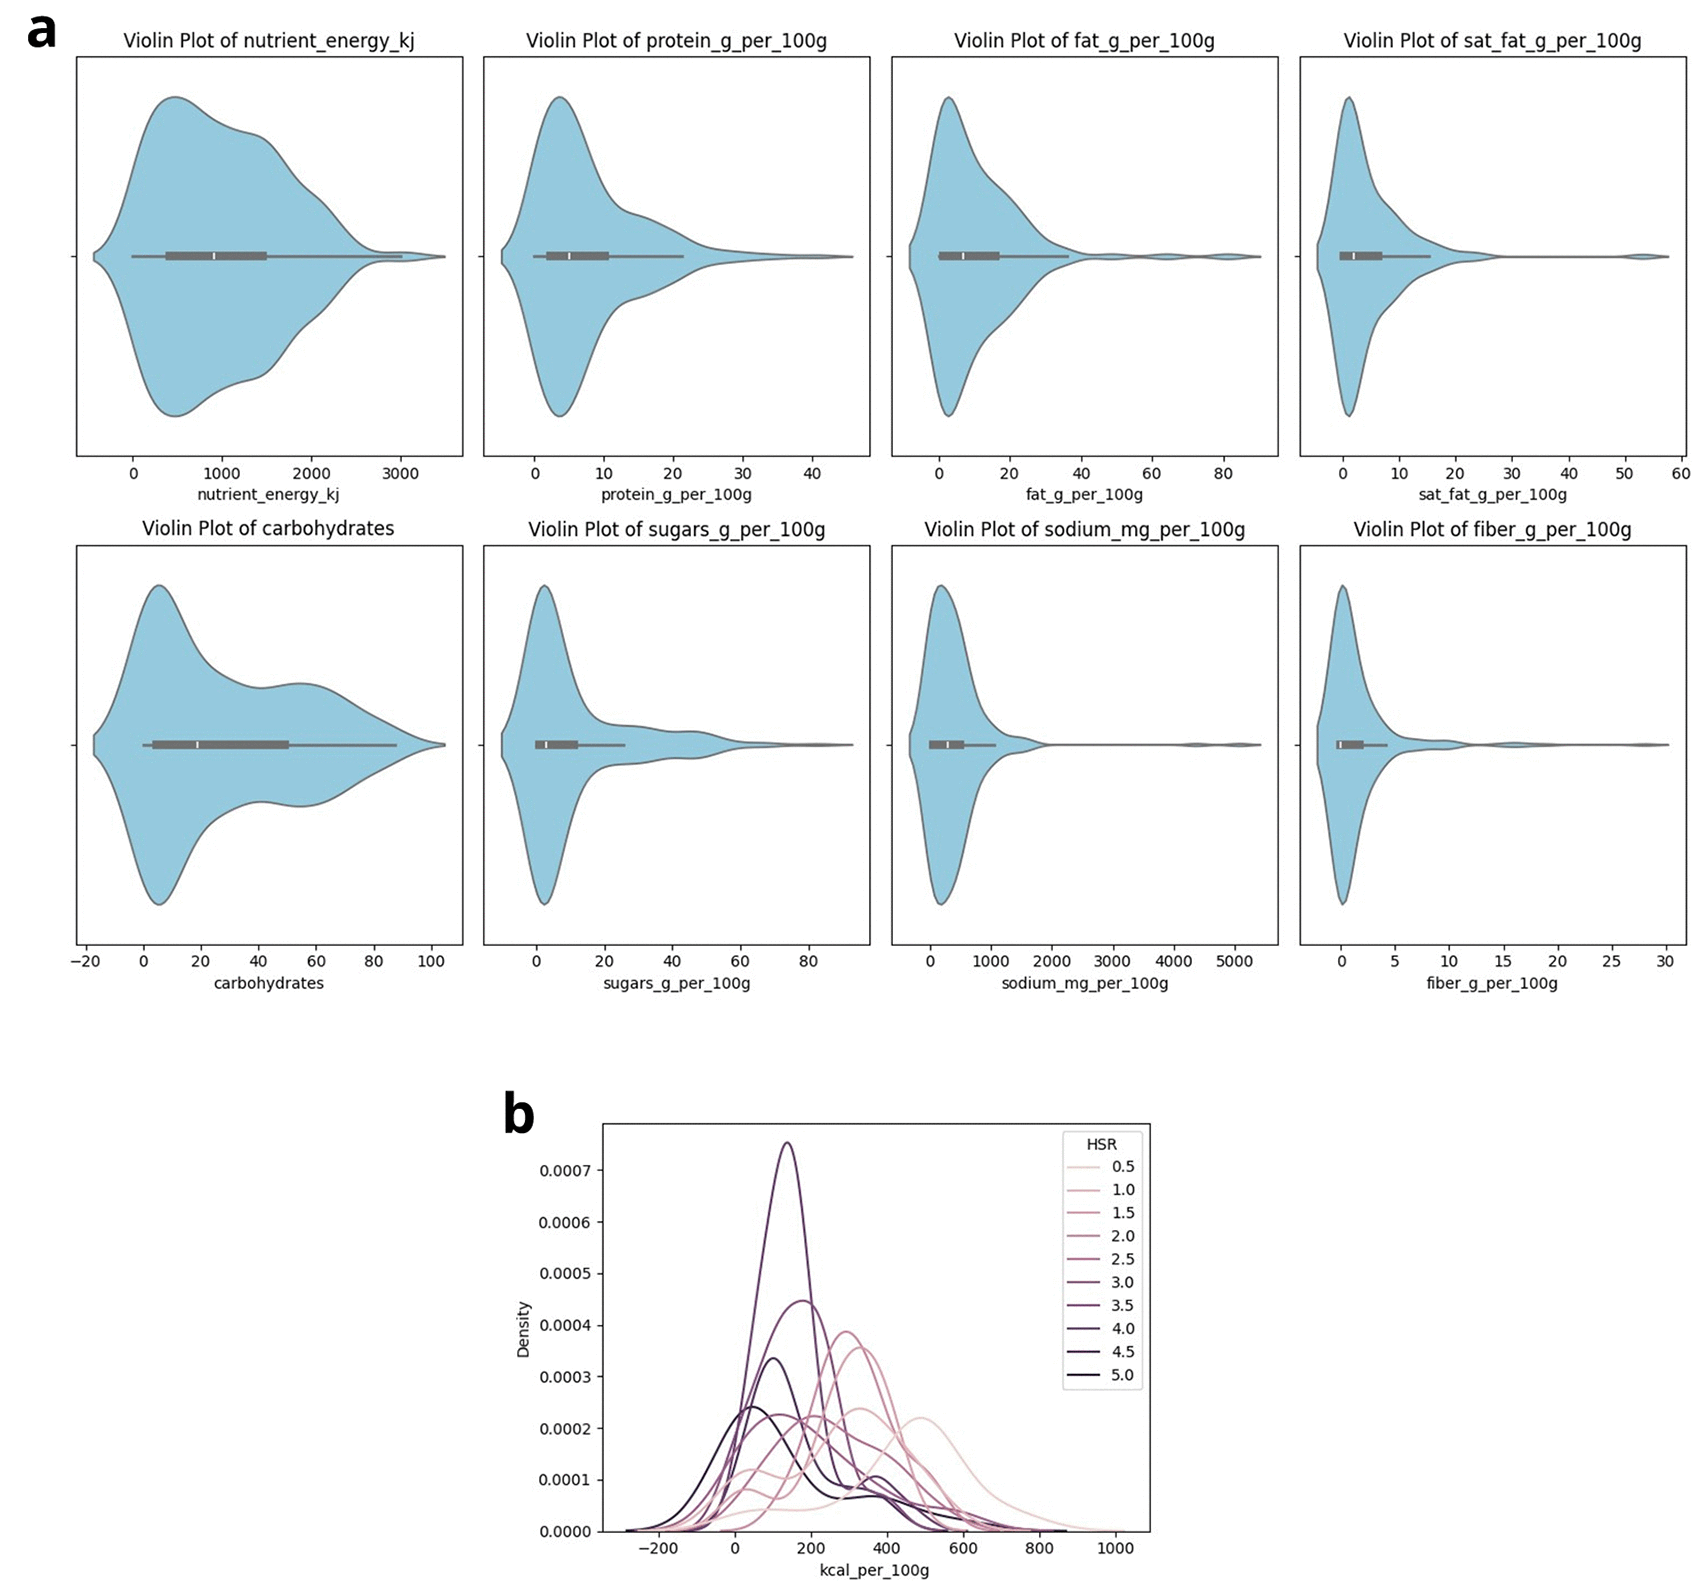
Figure 2. Descriptive statistics of the nutritional values within the OpenHSR.
(a) Distribution of nutritional values across the dataset. (b) Density plot of kcal per 100 g of products per HSR.
6.
Health star rating calculator: benchmark
We used a diverse set of machine learning (ML) regression models to predict the Health Star Rating (HSR). As summarized in
Table 1, the models include three fully white-box and interpretable algorithms (LR,8,9 DT,9–11 kNN9,12), two ensemble methods (RF,9,13 XGBoost9,14) whose individual base learners are interpretable although the overall ensemble is not, and three black-box models (SVM,9,15,16 MLP,17,18 FTN17,18). A detailed description of our model implementation and deployment strategy is available on our GitHub repository.
Table 1. Performance of various machine learning regression algorithms for HSR prediction.
| ML regression algorithm | MSE | acc | by-half-acc |
Interpretable |
|---|
| Linear (LR) | 0.82 | 0.42 | 0.76 |
|
| Decision Tree (DT) | 0.55 | 0.34 | 0.76 |
|
| K-Nearest Neighbor (kNN) | 0.40 | 0.42 | 0.86 |
|
| Random Forest (RF) | 0.33 | 0.36 | 0.92
|
|
| XGBoost | 0.35 | 0.48 | 0.92
|
|
| Support Vector Machine (SVM) | 0.28
| 0.62
| 0.86 |
|
| Multilayer Perceptron (MLP) | 0.67 | 0.40 | 0.78 |
|
| Fine-tuned network (FTN) | 0.86 | 0.26 | 0.50 |
|
For all machine learning methods, hyperparameters were selected via grid search using scikit-learn’s default 5-fold cross-validation. The dataset was partitioned into a training set (80%) and an independent test set (20%). For classical machine learning algorithms, hyperparameter tuning was performed on the entire training set using 5-fold cross-validation. For neural network models, the training set was further split into training (64%) and validation (16%) subsets.
It is also important to note that data standardization was applied selectively, depending on the algorithm’s sensitivity to feature scaling. While standardization had a negligible impact on scale-invariant models such as the Decision Tree Regression algorithm, it was essential for distance-based and margin-based methods, including K-Nearest Neighbors and Support Vector Machines. Our neural network results were obtained using the methods of Defazio et al. Schedule-Free optimizer.19
The hyperparameters different from the scikit-learn default ones are as follows:
1. Decision Tree:‘max_depth’: 4,‘max_features’: 8,‘min_samples_split’: 10
2. K-Nearest Neighbor:‘n_neighbors’: 7
3. Random Forest:‘max_depth’: 6,‘max_features’: 8,‘min_samples_split’: 2
4. XGBoost’n_estimators’: 500,‘max_depth’: 4,‘min_samples_split’: 10,‘learning_rate’: 0.01,‘loss”: “squared_error’
5. Support Vector Machine:‘C’: 100,‘epsilon’: 0.01,‘kernel’:‘rbf’
6. Multilayer Perceptron: 5 loops of’BatchNorm‘’Dense’ of 32 neurons and’ReLU’ layers, with starting learning rate equal to 0.01.
7. Fine-tuned network: Multilayer Perceptron architecture above, with the last dense layer replaced, with a starting learning rate equal to 0.01.
Overall, the models achieved strong predictive performance for HSR. For example, XGBoost achieved a half-accuracy of 92% with a mean squared error below 0.4. In contrast, fully interpretable models such as the Decision Tree (see
Figure 3) produced lower predictive accuracy compared to less interpretable approaches, notably the Support Vector Machine (SVM) regression, which was among the best performing models.
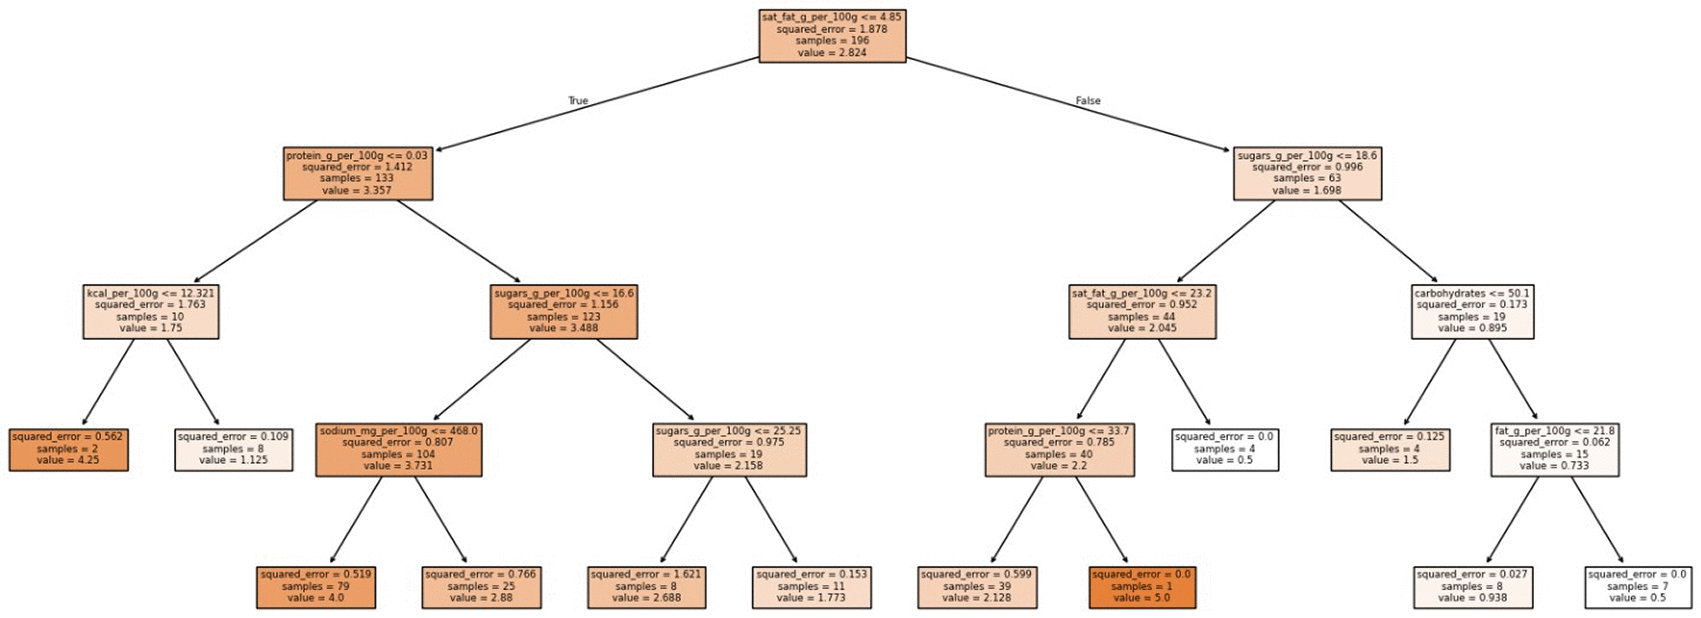
Figure 3. Decision-making process of the decision tree Regression algorithm.
It shows which variable it uses, and the HSR predicted in consequences. The lighter-colored the cells are, the lower the HSR predicted will be.
Performance could likely be improved, particularly for models such as SVM and Multilayer Perceptron (MLP), with access to additional labeled data. To address data limitations, we attempted to pre-train a foundation model to predict Nutri-Scores, subsequently using its latent representations to predict HSR. Note that our neural network results were obtained using 3. However, this approach did not yield satisfactory results for HSR prediction (
Table 1), despite performing well for Nutri-Score prediction (MSE = 0.24, after transforming Nutri-Scores to a 1–5 numerical scale).
From an applied perspective, although a half-star difference in HSR may not substantially alter consumer judgments, prioritizing interpretability over marginal performance gains can be justified. However, for research applications or large-scale predictive analyses, the SVM regression model is recommended due to its superior performance (lowest MSE). To demonstrate the generalizability of our approach,
Section 7 presents HSR predictions on an independent nutritional dataset.
As illustrated in
Figure 3, the decision tree identifies energy and sugar content as primary tree splitting criteria, indicating their predominant role in HSR estimation. This structural hierarchy is consistent with the official HSR algorithm, in which energy and total sugars serve as the primary negative components that determine the baseline score.
7.
Health star rating predictions
We applied our trained models to the OpenFoodFacts dataset by selecting all products containing the nutritional attributes required by the algorithms described in the previous section. The only missing feature was the category variable introduced in
Section 2. To address this, we constructed a mapping dictionary linking the most common categories in our training data to their corresponding categories in the HSR classification system.
Using the Support Vector Regression (SVR) model, we then predicted HSR values for the selected products. Since no ground-truth HSR labels were available for these Open Food Facts products, the predicted values cannot be quantitatively validated and should be interpreted as exploratory estimates.
The HSR calculator surrogate model demonstrates strong computational efficiency, producing HSR predictions for 6,554 products in only 0.1 seconds, suggesting its suitability for large-scale applications.
8.
Discussion
OpenHSR addresses an important gap in front of label packaging research by providing the first open, FAIR-compliant dataset dedicated to the Health Star Rating (HSR) system. Existing resources have different strengths but do not necessarily meet the standards for data openness and FAIRness. Open Food Facts offers a large open food product database, yet HSR information is not consistently available for all products, making it challenging to construct dedicated HSR datasets. FoodSwitch captures extensive front-of-pack labeling information but provides more controlled access to its underlying database than fully open repositories. Meanwhile, AUSNUT is primarily intended for research on nutrient composition and dietary intake rather than for HSR analysis. By linking nutritional composition directly to HSR values in a standardized and openly accessible format, OpenHSR provides a transparent baseline for reproducible research on front-of-pack nutrition labeling.
In our benchmarking evaluation, SVM and XGBoost yielded the best performance metrics. This aligns with established machine learning behavior, as kernel methods and ensemble approaches consistently perform well on small tabular datasets. These algorithms can efficiently capture complex relationships among nutritional variables without immediately overfitting, making them highly robust when training data is scarce. However, it must be noted that their low Mean Squared Error (MSE) reflects optimized loss on the training data rather than guaranteed generalized accuracy, highlighting the need for cautious interpretation.
Conversely, deep learning architectures, including the Multilayer Perceptron and the fine-tuned foundation network, underperformed significantly. This limitation is entirely driven by the severe constraint imposed by our sample size, which comprises only 246 unique food products. Neural networks and foundation models inherently depend on vast quantities of data to accurately map complex parameter spaces. Applying such data-hungry models to an extremely small dataset fundamentally limits their reliability and generalizability, making them far less effective than traditional statistical algorithms on this benchmark. Their inclusion in the benchmark nonetheless serves a dual purpose: to ensure methodological completeness, as both architectures would represent state-of-the-art solutions given sufficient data, and to provide a foundation for future research by offering a readily available open-source codebase from which subsequent studies can build.
The creation of this open dataset carries immediate implications for independent reproducibility and data-driven nutrition policy. By directly linking nutrient profiles to their standardized front-of-pack scores, OpenHSR empowers researchers and policymakers to transparently evaluate scoring consistency and dietary adherence. Providing unobstructed access to this data ensures that public health guidelines can be independently audited and modeled, fostering greater accountability and transparency in national food labeling systems.
9.
Conclusion
In this work, we presented the creation of a new dataset linking Health Star Ratings (HSR) with detailed product metadata for Australian retail foods. We provided a thorough analysis of the dataset, including its structure, data quality, and potential applications. Additionally, we demonstrated how machine learning models trained on this dataset can be used to predict HSR values for products where this information is not available, highlighting its utility for research and consumer applications.
The dataset is publicly accessible online, and its design adheres to the FAIR principles, ensuring it is findable, accessible, interoperable, and reusable. We anticipate that this resource will facilitate further studies on nutrition labeling, dietary assessment, and predictive modeling in food and health research.
Study design and reporting guidelines
9.1
This research employs a retrospective observational study design to aggregate and analyze the nutritional profiles of packaged foods associated with HSR. To ensure methodological rigor and transparency, the development and evaluation of the machine learning prediction models were guided by the principles of the TRIPOD20 (Transparent Reporting of a multivariable prediction model for Individual Prognosis Or Diagnosis) statement, an established EQUATOR Network guideline used here for nutritional dataset benchmarking.
Limitations
9.2
One of the main limitations of our dataset is its relatively small size (246 entries), which may affect the generalizability and performance of machine learning models. In addition, the dataset focuses exclusively on products available in the Australian market, limiting its applicability to other regions. Due to the fact that the data were collected manually, it may be subject to packaging updates and labeling changes over time. Furthermore, serving-size variability is not included, which may influence nutrient comparisons across products.
Future directions
9.3
To address these limitations, we plan to expand the dataset by increasing the number of product entries and incorporating data from multiple regions. Future versions will aim to automate data collection processes, include serving-size information, and ensure periodic updates to maintain accuracy and relevance.
Ethics and consent
Ethical approval and consent were not required.
Declaration of generative AI and AI-assisted technologies in the writing process
During the preparation of this work the authors used ChatGPT in order to enhance the readability and language. After using the tool, the authors reviewed and edited the content as needed and take full responsibility for the content of the publication.
References
- 1.
World Health Organization:
Noncommunicable Diseases Progress Monitor 2022.
World Health Organization;
2022. Reference Source
- 2.
Song J, Brown MK, Tan M, et al.:
Impact of Color-Coded and Warning Nutrition Labelling Schemes: A Systematic Review and Network Meta-Analysis.
PLoS Medicine.
2021; 18(10): e1003765. PubMed Abstract
| Publisher Full Text
| Free Full Text
- 3.
Health Star Rating Unit, Nutrition Policy Section:
HSR System Calculator and Style Guide.
2025.
- 4.
Open Food Facts Team:
Open Food Facts – a Collaborative, Open Database of Food Products from Around the World.2018. Reference Source
- 5.
Dunford E, Trevena H, Goodsell C, et al.:
FoodSwitch: A Mobile Phone App to Enable Consumers to Make Healthier Food Choices and Crowdsourcing of National Food Composition Data.
JMIR mHealth and uHealth.
2014; 2(3): e37. PubMed Abstract
| Publisher Full Text
| Free Full Text
- 6.
(FSANZ), Food Standards Australia New Zealand:
AUSNUT 2023 – the 2023 National Nutrition and Physical Activity Study Food and Nutrient Database.
2025. Reference Source
- 7.
N’kam Suguem F, Lafargue V:
Open Health Star Rating (OpenHSR) (Version V1). Data set.
Zenodo.
2025. Publisher Full Text
- 8.
Legendre A-M:
Nouvelles Méthodes Pour La Détermination Des Orbites Des Comètes.
Courcier.
1805. Reference Source
- 9.
Pedregosa F, Varoquaux G, Gramfort A, et al.:
Scikit-Learn: Machine Learning in Python.
Journal of Machine Learning Research.
2011; 12: 2825–2830.
- 10.
Breiman L, Friedman JH, Olshen RA, et al.:
Classification and Regression Trees.
Wadsworth International Group;
1984. Reference Source
- 11.
Hastie T, Tibshirani R, Friedman J:
The Elements of Statistical Learning: Data Mining, Inference, and Prediction.
2nd ed.Springer Series in Statistics;2009. Publisher Full Text
- 12.
Fix E, Hodges JL Jr:
Discriminatory Analysis: Nonparametric Discrimination – Consistency Properties. No. 4.
USAF School of Aviation Medicine.
1951. Reference Source
- 13.
Breiman L:
Random Forests.
Machine Learning.
2001; 45: 5–32. Publisher Full Text
- 14.
Chen T, Guestrin C:
XGBoost: A Scalable Tree Boosting System.
Proceedings of the 22nd ACM SIGKDD International Conference on Knowledge Discovery and Data Mining (KDD’16).
2016; pp. 785–794. Publisher Full Text
- 15.
Drucker H, Burges CJC, Kaufman L, et al.:
Support Vector Regression Machines.
Advances in Neural Information Processing Systems 9 (NeurIPS 1996).
1997; pp. 155–161. Reference Source
- 16.
Crammer K, Singer Y:
On the Algorithmic Implementation of Multiclass Kernel-Based Vector Machines.
JMLR.
2002; 2: 265–292.
- 17.
Ansel J, Yang E, He H, et al.:
PyTorch 2: Faster Machine Learning Through Dynamic Python Bytecode Transformation and Graph Compilation.
Proceedings of the 29th ACM International Conference on Architectural Support for Programming Languages and Operating Systems.
Vol. 2. .
New York, NY, USA:
ASPLOS’24;
2024; pp. 929–947. Publisher Full Text
- 18.
Schmidhuber J:
Deep Learning in Neural Networks: An Overview.
Neural Networks.
2015; 61: 85–117. PubMed Abstract
| Publisher Full Text
- 19.
Defazio A, Yang XA, Khaled A, et al.:
The Road Less Scheduled.
The Thirty-Eighth Annual Conference on Neural Information Processing Systems.
2024. Reference Source
- 20.
Collins G, Moons K, Dhiman P, et al.:
TRIPOD+AI Statement: Updated Guidance for Reporting Clinical Prediction Models That Use Regression or Machine Learning Methods.
BMJ.
2024; 385: e078378. PubMed Abstract
| Publisher Full Text
| Free Full Text