The detailed procedure of all workflows is described in the subsequent sections.
Cathodic/electrolytic charging
Cathodic/electrolytic charging of metallic specimens is carried out in an electrolytic cell, consisting of an electrolyte, i.e., the charging solution, the sample as the cathode, a Pt wire as the anode and a reference electrode connected to a power source. The electrolytic cell used in the present study is shown in Figure 2 (a) and was developed and used previously for wire-type samples prepared by electrochemical polishing – see ref. 20. The process involves immersing the wire-specimen held inside the cryo-puck into the charging solution. Here, the aim was to develop the cathodic charging process for site-specific APT specimens mounted on a support. The conventional geometry used for APT site-specific specimens is a silicon coupon support held by a clip and mounted on a copper stub29,37. However, Cu would dissolve in the solution, hindering the use of this conventional geometry.
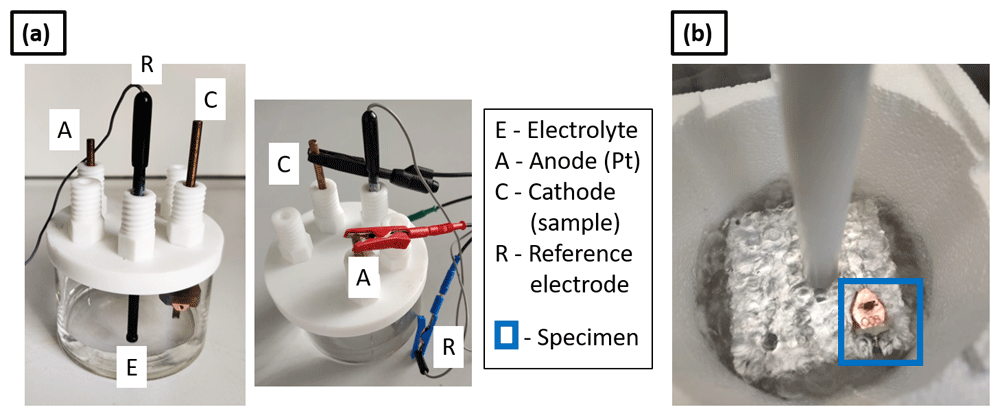
Figure 2.
(a) Set up for cathodic charging (electrolytic cell); (b) charged specimen inserted into an Al puck holder block immersed in LN2 for an immediate quench.
Here, specimens were prepared on molybdenum grids, which are typically used for transmission electron microscopy (TEM) specimens and previously reported as a suitable alternative to support lift-outs for APT38,39. Figure 3 (a) shows an optical micrograph of the molybdenum grid with a diameter 3 mm which is cut using a razor blade into a half grid. The size of each Mo grid post is approx. 50 µm. The Mo grid is first electropolished in an aqueous solution of 10% NaOH (Sigma-Aldrich, Germany) by applying a DC voltage of ~ 10V38–40. After electropolishing, the size of Mo grid post is reduced to approx. 10 µm, as shown in the optical micrograph in Figure 3 (b). This is then further sharpened by a Ga-FIB using annular milling process29 in order to make the posts 2–3 µm in diameter, as visible from the SEM image in Figure 3 (c). The grid is held by a grid holder following the design detailed in ref. 38, and is used for mounting the samples for hydrogen charging. The grid holder is then inserted into the cryo-puck35, which was fixed to the holder connected to the cathode of the electrolytic cell, shown in Figure 2 (a).
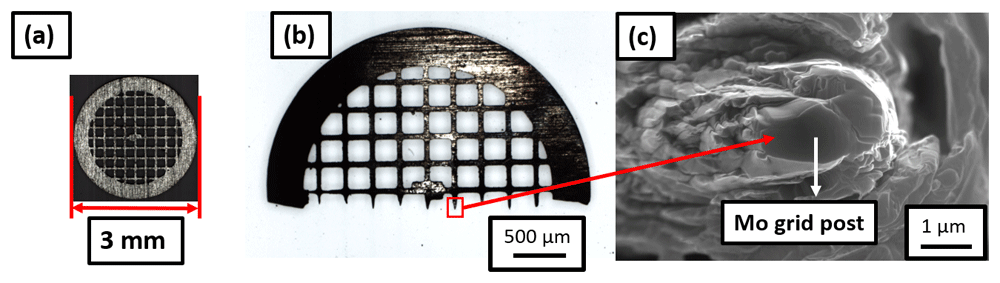
Figure 3.
(a) Molybdenum grid of diameter 3-mm; cut into (b) half grid; (c) Mo grid post of 2–3 microns in diameter suitable for mounting the samples.
Site-specific APT specimen preparation was performed onto this Mo grid held in the grid holder following the protocol outlined in ref. 29. The geometry is illustrated in Figure 4, with a schematic in Figure 4 (a). Here, “t” refers to the thickness of the Pt weld applied for mounting the specimen on the Mo grid post. Figure 4 (b) shows the SEM image of side view of the Pt weld obtained by tilting the grid holder at an angle of 90° while inserting it into the SEM chamber. Figures 4 (c) and (d) are scanning electron micrographs showing the top view of the Pt weld when the grid alignment is horizontal and vertical, respectively.
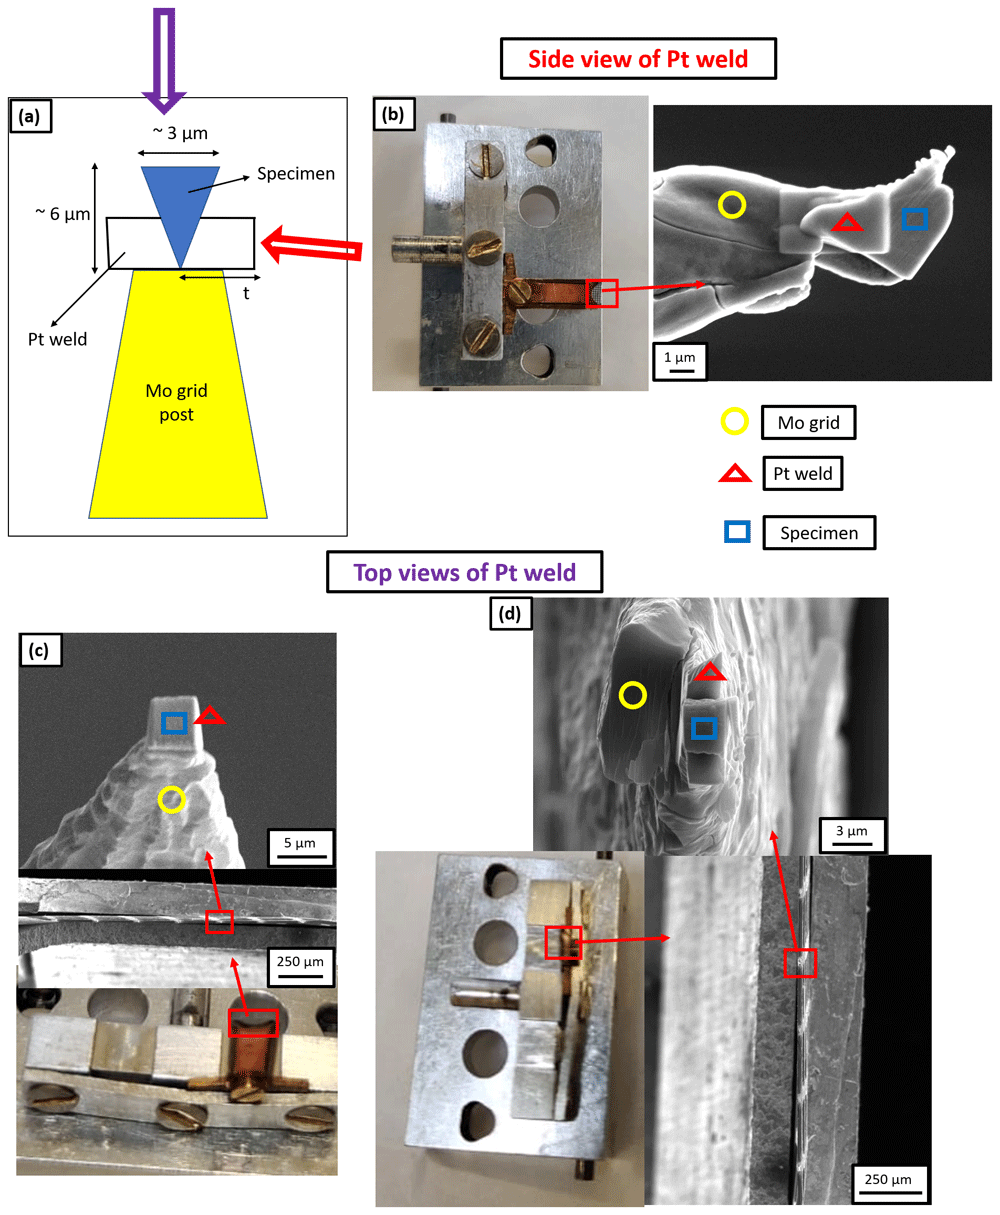
Figure 4.
(a) Schematic of the Pt weld where “t” is the thickness of Pt weld; (b) Scanning electron microscopy (SEM) image of the side view of Pt weld obtained by tilting the grid holder at 90° while inserting it into the SEM chamber and the thickness of Pt weld is 3 µm in this case; (c) SEM image of the top view of Pt weld when the grid alignment is horizontal and the thickness of Pt weld is 1 µm in this case; (d) SEM image of the top view of Pt weld when the grid alignment is vertical and the thickness of Pt weld is 3 µm in this case.
Workflow W1. Workflow W1 involves the preparation of a site-specific mounted lift-out using conventional Pt-welds, formed by decomposition of the Pt-precursor by using the Ga-ion beam, with a thickness of approx. 1 µm. The mounted lift-out is subjected to hydrogen charging prior to sharpening the deposited chunks into needle-shaped specimens. An aqueous solution of 0.05 M H2SO4 (Sigma-Aldrich, Germany, 98%) was used as an electrolyte for charging41. 1.4 g/l of thiourea (Merck Millipore, Germany) was mixed into the charging solution to act as hydrogen recombination binder41. It inhibits the combination of H atoms and prevents the formation of molecular H2, thereby enhancing the hydrogen ingress into the specimen. A DC voltage of 1.5V was applied.
After 1 hour of charging at room temperature, with the charging cell on a bench in air, the sample was immediately inserted into an Al puck holder block immersed in liquid nitrogen (LN2) for immediate quenching, as shown in Figure 2 (b). The Al block holding the specimen was transferred through ambient atmosphere into the cryogenically-cooled stage of the PFIB through an intermediate chamber that can be used as an air-lock, and not through the UHV suitcase. Upon pumping this intermediate chamber to high-vacuum conditions, the puck was inserted into the PFIB with the help of the dedicated transfer rod – see ref. 35 for details – in order to sharpen the specimen through annular milling29. Frost was observed on the Mo grid, as readily visible in Figure 5 (a). This could have been formed because the charging and transfers were performed in ambient atmosphere, which contains moisture. In this case, the sample was transferred back to the transfer rod of the PFIB35 and allowed to stay on it for 5 minutes in order to desorb the frost under high vacuum of 10-7 mbar28 and ambient temperature. The specimen was then transferred back to the cryostage for sharpening. Figure 5 (b) shows an SEM image of the specimen during the sharpening, which indicates that the Pt-welds were strongly affected by the charging or the frosting.
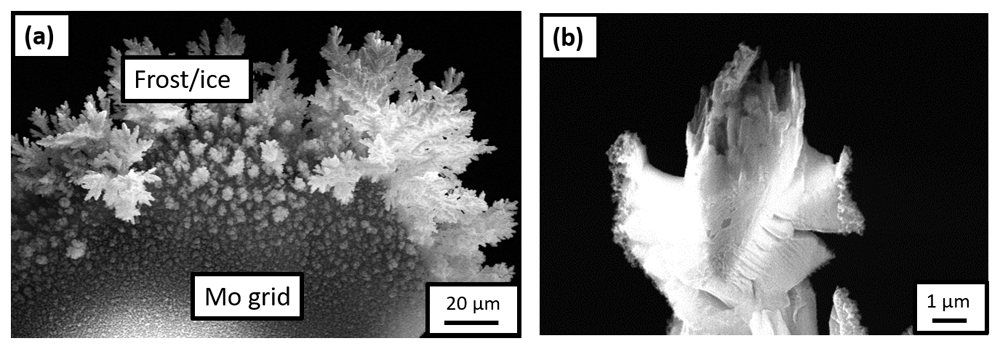
Figure 5.
(a) Scanning electron microscopy (SEM) image of the frost observed on the Mo grid after it was transferred onto the plasma focussed ion beam (PFIB) cryostage following the H-charging in an aqueous solution of 0.05M H2SO4 and quenching in air; (b) SEM image of the specimen during sharpening in the PFIB.
Workflow W2. To avoid the formation of frost, all subsequent charging experiments were performed in a N2 filled glovebox (Sylatec). The specimen, electrolytic cell, charging solution and liquid nitrogen (LN2) bath with the Al puck holder were first loaded into the N2 glovebox. The LN2 bath inside the N2 glovebox must be filled for quenching the sample immediately after charging17. After filling the LN2 bath and precooling the Al block puck holder, the charging of the specimen was started in the electrolytic cell. After performing the charging and quenching in the N2 atmosphere, the samples were transferred into the PFIB through the precooled UHV suitcase35.
Specifically, in Worklow W2, we mounted the lifted-out chunk by using approx. 3 µm thick Pt-welds in the PFIB, formed by decomposition of the Pt-precursor using Xe-plasma FIB. The charging solution was the same as the one used in Workflow W1. Here again, the Pt-welds did not survive and their condition, after charging and quenching, was same as that of the previous experiment (Workflow W1), shown in Figure 5 (b).
Workflow W3. As a next step, in Workflow W3, since the Pt-welds appeared to be the weaker part of the mounted sample, we prepared a new batch of specimens by using e-beam induced Pt deposition to form larger and denser welds, with a thickness of approx. 3 µm. Subsequently, these specimens were charged following the same workflow as previously (see Workflow 2). SEM imaging of the specimens in the PFIB after transfer through the precooled UHV suitcase revealed that the Pt-weld had survived but the sample had corroded, as shown in Figure 6. This experiment evidences that the steel sample corrodes in the acidic charging solution, leading to the dissolution of the specimen during charging. The duration of charging is also a critical factor to be considered because a longer charging duration could also lead to the dissolution of the specimen, beyond the issue of the weak Pt-welds.
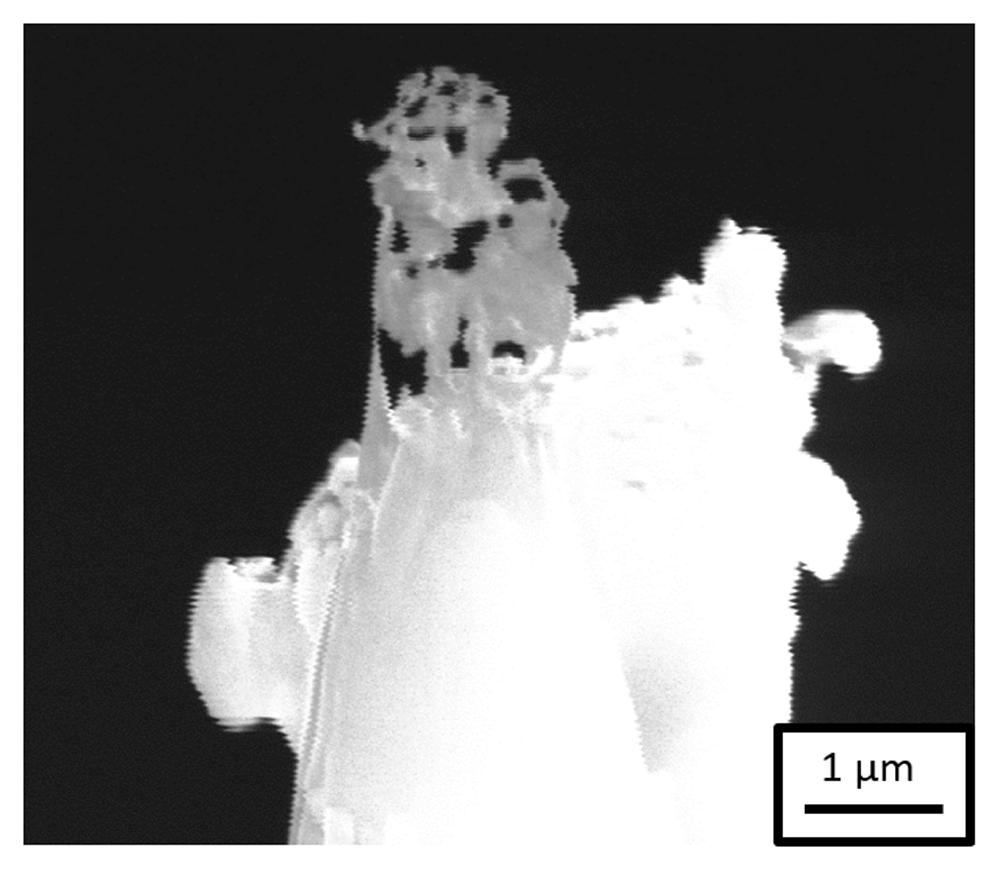
Figure 6. Scanning electron microscopy image of the specimen after H-charging in an aqueous solution of 0.05M H2SO4 and transferring through the precooled ultra-high vacuum suitcase during sharpening in the plasma focussed ion beam.
Workflow W4. In the next experiment, Workflow W4, we decided to change the charging solution and use Ga-FIB induced Pt deposition to prepare specimens with 3 µm thick Pt-welds. A neutral solution consisting of an aqueous solution of 3 wt.% NaCl (Sigma-Aldrich, Germany) with 0.3 wt.% NH4SCN (Sigma-Aldrich, Germany, 98%) as hydrogen recombination binder was used for charging42. The neutral charging solution is comparatively less effective for charging because only H2O is the source of H+ ions in this solution. These H+ ions move towards the cathode and penetrate into the sample, which is connected to the cathode. Na+ and Cl- ions only enhance the ionic conductivity of the solution, whereas H2SO4 was also the source of H+ ions in the previously used acidic charging solution. Nevertheless, it should be sufficient for charging the APT specimens (Pt-welds) due to their extremely small, i.e., microscopic, surface area.
After charging the specimen in the neutral charging solution for 1 hour, the sample and weld both survived, the sample did not corrode and it was sharpened successfully in the PFIB. Figure 7 (a) is a SEM image of the sharpened specimen, which was taken to the LEAP 5000 XS for measurement through the precooled UHV suitcase. The corresponding mass spectrum is shown in Figure 7 (b), in which a substantial amount of Mo was observed. Mo could have originated from dissolution of the grid itself by the charging solution. At the applied voltage (1.5V) to the neutral electrolyte, Fe and Mo could have formed a galvanic couple due to which the following reaction can take place at the cathode:
Mo3+ from the solution would have deposited onto the sample, which was observed in the mass spectrum43.
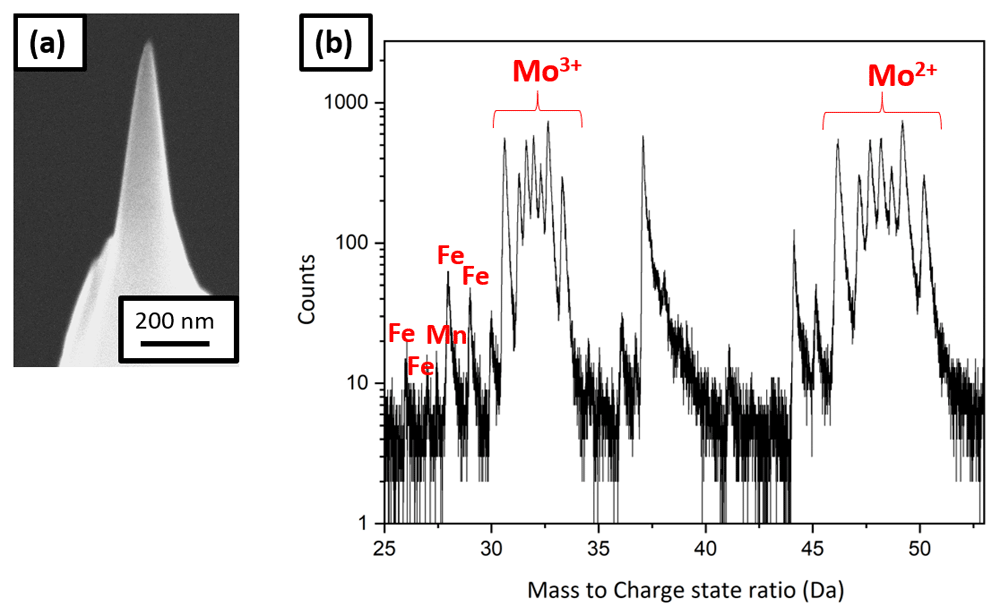
Figure 7.
(a) Scanning electron micrscopy image of the tip sharpened in the plasma focussed ion beam cryostage after charging in the neutral solution and quenching; (b) the corresponding mass spectrum showing Mo peaks.
Exchange of the charging solution. Both the acidic and the alkaline solutions, typically used for electropolishing of Mo grid, must be avoided for charging the steel of interest. Consequently, it was decided to use pure D2O (Sigma-Aldrich, Germany, 99.9 %) for charging and shorter charging times ranging from 1 to 5 minutes.
Some pure D2O charging experiments were also performed on non-site-specific lift-outs sharpened APT specimens. These needle-shaped APT specimens were prepared from the steel sample by electropolishing20 and then fine milled using the PFIB. The needle was charged in the N2 glovebox in pure D2O for 1 minute. The applied voltage was 2.2V, to induce the dissociation of the D2O electrolyte into D+ and OD- ions17. Then it was immediately quenched and transferred to the LEAP 5000 XS for measurement through the precooled UHV suitcase. Clusters of H2O, D2O and associated complex ions were found in the mass spectrum consistent with the analysis of water by APT44,45, but as soon as ions from the metal started to be detected, the specimen fractured.
For the next experiment, the sample was transferred to the PFIB immediately after charging and quenching in the N2 glovebox through the precooled UHV suitcase. SEM shows frost on the charged needle (see Figure 8 (a)), associated with the freezing of the remaining water adsorbed on the specimen’s surface. The specimen was therefore cleaned and resharpened in the PFIB post charging and quenching, Figure 8 (b), before being transferred to the LEAP 5000 XR for measurement.
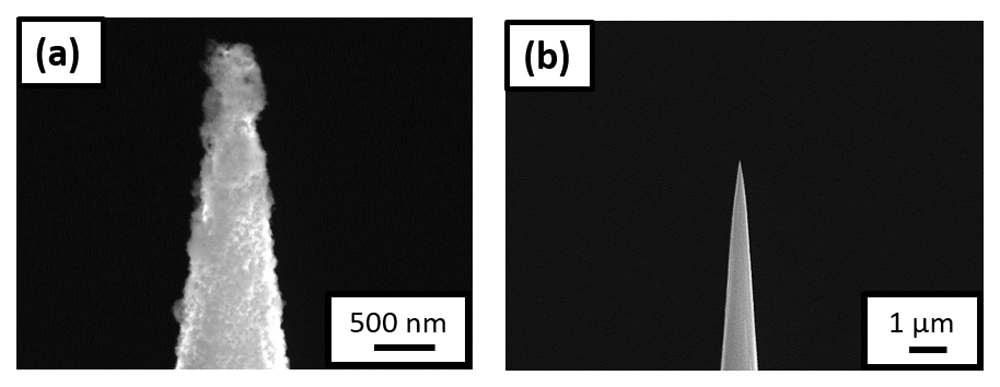
Figure 8.
(a) Scanning electron microscopy (SEM) image of the non-site specific lift-out specimen having the needle shaped geometry, surrounded by ice post charging and immediate quench; (b) SEM image of the same needle after being resharpened in the plasma focussed ion beam cryostage.
In a subsequent experiment, we tried to clean the charged needle with ethanol immediately before quenching. The sample was then transferred to the LEAP 5000 XS for measurement directly. However, this induced a slight delay in the quenching process – albeit only by few seconds. The mass spectrum exhibited peaks likely associated to adsorbed ethanol frozen on the specimen’s surface, and the specimen also fractured early.
Workflow W5. A set of pure D2O charging experiments was performed on a new batch of specimens prepared with approx. 3 µm thick Pt-welds formed by Ga-FIB induced Pt deposition. Multiple experiments were performed to optimize the charging time as charging for longer durations was leading to early specimen failure during measurement and charging for few seconds is not adequate to charge the sample with Pt-welds as the volume of material to charge is large compared to the needle-shaped geometry. Eventually, the charging performed for 5 minutes resulted in acceptable specimen yield. An SEM image of a sharpened specimen is shown in Figure 9 (a), and the corresponding 3D elemental map of carbon and deuterium are shown in Figures 9 (b) and (c), respectively, following reconstruction.
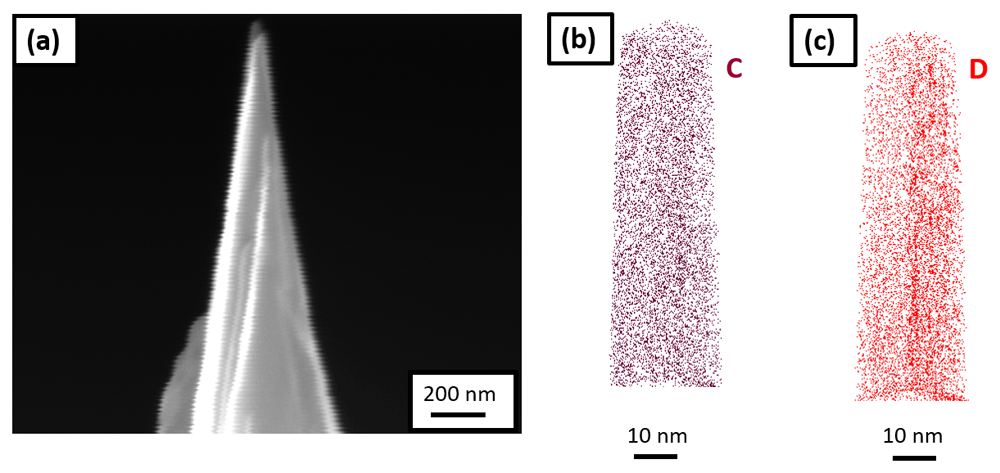
Figure 9.
(a) Scanning electron microscopy image of the tip sharpened in the plasma focussed ion beam cryostage after charging the specimen in pure D2O and quenching; (b) 3D elemental map of carbon; and (c) deuterium, following its reconstruction.
This final workflow demonstrates successful electrolytic charging of site-specific APT specimens. The (re)sharpening of the specimen in the PFIB following charging can, however, caused the introduction of frozen D2O from the surface because of implantation by the incoming high-energy ions21. D2O molecules could also dissociate and lead to D ingress into the sample during milling. These effects can be detrimental to the analysistical performance but can be minimized or avoided by using lower acceleration voltages and lower beam current during (re)sharpening for instance.
Plasma charging (Workflow W6)
A plasma cleaner (Evactron), shown in Figure 10 (a), was used for plasma charging. The plasma cleaner is normally used for removing carbon contamination from SEM samples with an oxygen plasma. Here the plasma cleaner was fed by a gas line of Ar containing 5% H2 gas. For plasma charging, the samples were prepared conventionally on the silicon coupon held by a clip onto a copper stub, as the reactivity of copper in solution is no longer a concern.
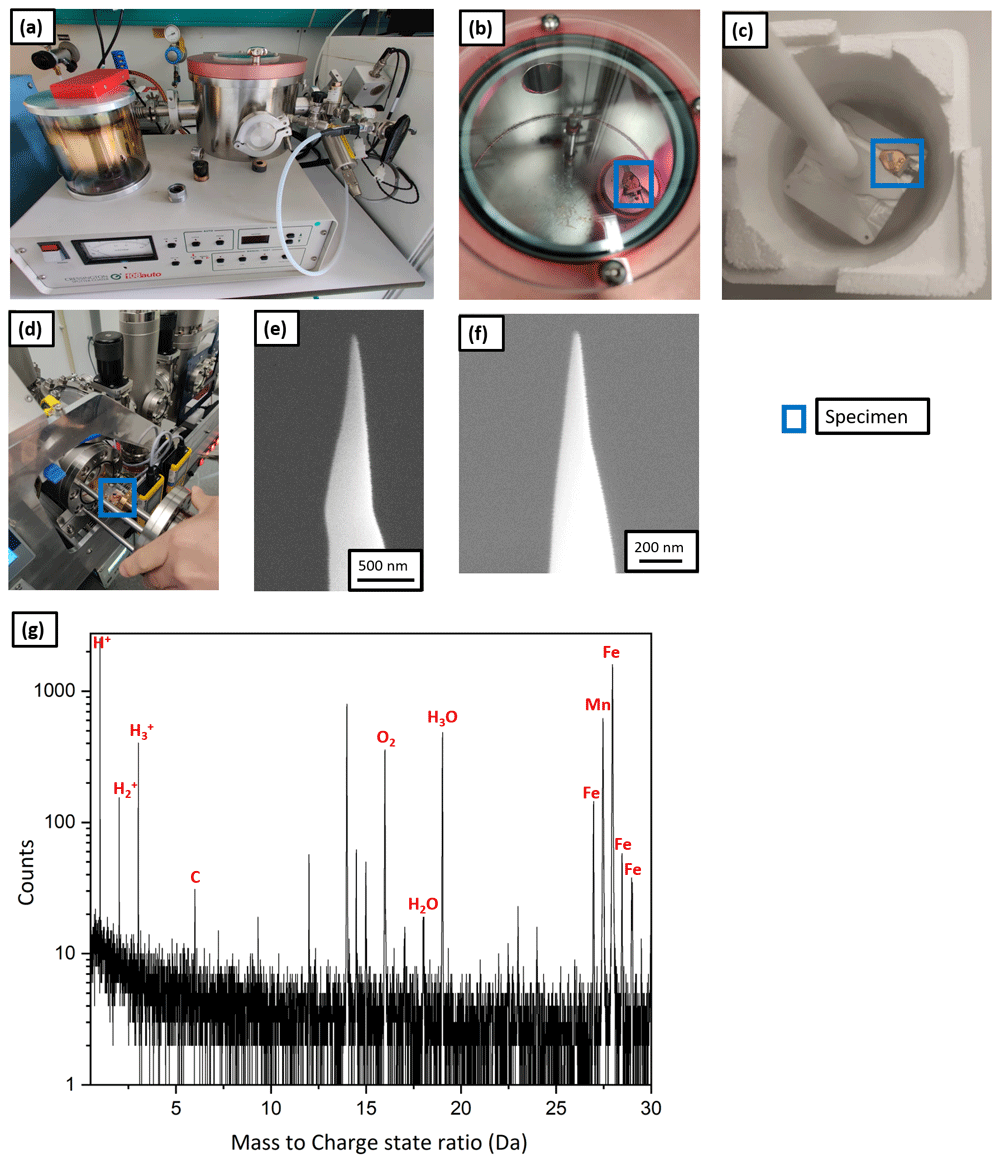
Figure 10.
(a) Plasma cleaner set up; (b) atom probe tomography specimen being charged with the hydrogen plasma; (c) the specimen placed on the precooled Al block for immediate quench post charging; (d) the specimen being transferred to the intermediate chamber of plasma focussed ion beam (PFIB); (e) scanning electron microscopy (SEM) image of the tip post charging and quenching; (f) SEM image of the same tip after resharpening in PFIB; (g) the corresponding mass spectrum.
Workflow W6 illustrates the plasma charging protocol. The APT specimens were prepared conventionally in the Ga FIB37 and were charged by the hydrogen-rich plasma for 1 h (shown in Figure 10 (b)) at a pressure of 10-1 mbar. Subsequently, they were immediately quenched in LN2 as shown by Figure 10 (c), and were transferred into the PFIB, on the pre-cooled cryostage through the intermediate chamber as depicted by Figure 10 (d). The SEM micrograph in Figure 10 (e) shows no frost on the specimen’s surface. It was resharpened at low kV (16 kV ion acceleration voltage and 30 pA beam current). Figure 10 (f) shows the SEM image of the tip after cleaning.
Finally, it was transferred into the LEAP 5000 XR for measurement through the precooled UHV suitcase and analysed. The corresponding mass spectrum is shown in Figure 10 (g) and eventually, the specimen fractured after only 100000 ions. During the APT analysis, hydrogen was detected in the mass spectrum at 1, 2 and 3 Da but its origin cannot be discerned. It could be from the specimen or from the analysis chamber of the atom probe. In addition, localised clusters of H2O, H3O were observed. These could originate from the vacuum in the plasma cleaner, which cannot be below 10-2 mbar, and hence not devoid of oxygen and moisture that introduced inside the specimen along with the hydrogen during charging. It might also be from mild frosting after plunge freezing and the introduction of O-containing surface species with the Xe-beam in the PFIB during sharpening.
Due to the relatively poor vacuum and associated implantation of impurities, we did not pursue this route for many more attempts. In principle, plasma cleaner directly attached to some commercial instruments could also be directly used to implant H by changing the gas supply for instance, which would enable these implantations in a cleaner environment and avoid the transfer through the UHV suitcase. However this has not, so far, been attempted.