Introduction
Portland Cement (PC) is still the main component in sealant materials used as annular seals as well as plugs in subsurface wells. However, PC-based materials are highly reactive with CO2, especially at the elevated temperatures and pressures expected in reservoirs at several km’s depth. This reactivity may lead to challenges to the (long term) integrity of wells exposed to CO2 during geological carbon storage (GCS – as part of Carbon Capture and Storage; CCS).
As part of the Cementegrity project, Van Noort et al.1,2 exposed samples of five different sealant compositions for up to 16 weeks to clean CO2, CO2 with H2S and CO2 with H2SO4, in the presence of water. During these exposures, sample cylinders were placed both above and below water, to expose them to either wet supercritical CO2, or CO2-saturated water. After the experiments, samples were studied and analysed using Scanning Electron Microscopy (SEM) with Energy Dispersive Spectroscopy (EDS), as well as Computed Tomography scanning (CT-scanning). While these analyses showed that exposure to CO2 with H2S or H2SO4 lead to differences in the microstructure and chemical composition of the reacted zones of exposed samples, mineralogical compositions, and exposure- and impurity-dependent changes in mineralogy were not addressed in these works.
In our previous work2, we noted that XRD analyses should be performed in order to enhance our understanding of the mineralogical changes induced in the exposed cement samples. Therefore, in this paper I present XRD analyses with Rietveld refinement on an unexposed sample of the sealant denoted as S1 (Class G PC with 35% by weight of cement silica flour), as well as on samples of this sealant exposed to clean CO2, CO2 with H2S, or CO2 with H2SO4, in the presence of water. In particular, I will focus on how the presence of S-based impurities affected the mineral assemblages that formed during CO2-exposure, and on the fate of these S-based impurities in CO2 when interacting with PC-based sealants in the GCS reservoir.
Sample preparation and analysis
The cement samples analysed here were batch-exposed to either CO2-saturated water or wet supercritical CO2, using clean CO2, CO2 containing 1.6 mol% H2S, or CO2 in equilibrium with concentrated H2SO4. Sealant samples were exposed for up to 16 weeks, with some samples placed near the bottom of the vessel (exposed to CO2-saturated water) and some samples placed in the top half of the vessel (exposed to wet supercritical CO2). For a full description of how these samples were prepared and cured, and then exposed, see 1,2. Additional exposures with a duration of 7 days were carried out by placing a single cylinder in a small titanium pot that was in turn placed inside a 100 ml Hastelloy pressure vessel, with either sufficient demineralised water in the titanium pot to fully cover the sample (exposure to CO2-saturated water), or with water added outside the titanium pot to saturate the CO2-phase (exposure to wet supercritical CO2 (see also 3). All samples were cylinders with a length of 30 mm and a diameter of ~12 mm. Note that only samples exposed for 16 weeks were analysed here, as other samples were not available.
Unexposed cylinders were crushed whole to obtain reference samples. For exposed cylinders, samples were prepared for analysis from different parts of the cylinder (see Figure 1), representing the inner, carbonated but intact zone, and different parts of the outer altered zone. For this purpose, first a disc of 2–3 mm was cut off the end of the exposed cylinder using a thin, water-cooled diamond saw. On most samples, top and bottom ends of the cylinders were both available, and easily distinguished. For these samples, discs were cut from both ends, marked as such, and analysed separately. After cutting the sample discs, they were ground down to a thickness of 1.8–2.1 mm on a diamond disc. On the samples exposed for 16 weeks to CO2-saturated water (with and without H2S), a thick precipitate layer was deposited on top of the samples. These deposits were scraped off and collected for separate analysis before cutting the top disc off the sample. Note that one end the sample exposed to supercritical CO2 without impurities (suspected to be the top of the cylinder, though this could not be ascertained with full certainty) looked quite different from the rest of the sample and the other sample exposed simultaneously, in particular as it was much more reddish in colour.
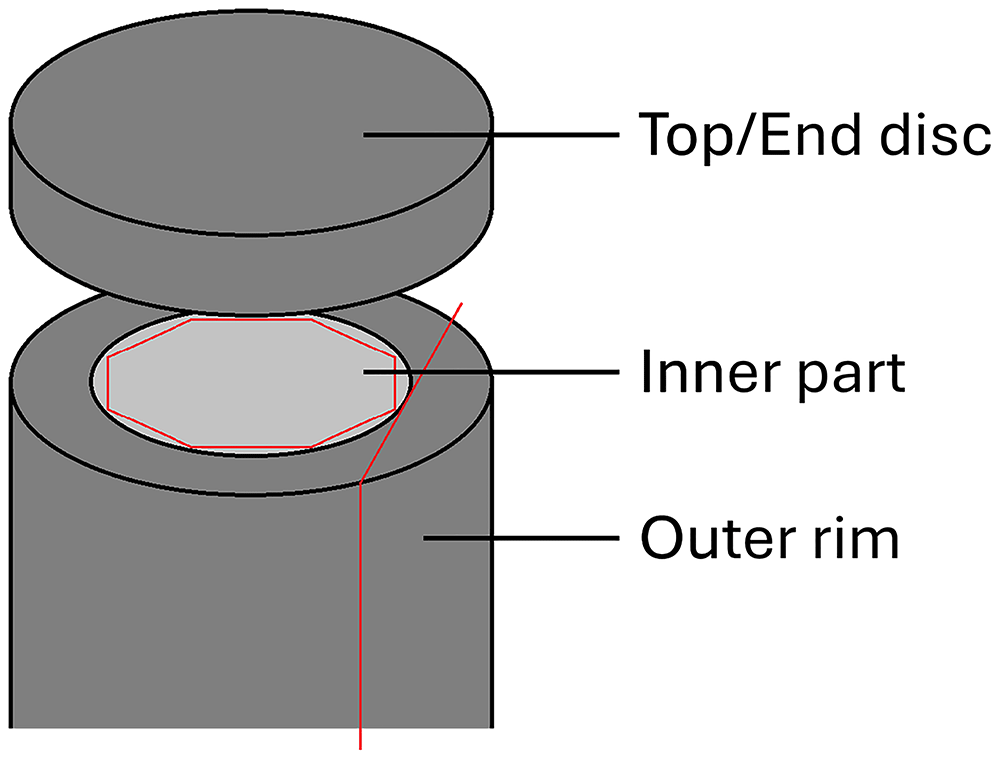
Figure 1. Schematic drawing illustrating the different sample parts cut and prepared for XRD analysis.
To obtain samples representative of the inner part of the sample, a cylinder of roughly 8 mm was cut closer to the centre of the sample, taking care to avoid visibly altered material from the top and bottom ends of the cylinder. Subsequently, ~3 mm was ground off from the sides of this cylinder, to obtain a roughly octagonal inner core prism with a maximum diameter of ~6 mm.
Finally, to assure a more direct comparison with the radial cross-sections imaged and analysed previously using SEM with EDS (see 1–3), thin vertical slices (1.5–2.0 mm) were cut around the outer rim of the sample, parallel to the cylinder axis. For the samples exposed for 16 weeks to CO2-saturated water with and without H2S (where an outer, altered rim was clearly visible) and for the samples exposed for 7 days (where a carbonated rim was clearly visible), extra care was taken to ensure only materials from the outer reaction rim were collected. Note that outer rim samples could not be taken from the sample exposed to supercritical CO2 with H2SO4, as insufficient material was available.
All samples obtained in these manners were gently crushed by hand using an agate mortar and pestle to obtain a fine powder. Before analyses, samples were spiked with Al2O3 (Alfa Aesar Aluminum oxide, alpha-phase, 99.99% (metals basis)) as an internal standard for quantification, by mixing 90 mg sample with 10 mg Al2O3, to give a spike content of 10±0.5%. Note that this was not done for analysis of the precipitates scraped off the exposed sample cylinders. Furthermore, for some samples additional measurements were performed without Al2O3 spike, to ensure that the samples did not contain Al2O3 before the spiking. To carry out the analyses, prepared samples were deposited onto a flat silicon plate by wetting the sample holder with isopropanol, and then gently distributing the powdered sample into that. As the isopropanol evaporated, this resulted in a thin, distributed powder layer on the Si-plate. Samples were then analysed in a Bruker D2 phaser, using Cu-radiation and LynxEye XE detector in Bragg-Brentano geometry. The patterns were measured over a 2θ range of 5–70° with a step size of 0.02°, and a count time of 1 s per step.
After analysis, peak identification was performed manually, using Bruker EVA software. Next, Rietveld refinement quantifications for the identified phases, as well as the amorphous content, were performed using the TOPAS V5 software4. In the refinement, a 5th order Chebychev background correction was used. In addition, a sample height correction was refined. Two additional (broad) peaks were allowed to improve background fitting. For individual phases, refinements were performed for lattice parameters, crystallite sizes (Lorentzian) and scale factors.
Results
Unexposed reference sample
Table 1 presents quantifications for the XRD analyses performed on all different parts of all exposed samples, as well as an unexposed reference sample. Table 2 provides an overview of all mineral phases included in the quantifications. All data files have all been deposited in an open repository5. For the unexposed reference sample, an amorphous content of about 63% is supplemented with ~19% tobermorite-11 Å, ~10% katoite, ~5% brownmillerite (i.e., ferrite), and ~2–3% quartz, mostly matching microstructural observations of a homogeneous cement gel matrix containing some larger quartz particles (see 1). Significant portlandite (Ca(OH)2 – free lime) was not detected, indicating that most Ca2+ was bound to the CSH-gel phases. Note that in this quantification, to obtain a strong match between pattern and refinement, eighth order spherical harmonics were used to correct for preferential orientation of the tobermorite.
Table 1. Rietveld quantifications for exposed cement samples as well as the unexposed reference sample.
Fe-(hydr)oxides combines quantifications for goethite and hematite. Fe-sulphides sums pyrite and pyrrhotites. The symbol “-” indicates minerals that were not included in the Rietveld analysis. “ND” indicates minerals that were included in the quantification, but were not detected (<0.05%). *) For the sample exposed to clean wet supercritical CO2, sample top and bottom were not marked. Disc 2 most likely represents the top, and Disc 1 the bottom.
| Exposed to | Impurity | Dur. (d) | Analysed part | Quartz | Tobermorite | Katoite | Brownmillerite | Portlandite | Calcite | Aragonite | Vaterite | Dolomite | Siderite | Fe-(hydr)oxides | Fe-sulphides | Gypsum | Anhydrite | Amorphous |
|---|
| - | - | - | - | 2.7 | 18.9 | 10.2 | 5.3 | ND | - | - | - | - | - | - | - | - | - | 62.8 |
| wet sc. CO2 | - | 7 | Inner part | 4.6 | 11.7 | 9.0 | 4.7 | - | 12.0 | 1.3 | 13.4 | - | - | <1 | - | - | - | 42.5 |
| wet sc. CO2 | - | 7 | Outer rim | 4.5 | <1 | - | 4.6 | - | 7.9 | 2.2 | 29.4 | - | - | <1 | - | - | - | 51.0 |
| CO2-sat. H2O | - | 7 | Inner part | 3.0 | 13.5 | 7.3 | 4.1 | - | 6.4 | 0.8 | 7.2 | - | - | 1.5 | - | - | - | 56.1 |
| CO2-sat. H2O | - | 7 | Outer rim | 3.2 | <1 | - | 4.6 | - | 5.9 | 3.2 | 28.5 | <1 | - | <1 | - | - | - | 53.6 |
| wet sc. CO2 | - | 112 | Inner part | 2.9 | ND | - | 2.3 | - | 7.8 | 1.0 | 27.0 | - | - | <1 | - | - | - | 58.9 |
| wet sc. CO2 | - | 112 | Disc 2* | 11.9 | <1 | - | 1.0 | - | 13.5 | 2.1 | 0.2 | - | - | 2.5 | - | - | - | 68.6 |
| wet sc. CO2 | - | 112 | Disc 1* | 3.3 | <1 | - | 1.2 | - | 6.9 | 5.9 | 14.8 | - | - | 1.0 | - | - | - | 66.8 |
| wet sc. CO2 | - | 112 | Outer rim | 3.0 | <1 | - | 2.6 | - | 8.7 | 8.7 | 22.3 | - | - | <1 | - | - | - | 53.9 |
| CO2-sat. H2O | - | 112 | Inner part | 3.2 | ND | - | 2.3 | - | 5.5 | 1.0 | 27.4 | - | - | <1 | - | - | - | 59.6 |
| CO2-sat. H2O | - | 112 | Top disc | 4.3 | ND | - | 3.2 | - | 11.7 | 8.4 | 3.8 | 1.1 | - | <1 | - | - | - | 66.8 |
| CO2-sat. H2O | - | 112 | Bottom disc | 5.7 | ND | - | 1.9 | - | 7.6 | 4.3 | 15.4 | ND | - | <1 | - | - | - | 64.7 |
| CO2-sat. H2O | - | 112 | Outer rim | 6.9 | ND | - | 2.6 | - | 13.6 | 7.1 | 1.5 | - | - | 1.1 | - | - | - | 67.2 |
| wet sc. CO2 | H2S | 112 | Inner part | 4.6 | ND | - | 2.3 | - | 7.1 | 1.3 | 26.1 | - | - | <1 | <1 | <1 | - | 57.6 |
| wet sc. CO2 | H2S | 112 | Top disc | 8.1 | ND | - | <1 | - | 11.0 | 3.7 | 8.2 | - | <1 | <1 | 1.0 | 5.2 | - | 61.3 |
| wet sc. CO2 | H2S | 112 | Bottom disc | 5.7 | ND | - | <1 | - | 10.5 | 4.7 | 17.7 | - | <1 | <1 | <1 | 1.5 | - | 57.7 |
| wet sc. CO2 | H2S | 112 | Outer rim | 3.6 | ND | - | 2.5 | - | 10.8 | 1.8 | 33.6 | - | <1 | <1 | <1 | <1 | - | 45.6 |
| CO2-sat. H2O | H2S | 112 | Inner part | 3.4 | ND | - | 2.8 | - | 7.4 | 2.1 | 34.6 | - | - | <1 | <1 | <1 | - | 48.5 |
| CO2-sat. H2O | H2S | 112 | Top disc | 2.7 | ND | - | 1.6 | - | 14.8 | 7.9 | 7.2 | - | - | <1 | <1 | <1 | - | 64.4 |
| CO2-sat. H2O | H2S | 112 | Bottom disc | 4.8 | ND | - | 2.6 | - | 9.4 | 6.6 | 13.5 | - | - | <1 | <1 | <1 | - | 61.2 |
| CO2-sat. H2O | H2S | 112 | Outer rim | 10.6 | <1 | - | <1 | - | 15.3 | 3.1 | 0.0 | - | 1.1 | 1.4 | 1.8 | 2.4 | - | 63.9 |
| wet sc. CO2 | H2SO4 | 112 | Inner part | 3.1 | ND | - | 4.1 | - | 11.8 | 17.5 | 11.7 | - | - | <1 | <1 | <1 | ND | 51.3 |
| wet sc. CO2 | H2SO4 | 112 | End disc | 4.8 | <1 | - | 4.3 | - | 10.6 | 11.4 | 23.3 | - | - | <1 | <1 | ND | <1 | 44.2 |
| wet sc. CO2 | H2SO4 | 112 | Outer rim | 6.6 | ND | - | 4.2 | - | 11.4 | 11.3 | 19.1 | - | <1 | ND | <1 | <1 | - | 46.6 |
Table 2. All minerals with chemical formulas and PDF-identifiers considered in the discussed XRD analyses and quantifications.
Abbreviations as used in Figure 2–Figure 5.
| Mineral name | Abbreviation | Chemical formula | PDF-identifier |
|---|
| Anhydrite | - | CaSO4 | 01-080-6360 |
| Aragonite | A | CaCO3 | 01-076-0606 |
| Brownmillerite | B | Ca2Al1.078Fe0.922O5 | 04-014-6640 |
| Calcite | C | CaCO3 | 01-078-4614 |
| Corundum | * | Al2O3 | 04-015-8996 |
| Dolomite | - | CaMg(CO3)2 | 04-015-9838 |
| Goethite | - | FeO(OH) | 04-014-5919 |
| Greigite | - | Fe3S4 | 04-008-7806 |
| Gypsum | G | CaSO4.2H2O | 00-033-0311 |
| Hematite | - | Fe2Oe | 00-033-0664 |
| Katoite | K | Ca2.916Al2(SiO4)1.092(OH)7.632 | 01-0754213 |
| Magnetite | - | Fe2.897O4 | 01-086-1343 |
| Portlandite | - | Ca(OH)2 | 00-044-1481 |
| Pyrite | - | FeS1.92 | 01-071-5207 |
| Pyrrhotite | P | Fe7O8 | 01-076-2308 |
| Pyrrhotite | - | Fe9S10 | 04-025-3489 |
| Pyrrhotite | - | Fe11S12 | 04-017-9146 |
| Quartz | Q | SiO2 | 04-027-5352 |
| Siderite | S | FeCO3 | 04-022-6948 |
| Tobermorite-11Å | T | Ca2.25Si3O6.5(OH)3.5 | 04-011-0271 |
| Vaterite | V | CaCO3 | 04-017-8634 |
| Wüstite | - | Fe0.914O | 04-026-3177 |
Exposure to clean CO2
Different exposure conditions resulted in different chemical and mineralogical compositions, especially in the outer parts of the exposed samples. Short-term (7 days) exposure to CO2-saturated water resulted in an outer zone, about 3.6 mm wide, where any free Ca(OH)2 had carbonated, and the pH had been reduced below 8.3 (as indicated using phenolphthalein – see 3). Further inwards of this, the material appeared mostly unaffected, and testing with phenolphthalein showed that a high pH (>8.3) was maintained, though minor Ca-leaching or partial carbonation could not be fully excluded. The XRD analyses carried out here (see Figure 2) indeed show the disappearance of tobermorite and katoite from the outer zone, and the precipitation of ~38% carbonates, of which 29% vaterite. In the inner part, tobermorite and katoite are still present (though tobermorite is somewhat reduced). Here, the analysis also shows ~14% carbonates (7% vaterite). However, while care was taken to separate inner and outer parts (based on colour differences), it is possible that some of the carbonated outer material was included in this analysis.
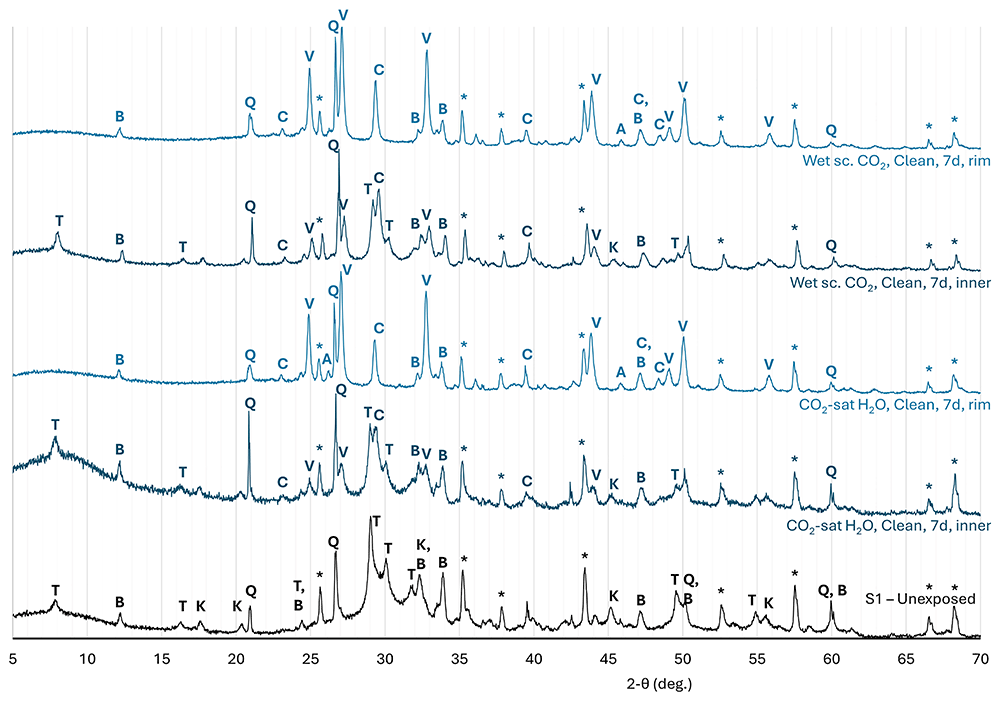
Figure 2. Normalised diffraction patterns measured on an unexposed reference sample of cement S1 (Class G PC with 35% BWOC silica flour), and on samples of the same cement exposed to clean CO2 for 7 days.
In the sample exposed to wet supercritical CO2 for 7 days, the carbonated outer zone was ~4.1 mm wide3. Here, XRD again shows the removal of tobermorite and katoite, along with the precipitation of 39% carbonates (29% vaterite). In the inner part, tobermorite and katoite contents are again somewhat reduced, and ~27% carbonate was detected (13% vaterite). However, due to small available sample size, here some inclusion of the carbonated outer material cannot be excluded, and this could explain the elevated carbonate content.
As reported previously1,2, exposure to CO2-saturated water resulted in significant Ca-leaching from, and alteration and degradation in, the outer part of the exposed sample, while the inner part was strongly carbonated but not altered significantly in its elemental composition. This is reflected in the XRD analyses on the inner and outer parts of the exposed cylinder (see Figure 3). In the inner part of the sample, tobermorite and katoite were no longer found and only minor brownmillerite remained, while carbonation also resulted in the precipitation of 34% carbonates, dominated by vaterite (27%). The nett amorphous content decreased somewhat (to 60%). In the outer part of the sample, 16 week exposure to CO2-saturated water resulted in the disappearance of nearly all crystalline gel phases (tobermorite and katoite, while some brownmillerite remained), while the carbonate content had decreased to ~25% with calcite (12%) being the prevalent carbonate, along with aragonite and some vaterite). As a result of these changes, the amorphous content had increased to 67%. Analysis of the precipitates scraped off the sample top surface indicated that these consisted mostly of aragonite, with some calcite.
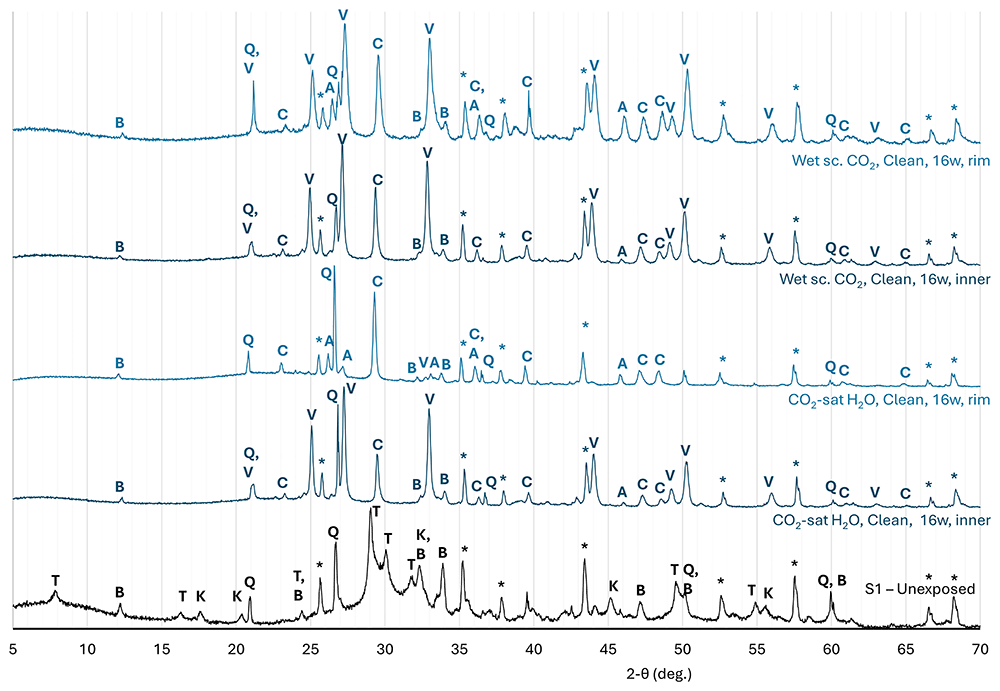
Figure 3. Normalised diffraction patterns measured on an unexposed reference sample of cement S1 (Class G PC with 35% BWOC silica flour), and on samples of the same cement exposed to clean CO2 for 16 weeks.
As the relatively high carbonate content measured in the top disc of the exposed sample appeared somewhat contrary to the strongly leached outer zone with highly depleted Ca/Si-ratio reported in Van Noort et al.2, the XRD-analyses were repeated on a bottom disc of the same sample cylinder, as well as on thin (<2 mm thick) slices cut parallel to the cylinder axis, from the altered outer rim. The goal of these additional analyses was to assess how representative the top disc analyses presented here (where Ca-leaching and carbonisation may have been inhibited by the thick precipitate layer) were in comparison to radial cross-sections. In the bottom disc, the overall carbonate content (~27%) was somewhat higher than that measured in the top disc, but, more notably, vaterite (15%) was the main carbonate phase here. The amorphous content (65%) was comparable to that measured in the top disc. In the outer rim, the overall carbonate content was somewhat lower (~22%) and dominated by calcite (14%) with aragonite (7%) leaving only little vaterite (~1–2%). The amorphous content (67%) was again comparable to that measured in the top and bottom discs.
In principle, direct exposure to wet supercritical CO2, as opposed to exposure to a volume of CO2-saturated water, should not result in significant Ca-leaching and degradation. Indeed, SEM imaging with EDS mapping1 show that elemental compositions did not change significantly. XRD analyses on the inner part of the sample show that this exposure did lead to the disappearance of crystalline gel phases (with the exception of some brownmillerite) and a carbonate content of ~36%, dominated by vaterite (~27%) and calcite (8%). As a result of these reactions, the nett amorphous content decreased somewhat, similar to the sample exposed to CO2-satured water (to ~59%). In the first end disc cut off this sample, which was most likely cut from the bottom part, the crystalline gel phases were similarly depleted, while the carbonate content was reduced to ~28%, comprising mostly vaterite (15%) with calcite (7%) and aragonite (6%), leading to an increased amorphous content of 67%. In the second disc (presumed cut from the top), considerably greater changes in mineral composition are observed, with an increase in quartz content to 12% and amorphous content (to 69%), a decrease in overall Ca-carbonate content to 16% (with nearly-complete removal of vaterite) and the appearance of ~2–3% Fe-(hydr)oxides, corresponding well to the dark reddish colouration of this part of the sample. To the contrary, in the outer rim sample, the overall carbonate content had increased to 40%, with a reduced vaterite content (22%) and increased calcite and aragonite contents (both ~9%). Here, the brownmillerite content was comparable to that measured in the inner part, while the amorphous content had decreased to 54%.
Exposure to CO2 with H2S
XRD analyses of the sealant samples exposed to CO2-saturated water in equilibrium with a CO2-phase containing 1.6 mol% H2S (leading to a H2S content in the hydrous phase of 0.087 mol% at initial equilibrium – see Figure 4) showed that this exposure again resulted in the disappearance of most of the crystalline gel phases, with the exception of some brownmillerite. However, in the inner part of the sample, a very high carbonate content (44%) was observed, with vaterite being the main carbonate phase (~35%). Furthermore, minor Fe-sulphides (pyrite and pyrrhotites) and gypsum were detected. The amorphous content was about 48%.
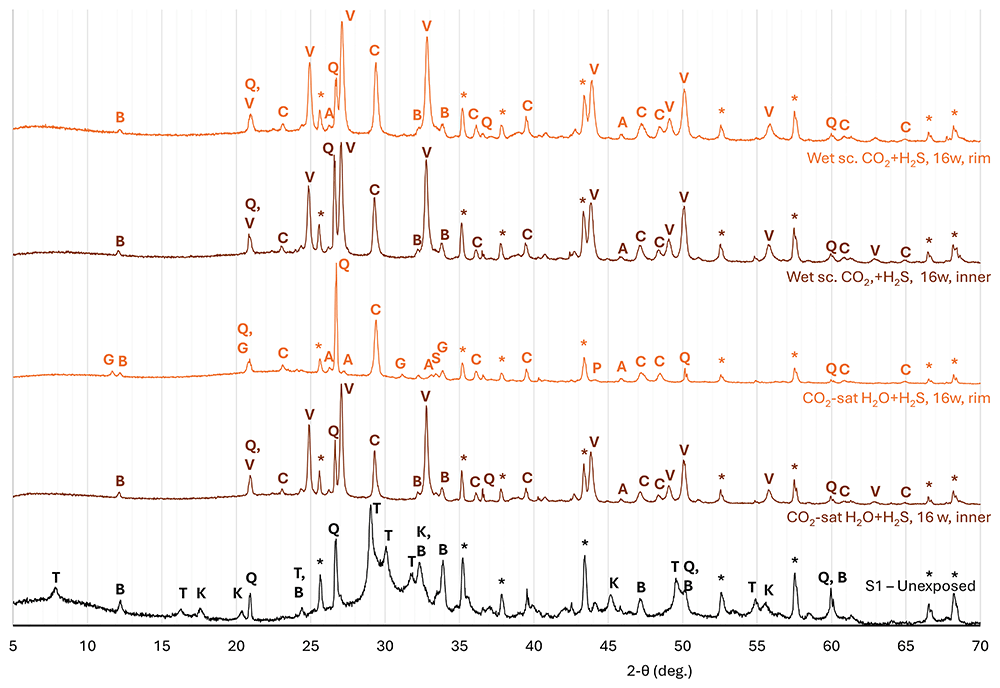
Figure 4. Normalised diffraction patterns measured on an unexposed reference sample of cement S1 (Class G PC with 35% BWOC silica flour), and on samples of the same cement exposed to CO2 with 1.6 mol% H2S for 16 weeks.
In the top disc analysed here, a relatively high carbonate content of ~30% was detected, with calcite as the dominant carbonate phase (15%), along with significant aragonite (8%) and vaterite (7%). The amorphous content had increased to 64%, which can be ascribed mostly due to carbonate removal compared to the inner part of the sample. While a minor increase in S-content was observed in the outer part of exposed samples (when considering the S/Si-ratio – see 2), only minor Fe-sulphides (less than 1% total pyrite and pyrrhotites), as well as minor gypsum were detected by XRD. Analysis of the precipitates scraped off the top of this sample showed that these mainly consisted of aragonite and calcite.
As for the sample exposed to water saturated with clean CO2, analysis of the sample exposed to water saturated with H2S-bearing CO2 was repeated on the bottom disc of the same sample cylinder, as well as on a sample cut from the outer rim. In the bottom disc, a comparable carbonate content of about 29% was observed, though with vaterite (13%) as the dominant carbonate phase. The amorphous content was also comparable, at ~61%. Similarly minor quantities of Fe-sulphides and gypsum were also detected. In the outer rim, however, the overall carbonate content had decreased significantly, to ~19% (dominated by 15% calcite, and including ~1% siderite, while vaterite was not detected). Furthermore, ~2% gypsum and ~2% Fe-sulphides were detected in this part of the sample, while the amorphous content (64%) was comparable to the top disc.
For the sample exposed directly to wet supercritical CO2 with H2S, in the inner part of the sample, all crystalline gel phases with the exception of some brownmillerite were removed, while carbonation led to a Ca-carbonate content of 34%, dominated by vaterite (26%) and calcite (7%). With regards to potential S-bearing phases, some Fe-sulphides were again observed here, along with (very) minor gypsum, correlating to a significantly increased S/Si-ratio. In the top part of the sample, the crystalline gel phases were mostly eliminated, while the carbonate content is reduced to about 24%, dominated by calcite (11%) and vaterite (8%). With regards to S-bearing phases, roughly 1% of Fe-sulphides were again observed, but more significantly, exposure in this part of the sample also resulted in the precipitation of ~5% gypsum. In the bottom part of this sample, the amorphous content (58%) and overall carbonate content (33%) were quite similar to the inner part; however, the vaterite content had decreased (to 18%) in favour of calcite (10%) and aragonite (5%), as well as 1–2% gypsum and minor Fe-sulphides. Most notable, the outer rim sample showed a further increase in Ca-carbonate content compared to the inner part (to 47%), with very high vaterite (33%) and somewhat elevated calcite (11%) contents. Contrary to the top and bottom parts of the sample, the analysis on the outer rim showed only negligible gypsum, while some Fe-sulphides and siderite were detected.
Exposure to CO2 with H2SO4
To expose samples to CO2 containing a realistically low concentration, but significant quantity of SO3 within the limitations of a batch apparatus, 2 exposed their samples directly to supercritical CO2 only, while open vials of concentrated H2SO4 were placed inside their reaction vessel. This allowed for exchange between the CO2-phase and the H2SO4, resulting in exposure of the samples to SO3-bearing CO2. SO3 would then dissolve into the hydrous phase in the cement pore network and hydrolyse to reform H2SO4. However, as discussed by 2, this method also resulted in partial desiccation of the cement samples, which may have inhibited reaction progression.
This is reflected in the XRD analyses of both the inner and outer parts of this sample (see Figure 5), which show the preservation of a higher content (~4%) brownmillerite in the exposed sample, as well as the precipitation of ~41% (inner) to ~45% (end disc) carbonate. Interestingly, while aragonite (17%) was the main carbonate in the inner part of the sample (along with ~12% each of calcite and vaterite), in the outer rim part of the sample, vaterite (19%) made up almost half of the 42% total carbonate content (along with 11% each of calcite and aragonite). Analysis of the end disc showed a higher vaterite content (23%), but similar calcite and aragonite contents (11% each). Only minor Fe-sulphides were detected in both the inner and outer parts of this sample. Interestingly, while very minor gypsum was detected in the inner part and outer rim of the sample, in the end disc analysed, this was replaced by anhydrite.
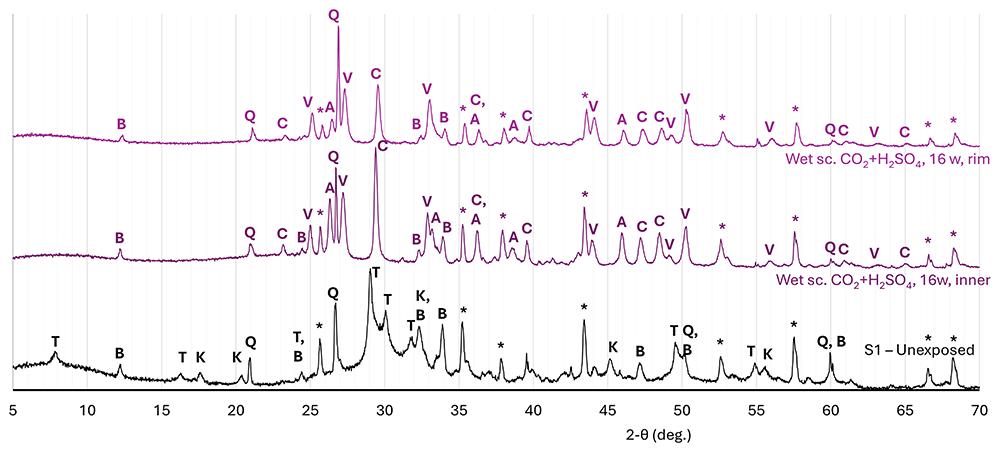
Figure 5. Normalised diffraction patterns measured on an unexposed reference sample of cement S1 (Class G PC with 35% BWOC silica flour), and on samples of the same cement exposed to CO2 in equilibrium with concentrated H2SO4 for 16 weeks.
Discussion and implications
Impact of exposure to clean CO2
The presented results show that exposure to both CO2-saturated water and wet supercritical CO2 first caused the disappearance of the crystalline cement gel phases tobermorite and katoite, while brownmillerite reacted more slowly. As these samples did not contain significant portlandite, the dissolution or leaching of Ca2+ from the CSH-gel phases then provided Ca2+ for the precipitation of Ca-carbonates, while the leached residues of the gel-phases most likely formed an amorphous Si-rich gel phase, though some crystalline quartz may also have precipitated as indicated by increases in quartz-content in some parts of the exposed samples.
As shown by the analyses on the outer parts of the samples exposed for 7 days, as well as the inner parts of samples exposed for 16 weeks, the dissolved Ca2+ initially precipitated locally within the samples, with this initial carbonate precipitation being dominated by metastable vaterite. Such initial precipitation of metastable vaterite instead of more stable Ca-carbonates calcite and aragonite is well documented in the literature (cf. 6–12), and may have been promoted in these samples by high supersaturation and/or the relatively high -content and thus lower Ca2+/-ratio due to high CO2-pressure and high (initial) pore water pH (cf. 6,13). Subsequently, as seen in the outer parts (top, bottom and outer rim) of the samples exposed for 16 weeks to CO2-saturated water, the precipitated vaterite dissolved again, and then either reprecipitated locally as more stable aragonite and/or calcite, or was transported away by diffusion through the pore fluid, leading to a decrease in overall Ca-carbonate content (from 34% to ~25%). Such diffusion was the main mechanism for the observed removal of Ca from, and therefore the degradation of, the exposed samples (see also 1). When comparing the analyses performed on different outer parts of the sample exposed to CO2-saturated water (top disc, bottom disc, and outer rim), the top disc and outer rim analyses give quite comparable compositions, but the bottom disc shows a higher vaterite content. While the sample holder was constructed with shallow recesses to stably hold the samples, and each recess had a hole to enable fluid access to the bottom surface of the sample (see 1), fluid access to the bottom parts was likely still restricted by the sample holders, inhibiting vaterite dissolution, and limited Ca-leaching from and CO2-diffusion into the bottom part of the sample. This resulted in slower progression of the alteration reactions here, explaining the relatively high vaterite content and overall Ca-carbonate content. However, it should also be noted that the CT-scanning images presented by 2 showed strong variability in density in the outer part of this sample, ascribed (by them) to different degrees of Ca-leaching and carbonate preservation, and the XRD analyses presented here provide an averaged analysis over the selected volume, and do not differentiate for this variability. Differences in composition between the top disc and the outer rim sample are very limited, suggesting that reactions in the top disc were not impacted significantly by the precipitate layer formed on top of the sample.
Interestingly, in the sample exposed to wet supercritical CO2, a similar reduction in overall (crystalline) carbonate content was detected between the inner (36%) and outer parts. In the (presumed) bottom part of this sample, both vaterite and calcite contents decreased, while aragonite increased. Here, the reduction in crystalline carbonate content (to 28%) was associated with an equivalent (8%) increase in amorphous content. In the other end disc, the Ca-carbonate content had been reduced very strongly (to ~16%), and was dominated by calcite (13%) while vaterite had disappeared. At the same time, the quartz content in this sample showed a strong increase (to 12%), and significant Fe-(hydr)oxide contents were also measured. However, as noted above, optical observations suggested this top part may have been altered anomalously compared to the rest of the sample as well as the other sample exposed simultaneously. The very strong reduction in carbonate-content (and increase in quartz content) suggest that Ca may have been leached from this sample part, which would require exposure to an aqueous fluid. One mechanism that could have caused this would be water-precipitation driven by a decreasing temperature gradient towards to the top of the exposure vessel leading to a flow of water along the sample. Note that the SEM micrographs presented by 1 do show minor signs of Ca-removal from the outer surfaces of the 4- and 8-week exposed samples, but not the 16-week exposed sample. In this regard, the outer rim sample, showing a strong increase in aragonite, and a minor decrease in vaterite content, as well as an overall increase in carbonate content compared to the inner part of the sample may be the most representative of the impact of exposure to wet supercritical CO2 without any leaching.
Overall, the samples studied here contained more calcite than aragonite. However, when comparing inner and outer parts of samples exposed for 16 weeks, typically, somewhat greater increases in aragonite than calcite are observed, though in the very strongly altered sample, aragonite had mostly disappeared in favour of calcite. While literature studies on the preferential precipitation of Ca-carbonate polymorphs have shown the preferential formation of aragonite at our exposure temperature (80 °C; cf. 14) pH variations and pore fluid chemistry (e.g., Ca2+/-ratio) may have also affected polymorph selection. Furthermore, in pure CaCO3-H2O-systems, Ca-carbonate phase transitions from metastable vaterite to calcite or aragonite typically take place within a day6. Therefore, the continued existence of vaterite after 16 weeks exposure further supports the notion that in the current samples, Ca-carbonate stability is likely affected by pore fluid chemistry composition factors, such as pH, Ca2+/-ratio, and the presence of (trace amounts of) other compounds, such as metal-cations or sulphate15, in the system.
Interestingly, the layer of precipitates found on the top surface of the sample exposed to CO2-saturated water comprised mostly aragonite, with some calcite. Here, the preferential precipitation of aragonite over the other Ca-carbonate polymorphs was likely due to the relatively high Mg/Ca-ratios in the external exposure fluid16,17, as at the end of the exposure a Mg/Ca molar ratio of 0.9 was measured (see 2). In addition, aragonite precipitation in the exposure fluid outside the sample may also have been promoted by relatively high aqueous carbonate-concentrations (e.g., 16).
Impact of H2S and H2SO4 on the carbonation and degradation processes
Within the carbonated inner parts of the exposed samples, the greatest impact of H2S was observed in the sample exposed to CO2-saturated water. Here, the presence of H2S resulted in a significantly higher vaterite content and overall carbonate content when compared to the equivalent sample exposed to CO2-saturated water without H2S. In the sample exposed to wet supercritical CO2, the presence of H2S had no significant impact on carbonate formation. Exposure to a supercritical CO2 phase in equilibrium with concentrated H2SO4, on the other hand, did result in a considerable difference in precipitated carbonate phases, with aragonite as the main carbonate phase, and calcite also more prevalent, while vaterite was suppressed. This also resulted in a somewhat higher overall carbonate content (41% vs. 36% or 34% for clean CO2 or CO2 with H2S, respectively), indicating that the presence of H2SO4 and/or the reduced water content resulted in increased carbonate stability, and that the change in carbonate phases resulted from a promotion of aragonite and calcite formation more than a reduction of vaterite precipitation.
While 2 did report elevated S/Si-ratios in the inner parts of samples exposed to CO2 with H2S, and a minor elevation in S/Si-rations in the inner parts of samples exposed to CO2 with H2SO4, only minor quantities of S-based phases were identified through XRD. These phases are Fe-sulphides (pyrite and pyrrhotites) and gypsum for both exposure to CO2 with H2S (CO2-saturated water as well as wet supercritical CO2) and to CO2 with H2SO4.
Within the outer zones of samples, the impacts of H2S and H2SO4 were more complicated. Focusing first on exposure to CO2-saturated water, and comparing the compositions of the outer rims, we observe significant reductions in Ca-carbonate contents for both samples. However, in the sample exposed with H2S, this reduction was considerably stronger, resulting in a lower overall Ca-carbonate content (19% vs. 22% for clean CO2). Furthermore, while in both samples, calcite was the main Ca-carbonate and vaterite had been almost fully dissolved, the sample exposed to water saturated with clean CO2 had a higher aragonite content (7% vs. 3%). These results support observations in 2, that the presence of H2S during exposure to CO2-saturated water resulted in lower carbonate contents and a greater degree of degradation in the outer rim. Exposure with H2S also lead to the precipitation of significant amounts of Fe-sulphides (~2%) and gypsum (~2–3%). The presence of Fe-sulphides was also noted by 2, who reported the presence of submicron particles consisting of Fe and S, with approximately 1.5–2 S per Fe, throughout the samples exposed to CO2 with H2S. When comparing the top disc samples, a higher overall carbonate content (30%) was detected in the sample exposed to CO2-saturated water with H2S, compared to the sample exposed to clean CO2 (25%), which can be ascribed to higher calcite (15% vs. 12%) and vaterite (7% vs. 4%) contents. This corresponds well to the higher vaterite and overall Ca-carbonate contents measured in the inner part of the H2S-exposed sample, suggesting that here, the presence of H2S mostly promoted initial Ca-carbonate precipitation but did not affect subsequent carbonate dissolution-reprecipitation. As in the inner part and outer rim, Fe-sulphides and gypsum were also detected in both the top and the bottom part of the sample exposed to CO2-saturated water with H2S, but their concentrations were too low for a quantitative comparisons.
As with clean CO2, the precipitates that formed on the top surface of the sample exposed to CO2-saturated water with H2S consisted mostly of aragonite, which can be ascribed again to the Mg/Ca molar ratio of 1.9 measured in the aqueous exposure fluid at the end of the exposure2. However, the precipitates formed during exposure in the presence of H2S show higher calcite peaks, indicating some calcite also formed here.
In the samples exposed directly to the CO2-phase, comparing the outer rims, the presence of H2S most notably led to a higher overall carbonate content (47% vs. 40%) driven by higher vaterite and calcite contents. However, a significantly higher aragonite content was measured in the sample exposed to clean CO2 (9% vs. 2%). The higher Ca-carbonate content in the presence of H2S measured here disagrees with the inference of 2, of somewhat lower carbonate contents in the outer rim of the sample exposed to wet supercritical CO2 with H2S, that was based on density contrasts in CT-scans and SEM micrographs. In addition, in the top disc sample the presence of H2S resulted in the precipitation of a significant quantity of gypsum (5%), as well as minor Fe-sulphides. The presence of such a significant quantity of gypsum requires oxidation of the H2S, which most likely took place through interactions with oxidized cations within the cement samples, such as Fe3+. This observation therefore highlights the need for an improved understanding of the potential fate of impurities such as H2S when injected into a geological reservoir during CO2-injection and storage, and the potential reactions between such impurities and not only major, but also trace minerals within the GCS reservoir. Furthermore, the precipitation of gypsum also indicates the presence of in the pore fluid. While this has been established to stabilise vaterite (cf. 15,18), no such effect was apparent here. Note that significant siderite, as might form when Fe2+ reacts with , was not detected in this sample.
Comparing the sample exposed to wet supercritical CO2 with H2S to that exposed to CO2-saturated water with H2S, within the inner parts overall carbonate contents are lower in the former. However, exposure to CO2-saturated water with H2S resulted in a very strong reduction in carbonate content between the inner part and outer rim, while exposure to wet supercritical CO2 with H2S resulted in a further increase in carbonate content between the inner part and outer rim. This very strong reduction in carbonate content observed for exposure to CO2-saturated water with H2S correlates well to the reported higher degree of leaching compared to clean CO2 based on analyses of exposure fluid chemical compositions2.
In the sample exposed to CO2 with H2SO4, the overall carbonate content in the inner part is higher than observed for clean CO2 or CO2 with H2S, driven mostly by a significantly higher aragonite content. Overall carbonate contents in the outer parts of the sample exposed to CO2 with H2SO4 fall within the range observed for the other samples exposed to the wet supercritical CO2 phase, but do comprise significantly higher aragonite contents, especially when compared to the sample exposed to CO2 with H2S. Furthermore, compared to the samples exposed to other CO2-compositions, the vaterite content in the inner part is much lower for the sample exposed to CO2 with H2SO4. This vaterite then increases significantly in the outer parts analysed, while for the samples exposed to clean CO2 or CO2 with H2S, except for the outer rim of the sample exposed to CO2 with H2S, the vaterite content decreased. While the higher vaterite content in the outer part of this sample could be a result of the 15,18, somewhat elevated S-contents (S/Si-ratios) were measured throughout this sample using EDS (see 2), meaning that the presence of sulphate should then also have resulted in a higher vaterite content in the inner part of the sample. Furthermore, as established above, also formed within the samples during exposure to CO2 with H2S. Therefore, it is more likely that in the outer part of the sample exposed to CO2 with H2SO4, the dissolution of vaterite and subsequent precipitation of calcite and aragonite were inhibited by the (partial) desiccation effect discussed by 2. This would also explain why the overall Ca-carbonate content in the outer zone is somewhat higher than in the inner zone (rather than being reduced as observed for clean CO2 or CO2 with H2S), and why Ca-carbonate contents in both zones are higher than observed in the other samples exposed to wet supercritical CO2. In addition, the overall carbonate contents are comparable to, if somewhat higher than, those measured in the outer rims of samples exposed to CO2 for only 7 days, though in those samples, vaterite was the main carbonate, while only minor aragonite (2–3%) was present. This observation suggests that the relatively high aragonite contents in both the outer zone and inner zones of the sample exposed to CO2 with H2SO4 are the result of a positive impact on aragonite formation rather than a negative impact on vaterite (or calcite) precipitation and preservation. Finally, while it has been established that can increase aragonite stability relative to calcite (e.g., 19,20), the reduction in pore water content due to the desiccation effect during the exposure to CO2 with H2SO4 potentially imposed a stronger control over Ca-carbonate polymorph selection. This is further supported by experimental research by 21, who reported the formation of aragonite during the exposure of crushed hydrated cement to CO2 with H2S under dry conditions.
Fate of S-compounds in CO2-exposed cement
The concentrations of S-impurities in the exposure fluids were low. For exposure to CO2 with H2S, 1.6 mol% H2S in the CO2-phase resulted in 0.087 mol% H2S in the H2O-phase at initial equilibrium, while even lower concentrations were measured on retrieved fluid samples (see 2). During exposure to CO2 with H2SO4, the maximum concentration of H2SO4 in CO2 was 0.091x10⁻³ mol%. Regardless, the EDS-mapping reported in 2 showed elevated S-contents, expressed as S/Si-ratios, in all samples exposed to CO2 with S-impurities, indicating that S-bearing minerals must have been present in these samples. One target of the present study was to identify these minerals, in order to better understand the fate of S-impurities in CO2 when this CO2 penetrates and reacts with a typical PC-based wellbore cement.
Significant concentrations of gypsum were detected in the top and bottom discs (5% and 1–2%, respectively) of the sample exposed to wet supercritical CO2 with H2S, as well as in the outer rim of the sample exposed to CO2-saturated water with H2S (2–3%). Otherwise, only negligible concentrations of gypsum (or anhydrite) were detected in any other samples. In the SEM study presented in 2, the presence of very small (submicron) particles composed of Fe and S (with about 1.5–2 S per Fe) was reported, indicating the potential formation of pyrite and/or pyrrhotites. In the XRD analyses presented here, Fe-sulphide concentrations (obtained by summing pyrite and pyrrhotite signals) were typically negligible to low (~1% or lower) in most samples. However, a concentration of almost 2% Fe-sulphides was measured in the outer rim of the sample exposed to CO2-saturated water with H2S. A similar apparent discrepancy between SEM/EDS and XRD was also reported by 22. Using SEM with EDS, they observed small (<5 µm) Fe-sulphide particles in Class H PC that had been exposed to CO2 with 21 mol% H2S at 50 °C. However, they did not detect significant quantities of Fe-sulphides in XRD, which they ascribed to Fe-sulphide particle sizes and crystallinities (see also 23).
The presence of Fe-sulphides is not surprising, and can be explained through direct interactions between the incoming H2S, and Fe-bearing phases such as Fe-(hydr)oxides and brownmillerite in the exposed cement. However, the relatively high gypsum contents observed in the end discs of the sample exposed to wet supercritical CO2 with H2S and the outer rim of the sample exposed to CO2-saturated water with H2S are more interesting, as the formation of gypsum requires the oxidation of introduced sulphide within the cement microstructure, through the reduction of oxidized phases there. Such reduction, for example of Fe3+, was already hypothesised in 2 based on the relatively dark, bluish colouration of the H2S-exposed samples, and was also proposed by 22,24 who reported the precipitation of sulphate-bearing ettringite in samples of, respectively, Class H PC and pozzolan-amended PC, exposed to CO2 with 21 mol% H2S at 50 °C. Indeed, the high gypsum contents measured here correlate to very strong reductions in brownmillerite content (to well below 1%). Furthermore, while 22,24 reported the presence of ettringite, in the samples discussed here, gypsum formed instead, as ettringite does not form at temperatures above ~70 °C (during cement curing – cf. 25). Furthermore, the formation of (metastable) gypsum instead of (stable) anhydrite can be explained by the fact that at our exposure temperatures, anhydrite precipitation is kinetically inhibited (cf. 26,27). Note that the precipitation of gypsum has been reported for cement samples exposed to H2S (without CO2) at even higher temperatures (cf. 28 and references therein). The absence of gypsum in the inner part of our samples, while 22 reported ettringite mostly in the inner parts of their samples, indicates that in our experiments, gypsum formation may have been a secondary reaction with Ca2+ provided by the dissolution of the initially precipitated vaterite. The absence of significant gypsum or anhydrite in the sample exposed to supercritical CO2 with H2SO4 can be explained by the low overall S-concentrations in the CO2-phase, and therefore low quantities of penetrating the exposed samples, but can also be related to the desiccation effect inhibiting further reaction after initial carbonate precipitation
Implications
The XRD analyses presented here, on cement samples exposed to wet supercritical CO2 and CO2-saturated water, using clean CO2, CO2 with H2S and CO2 with H2SO4 show that initial Ca-carbonate precipitation was, typically, dominated by metastable vaterite. During ongoing exposure, this vaterite then dissolved and partially reprecipitated as stable calcite or aragonite, while in samples exposed to CO2-saturated water, a portion of the dissolved Ca2+ was removed from the sample by leaching into the aqueous exposure fluid. The initial precipitation of metastable vaterite, and the subsequent degree to which this is transformed into more stable calcite or aragonite may have implications for the long-term integrity of exposed wellbore cements, especially when they become significantly exposed to aqueous fluids, and therefore leaching.
The presented analyses further show, that, in addition to affecting the relative stability of calcite, vaterite, and aragonite, even low concentrations of impurities (though, in the case of H2S here, still well above concentrations that would be expected during GCS of captured CO2) can have significant impacts on the resulting mineral assemblages. This is demonstrated most clearly in the top disc of the sample exposed to wet supercritical CO2 with H2S, where a low concentration of H2S (~1.6 mol%) strongly reacted with brownmillerite (of which there was ~5% in the hydrated cement starting material), leading to the near-complete dissolution of the brownmillerite, and the precipitation of a relatively large quantity of gypsum (~5%). Similarly, in the outer rim of the sample exposed to CO2-saturated water with H2S, brownmillerite was almost completely removed, while 2–3% gypsum was formed, as well as significant Fe-sulphides, and siderite.
Pore clogging due to Ca-carbonate precipitation has long been established as an effective mechanism for limiting diffusion, and therefore the inward progress of carbonation (e.g., 29–35). Considering gypsum’s large molar volume (74 cm3/mol vs. 37 cm3/mol for calcite), gypsum precipitation presents a considerably enhanced pore clogging potential, implying more effective inhibition of diffusion deeper into a cement-based well barrier. However, the long-term efficiency of pore clogging by gypsum will also be dependent on the stability of gypsum, and the potential transformation of gypsum to anhydrite or Ca-carbonate with associated decreases in molar volume.
These results thus demonstrate that even at low concentrations, impurities in CO2 can have relatively large impacts on both short- and long-term integrity of cement-based seals in wells through reactions with both main and minor mineral phases that affect the resulting mineral compositions. Furthermore, these impacts may be significantly different for exposure to CO2-saturated water compared to (wet) supercritical CO2. Therefore, models forecasting the long-term behaviour and integrity of cement-based seals must incorporate a thorough understanding of any relevant impurities, which needs to be based on experimental research. Further experimental research is thus required, exposing cement samples (as well as other relevant materials) to different impure CO2-compositions at relevant conditions (i.e., in-situ pressures and temperatures; (wet) supercritical CO2 vs. CO2-saturated water or brine; and impurity compositions and contents), and then employing a wide range of analytical techniques, on different scales, to identify and comprehend microstructural, chemical and mineralogical changes in the exposed samples. Both these experiments and the resulting models need to take into account the potential initial formation of metastable phases, such as vaterite and gypsum, as well as any subsequent transformation (through dissolution-reprecipitation or other mechanisms) into more stable phases.
In addition, the impact of impurities may be more pronounced along potential leakage pathways such as the cement-steeI and cement-caprock interfaces or cracks through the cement (as also argued in 2). Here, additional reactions may take place, for example with the steel wellbore, while a flow of impure CO2 along a leaky interface or crack can expose the sidewalls to much greater quantities of reactive impurities. Therefore, the role of these interfaces and any interplay with (reactive) impurities needs to be assessed experimentally as well. Quite different mineral assemblages were indeed observed in some of the end discs analysed here, compared to the outer rims of the same samples (cf. the top discs of samples exposed to clean wet supercritical CO2 and wet supercritical CO2 with H2S), showing that different chemical environments can indeed develop and exist at relatively small scales (i.e., within our cylinders with total length 30 mm), even at nominally static exposure conditions, and that these different environments may result in quite different mineral assemblages. These observations reaffirm the importance of accurately simulating, both in experiments and numerical models, the expected exposure environment(s) to obtain representative results, and avoid (experimental) artefacts. Finally, the results presented that are complementary to the work presented previously 1,2 also demonstrate the importance of using a wide range of analysis to thoroughly assess microstructural and chemical changes as well as changes in mineral compositions to fully understand how complex materials such as cements are affected by exposure to CO2 with and without (reactive) impurities. Further work is also needed to address the impact of other (reactive) impurities and combinations of impurities that have not yet been tested experimentally.
Conclusions
XRD analyses were performed on samples of cement (Class G PC with 35% by weight of cement silica flour – Cementegrity S1) that had been exposed to (wet) supercritical CO2 and CO2-saturated water, using clean CO2, CO2 with 1.6 mol% H2S, and CO2 in equilibrium with concentrated H2SO4. These are the main findings:
- Ca-carbonates initially precipitated predominantly as metastable vaterite. During ongoing exposure, this vaterite was then partly replaced by more stable calcite and aragonite, most likely through a dissolution-precipitation process. In samples exposed to CO2-saturated water, this transformation was associated with a reduction in overall crystalline carbonate content, while in samples exposed to (wet) supercritical CO2, carbonate contents further increased.
- In the samples exposed to CO2-saturated water, the presence of H2S mostly promoted initial precipitation of Ca-carbonates, especially vaterite. During continued exposure, however, a stronger reduction in Ca-carbonate was observed with H2S, leading to a lower overall carbonate content. Furthermore, (minor) Fe-sulphides and gypsum were detected after exposure with H2S, especially in the outer rim of the sample.
- In the samples exposed to wet supercritical CO2, the presence of H2S did not significantly impact initial Ca-carbonate precipitation. However, during ongoing exposure, Ca-carbonate contents increased more significantly than without H2S, with both calcite and vaterite contents increasing. Furthermore, in the top part of the exposed sample, significant gypsum was detected, which was associated with the almost complete disappearance of brownmillerite.
- In the samples exposed to supercritical CO2 with H2SO4, within the inner part of the sample, aragonite was the main Ca-carbonate, while calcite was also promoted and vaterite was suppressed. This resulted in higher overall (crystalline) Ca-carbonate contents. In the outer parts, vaterite was the main carbonate, while aragonite contents were relatively high. While is known to affect Ca-carbonate polymorph stability, the desiccation effect caused by the presence of concentrated H2SO4 within the reaction vessel likely imparted a stronger impact on mineral changes here. Only very minor Fe-sulphides and gypsum and/or anhydrite were detected using XRD.
- Significant gypsum was detected in outer parts of samples exposed to CO2 with H2S, and associated with a strong local decrease in brownmillerite content. These observations indicate that Ca2+ was most likely provided by the dissolution of initially precipitated, metastable vaterite, while the oxidation of S2- to form proceeded through the reduction of Fe3+ (from brownmillerite) to Fe2+.
- This oxidation of sulphide to sulphate presents an important mechanism controlling the fate of the H2S-impurity upon entering a cement-based sealant. Similar reactions with reservoir minerals should also be expected, with potentially relatively large impacts in the near-wellbore area.
- While the impacts of the impurities tested here were, overall, relatively minor, the precipitation of a significant quantity of gypsum upon exposure to CO2 with H2S was a significant change, demonstrating the need for a thorough understanding of potential impurity-mineral interactions, in order to properly forecast long-term wellbore seal integrity during the injection and storage of CO2 with impurities.
- The impact of even low concentrations of impurities may be greatly enhanced along leakage pathways (i.e., cracks or leaky interfaces) in the well system, where a flow of CO2 may continuously provide a supply of impurities.
Ethics and consent
Ethical approval and consent were not required.







