Introduction
Background and motivation
The interconnected challenges of climate change, food system transformation, biodiversity loss, and resource depletion demand analytical tools that can capture the complex feedback loops governing Earth system dynamics.1,2 Integrated Assessment Models (IAMs) have emerged as central instruments for exploring these interdependencies, linking multiple sectors, such as for example, climate, energy, food, land use, economy, and society, within unified analytical frameworks that enable researchers and policymakers to evaluate the long-term consequences of human actions on the Earth system.3,4 The Intergovernmental Panel on Climate Change (IPCC) has relied extensively on IAMs for its assessment reports, underscoring their role in shaping global climate policy.5
Despite their analytical power, IAMs suffer from a persistent accessibility gap. The majority of operational IAMs require proprietary modelling software, specialised technical expertise, and substantial computational resources, effectively restricting their use to well-resourced research institutions and limiting the diversity of perspectives that inform model-derived insights.6,7 This exclusivity is particularly problematic given that climate change and food system transformation are challenges affecting all sectors of society, requiring tools that are comprehensible and actionable by diverse stakeholders.8 The IPCC’s Sixth Assessment Report identified a critical knowledge gap concerning the potential of demand-side mitigation, specifically how widespread behaviour and lifestyle changes occur through the dynamic interaction of individual, social, economic, and environmental factors.5 Addressing this gap requires not only models capable of representing these interactions but also interfaces that make such models accessible to non-expert users.
Interactive Simulation Environments (ISEs) offer a promising pathway to bridge this accessibility gap by providing user-friendly, web-based interfaces that translate complex model parameters into intuitive controls and present outputs through clear, interactive visualisations.9,10 Significant and notable efforts towards this direction include the En-ROADS climate solutions simulator, developed by Climate Interactive, MIT Sloan, and Ventana Systems, which compiles a system dynamics model to WebAssembly for real-time browser-based policy exploration.11 The En-ROADS simulator has demonstrated the transformative potential of making climate models accessible to broad audiences, having been used by national government leaders, business executives, and educators worldwide.11 Similarly, the C-ROADS simulator enables users to test and visualise the long-term impacts of climate strategies across regional groups.11
However, existing web-based IAM tools primarily focus on energy and emissions systems and do not adequately capture the food-land-biodiversity nexus or the behavioural dynamics that drive sustainability transitions. The FeliX (Full of Economic-Environment Linkages and Integration dX/dt) model, developed at the International Institute for Applied Systems Analysis (IIASA), is a system dynamics-based IAM that uniquely incorporates human behaviour as an endogenous driver of global environmental change.12,13,14 FeliX captures the complex interconnections between climate, food, land use, biodiversity, water, fertiliser, and population systems, with a distinguishing focus on how individual beliefs, social norms, and collective action shape sustainability outcomes.13 The integration of behavioural parameters, self-efficacy, social norms, perceived risks, and response efficacy, separates FeliX apart from conventional IAMs that treat human behaviour as an exogenous input rather than a dynamic, modelled component.13,14
Previous work by the authors explored the intersection of technology and food system awareness through mixed reality eye-tracking investigations of food consumption habits,15,16 establishing a foundation for understanding how interactive technologies can influence dietary choices and sustainability awareness. Building upon this earlier research and extending our preliminary work,17 the present paper provides a comprehensive description of the FeliX ISE, an open-source, browser-based Interactive Simulation Environment that makes the full FeliX model accessible to non-expert users through standard web browsers.
Contributions
The contributions of this paper can be summarised as follows:
• (a) The design and implementation of a fully client-side web application that compiles a complex system dynamics IAM (over 1,300 model elements including 91 stocks) from Vensim to WebAssembly using the SDEverywhere toolchain, enabling real-time in-browser model execution without server-side computation.
• (b) A configuration-driven architecture that decouples the model from the user interface through open data formats configuration files, making the approach directly transferable to any Vensim-based system dynamics model.
• (c) A user-centred interface design that mainstreams complex IAM modelling results through simplified input controls, contextual tooltips, informative hover descriptions, and a structured two-panel layout that makes visually explicit which inputs affect which outputs and how the modelled systems are interconnected, significantly lowering the expertise barrier compared to existing IAM tools.
• (d) An interactive scenario exploration interface featuring multi-scenario comparison, progressive disclosure mechanisms, and comprehensive contextual documentation that supports users ranging from expert modellers to non-specialist policymakers and citizens.
• (e) A three-level validation framework encompassing model conversion numerical comparison, and full input-space automated QA testing, demonstrating high precision fidelity across the transpilation pipeline.
• (f
) A preliminary demonstration of the tool’s transferability by loading an SIR epidemiological model through the same interface without code modifications.
• (g) The release of the complete source code and deployed application as open-source resources, supporting reproducibility and community-driven extension.
Paper structure
The remainder of this paper is organised as follows. Section 2 reviews related work on IAM accessibility, web-based simulation tools, and system dynamics model deployment. Section 3 describes the methodology, encompassing the FeliX model, the software architecture, the design approach, and the user interface. Section 4 presents the results, including scenario demonstrations and a transferability evaluation. Section 5 discusses the implications, limitations, and future directions. Section 6 concludes the paper.
Related work
Integrated assessment models and their accessibility
Integrated Assessment Models have been developed to understand the complex interactions between human and natural systems across multiple temporal and spatial scales.3,4 Prominent IAMs include IMAGE, MESSAGE, REMIND, and GCAM, which have been instrumental in generating the scenarios underpinning IPCC assessment reports.5,18 These models typically operate within specialised modelling environments, such as GAMS, Vensim, or custom Fortran/C++ implementations, and require significant computational resources and expert knowledge to configure, run, and interpret.6
The system dynamics modelling example presented in the work of Forrester19 and subsequently applied to global challenges by Meadows et al.,20 offers a distinct approach to integrated assessment. Unlike computable general equilibrium (CGE) models that assume systems tend toward equilibrium states, system dynamics models explicitly represent feedback loops, delays, and non-linear interactions that generate emergent system behaviour.21,22 This example is particularly suited to capturing the path dependencies, tipping points, and behavioural dynamics that characterise sustainability transitions.13 Notable system dynamics-based IAMs include the World3 model,20 the iSDG model developed by the Millennium Institute,23 and the Earth4All model,24 all of which share a commitment to representing systemic feedback mechanisms.
Several initiatives have sought to improve IAM accessibility. The IIASA Scenario Explorer provides a web-based database for querying and visualising IAM scenario outputs, though it does not support interactive model execution.25 The Global Calculator, developed by the UK Department of Energy and Climate Change, offered a simplified web-based tool for exploring energy and land use pathways but has since been decommissioned.26 The iSDG model has been deployed through interactive web interfaces in specific country contexts.23 More recently, the Earth4All initiative has released scenario tools that communicate model results to broader audiences.24 However, none of these efforts combine full in-browser model execution with the thematic breadth of a comprehensive IAM covering climate, food, biodiversity, and behavioural dynamics.
Web-based system dynamics model deployment
The deployment of system dynamics models as web applications has been enabled by advances in web technologies, particularly WebAssembly (Wasm), a binary instruction format designed as a portable compilation target that enables high-performance execution in web browsers.27 WebAssembly provides near-native execution speed while running within the browser’s security sandbox, making it an ideal target for computationally intensive scientific models.27
The SDEverywhere toolchain, developed by Climate Interactive, is an open-source collection of libraries and command-line tools that transpile Vensim system dynamics models into C code, which can then be compiled to JavaScript or WebAssembly.28 SDEverywhere has been in production use since 2019, powering the En-ROADS and C-ROADS climate policy simulators that collectively have been used in engagements with over 100 national government leaders worldwide.11,12,28 The toolchain provides a plugin-based architecture supporting configuration management, WebAssembly compilation, Web Worker integration for non-blocking computation, and Vite-based build processes for modern web development workflows.28
Web Workers, a standard browser API, enable multi-threaded computation in web applications by running scripts in background threads separate from the main user interface thread.29 This capability is essential for interactive scientific simulations, where computational operations must not block user interface responsiveness. The combination of WebAssembly for high-performance model execution and Web Workers for non-blocking computation provides the technical foundation for responsive, browser-based simulation environments.
Complementary tools in the system dynamics ecosystem include PySD, which translates Vensim and XMILE models to Python,30 and Simlin, a browser-based model editor that imports Vensim and XMILE formats.31 However, these tools primarily target model developers rather than end users seeking to explore scenarios through intuitive interfaces.
The FeliX integrated assessment model
The FeliX model has undergone continuous refinement through multiple research programmes.12,13,14,33 The model consists of nine integrated modules, population, education, economy, energy, water, land, food, carbon cycle/climate, and biodiversity, connected through extensive feedback mechanisms that capture the complex dynamic behaviour characterising the Anthropocene.14
A distinguishing feature of FeliX is its endogenous representation of human behaviour in the food and dietary domain. Eker et al.13 extended the model with a behavioural diet shift module based on key theories from environmental psychology, capturing the role of psychological and social factors, including climate risk perception, self-efficacy, and social norms, alongside traditional socioeconomic drivers such as income and education level. This work demonstrated that social norm effects and self-efficacy are the principal drivers of global diet change, with implications that extend beyond food systems to affect land use, greenhouse gas emissions, and biodiversity.13 The FeliX 2.0 version, described by Ye et al.,14 refined the model’s population dynamics, food and land use systems, and socioeconomic settings, with robust calibration against historical data since 1950 and projections fully aligned with IPCC assessment scenarios.
FeliX has also been applied to a wide range of sustainability challenges, including emission pathways analysis,32 poverty alleviation strategies,34 sustainable development goal interactions,35 and the assessment of demand-side mitigation potential.13 The model’s baseline scenario maps to benchmark Representative Concentration Pathway (RCP) and Shared Socioeconomic Pathway (SSP) outcomes, enabling robust conclusions regarding the relative impact of various policies and technologies.14 As of 2025, a regional version (FeliX-R5) has been developed based on five United Nations regional classifications, facilitating fine-scale analysis of socioeconomic-environmental dynamics that account for geographic, socioeconomic, and cultural differences.14
Behaviour change and food system modelling
The role of human behaviour in driving sustainability transitions has received increasing attention in the integrated assessment community.13,36,37 Traditional IAMs often treat dietary shifts and lifestyle changes as exogenous assumptions, essentially external scenarios imposed on the model rather than emergent outcomes of modelled behavioural dynamics.6,13 This limitation has been recognised as a critical gap, particularly for assessing demand-side mitigation potential in food systems.5
Research on the drivers of dietary change has identified multiple interacting factors, including health awareness, environmental concern, cultural norms, economic constraints, and food availability.13,38,39 The protection motivation theory and social identity theory provide theoretical foundations for understanding how perceived risks, self-efficacy beliefs, and social norms interact to drive behaviour change.13,40 FeliX utilises these theoretical constructs within a system dynamics framework, allowing the exploration of how policy interventions targeting different behavioural levers propagate through interconnected food, land, climate, and biodiversity systems.13,14
Food loss and waste reduction represents another critical demand-side intervention, with the United Nations estimating that approximately one-third of food produced for human consumption is lost or wasted globally.41 The FeliX ISE enables users to explore distinct producer-side (loss) and consumer-side (waste) reduction strategies and observe their differential impacts on food system sustainability, land use, and environmental outcomes.
Methods
The model is implemented in Vensim DSS and consists of over 1,300 elements including 91 stocks, with its outcomes determined by interacting reinforcing and balancing feedback loops.14 The behavioural diet shift module13 incorporates self-efficacy, social norms, perceived risks, and response efficacy as endogenous drivers of dietary change. The model’s temporal scope spans from 1950 to 2100, with historical calibration ensuring coherence with observed data and future projections aligned with established IPCC scenario frameworks.14 The baseline scenario maps to the SSP2 (“Middle of the Road”) pathway and RCP benchmark outcomes.14
Software architecture
Technology stack
The FeliX ISE is a static web application built using HTML5, CSS3, JavaScript, and TypeScript. The underlying FeliX model has been transpiled from its native Vensim format to C code and subsequently compiled to WebAssembly (Wasm) using the SDEverywhere (SDE) toolchain.28 This compilation pipeline enables the full system dynamics model to execute directly in the user’s browser without requiring any server-side computation, ensuring privacy, offline capability, and reduced latency.
TypeScript was adopted extensively for code development, providing static type checking for early error detection, improved code readability, and enhanced maintainability. Data visualisation is implemented through Chart.js,42 a free and open-source JavaScript library supporting line graphs and stacked area charts essential for displaying temporal dynamics of complex system indicators.
Figure 1 illustrates the overall software architecture, showing the compilation pipeline from Vensim through SDEverywhere to WebAssembly.
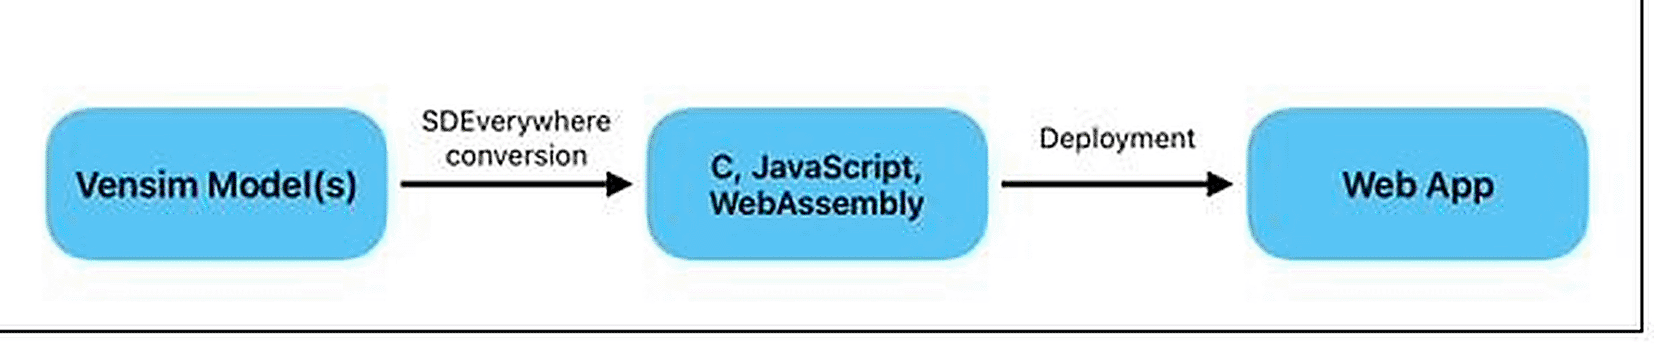
Figure 1. High-level software architecture of the FeliX ISE, showing the compilation pipeline from the vensim model (.mdl) through the SDEverywhere toolchain to webAssembly, and the runtime architecture with Web Workers for non-blocking computation.
SDEverywhere build pipeline
The SDEverywhere toolchain provides the core build pipeline for translating the Vensim model into a web-executable format.28
Table 1 lists the key packages used in the FeliX ISE and their roles. The @sdeverywhere/plugin-config package was significantly extended with additional columns beyond default capabilities to support the rich configuration schema required by the FeliX ISE. These extensions include category groupings, secondary input types, hover descriptions, segmented button rendering, Material UI icons, markdown description references, range definitions, and enabled/disabled value specifications.
Table 1. SDEverywhere packages used in the FeliX ISE build pipeline.
| Package | Version |
Role |
|---|
| @sdeverywhere/build | 0.3.4 | Core build and plugin API enabling extensible model processing pipelines |
| @sdeverywhere/check-core
| 0.1.2 | Model checking and comparison functionality ensuring model validity |
| @sdeverywhere/cli | 0.7.23 | Command-line interface facilitating automated build and CI workflows |
| @sdeverywhere/plugin-check
| 0.3.5 | Model check and comparison test runner for quality assurance |
| @sdeverywhere/plugin-config
| 0.2.4 | CSV-based configuration reader enabling the configuration-driven architecture |
| @sdeverywhere/plugin-vite
| 0.1.8 | Vite integration for asset bundling and hot module replacement |
| @sdeverywhere/plugin-wasm
| 0.2.3 | WebAssembly module builder for high-performance browser execution |
| @sdeverywhere/plugin-worker
| 0.2.3 | Web Worker generator for asynchronous model computation |
| @sdeverywhere/plugin-worker
| 0.2.3 | Web Worker generator for asynchronous model computation |
Real-Time computation via Web Workers
The FeliX ISE ensures real-time responsiveness by running the core system dynamics model within a dedicated worker thread using the @sdeverywhere/plugin-worker package. This plugin generates a worker.js file that executes the model asynchronously in a Web Worker,29 preventing heavy computational tasks from blocking the main UI thread. When a user modifies an input parameter, an event is dispatched to the worker where the model recalculates all outputs. Once computation is complete, the updated results are transmitted back to the main thread and reflected in the output visualisations. This architecture guarantees that the interactive experience remains smooth and immediate regardless of model complexity.
Figure 2 illustrates the separation between the main UI thread and the worker thread, with event-based communication for input dispatch and result retrieval.
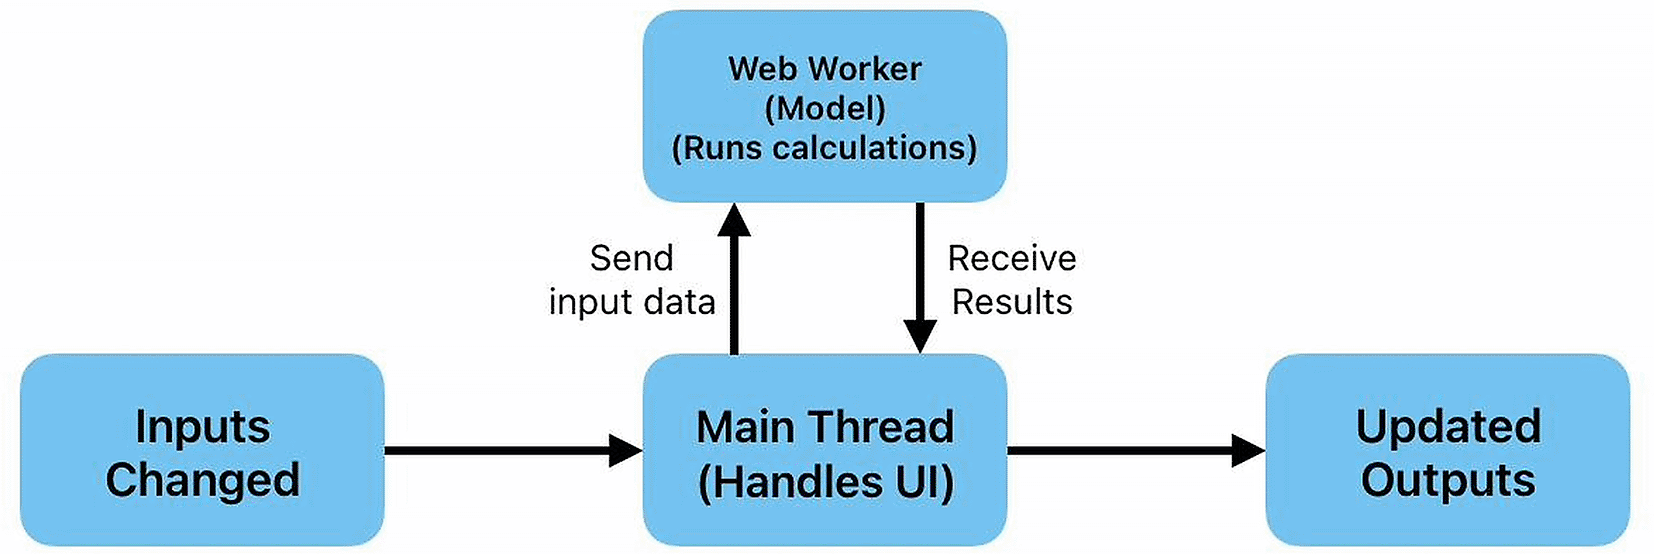
Figure 2. Web workers architecture diagram showing the separation between the main UI thread and the worker thread, with event-based communication for input dispatch and result retrieval.
Configuration-Driven Interface Design
A key architectural innovation of the FeliX ISE is its configuration-driven approach to interface design. Rather than hard-coding interface elements, the system utilises two configuration files based on open data formats, one for model inputs and another one for model outputs (i.e. graphs.csv), that specify input parameters, output variables, visualisation formats, and interface organisation. The application code is entirely decoupled from these configuration files. Each modification to these files triggers a new build process that regenerates the interface components without altering the application codebase. This design enables efficient collaboration between IAM modellers and software developers, as modellers can modify interface configurations without programming expertise. The input configuration file employs a rich schema supporting diverse input types and configurations.
Table 2 summarises the key input characteristics.
Table 2. Key input configuration parameters defined in the input file schema.
| Parameter | Description |
|---|
| id | Unique identifier for each input enabling programmatic reference |
| Input type | Interaction modality (slider, switch, segmented button) |
| categoryid | Category classification enabling logical grouping |
| input group | Hierarchical section organisation supporting progressive disclosure |
| secondary type | Nested grouping for dropdown main/assumption separation |
| slider min/max/step | Range and granularity definitions for continuous inputs |
| hover description | Contextual information displayed on hover |
| md description | Reference to detailed markdown documentation |
The graph configuration file defines output visualisations with comparable granularity, including graph classification, scenario assignment, chart type (line, stacked-area), axis ranges and labels, plot variables, styles, labels, colours, and reference line specifications. Fields introduced as extensions to the default @sdeverywhere/plugin-config capabilities are marked, significantly expanding the visualisation options beyond standard SDEverywhere templates.
Figure 3 shows an example of the input file schema structure, while
Figure 4 presents the corresponding graph configuration file format.
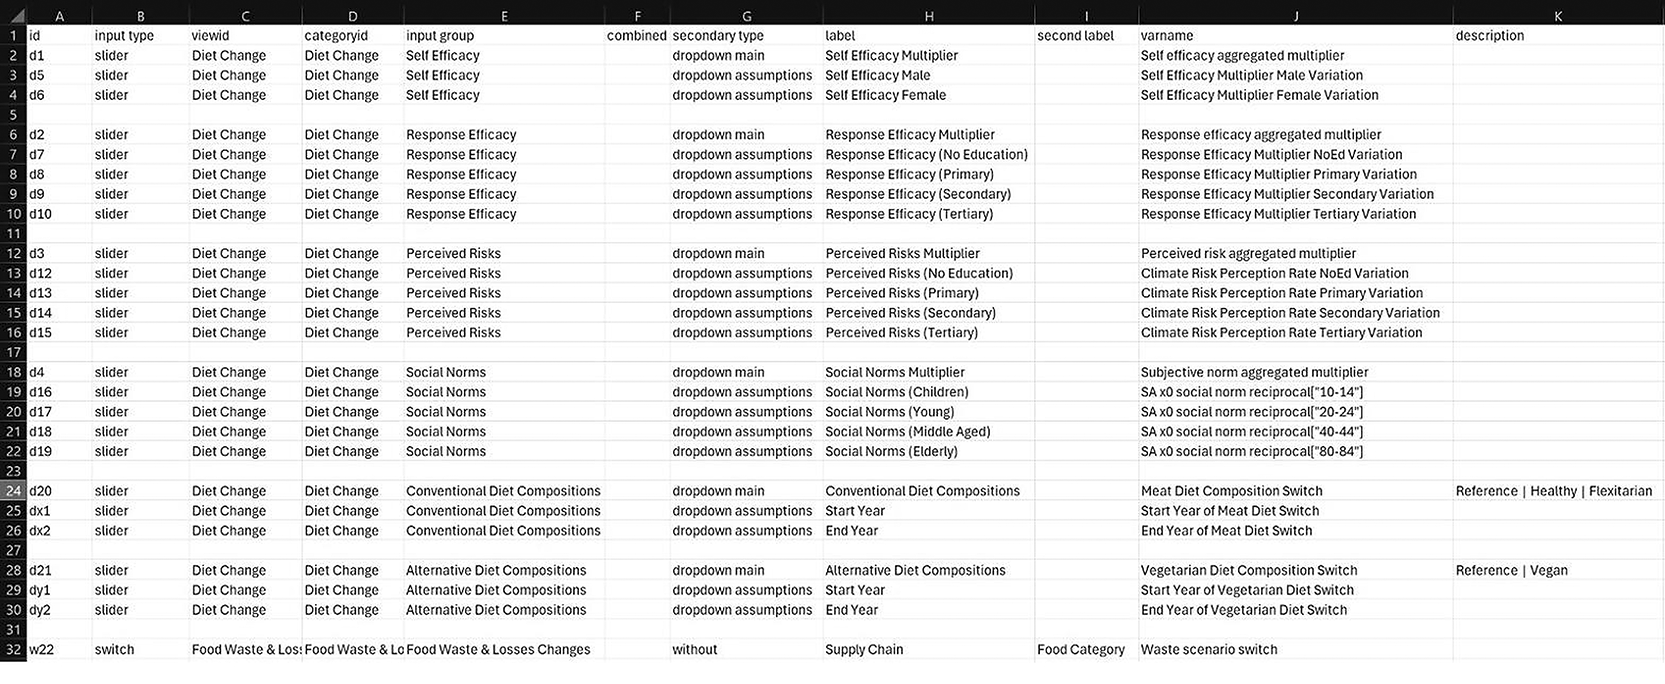
Figure 3. Example structure of the input configuration file, showing the schema used to define input parameters, their types, ranges, and interface groupings.
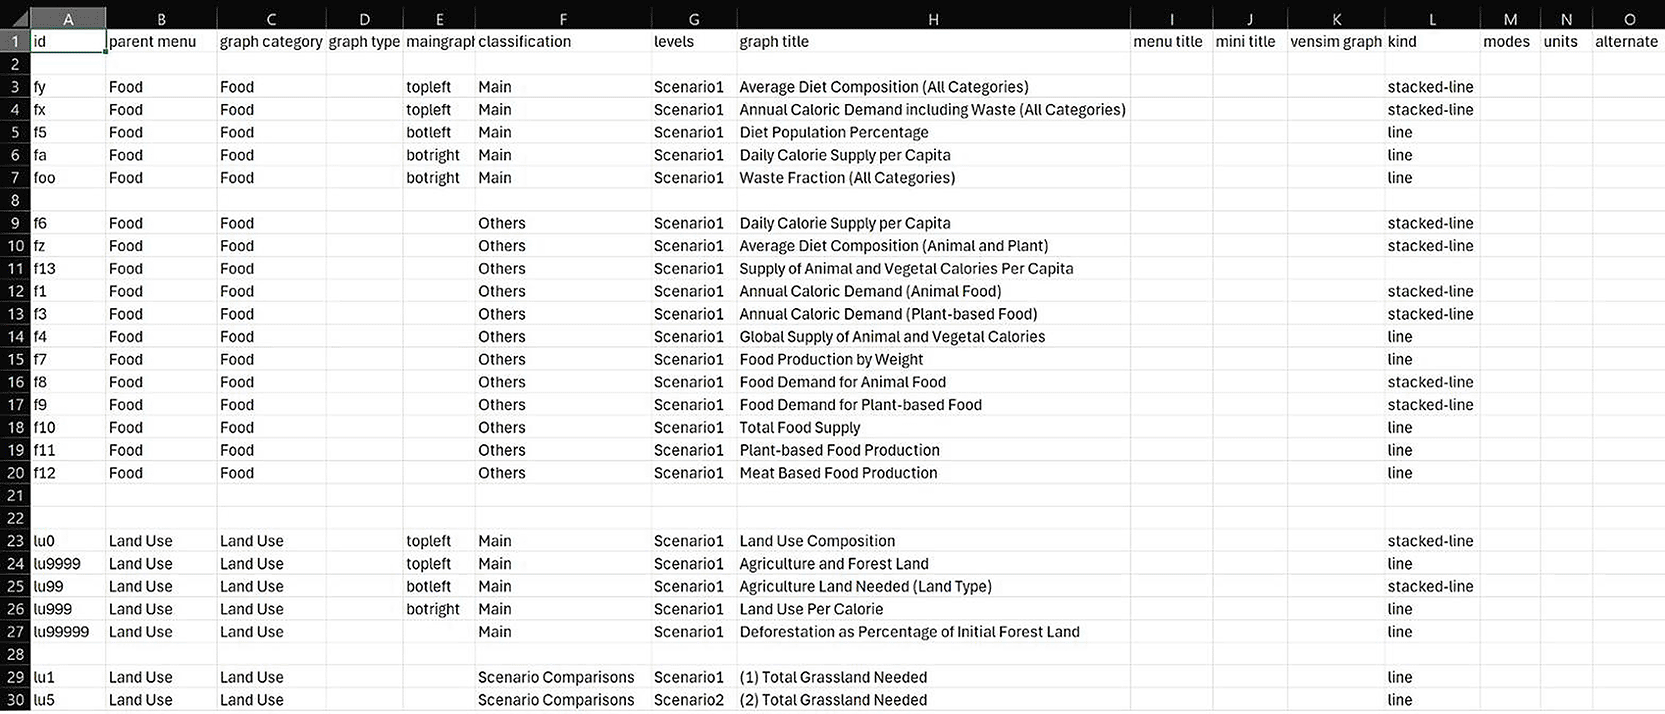
Figure 4. Example structure of the graph configuration file, demonstrating the configuration-driven approach to output visualisation specification.
Deployment
The FeliX ISE is deployed as a static site via GitHub Pages, accessible at https://climatechoice.github.io/felix/. Since no server-side computation is required, the entire application, including the compiled WebAssembly model, is served as static assets. The Vite build process handles bundling, asset optimisation, and the conversion of markdown documentation files into static assets that are loaded on demand. The source code for the FeliX ISE dashboard is available under an open-source licence at https://github.com/climatechoice/felix,43 and the underlying FeliX model is available at
https://github.com/iiasa/Felix-Model
.44
User interface design
Design principle
The user interface design was guided by the challenging objective of mainstreaming complex IAM modelling results for non-expert audiences without sacrificing scientific depth. This was achieved through principles of progressive disclosure, whereby information is revealed incrementally to avoid overwhelming users with complexity. This approach is particularly important for IAM interfaces, where the depth and breadth of available parameters and outputs can be intimidating to non-expert users.
The design adopts a two-panel layout that maps the analytical workflow of adjusting input parameters (left panel) and observing output results (right panel), providing a clear spatial metaphor for the cause-and-effect relationship between scenarios and outcomes. The FeliX ISE translates complex model variables into intuitive, human-readable input controls, sliders, segmented buttons, and switches, accompanied by contextual tooltips and expandable markdown descriptions that explain, in plain language, what each parameter represents and how it connects to broader system dynamics. This design philosophy ensures that the interface communicates not only the values of inputs and outputs but also the systemic interconnections between them, enabling users to build an intuitive understanding of how food, climate, biodiversity, and behavioural systems interact.
Input section
Input variables are organised around behaviour change scenarios structured into three main tabs: Actions, Uncertainties, and External Drivers.
Table 3 provides a summary of the scenario input categories.
Table 3. Summary of FeliX ISE scenario input categories and their descriptions.
| Input Tab | Variable Type | Description |
|---|
| Actions | Diet Change | Exploration of global dietary transition impacts across four compositions: Reference, Healthy, Mediterranean, and Flexitarian |
| Food Loss and Waste | Producer-side loss reduction and consumer-side waste reduction strategies |
| Alternative Proteins | Technological replacement trajectories for pasture meat, crop meat, dairy, and eggs |
| Uncertainties | Population Dynamics of Diet Change | Behavioural drivers including self-efficacy, response efficacy, perceived risks, and social norms |
| Food Access and Inequalities | Distribution parameters affecting food equity |
| Responses to Food Loss and Waste | Producer and consumer response mechanisms |
| Technologies of Alternative Protein | Commodity-specific replacement parameters |
| By Food Category | Per-category adjustments across eight food groups |
| External Drivers | Periods of Change | Transition timing and duration for each scenario dimension |
| Socio-Economic Drivers | RCP emission trajectories and SSP socioeconomic pathways |
Users interact with the model through four input widget types: continuous sliders for parameters with defined ranges, switches for binary options, segmented buttons for discrete category selection (e.g., diet type), and combined sliders for coupled parameters (e.g., scenario shift start year and duration). Each input modification triggers instant model recalculation via the Web Worker architecture.
Figure 5 presents an overview of the complete FeliX ISE interface with its four main sections.
Figure 6 shows the tabbed organisation of input categories,
Figure 7 demonstrates the progressive disclosure mechanism through collapsible input groups, and
Figure 8 illustrates the segmented button widget used for discrete variable selection such as diet composition.
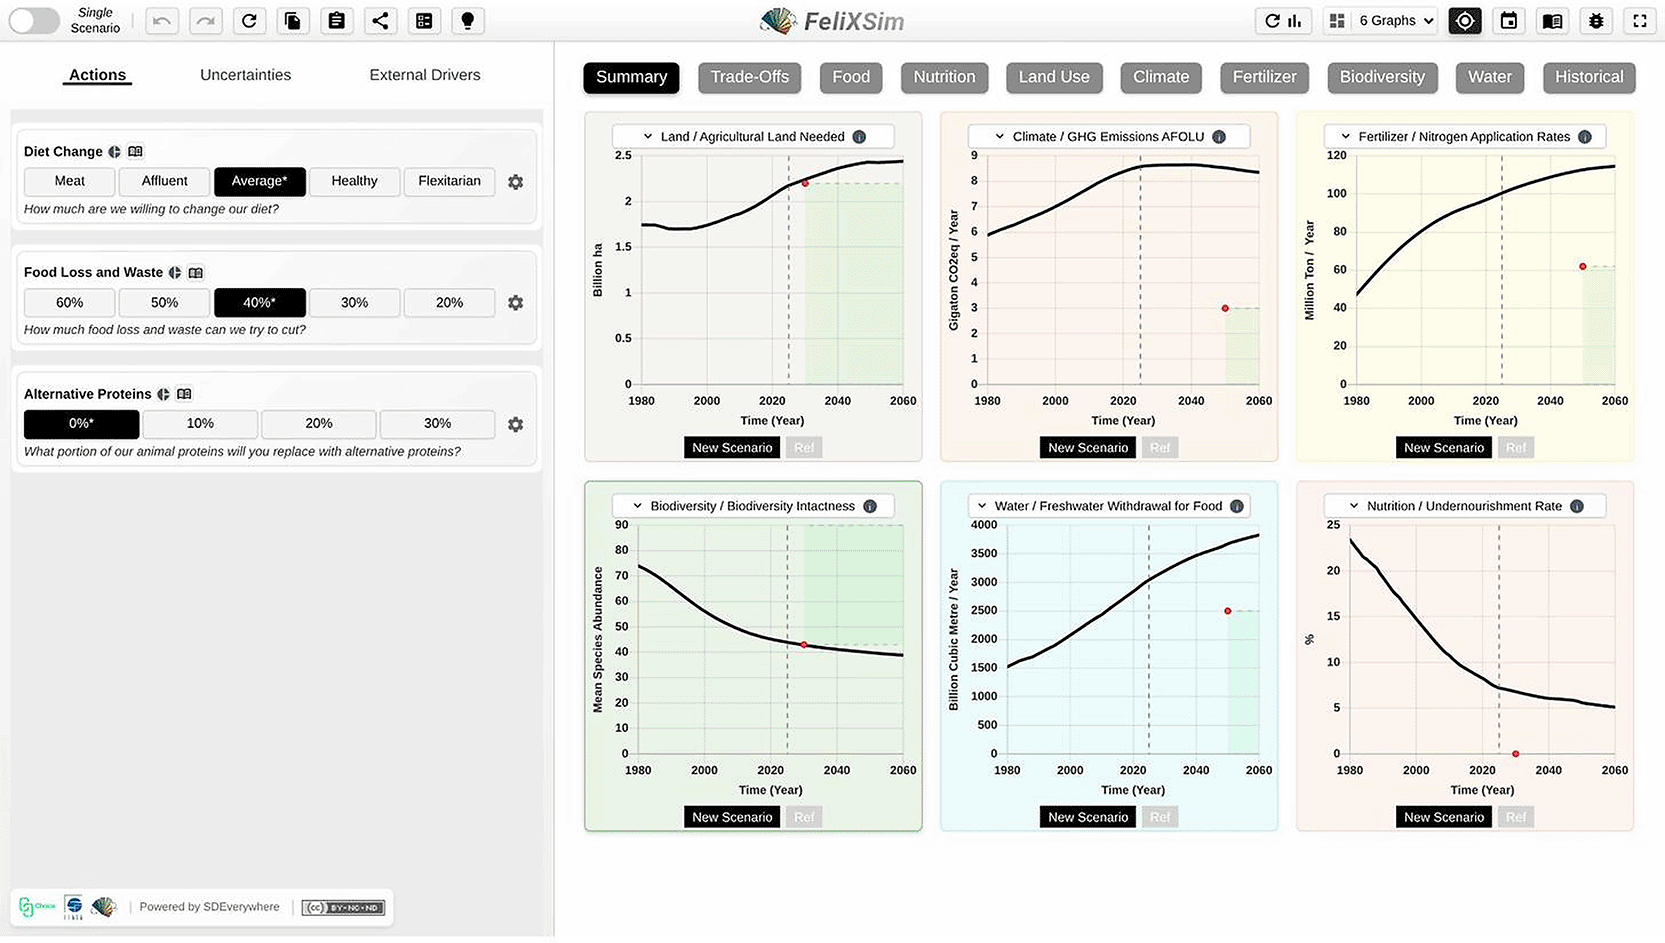
Figure 5. The FeliX ISE online tool showing the four main user interface sections.

Figure 6. Input categories displayed at the top of the input section, showing the tabbed organisation of actions, uncertainties, and external drivers.
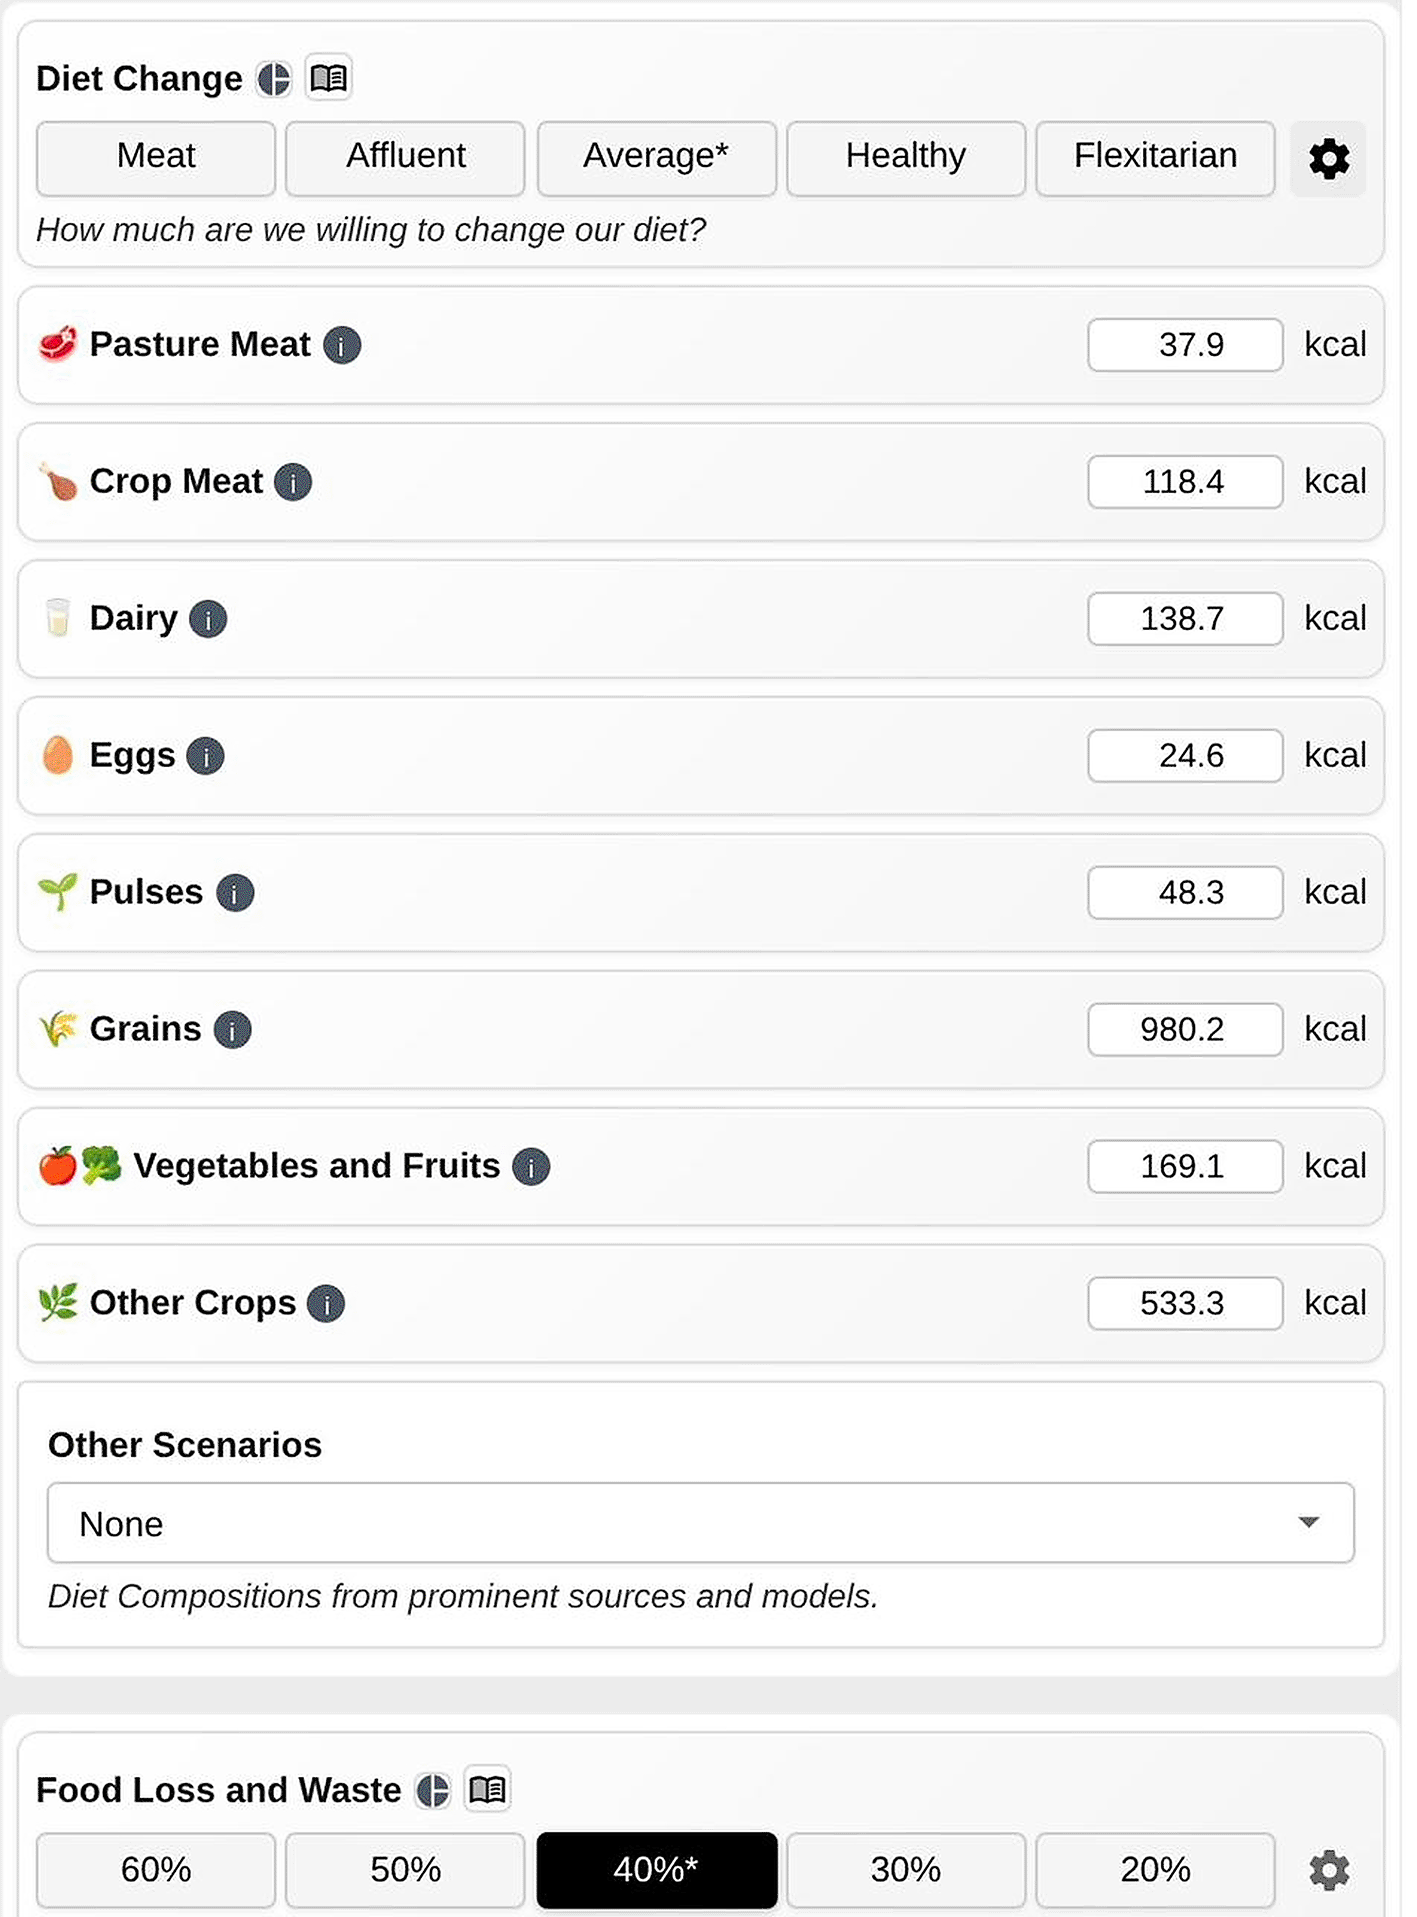
Figure 7. Collapsed (top) and expanded (bottom) input dropdowns showing the progressive disclosure of main and assumption-level sliders within each input group.
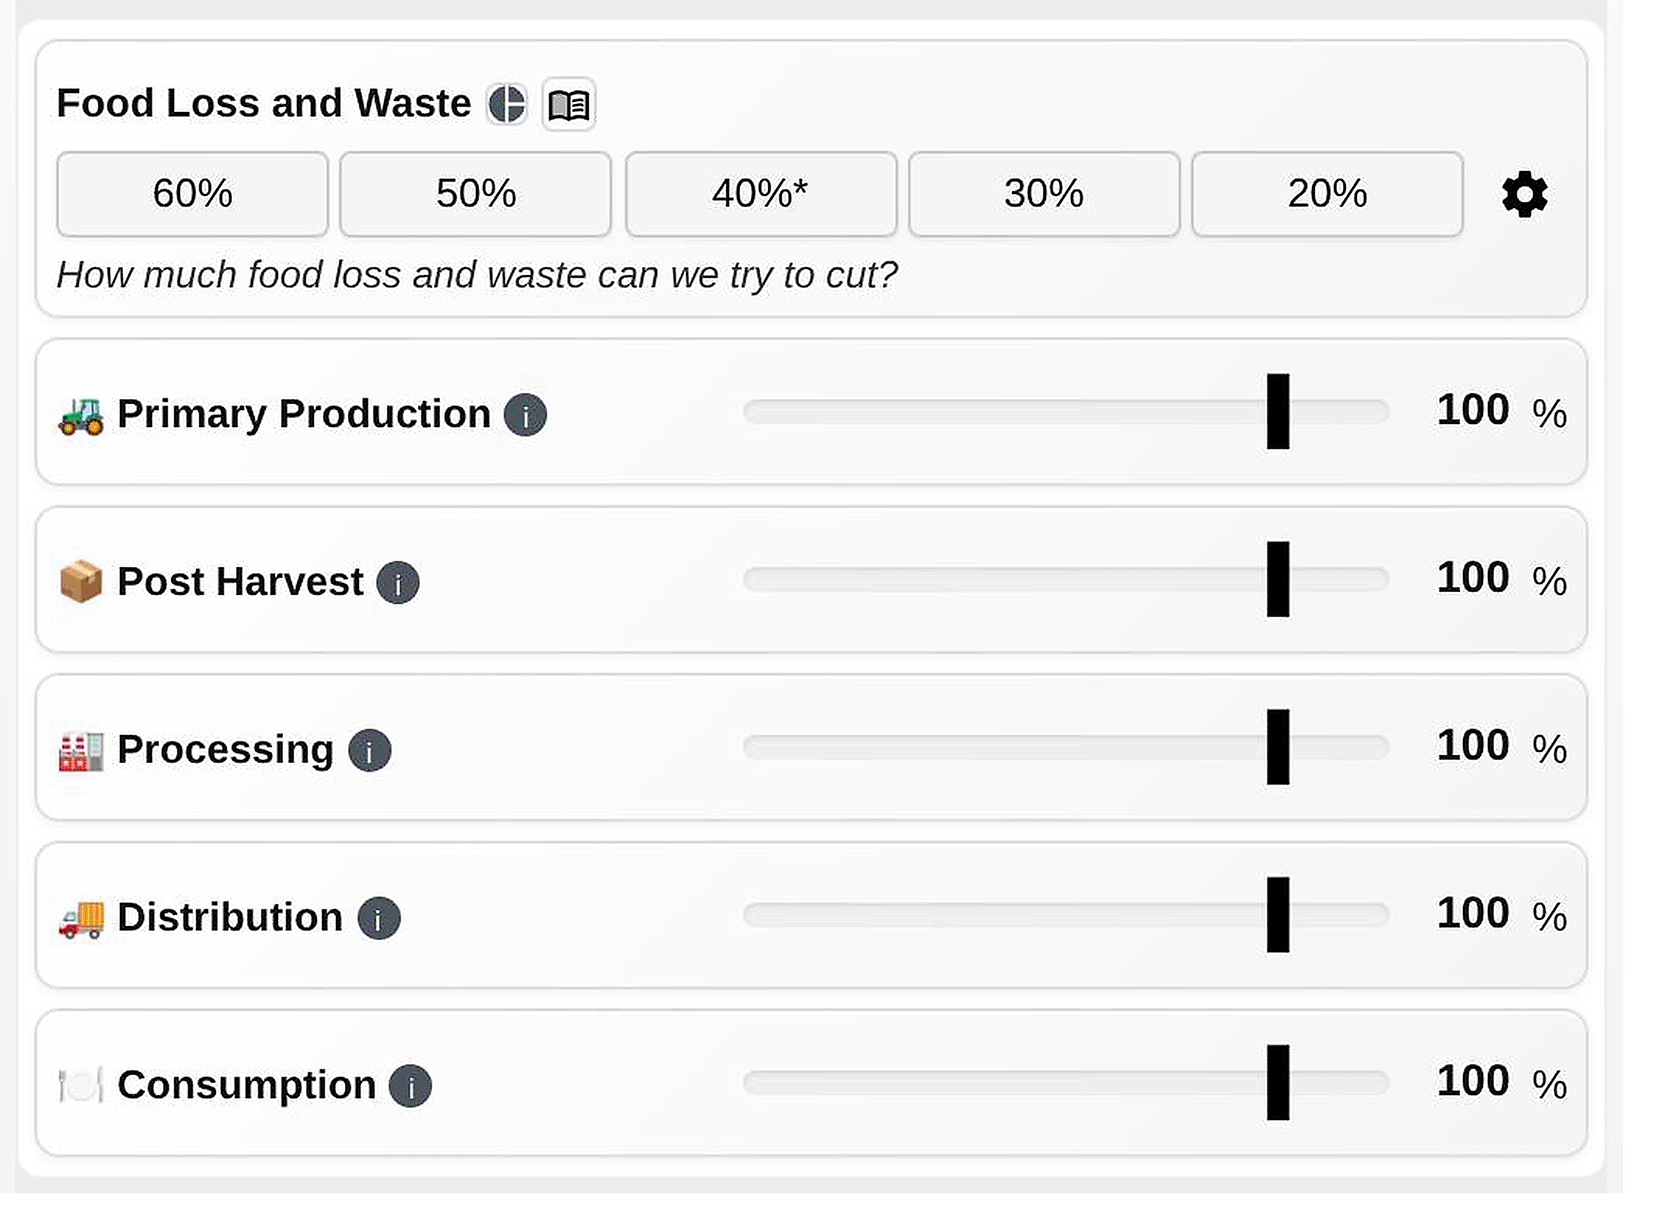
Figure 8. Segmented button input widget for discrete variable selection, showing the diet composition selector with reference, healthy, mediterranean, and flexitarian options.
Output section
The output section displays model results across nine thematic graph categories, each containing multiple visualisation panels (
Figure 9). Two graph types are supported: line charts displaying temporal dynamics of multiple variables (
Figure 10), and stacked area charts showing accumulated quantities with contributing components (
Figure 11). Graph selectors within each category enable dynamic chart selection via dropdown menus with informational tooltips providing context for each visualisation.

Figure 9. Output graph categories at the top of the graph section, showing the nine thematic domains for result visualisation.
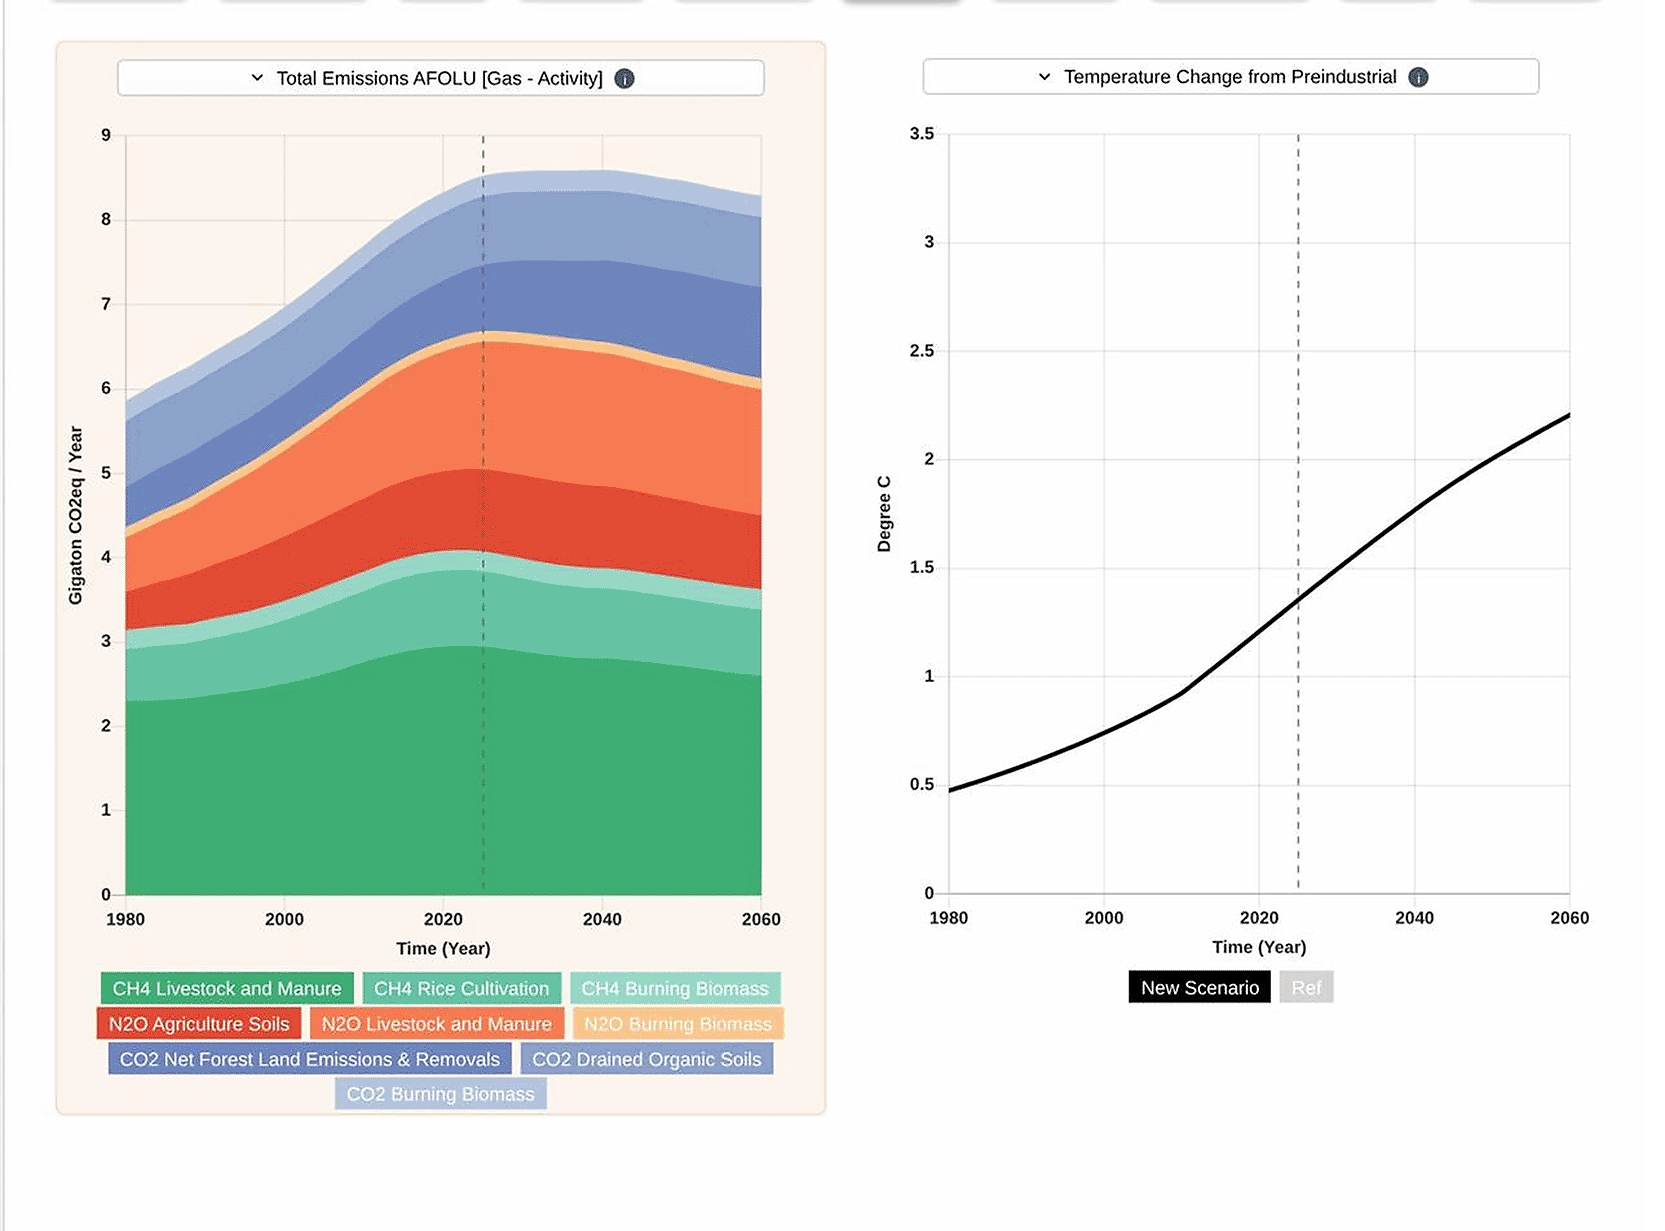
Figure 10. Example of a line chart showing temporal dynamics of system indicators, with interactive tooltips displaying precise values at specific time points.
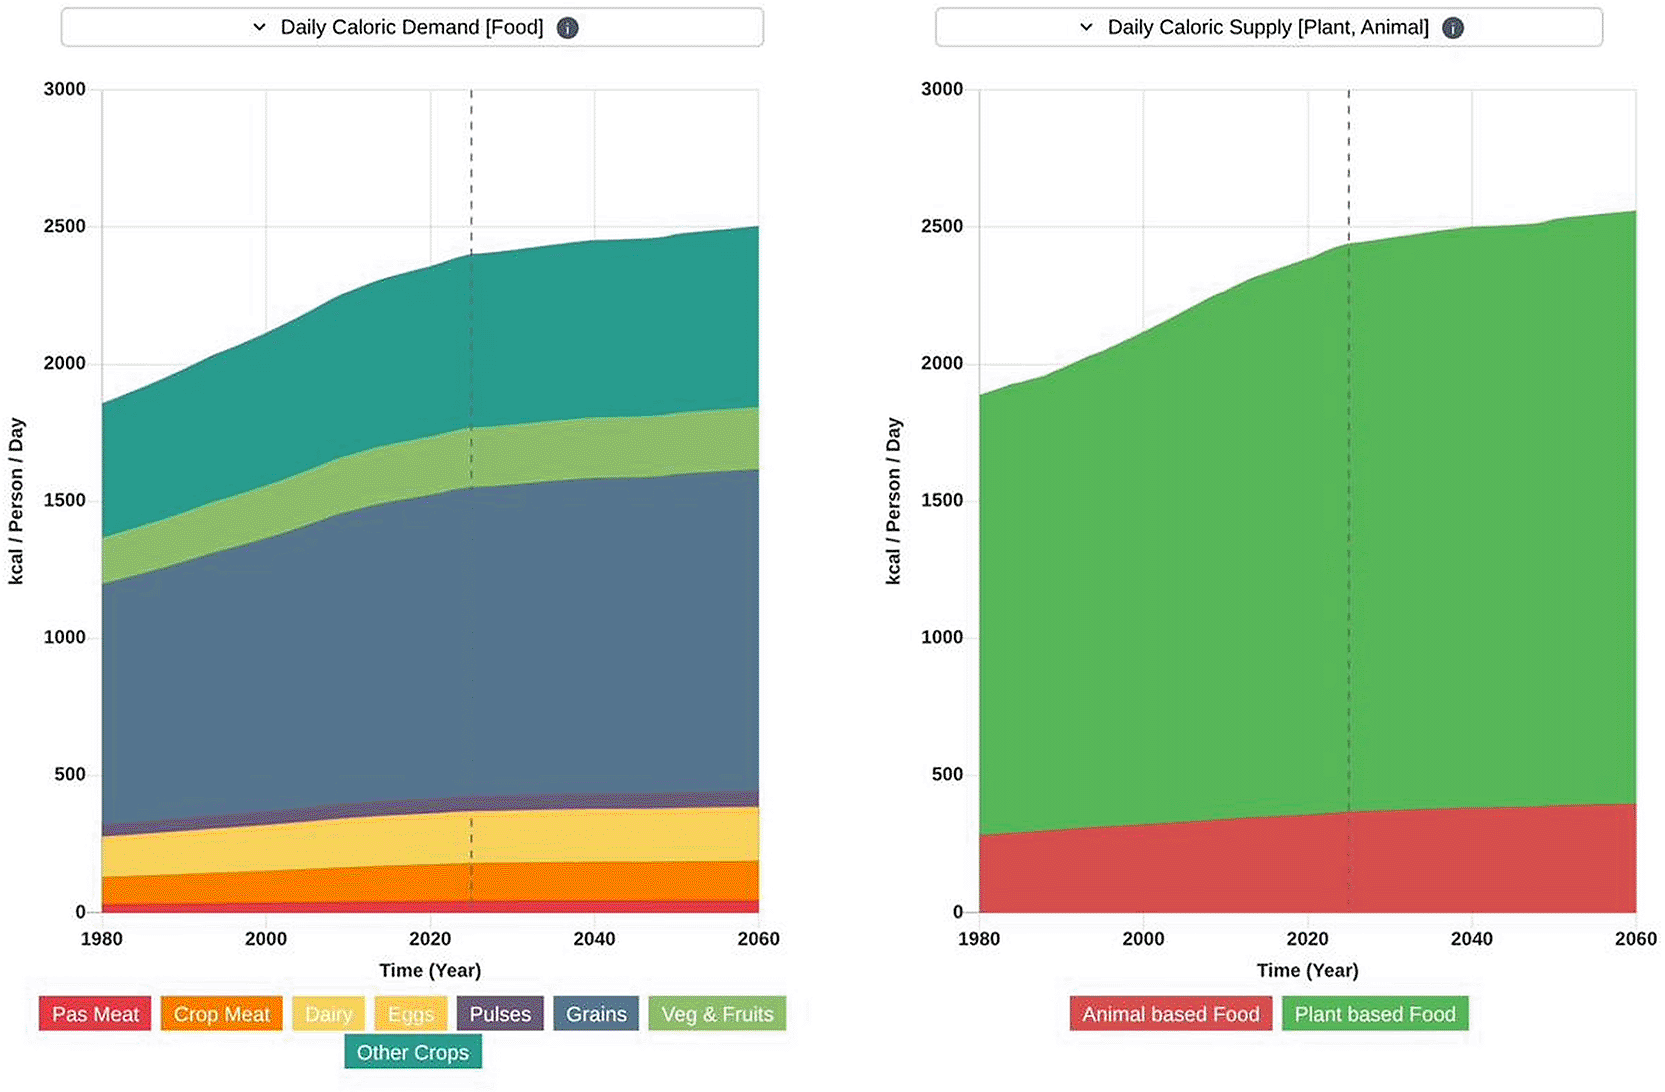
Figure 11. Example of a stacked area chart showing caloric demand by food category over time, illustrating the compositional visualisation approach.
Navigation and scenario management
The navigation bar (
Figure 12) provides access to scenario management functions organised into three sections. The first section contains reset buttons (restoring all inputs to default values) and a summary button that displays all modified parameters in a tabular format (
Figure 13). The second section provides layout controls, access to comprehensive documentation (compiled from markdown sources during the build process), a bug reporting link, and a fullscreen toggle.

Figure 12. Navigation bar showing reset buttons, summary display, scenario toggle, layout controls, and utility buttons.
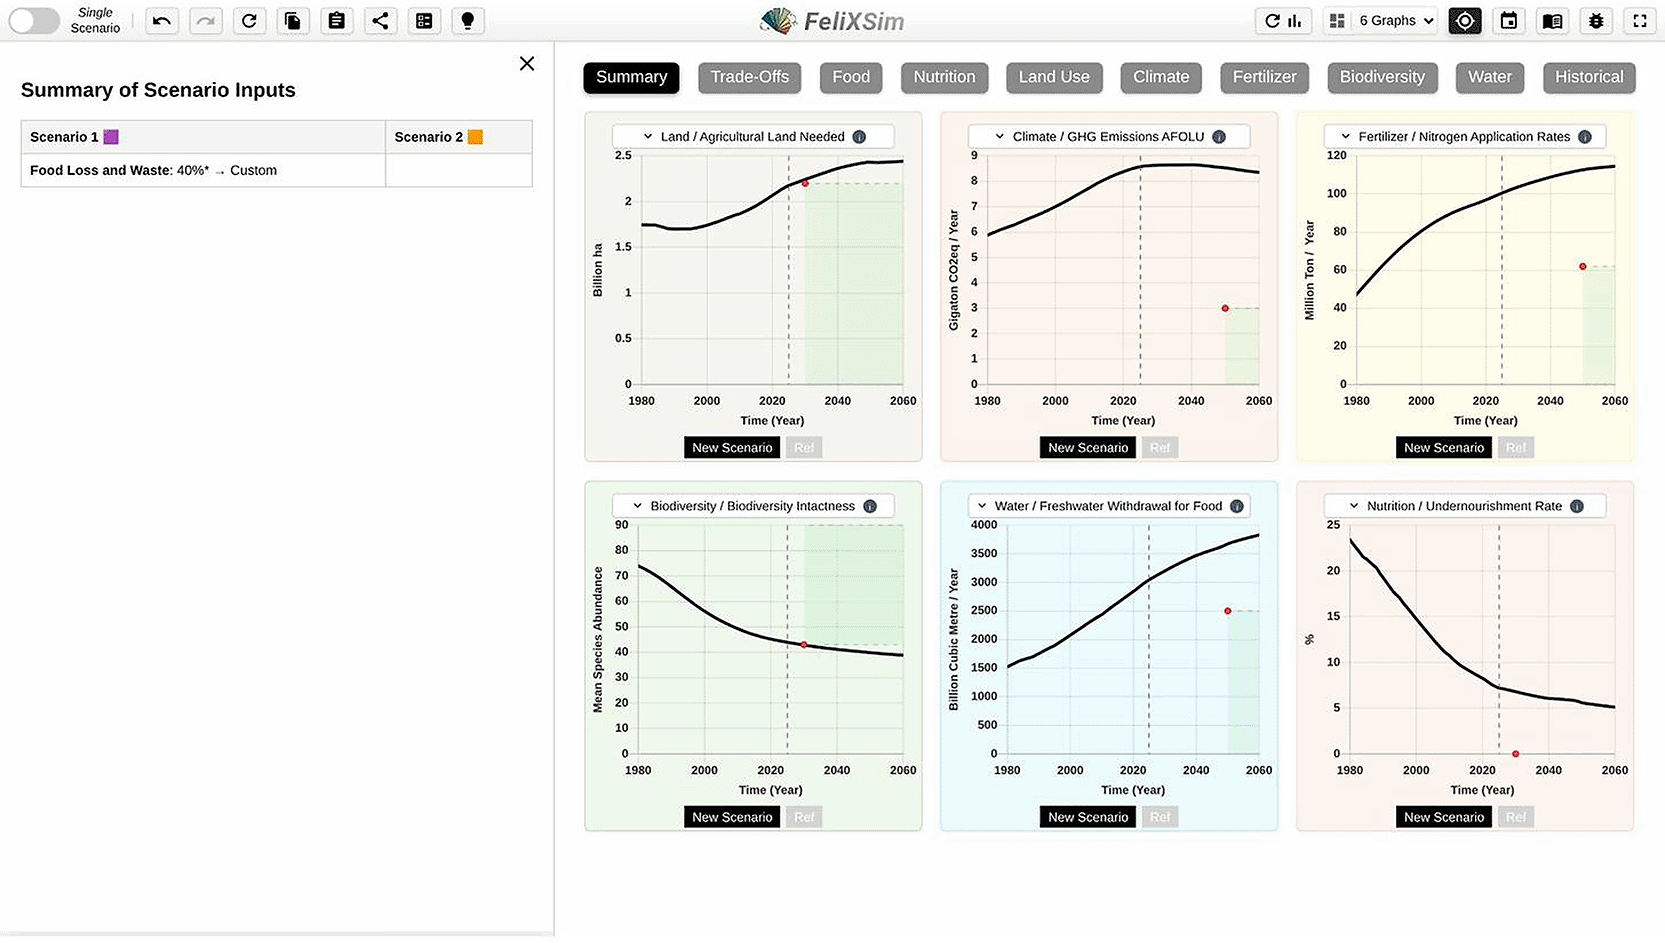
Figure 13. Summary view showing all modified scenario inputs displayed as a table, providing a transparent record of the current scenario configuration.
The sidebar supports multi-scenario comparison mode. When activated via the scenario toggle, the interface expands to display a second set of input controls, colour-coded to distinguish between the two scenarios (
Figure 14). Both scenarios maintain independent input variables and are computed simultaneously via separate Web Worker instances. Output graphs render both scenarios overlaid or side-by-side depending on the graph type and user preference, enabling direct visual comparison of policy impacts across all output domains (
Figure 15).
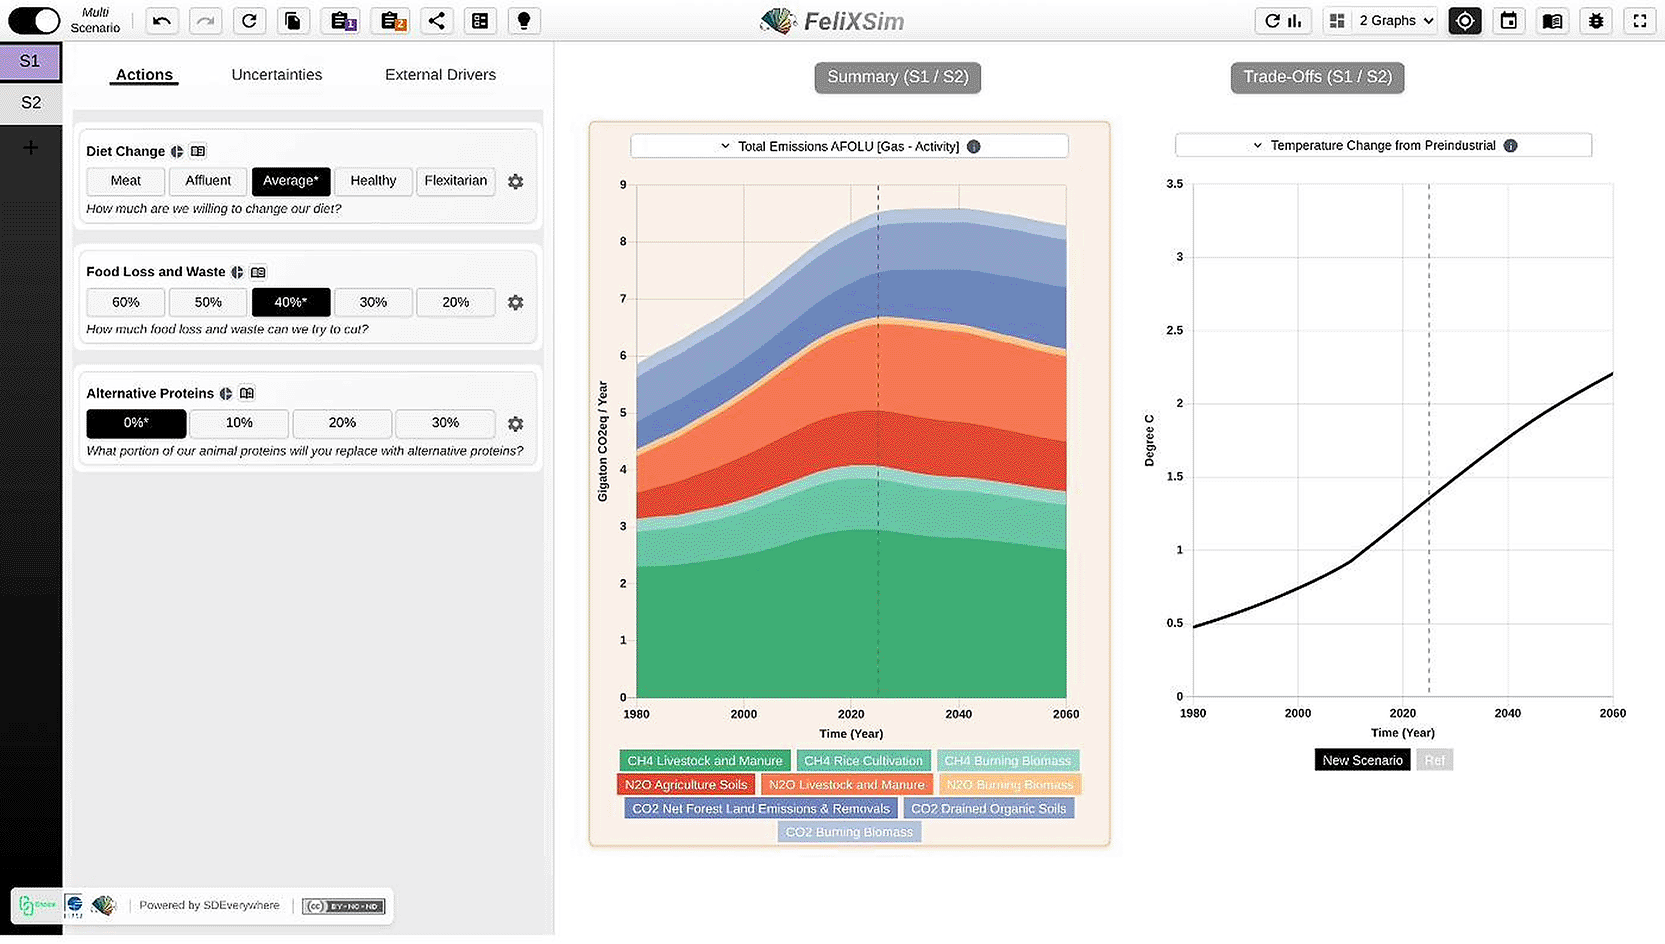
Figure 14. Single-scenario mode (left) and multi-scenario mode (right) with colour-coded inputs, illustrating the dual-scenario comparison interface.
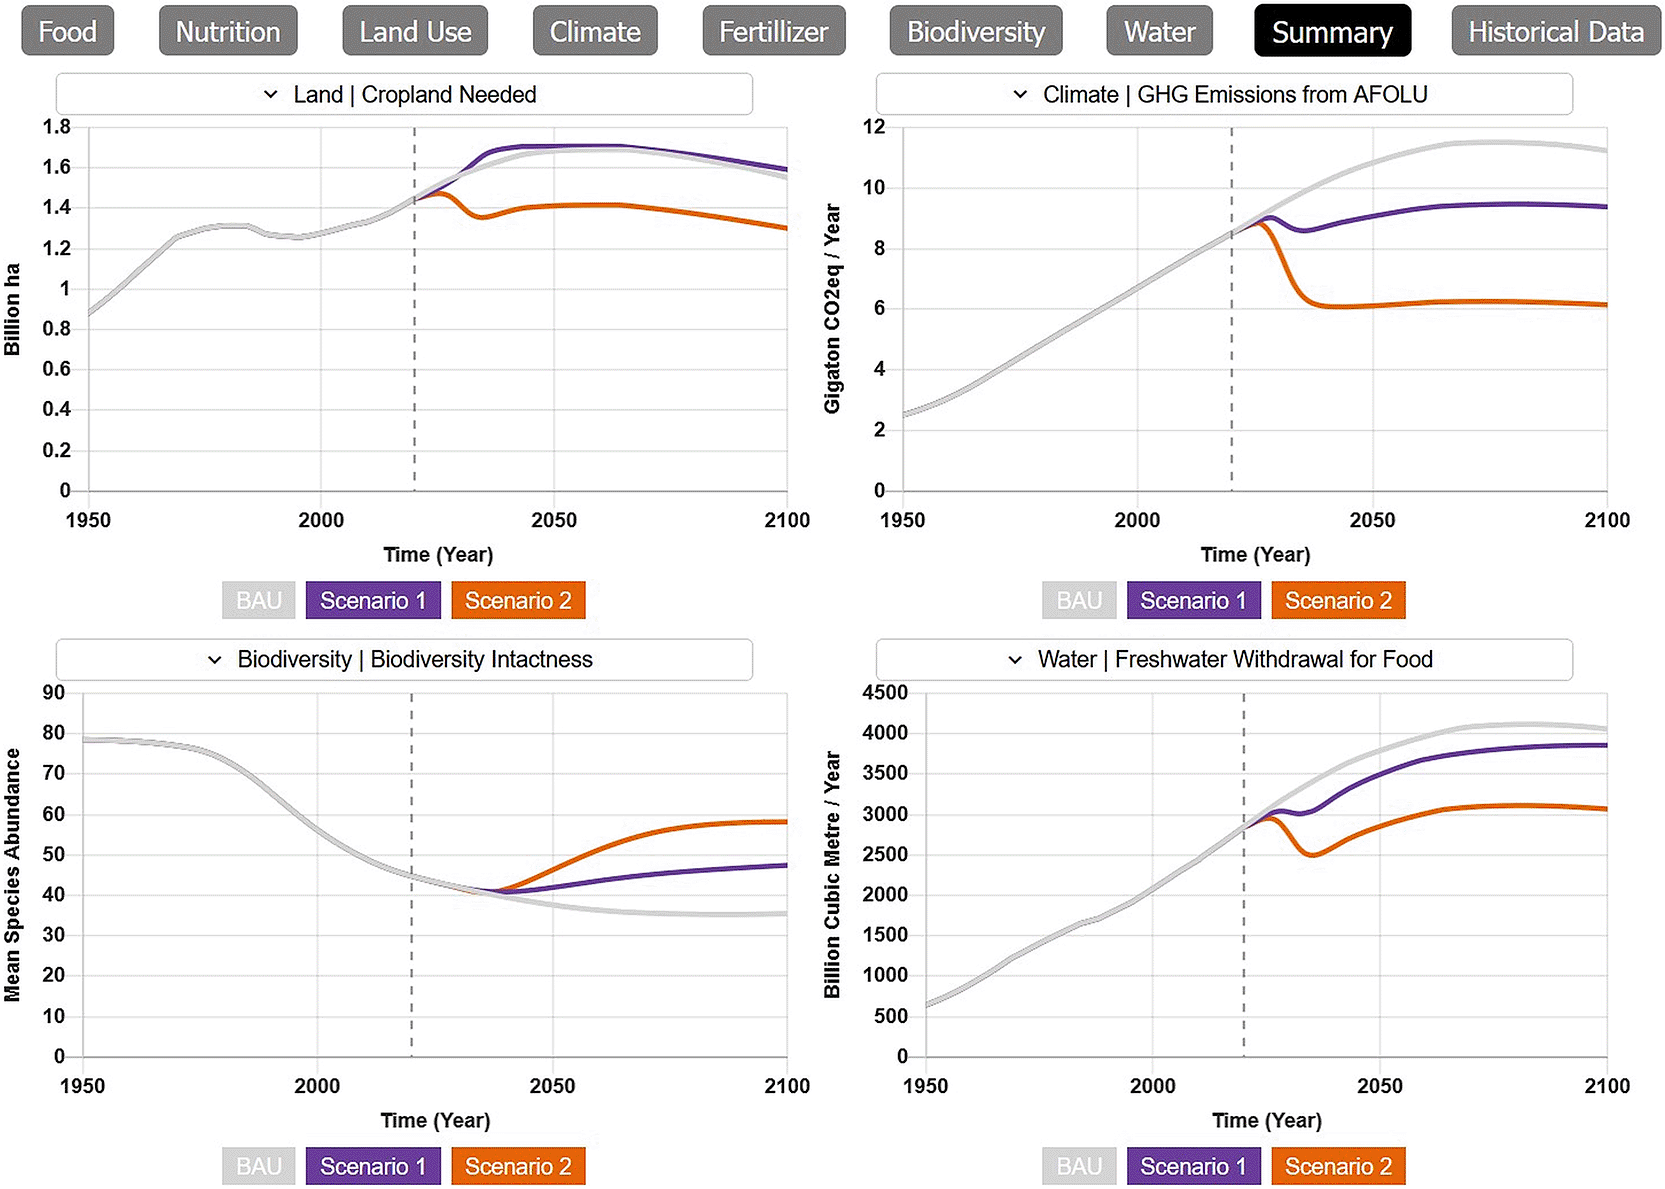
Figure 15. Scenario comparison on the summary graph category showing parallel outputs for two scenarios, enabling direct visual comparison of policy impacts.
Scenario configurations can be exported as JSON files for interoperability, sharing and reproducibility, and imported to reconstruct previously configured scenarios. The import mechanism is order-agnostic, enabling robust interoperability across different tool versions. Full documentation of the import/export functionality is maintained on the project’s GitHub wiki.43
Results
Validation
A critical requirement for the FeliX ISE is ensuring that the transpilation of the original Vensim model through the SDEverywhere toolchain to WebAssembly preserves numerical fidelity. Since the ISE is intended for scientific exploration and policy-relevant analysis, any discrepancies introduced during the conversion pipeline would undermine the tool’s credibility. A three-level validation framework was therefore demonstrated, comprising: (1) a verification check between the original and the ISE-adapted Vensim model versions; (2) a direct numerical comparison between Vensim model outputs and those generated by the ISE; and (3) a systematic behavioural assessment across the full input configuration space of the ISE.17
Verification of vensim model updates
The development of the FeliX ISE required modifications to the original Vensim model to ensure compatibility with the SDEverywhere transpiler. These modifications included renaming variables to conform to SDEverywhere naming conventions, replacing incompatible built-in Vensim functions (such as Vensim’s in-built random functions, which SDEverywhere cannot process), and normalising units across the model. Since these changes do not alter the core system relationships and formulas, the simulated outputs from the modified model should match the outputs from the stable version of FeliX under business-as-usual (BAU) conditions.
To validate this, the BAU scenario outputs from a baseline version of FeliX were compared with the outputs from an updated version modified for the ISE. The comparison focused on four key output variables selected for their indirect relationship to input parameters, thereby testing a greater number of causal chain interactions: Total CO2 Emissions from AFOLU, Food and Agriculture Nitrogen Balance, Mean Species Abundance, and Agricultural Water Demand Per Billion Cubic Metres. As shown in
Figure 16, the outputs of the two model versions are in close agreement, with only marginal deviations attributable to the equation-level adaptations necessitated by SDEverywhere compatibility requirements, including the substitution of normal distributions for Poisson distributions and the explicit formulation of delay functions in place of Vensim built-in equivalents.
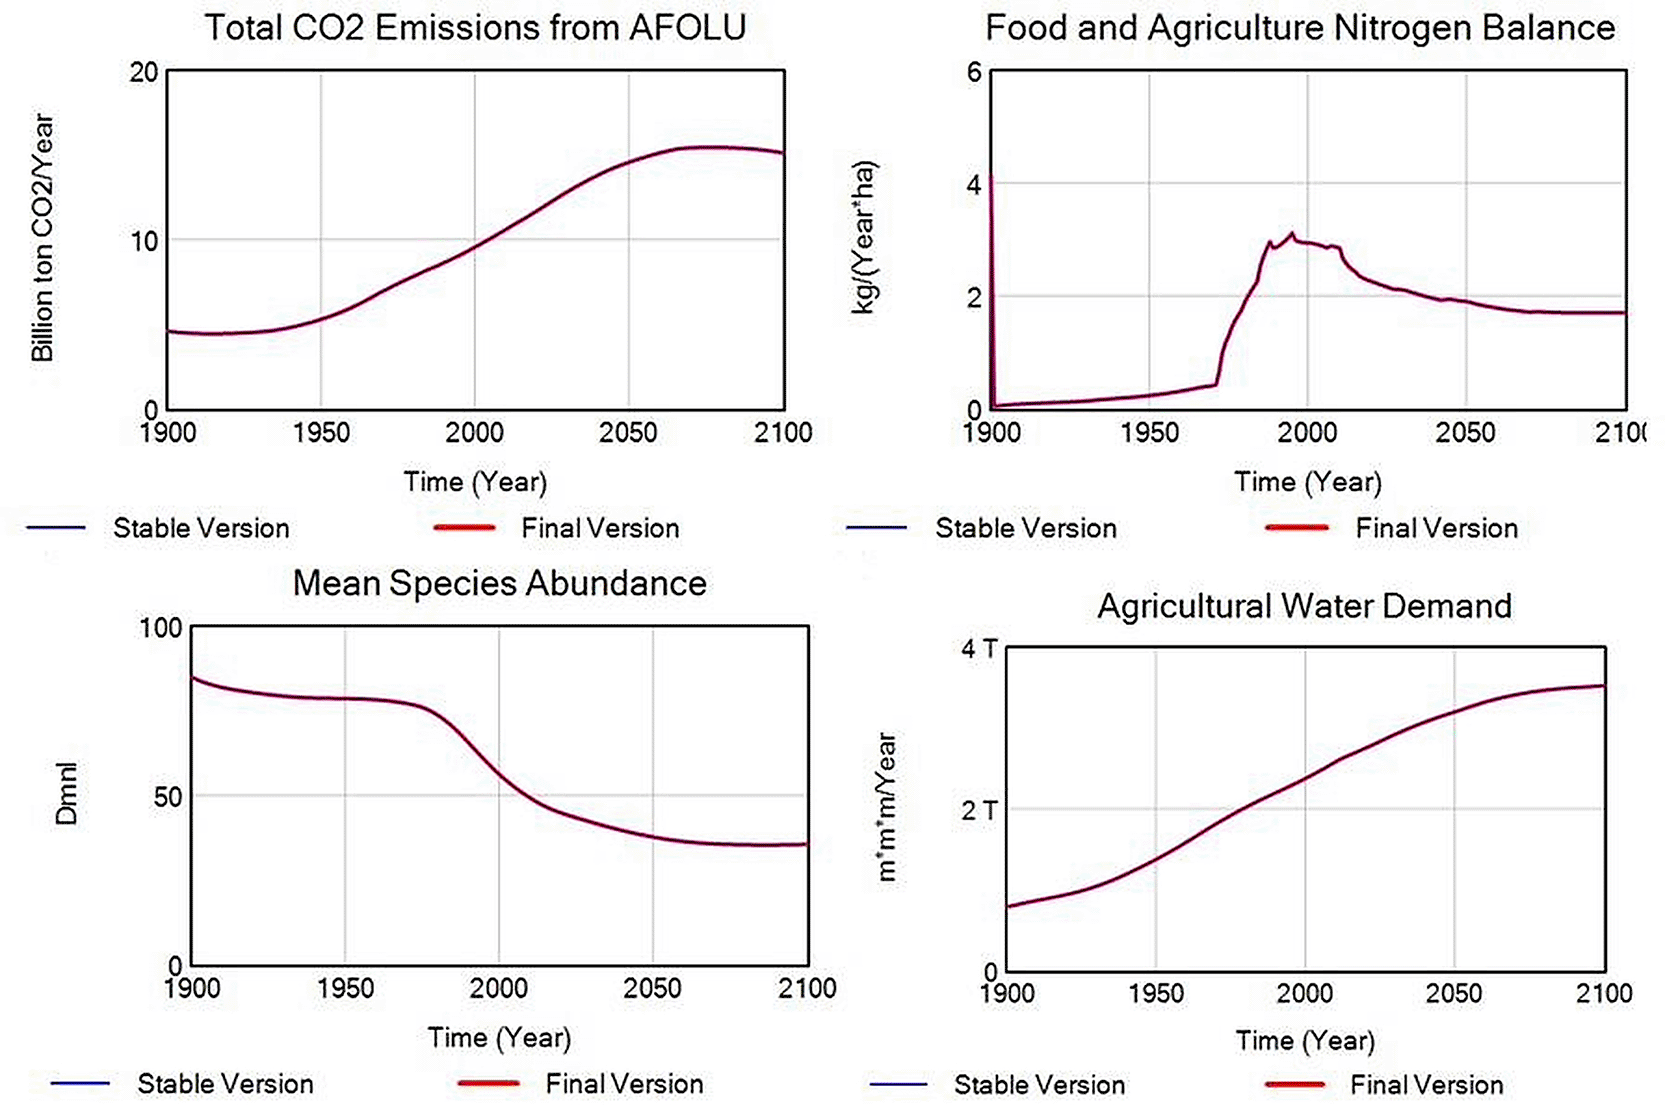
Figure 16. Validation level 1: Comparison of four key output variables between the stable version of FeliX and the final version modified for the ISE.
Validation between vensim and ISE outputs
The most critical validation step verifies that the SDEverywhere conversion pipeline, from Vensim (.mdl) to C to WebAssembly, preserves numerical accuracy. This was assessed by comparing the outputs generated by the Vensim simulation engine with those produced by the ISE’s WebAssembly model under identical BAU conditions. Using the year 2020 as a reference datapoint, the Vensim-generated and ISE-generated values were compared for all key output variables. As shown in
Figure 17, the comparison reveals exact numerical agreement across all tested output variables. For example, Agricultural Water Demand Per Billion Cubic Metres and Mean Species Abundance produce identical values to 12 significant decimal places in both the Vensim simulation engine and the ISE WebAssembly outputs. This level of precision confirms that the SDEverywhere transpilation and WebAssembly compilation introduce no meaningful numerical error, and that the ISE faithfully reproduces the behaviour of the original Vensim model.
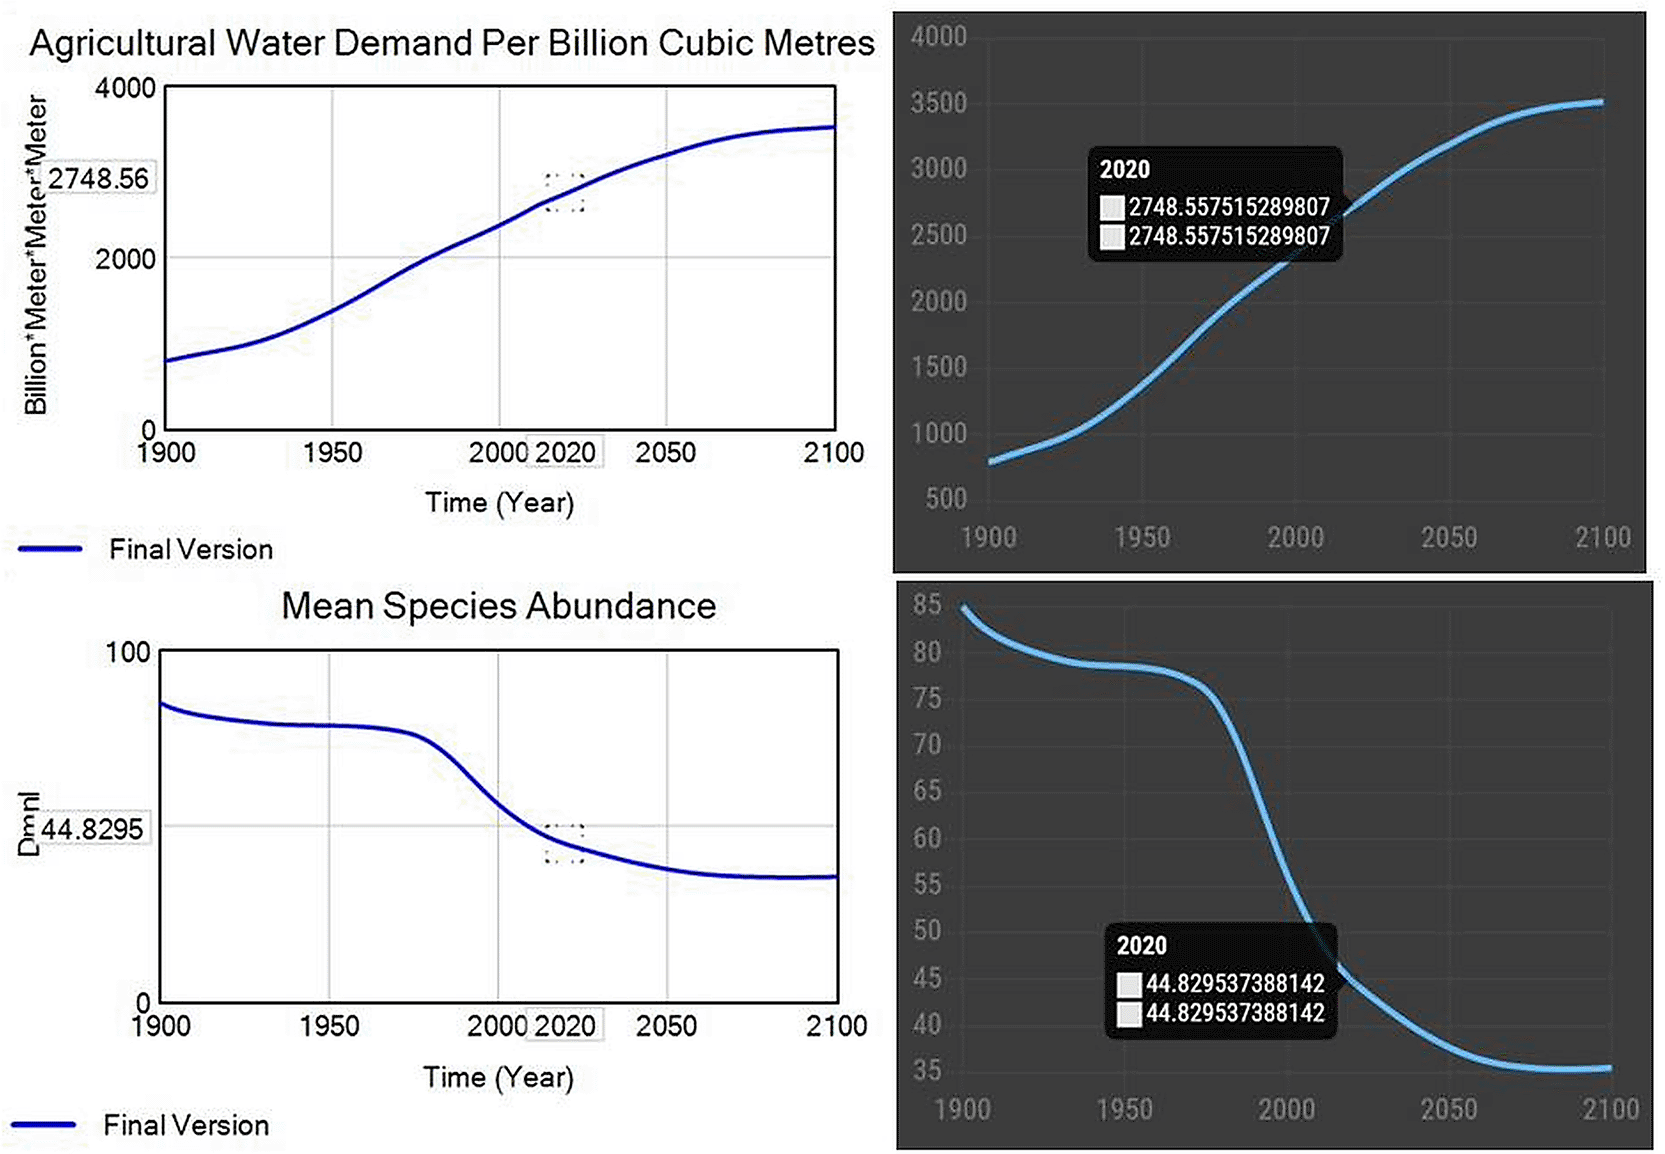
Figure 17. Validation level 2: Side-by-side comparison of vensim outputs (left) and ISE webAssembly outputs (right).
Validation across ISE configuration space
Since the ISE configuration files define continuous input ranges for each parameter rather than discrete presets, the model must behave reasonably across the full n-dimensional scenario space defined by all input variables. The SDEverywhere toolchain includes integrated quality assurance (QA) tools aligned with formal standards of structure and behaviour validity46 that run locally during the development process.
Three complementary QA mechanisms were employed. The Checks function verifies that output variables remain within predefined bounds (−1000 to 1000 in the normalised scale), serving both as a scale-consistency check and as an extreme condition test to detect whether input variations produce unreasonably high or low outputs. The Comparisons by Scenario function organises custom scenarios using multivariate input combinations and generates output results for each, enabling systematic sensitivity assessment. The Comparisons by Output function sorts results by outputs, revealing which input variations drive specific output changes. All 166 automated were completed without failures, as shown in
Figure 18.17

Figure 18. SDEverywhere development environment showing all QA tests results.
To further verify behavioural plausibility under non-default conditions, custom scenarios combining multiple input modifications were tested. For example, a scenario with Self-efficacy aggregated multiplier = 180%, Subjective norm aggregated multiplier = 180%, Waste Fraction Scenarios by Food Category [Pasture Meat] = 10%, and Waste Fraction Scenarios by Food Category [Pulses] = 10% was evaluated across all four key output variables. The outputs confirmed that all four indicators responded in physically plausible directions under the following combination of inputs Total CO2 Emissions from AFOLU decreased, Food and Agriculture Nitrogen Balance improved, Mean Species Abundance increased, and Agricultural Water Demand declined. No anomalous behaviours or numerical discontinuities were observed (
Figure 19).17
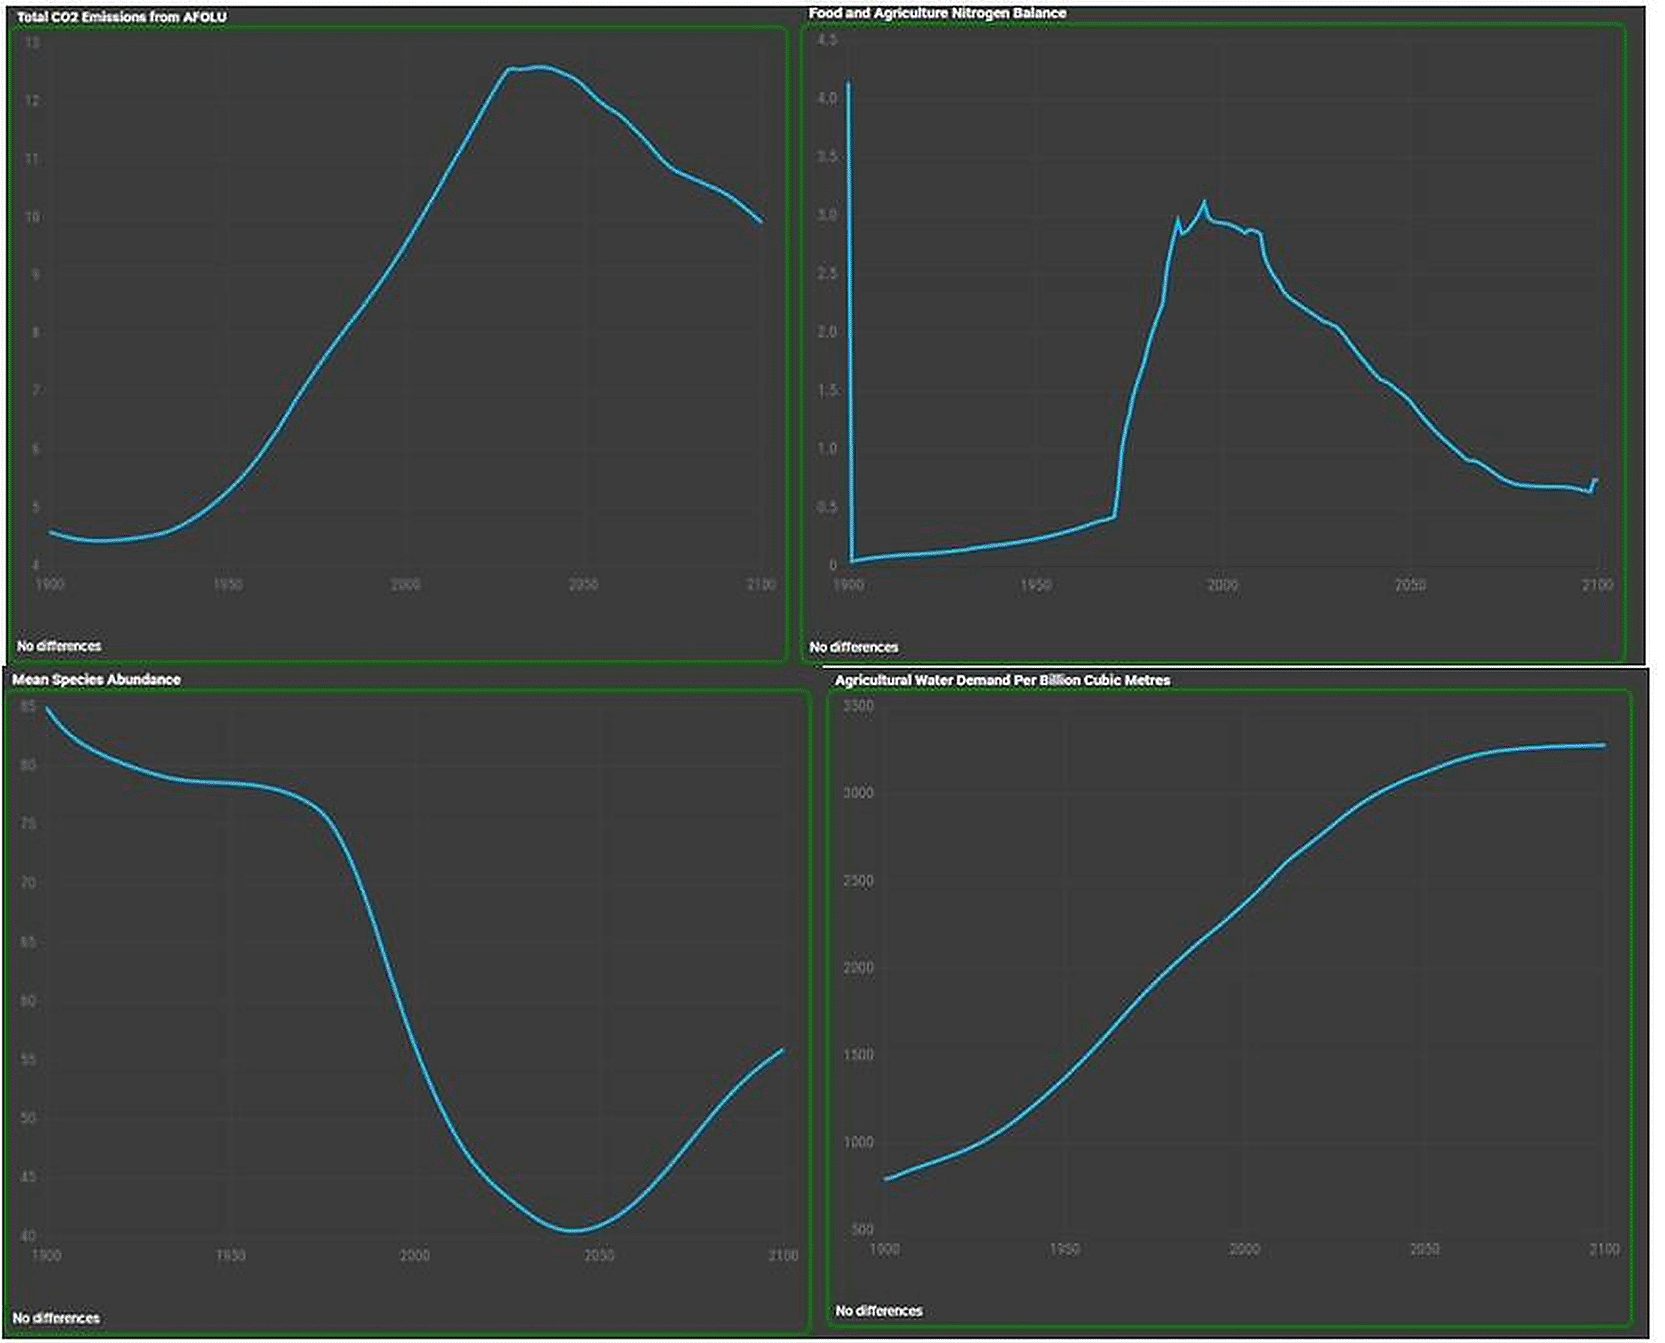
Figure 19. Validation level 3: Key output variables under a custom multi-parameter scenario.
Performance characteristics
The FeliX ISE achieves sub-second response times for parameter adjustments, with the full model recalculation completing within the Web Worker and results rendering in the Chart.js visualisation layer before users perceive any delay. The compiled WebAssembly model, combined with all application assets, is served as static files totalling a few megabytes, enabling fast initial load times even on modest network connections. Once loaded, the application functions entirely offline, as all computation occurs locally in the browser.
The client-side architecture eliminates concerns about server capacity, concurrent user limits, or ongoing hosting costs beyond static file serving. GitHub Pages provides reliable, free hosting with global content delivery network (CDN) distribution, ensuring low-latency access from diverse geographic locations.
Transferability verification
The FeliX ISE architecture was designed in order to be transferable to other Vensim-based system dynamics models. To preliminarily demonstrate this capability, the configuration-driven architecture was tested by loading an SIR (Susceptible-Infected-Recovered) epidemiological model, a standard system dynamics model from a fundamentally different domain. The deployment required only the provision of new CSV configuration files (input and graphs output files) corresponding to the SIR model’s parameters and outputs, without any modifications to the application codebase.
The successful loading and rendering of the SIR model through the same interface (
Figure 20) suggests that the FeliX ISE architecture is model-agnostic and can in principle be applied to any Vensim-based system dynamics model (.mdl format) by supplying appropriate configuration files.
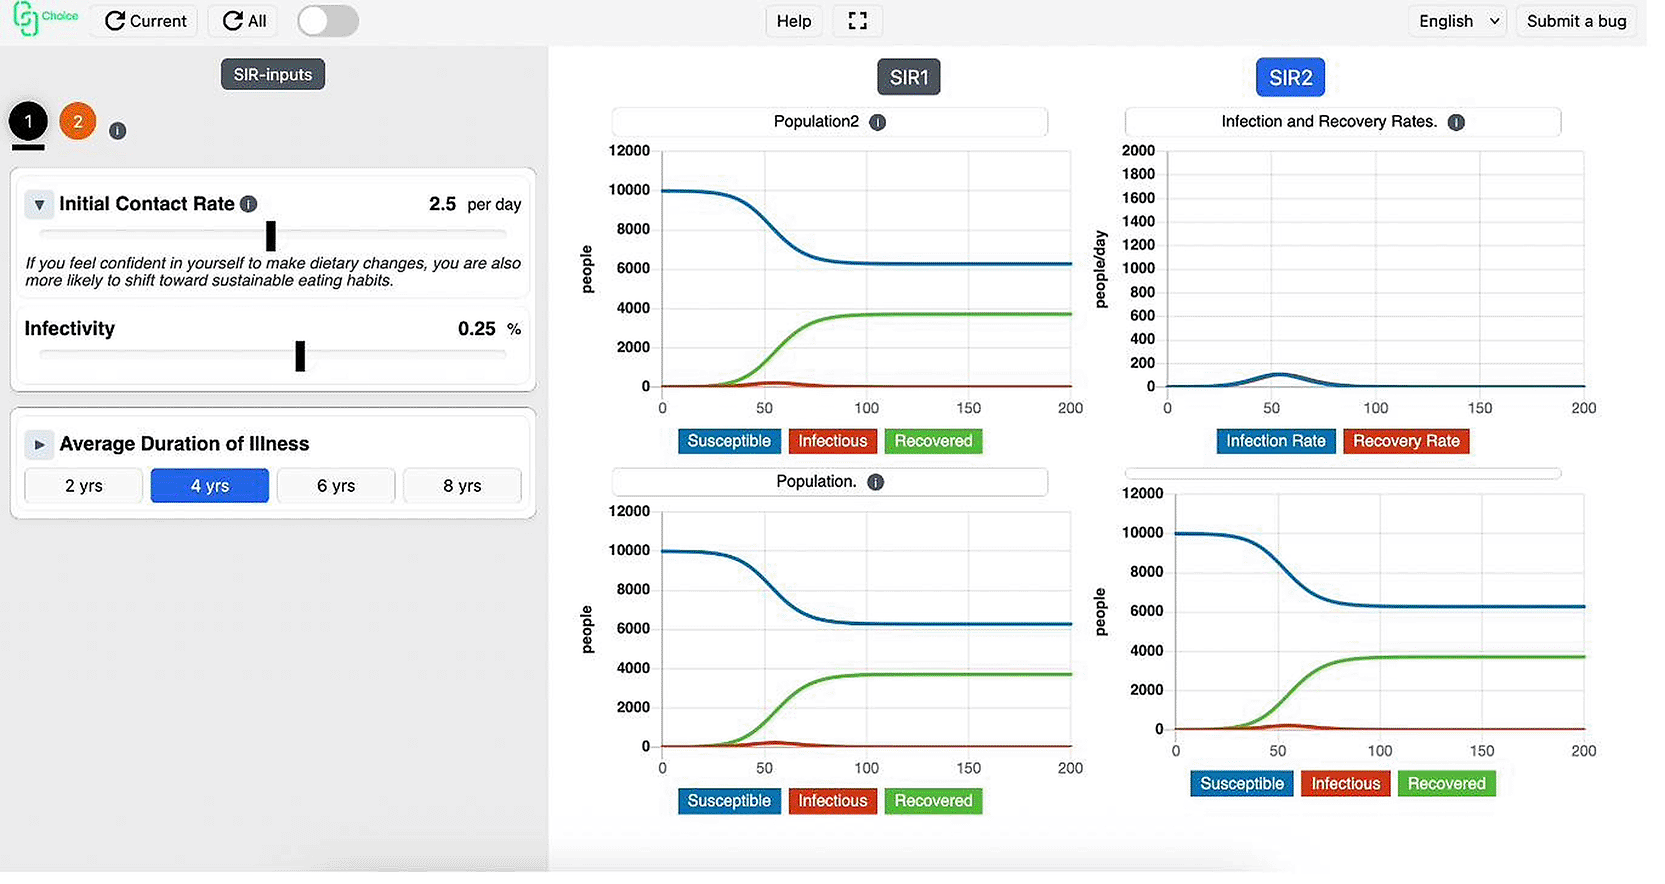
Figure 20. The FeliX ISE interface applied to an SIR epidemiological model, demonstrating the transferability of the configuration-driven architecture to models from different domains.
Scenario demonstration
To illustrate the capabilities of the FeliX ISE, we present two representative scenario demonstrations that showcase the tool’s ability to communicate complex system dynamics through interactive exploration.
Scenario 1: Global diet shift
This scenario explores the impact of modifying the Global Diet Compositions parameter from “Reference” to “Healthy.” Under the Reference diet, GHG Emissions from Agriculture, Forestry and Other Land Use (AFOLU) are projected at approximately 11.23 Gt CO2-eq/year by 2100. After transitioning to the Healthy diet composition, the model projects a reduction to approximately 9.37 Gt CO2-eq/year, a decrease of approximately 16.6%, driven by reduced demand for land-intensive animal products and associated reductions in agricultural emissions.13,14
This scenario demonstrates the multi-domain propagation of dietary change: the shift affects not only direct agricultural emissions but cascades through land use patterns (reduced pasture and cropland requirements), biodiversity indicators (reduced habitat pressure), water consumption (lower irrigation demand), and nutritional outcomes (altered caloric and nutrient intake distributions). The ISE enables users to trace these cascading effects across all nine output domains in real time.
Figure 21 presents the comparative GHG emission trajectories under the Reference and Healthy diet scenarios.
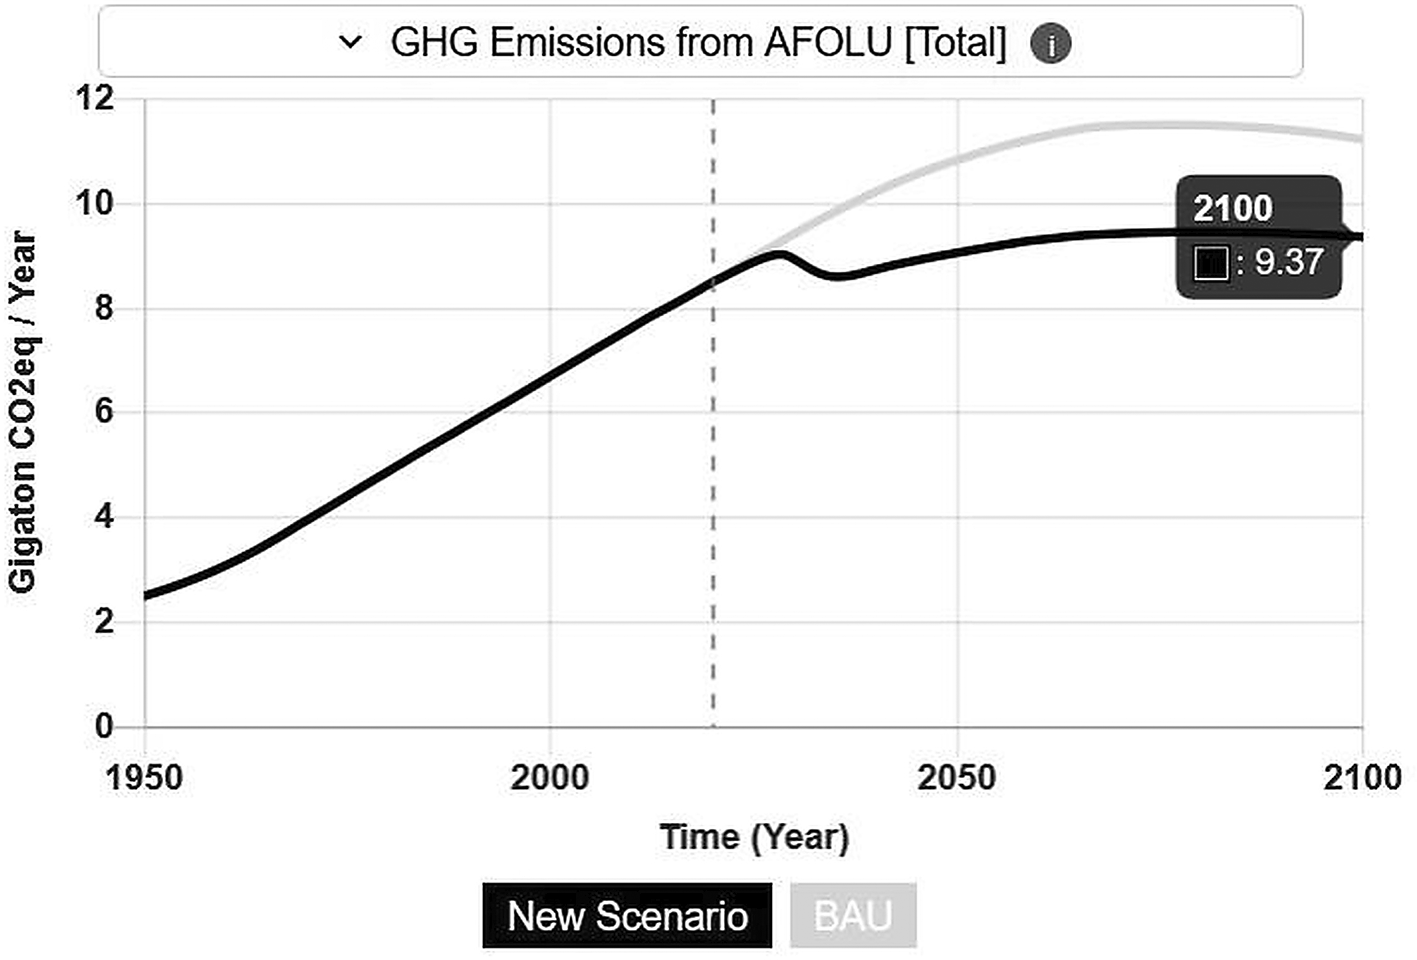
Figure 21. Simulation 1: GHG emissions from afolu under reference versus healthy diet scenarios, showing the projected reduction in agricultural emissions from global dietary transition.
Scenario 2: Food waste reduction
The second scenario demonstration evaluates the effects of reducing food loss and waste across specific food categories on biodiversity outcomes. This reduction is represented by adjusting the input parameters for Pasture Meat, Crop Meat, and Dairy under the “Food Loss and Waste” category, and under the “by Food Category” option. In the Business As Usual (BAU) scenario, each of the three food categories is set at a loss and waste rate of 20%. In this scenario, we reduce this rate to 10% for each input, representing a 50% reduction in food waste in the three food categories.
The results on the “Biodiversity Intactness” graph - where a value of 100 represents that the ecosystem is undisturbed, 0 represents that the species are completely lost - show that in the year 2100, biodiversity intactness improves from a value of 35.53 to 39.78, and stays relatively steady. This nearly 12% increase signifies that reducing food loss and waste substantially contributes to preserving species populations and maintaining ecosystem integrity. As shown in
Figure 22, the Biodiversity Intactness Index shows measurable improvement under the food waste reduction scenario compared to the baseline, reflecting reduced land conversion pressure and lower resource extraction from natural ecosystems.14
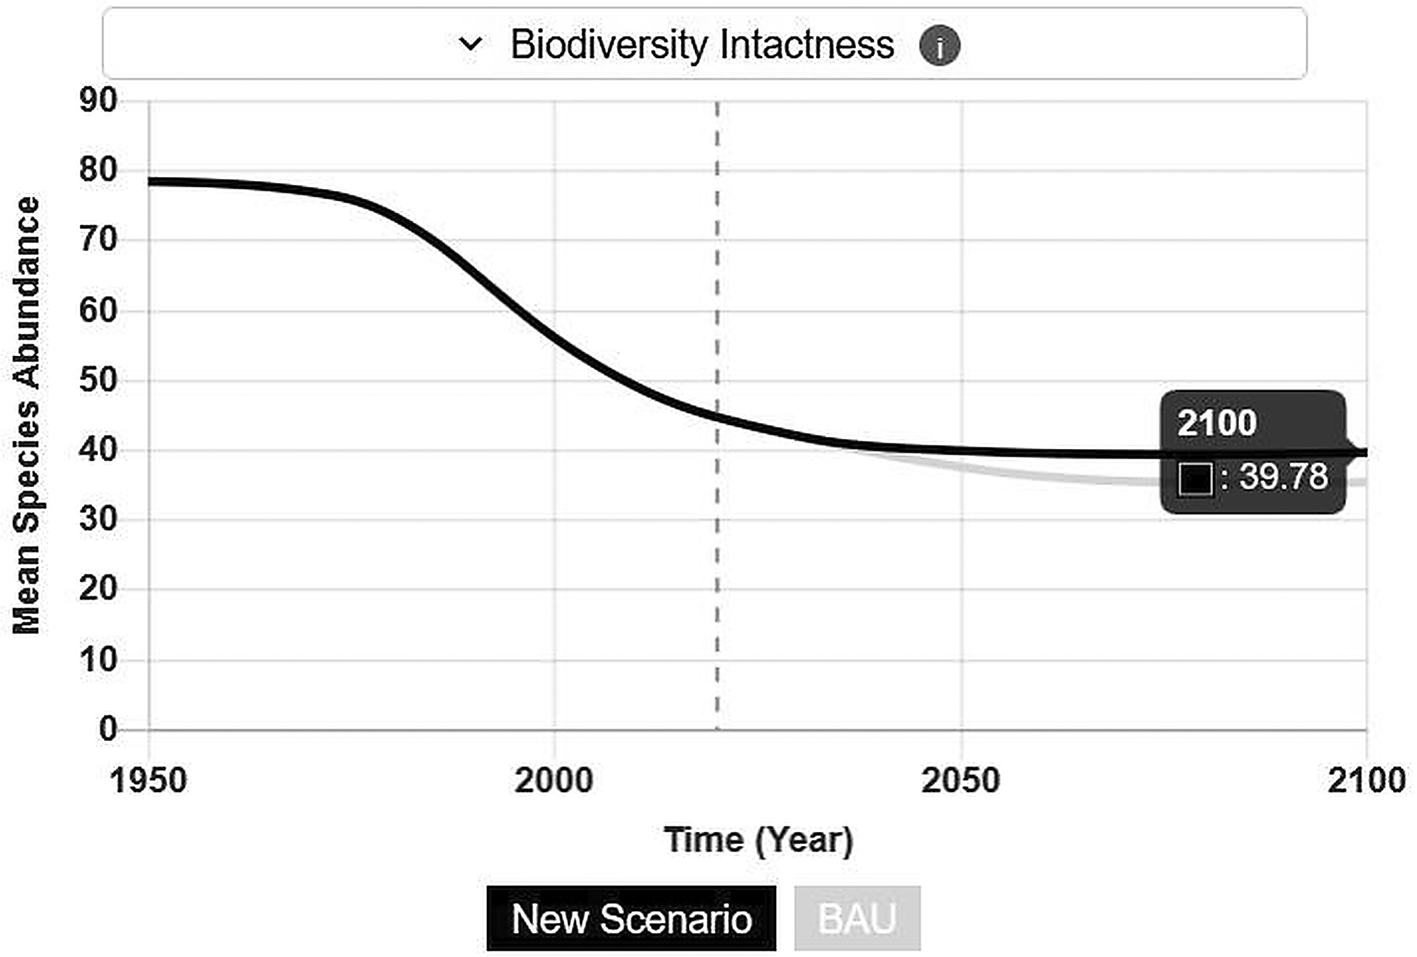
Figure 22. Simulation 2: Biodiversity intactness under baseline versus reduced food waste scenarios, illustrating the positive biodiversity response to demand-side food system interventions.
Discussion
Increase accessibility and understanding of complex integrated assessment outputs
The FeliX ISE represents a concrete step toward increasing accessibility to sophisticated integrated assessment capabilities. By eliminating the traditional barriers of proprietary software, specialised expertise, and computational infrastructure, the tool enables a substantially broader range of stakeholders, including policymakers, educators, students, civil society organisations, and interested citizens, to engage directly with the complex system dynamics underlying climate-food-biodiversity interactions.7,8
A central design objective was to mainstream complex IAM outputs through a UI/UX friendly dashboard that conveys information more clearly than the limited available tools. The progressive disclosure interface design addresses the tension between analytical depth and user accessibility. Expert users can access the full breadth of model parameters through the Uncertainties and External Drivers tabs, while non-specialist users can achieve meaningful scenario exploration through the more accessible Actions tab, which provides high-level interventions (diet change, food waste reduction, alternative proteins) without requiring understanding of underlying model mechanics. The structured two-panel layout, contextual tooltips, expandable markdown descriptions, and thematically organised output categories collectively make it transparent which inputs affect which outputs and how the modelled Earth systems are interconnected, a level of interpretive clarity that is currently absent from most existing IAM tools, where users often manipulate parameters without understanding the systemic pathways through which their changes propagate. This layered approach ensures that the tool serves diverse user communities without compromising scientific rigour.
Crucially, the three-level validation framework ensures the tool’s credibility for policy-relevant analysis. The demonstration of exact numerical agreement between the original Vensim model and the WebAssembly-compiled ISE, confirmed to full floating-point precision, addresses a fundamental concern in model transpilation: that the conversion process itself might introduce errors that compromise the scientific integrity of results. By combining automated QA checks (166 tests across the full scenario space), direct numerical comparison at specific datapoints, and behavioural plausibility assessment under custom multi-parameter scenarios, the validation framework aligns with established standards of structure and behaviour validity in system dynamics modelling.46 This level of validation rigour is essential for ensuring that the accessibility gains achieved through the browser-based interface do not come at the cost of scientific accuracy.
Comparison with existing tools
The FeliX ISE occupies a distinct position in the landscape of web-based sustainability simulation tools.
Table 4 provides a comparative overview. The FeliX ISE’s distinguishing features include its endogenous behavioural modelling, its detailed food system representation, its demonstrated transferability to arbitrary Vensim models, and its UI/UX design that explicitly communicates system interconnections through contextual documentation, structured input–output mapping, and thematic output organisation. Furthermore, the FeliX ISE provides a richer contextual layer, including per-variable tooltips, expandable markdown descriptions, and thematically grouped outputs, that helps users understand not only what happens when they change a parameter, but why it happens through the interconnected system pathways.
Table 4. Comparison of the FeliX ISE with existing web-based sustainability simulation tools.
| Feature | FeliX ISE | En-ROADS11 | C-ROADS11 | iSDG23 | Earth4All24 |
|---|
| Thematic focus | Climate-food-biodiversity-behaviour
| Energy-climate-economy | Regional emissions | SDG interactions | Socio-economic-environmental |
| Behaviour modelling | Endogenous (self-efficacy, norms) | Limited | None | Limited | Social dynamics |
| Architecture | Client-side (Wasm) | Client-side (Wasm) | Client-side (Wasm) | Server-side
| Varies |
| Food system detail | Eight food categories, dietary compositions | Limited | None | Aggregate | Food module, demand changes only through replacement by new technologies |
| Open-source
| Yes | Partial | Partial | No | Partial |
| Transferability | Any Vensim model | En-ROADS specific | C-ROADS specific | iSDG specific | Earth4All specific |
| UI/UX mainstreaming | Tooltips, markdown docs, two-panel cause-effect layout, thematic output grouping | two-panel cause-effect layout, thematic output grouping | Sliders with basic labels | Standard web form | Basic sliders |
Implications for policy and education
The FeliX ISE’s accessibility has implications for both policy processes and educational contexts. For policymakers, the tool provides a means to rapidly explore the systemic consequences of food and climate interventions, including trade-offs and co-benefits that may not be apparent from sector-specific analyses.8 The multi-scenario comparison feature is particularly valuable for policy deliberation, enabling side-by-side evaluation of alternative intervention packages.
For educational contexts, the tool offers a hands-on platform for teaching systems thinking and sustainability science.45 The immediate feedback loop, adjusting a parameter and observing cascading effects across multiple domains, provides an experiential learning opportunity that complements traditional lecture-based instruction. The tool’s coverage of interconnected food, climate, land, biodiversity, and water systems makes it suitable for courses in environmental science, public policy, agricultural economics, and related disciplines.
Limitations and future work
Several limitations of the current implementation should be acknowledged. First, the FeliX model is globally aggregated, meaning it does not capture regional heterogeneity in food systems, climate impacts, or behavioural dynamics. The ongoing development of FeliX-R5, a regionalised version based on five United Nations regional classifications,14 will enable future ISE versions to support regional analysis.
Second, the current interface supports comparison of at most two scenarios simultaneously. While this covers the most common analytical use case, more complex policy analysis may require comparison across larger scenario ensembles. Third, the reliance on WebAssembly and modern browser APIs means that the tool requires a relatively recent web browser. While this is not a significant barrier for most users, it may limit accessibility in contexts with legacy infrastructure.
Fourth, while the configuration-driven architecture supports transferability to other Vensim models, the current UI patterns (two-panel layout, thematic tabs, slider-based inputs) reflect design decisions optimised for the FeliX model’s specific structure. Adaptation to models with fundamentally different input/output structures may require additional interface customisation beyond CSV configuration.
Future development priorities include: (a) integration of the FeliX-R5 regional model to enable sub-global analysis; (b) enhanced export capabilities including report generation and data download in standard formats; (c) guided scenario modes that walk non-expert users through pre-designed analytical workflows; (d) accessibility improvements in compliance with WCAG 2.1 guidelines (the Web Content Accessibility Guidelines, an internationally recognised set of standards for making web content accessible to users with disabilities); and (e) integration of uncertainty quantification and sensitivity analysis capabilities directly within the interactive interface.
Conclusions
This paper has presented the FeliX ISE, a browser-based Interactive Simulation Environment that makes the FeliX Integrated Assessment Model accessible to non-expert users through standard web browsers. By compiling the full system dynamics model to WebAssembly using the SDEverywhere toolchain and employing Web Workers for non-blocking computation, the tool achieves real-time scenario exploration without server-side dependencies. A three-level validation framework, encompassing Vensim model version consistency, direct numerical comparison between Vensim and WebAssembly outputs, and automated QA testing across the full input configuration space, confirms that the transpilation pipeline preserves exact numerical fidelity, with outputs matching to floating-point precision. The configuration-driven architecture, which decouples the model from the user interface through CSV specification files, is designed for transferability to any Vensim-based system dynamics model, a capability preliminarily demonstrated by loading an SIR epidemiological model through the same interface without code changes.
The FeliX ISE’s user interface design represents a systematic effort to mainstream complex IAM modelling results for broader audiences. Through simplified input controls, contextual tooltips, expandable markdown documentation, thematically organised output categories, and a structured two-panel cause-and-effect layout, the dashboard makes it visually explicit which inputs affect which outputs and how the modelled Earth systems are interconnected. This UI/UX-driven approach to communicating system complexity significantly lowers the expertise threshold for meaningful engagement with integrated assessment science, distinguishing the FeliX ISE from existing tools that present model parameters without contextual guidance on their systemic significance.
The FeliX ISE enables users to explore how dietary choices, food waste reduction strategies, alternative protein adoption, and behavioural dynamics propagate through interconnected climate, food, land use, biodiversity, water, and socioeconomic systems. The tool’s progressive disclosure interface design supports users ranging from expert modellers to non-specialist policymakers and citizens, while maintaining the full analytical depth of the underlying model. Multi-scenario comparison, scenario import/export, and comprehensive contextual documentation further enhance the tool’s utility for policy deliberation and educational applications.
By releasing the FeliX ISE as a fully open-source, freely accessible web application, this work contributes to the broader effort of making integrated assessment modelling more accessible and ensuring that the scientific tools needed to address interconnected sustainability challenges are available to all who need them.
Ethics and consent statement
This research did not involve experimentation with human participants. The FeliX ISE processes all user inputs locally within the browser; no personally identifiable information is collected, transmitted, or stored. The system architecture was designed with privacy-by-design principles, as all computation occurs on the client-side without any server communication. No adverse events were reported during the development and testing of the platform. As no human participants were involved in any stage of this research, ethical approval and informed consent were not required.
Declaration of generative AI and AI-assisted technologies in the writing process
During the preparation of this manuscript, the authors used generative AI-based tools, specifically large language models such as ChatGPT (OpenAI), solely to assist with language editing and consistency checks in limited sections. All substantive decisions regarding the design of the review, screening, data extraction, analysis and interpretation were made by the authors. The authors carefully reviewed and edited all AI-assisted text and take full responsibility for the integrity and accuracy of the manuscript’s content.
Data availability
The FeliX ISE operates on the parameters and equations of the FeliX 2.0 model, which is fully documented in the referenced literature.15 The tool’s functionality was validated through scenario demonstrations using the model’s built-in reference data.
Software availability
The software described in this article is available under an open-source licence. The following resources are publicly accessible:
Extended data
Zenodo. The FeliX ISE. The following extended data items are available as part of the archived FeliX ISE Dashboard repository (DOI: https://doi.org/10.5281/zenodo.18876116)43:
•
Extended Data 1: inputs.csv — The complete CSV configuration file defining all scenario input parameters, their types, ranges, groupings, and interface metadata used by the FeliX ISE. This file, together with the application codebase, fully specifies the input interface and can be adapted for other Vensim-based models.
•
Extended Data 2: graphs.csv — The complete CSV configuration file defining all output visualisations, including graph classifications, chart types, axis specifications, variable mappings, and styling parameters for the nine thematic output domains.
Data are available under the terms of the MIT License (source code) and the Creative Commons Attribution 4.0 International licence (CC-BY 4.0) for documentation and configuration files.
Acknowledgements
This work was carried out within the framework of the CHOICE project, funded by the European Union’s Horizon Europe Research and Innovation programme under Grant Agreement No. 101056926. The authors gratefully acknowledge the contributions of the broader CHOICE consortium partners and scientific collaborators who supported the FeliX model development and ISE implementation.
References
- 1.
Rockström J, Steffen W, Noone K, et al.:
A safe operating space for humanity.
Nature.
2009; 461: 472–475. Publisher Full Text
- 2.
Campbell BM, Beare DJ, Bennett EM, et al.:
Agriculture production as a major driver of the Earth system exceeding planetary boundaries.
Ecol. Soc.
2017; 22(4): 8. Publisher Full Text
- 3.
Weyant J:
Some contributions of integrated assessment models of global climate change.
Rev. Environ. Econ. Policy.
2017; 11(1): 115–137. Publisher Full Text
- 4.
Nikas A, Doukas H, Papandreou A:
A detailed overview and consistent classification of climate-economy models.Doukas H, Flamos A, Lieu J, editors.
Understanding Risks and Uncertainties in Energy and Climate Policy.
Cham:
Springer;
2019. Publisher Full Text
- 5.
IPCC:
Climate Change 2022: Mitigation of Climate Change. Contribution of Working Group III to the Sixth Assessment Report of the Intergovernmental Panel on Climate Change.
Cambridge University Press;
2022. Publisher Full Text
- 6.
Keppo I, Butnar I, Bauer N, et al.:
Exploring the possibility space: taking stock of the diverse capabilities and gaps in integrated assessment models.
Environ. Res. Lett.
2021; 16(5): 053006. Publisher Full Text
- 7.
Saltelli A, Benini L, Funtowicz S, et al.:
The technique is never neutral. How methodological choices condition the generation of narratives for sustainability.
Environ. Sci. Pol.
2020; 106: 87–98. Publisher Full Text
- 8.
van Beek L , Hajer M, Pelzer P, et al.:
Anticipating futures through models: the rise of Integrated Assessment Modelling in the climate science-policy interface since 1970.
Glob. Environ. Chang.
2020; 65: 102191. Publisher Full Text
- 9.
Sterman JD:
Business Dynamics: Systems Thinking and Modeling for a Complex World.
Boston:
Irwin/McGraw-Hill;
2000.
- 10.
Ford A:
Modeling the Environment.
Washington, D.C.:
Island Press;
2nd ed2010.
- 11.
Climate Interactive, MIT Sloan Sustainability Initiative, & Ventana Systems:
En-ROADS Climate Solutions Simulator [Computer software].2019.
Reference Source
- 12.
Rydzak F, Obersteiner M, Kraxner F, et al.:
FeliX3 – Impact Assessment Model: Systemic View across Societal Benefit Areas beyond Global Earth Observation.
Laxenburg:
International Institute for Applied Systems Analysis (IIASA);
2013.
- 13.
Eker S, Reese G, Obersteiner M:
Modelling the drivers of a widespread shift to sustainable diets.
Nat. Sustainability.
2019; 2: 725–735. Publisher Full Text
- 14.
Ye Q, Liu Q, Swamy D, et al.:
FeliX 2.0: An integrated model of climate, economy, environment, and society interactions.
Environ. Model. Softw.
2024; 179: 106121. Publisher Full Text
- 15.
Tantaroudas ND, Koukoudis K, Tsimiklis G, et al.:
A Mixed Reality Eye-Tracking Investigation on Key Factors Affecting Food Consumption Habits.
International Conference on Extended Reality.
Springer;
2024; pp. 244–253. Publisher Full Text
- 16.
Tantaroudas ND, Koukoudis K, Katika T:
A Mixed Reality Eye-Tracking Study on Visual Influences in Dietary Choices.
21st EuroXR International Conference — EuroXR 2024.
Springer;
2024.
- 17.
Marntirosian P:
Development of an Interactive Simulation Environment to Enhance the Use of Integrated Assessment Models (IAMs) and Inform Climate Change Policy Using the FeliX Model.2025. thesis_filippos_marntirosian.pdf.
- 18.
Riahi K, van Vuuren DP , Kriegler E, et al.:
The Shared Socioeconomic Pathways and their energy, land use, and greenhouse gas emissions implications: An overview.
Glob. Environ. Chang.
2017; 42: 153–168. Publisher Full Text
- 19.
Forrester JW:
Industrial Dynamics.
Cambridge, MA:
MIT Press;
1961.
- 20.
Meadows DH, Meadows DL, Randers J, et al.:
The Limits to Growth: A Report for the Club of Rome's Project on the Predicament of Mankind.
New York:
Universe Books;
1972.
- 21.
Meadows DH, Wright D:
Thinking in Systems: A Primer.
White River Junction, VT:
Chelsea Green Publishing;
2008.
- 22.
Sterman JD:
All models are wrong: Reflections on becoming a systems scientist.
Syst. Dyn. Rev.
2002; 18(4): 501–531. Publisher Full Text
- 23.
Millennium Institute:
iSDG: Integrated Sustainable Development Goals Model Documentation.2021.
Reference Source
- 24.
Dixson-Declève S, Gaffney O, Ghosh J, et al.:
Earth for All: A Survival Guide for Humanity.
New Society Publishers;
2022.
- 25.
Huppmann D, Gidden M, Nicholls Z, et al.:
pyam: Analysis and visualisation of integrated assessment and macro-energy scenarios.
Open Research Europe.
2021; 1: 74. Publisher Full Text
- 26.
DECC:
The Global Calculator.
UK Department of Energy and Climate Change;
2015.
Reference Source
- 27.
Haas A, Rossberg A, Schuff DL, et al.:
Bringing the web up to speed with WebAssembly.
Proceedings of the 38th ACM SIGPLAN Conference on Programming Language Design and Implementation (PLDI 2017).
2017; pp. 185–200. Publisher Full Text
- 28.
Climate Interactive:
SDEverywhere: System Dynamics model transpiler and build tools [Computer software].2024.
Reference Source
- 29.
MDN Web Docs:
Web Workers API.
Mozilla Developer Network;
2024.
Reference Source
- 30.
Houghton JP, Siegel M:
Advanced data analytics for system dynamics models using PySD.
Proceedings of the 33rd International Conference of the System Dynamics Society.
Cambridge, MA:
2015.
Reference Source
- 31.
Simlin:
Browser-based system dynamics model editor [Computer software].2024.
Reference Source
- 32.
Walsh B, Ciais P, Janssens IA, et al.:
Pathways for balancing CO2 emissions and sinks.
Nat. Commun.
2017; 8: e14856. Publisher Full Text
- 33.
Eker S, Liu Q, Reiter C, et al.:
Full of Economic-Environment Linkages and Integration dX/dt (FeliX): Technical Model Documentation. IIASA Report, ZVR 524808900.
Laxenburg, Austria:
International Institute for Applied Systems Analysis (IIASA);
2023.
Reference Source
- 34.
Liu Q, Gao L, Guo Z, et al.:
Robust strategies to end global poverty and reduce environmental pressures.
One Earth.
2023; 6(4): 392–408. Publisher Full Text
- 35.
Moallemi EA, Eker S, Gao L, et al.:
Early systems change necessary for catalyzing long-term sustainability in a post-2030 agenda.
One Earth.
2022; 5(7): 792–811. Publisher Full Text
- 36.
Creutzig F, Roy J, Lamb WF, et al.:
Towards demand-side solutions for mitigating climate change.
Nat. Clim. Chang.
2018; 8: 260–263. Publisher Full Text
- 37.
Eker S, Garcia D, Valin H, et al.:
Using social media audience data to analyse the drivers of low-carbon diets.
Environ. Res. Lett.
2021; 16(7): 074001. Publisher Full Text
- 38.
Willett W, Rockström J, Loken B, et al.:
Food in the Anthropocene: the EAT–Lancet Commission on healthy diets from sustainable food systems.
Lancet.
2019; 393(10170): 447–492. PubMed Abstract
| Publisher Full Text
- 39.
Springmann M, Clark M, Mason-D'Croz D, et al.:
Options for keeping the food system within environmental limits.
Nature.
2018; 562: 519–525. Publisher Full Text
- 40.
Rogers RW:
A Protection Motivation Theory of Fear Appeals and Attitude Change.
J. Psychol.
1975; 91(1): 93–114. Publisher Full Text
- 41.
FAO:
Global Food Losses and Food Waste: Extent, Causes and Prevention.
Rome:
Food and Agriculture Organization of the United Nations;
2011.
Reference Source
- 42.
Chart.js:
Simple yet flexible JavaScript charting library [Computer software].2024.
Reference Source
- 43.
Eker S, Tantaroudas ND, Tan R:
The FeliX ISE.
Zenodo.
2026. Publisher Full Text
- 44.
Eker S, Tan R:
FeliX Model Master.
Zenodo.
2026. Publisher Full Text
- 45.
Rooney-Varga JN, Kapmeier F, Sterman JD, et al.:
The climate action simulation.
Simul. Gaming.
2020; 51(2): 114–140. Publisher Full Text
- 46.
Barlas Y:
Formal aspects of model validity and validation in system dynamics.
Syst. Dyn. Rev.
1996; 12(3): 183–210. Publisher Full Text