1. Introduction
Micro-mobility refers to lightweight personal vehicles, with a maximum speed of 45 km/h and a maximum weight of 350 kg, for short urban trips. This mode of transport became more attractive as it aims to offer healthier, greener, and more flexible alternatives to cars (Almohammad et al., 2024; Miah et al., 2019). It represents a low-carbon transportation mode but it requires improving road conditions, expanding protected micro-mobility lanes, and promoting protective equipment use (Ferguson & Blandino, 2025). Effectively, the increasing use of micro-mobility devices may improve personal mobility but it can distress users about their safety and wellbeing (Gunawan et al., 2025). Therefore, road safety remains a critical concern, particularly for micro-mobility and Vulnerable Road Users (VRUs) such as cyclists or motorised couriers. Even though the popularity which micro-mobility is gaining nowadays, the tendency of accidents involving this mode of transport is increasing from year to year in many cities around the world. Therefore, the safety of micro-mobility users remains a challenge in urban environments, especially when overtaken by vehicles, and limits the choice to travel by this mode of transport.
In recent years, advancements in sensor technology and data analytics have provided opportunities to enhance micro-mobility and road safety through innovative solutions. Effectively, sensing systems and devices offer the potential to gather real-time data on road user behaviour, environmental conditions and micro-vehicle performance, enabling a deeper understanding of road safety dynamics. Therefore, these sensing systems and devices will support and enhance the safety of micro-mobility and reduce the chances of road accidents.
Understanding the factors contributing to accidents involving VRUs is essential for implementing effective safety measures. Therefore, micro-mobility users need to have a more comprehensive understanding of the surrounding hazards and dangerous situations to be able to avoid risky locations and potential accidents. Effectively, micro-mobility users may face different types of hazards including infrastructure deficiencies (i.e., potholes), obstacles, and traffic congestion. Therefore, micro-mobility users can be provided with a hazards map which enables them to avoid dangerous and hazardous locations (Almohammad et al., 2025a).
High speed of micro-mobility is a very important risk factor contributing to accidents and severe injury (Ozturk, 2025). Additionally, micro-vehicles speed is one of the main factors that determine the severity of micro-mobility accidents since accidents with higher speed means harsher accidents (Boufous et al., 2018). Therefore, safety level of micro-mobility can be increased by decreasing the micro-vehicle riding speed. Usually, the maximum speed limit of micro-mobility is 20–25 kmph, depending on the road and traffic conditions (Zhang et al., 2023). Hence, micro-mobility safe speed limit can be calculated and provided as an advice to micro-mobility users to adjust and regulate their speed and therefore enhance their safety.
Collisions between micro-mobility with motor vehicles may cause serious injury or even death for micro-mobility users who are not physically protected (e.g., not wearing helmets) (Ozturk, 2025). For example, helmets provide necessary head protection for micro-mobility users in collisions and fall down accidents (Zhang et al., 2023). Additionally, the safety of micro-mobility users can be significantly improved by using protective equipment (PE) such as high-visibility clothing, helmets and lights (Hoye et al., 2020). Therefore, some governments enacted road traffic acts to enforce all micro-mobility users to wear helmets when using micro-vehicles (Kim & Kim, 2023). Effectively, evaluating the effectiveness of micro-mobility PE may lead to reduced micro-mobility accidents, improved micro-mobility and VRU safety, and promoted sustainable micro-mobility (Almohammad et al., 2025b).
Section two of this paper discusses and critically analyses previous work and studies, highlighting gaps in the research topic. The proposed approach for enhancing the safety of micro-mobility is described and detailed in section three including the sensory kit, micro-mobility hazards detector, speed regulator, and protective equipment evaluator. Additionally, the implementation of this approach and the presentation of potential results are provided in section four. Then, a discussion on the implications of the provided contribution and next steps is outlined in section five. Finally, the conclusions are presented in section six.
2. Background and related work
The safety of micro-mobility users remains an important concern. Therefore, enhancing micro-mobility safety may involve improving many relevant aspects including infrastructure, user behaviour, micro-vehicle design, technology, policies and regulations. Many studies have been conducted to analyse micro-mobility accidents and investigate safety factors.
One study reviewed and analysed the design principles of implementing cycling infrastructure and their ability to accommodate powered micro-mobility devices in terms of how this impact micro-mobility safety (Hossein Sabbaghian et al., 2023). The results highlighted the importance of tailored infrastructure design to enhance micro-mobility safety. In another study, a systematic review has been conducted on several issues related to the safety of electric micro-mobility for adults and children (Kotsiubynska et al., 2023). It highlights the characteristics of injuries and the relationship between the frequency of injuries and the use of protective equipment. Effectively, the use of passively generated big data and its applications in micro-mobility research and practice has been reviewed in a different study to address main challenges of micro-mobility (Schumann et al., 2023). In this research, issues requiring further research have been highlighted and new insights for safe and efficient micro-mobility have been provided. The reviewed passively generated big data includes data collected from stationary sensors and cameras, mobile sensors, and GPS devices. As a result of this study, it has been believed that one of the major directions for future micro-mobility safety research includes the use of passively generated big data for real-time micro-mobility traffic monitoring, hazard detection and speed restrictions. Another study reviewed current trends in micro-mobility focusing on the safety and sustainability requirements (Tsami et al., 2021). The results of the conducted survey confirmed many users and stakeholders requirements regarding micro-mobility safety. These requirements include training, possibility to monitor and control vehicles, and utilising solar energy charging panels. Furthermore, a qualitative approach (an interview with head of a micro-mobility company) has been used to study the effects of micro-mobility technologies and advanced data-driven systems in optimising urban mobility and enhancing safety in urban environments (Wallis, 2024). It reveals that real-time vehicle monitoring and data analytics significantly improve micro-mobility safety and enhances micro-mobility integration into urban infrastructure. However, one of the key urban challenges identified is the absence of consistent safety regulations across the market. In a separate investigation based on analysing data collected during a workshop attended by 40 participants from 15 countries in October 2019, a range of micro-mobility safety improvements has been recommended (Santacreu et al., 2020). These recommendations include micro-vehicle design, fleet operation, infrastructure, regulatory enforcement and training.
To explore the factors of micro-mobility safety, one of the studies analysed some reported E-Scooter crash data to describe the patterns of crashes (Yang et al., 2020). It emphasises on the importance of developing safety countermeasures to reduce crashes involving E-Scooters. The analysis of data for 169 crashes reported in the USA between 2017–2019 provided some supportive evidences for the importance of discussing key issues related to helmet use, riding under influence, vulnerable riders, and data deficiency. In another study, image-processing techniques have been integrated with machine learning methodologies to extract crash features and understand the factors influencing injury severity among micro-mobility users (Qawasmeh et al., 2024). It used the crash reports for Michigan UD-10 in 2023 including 1174 micro-mobility crash diagrams. As a conclusion of this study, the factors that determine the severity of micro-mobility injuries include the roads’ speed limits, micro-mobility rider violations and motorists left-turning manoeuvres, improper lane use, and hazardous actions by micro-mobility users. Additionally, data about micro-mobility accidents is collected from the Nablus Traffic Police Department (2018 to 2022) to understand the aspects of these crashes and a questionnaire is used to understand the level of users awareness about micro-mobility safety (Salman, 2024). In this research, each micro-vehicle is equipped with two cameras to examine the riders’ behaviour. As a result, the study suggests some countermeasures and provides recommendations to improve micro-mobility safety. In a separate investigation, the variables that affect micro-mobility accidents have been analysed by using machine learning technologies to estimate the probability of these accidents (Inac, 2023). Therefore, data related to E-Scooter drivers is collected from a rental application used in 15 Turkish cities. This study aims to estimate the optimum values of the input parameters (i.e., travel distance, driving time, and driving speed) that can reduce E-Scooter accidents. In a different study, a data-driven approach is adopted to construct safety maps for micro-mobility users (e.g., cyclists) in diverse urban environments (Tamagusko et al., 2023). This approach uses object detection algorithms and image segmentation techniques to identify potential risk factors on cycling lanes from Google Street View images.
One research investigated the safety level of e-bikes, e-scooters and segways in terms of stability, manoeuvrability and rider comfort (Billstein & Svernlov, 2021). Therefore, thirty-four voluntary participants used vehicles with mounted sensors and a LIDAR sensor performed four different tasks and then filled in a questionnaire regarding the experienced safety and performance of the vehicles. Additionally, a real-time obstacle detection and alert system (audible) has been developed to enhance user safety (Gunawan et al., 2025). This system is achieved by deploying a low-cost YOLOv12 object detection model and DeepSORT tracking algorithm on a Raspberry Pi 4. It remarkably enhances situational awareness, reduces preventable accidents, and supports vulnerable road user. In a different study, dynamic performance and safety considerations of micro-vehicles including the possible risk factors have been empirically investigated to improve micro-mobility safety (Milan et al., 2025). Therefore, micro-vehicle self-stability, handling, acceleration, braking, and obstacle interaction have been considered. This study provided some recommendations for designing and regulating small-wheel micro-mobility devices to reduce micro-mobility accidents and promote transportation safety.
The majority of studies which investigate the safety of micro-mobility and VRUs focus on reviewing and analysing the factors which may affect the safety of micro-mobility. These factors include infrastructure design, real-time vehicle monitoring, micro-mobility technologies, advanced data-driven systems, the absence of consistent safety regulations, and the use of protective equipment. Additionally, the analysis of micro-mobility crash data identified other factors including riding under influence, helmet use, roads’ speed limits, rider violations, improper lane use, and rider hazardous actions. Therefore, some micro-mobility safety recommendations related to micro-vehicle design, infrastructure, regulatory enforcement and training have been provided. A limited number of studies focus on employing machine learning technologies, sensing systems, cameras, and image processing techniques for enhancing micro-mobility safety such as examining the riders’ behaviour, reducing micro-mobility accidents, and identifying potential risk factors on roads. Therefore, micro-vehicle stability, manoeuvrability, rider comfort, possible risk factors, and obstacle detection have been considered and investigated. Additionally, the main challenges of micro-mobility have been reviewed and future research directions identified. This includes the use of sensors, cameras, and GPS devices for real-time micro-mobility traffic monitoring, hazard detection and speed restrictions. However, there is a very limited research which consider more than one practical and technical solution for enhancing micro-mobility and VRUs safety. Therefore, our study proposes a real-time data-driven approach to improve the safety of micro-mobility through a developed data collection system and three practical micro-mobility safety solutions or services which can support users in their day-to-day travelling.
3. Proposed method
In this study, we present a real-time data-driven approach to assist micro-mobility users and VRUs in their day-to-day travelling. Effectively, this approach mainly involves the development of one sensory kit for data collection and three safety services for enabling micro-mobility users to minimise errors in their decision making, avoid exposure to hazardous situations and receive proactive notifications for potential hazards and safe speeds (
Figure 1). These micro-mobility safety services which include hazards detector, speed regulator, and protective equipment effectiveness evaluator will support users of micro-mobility to minimise the risks that may lead to accidents. The hazards detector is responsible for warning the riders of micro-vehicles about potential hazards that may destabilise the vehicle or accumulatively lead to a potential crash. It is designed and developed to identify areas with specific infrastructure deficiencies such as potholes and obstacles. Additionally, the speed regulator is responsible for regulating the speed of micro-vehicles according to the status of the road, existence of hazards, and potential accidents. It can warn the riders of micro-vehicles about safe speed limits and proactively notify them to decelerate when approaching hazards. Furthermore, the protective equipment effectiveness evaluator is responsible for evaluating the effectiveness of various types of protective equipment used by micro-mobility users. These protective equipment aims to enhance micro-mobility safety and promote sustainable micro-mobility by reducing traffic accidents involving VRUs and mitigating the impact of experienced accidents, if there are any.
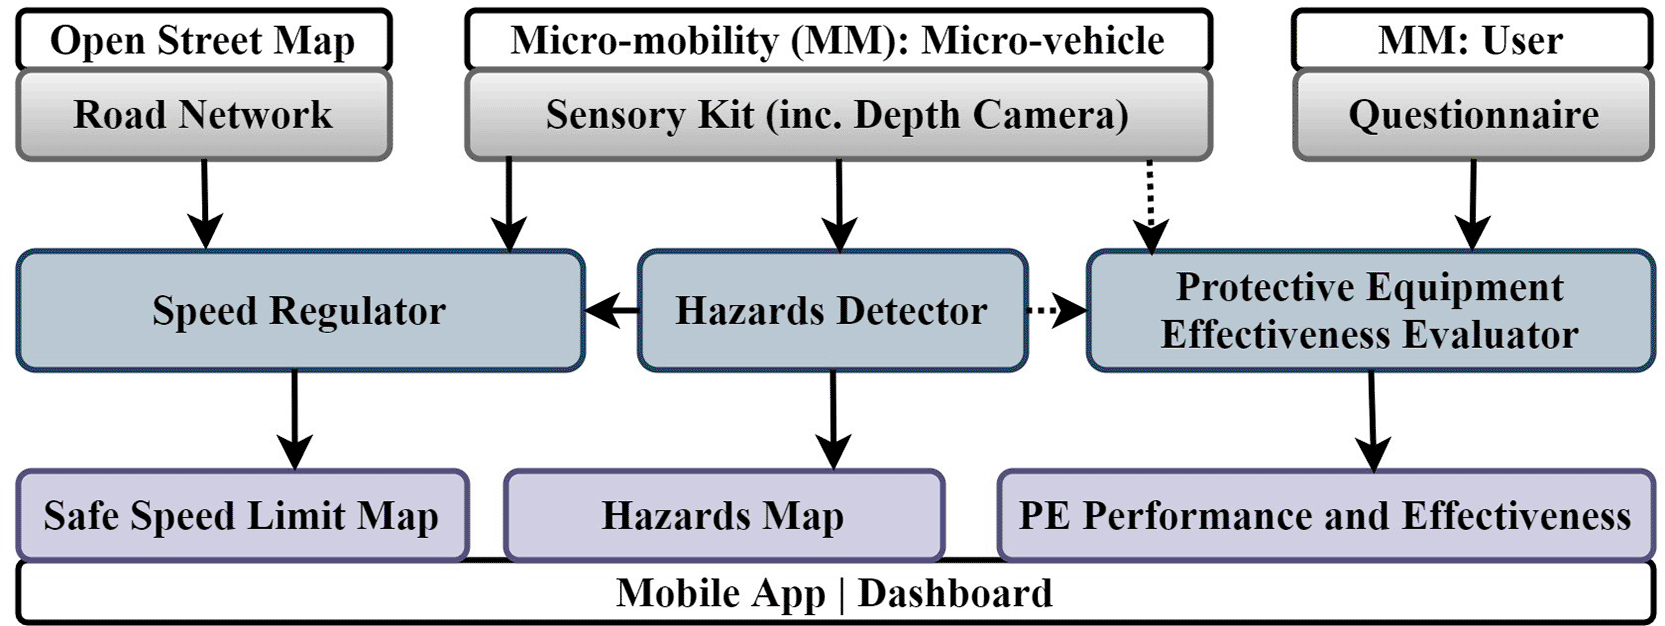
Figure 1. The proposed approach for enhancing micro-mobility safety.
Therefore, the proposed approach provides several types of valuable information related to micro-mobility safety including hazards map, safe speed limits, and protective equipment efficiency. Effectively, these outcomes may be utilised and presented to end users through a dedicated mobile application with interactive user interface. The components of the proposed approach and related input data are described in the following subsections.
3.1 Sensory kit
A sensory kit has been developed by integrating a depth camera with several sensors and microcontrollers to collect heterogeneous contextual, vehicle handling, kinematics and environmental data. It aims to collect comprehensive data about micro-mobility incidents to facilitate the analysis of accident circumstances and to improve safety measures. So, it can collect micro-level data about VRUs including the behaviour and stress level of micro-mobility riders, the environmental factors, and the micro-vehicle location, speed, acceleration, angular velocity, orientation, and proximity to surrounding objects. Additionally, the sensory kit is designed to be mounted on micro-vehicles such as bicycles and e-scooters so it can capture a comprehensive range of data and transmit this data to cloud-based platforms for real-time monitoring and analysis.
Figure 2 shows the architecture of the sensory kit which integrates several sensors and devices including:
• Arduino Nano 33 BLE Sense Rev2 which includes Inertial Measurement Unit (IMU) and collects data related to micro-vehicles’ acceleration, angular velocity and orientation,
• Arduino Nicla Sense ME which includes IMU and magnetometer, and collects data related to micro-vehicles’ motions, user behaviour and environmental conditions (i.e., temperature and humidity),
• Intel RealSense depth camera (D435) to collect data related to micro-vehicles’ proximity to surrounding objects and to capture video footage for the scene around micro-vehicles,
• Force sensor or grip force sensor (ZD10–100) can be attached to bicycles grip handlebar to measure the stress level of micro-vehicles’ users,
• Global Positioning System (GPS) receiver to define micro-vehicles’ location and speed.
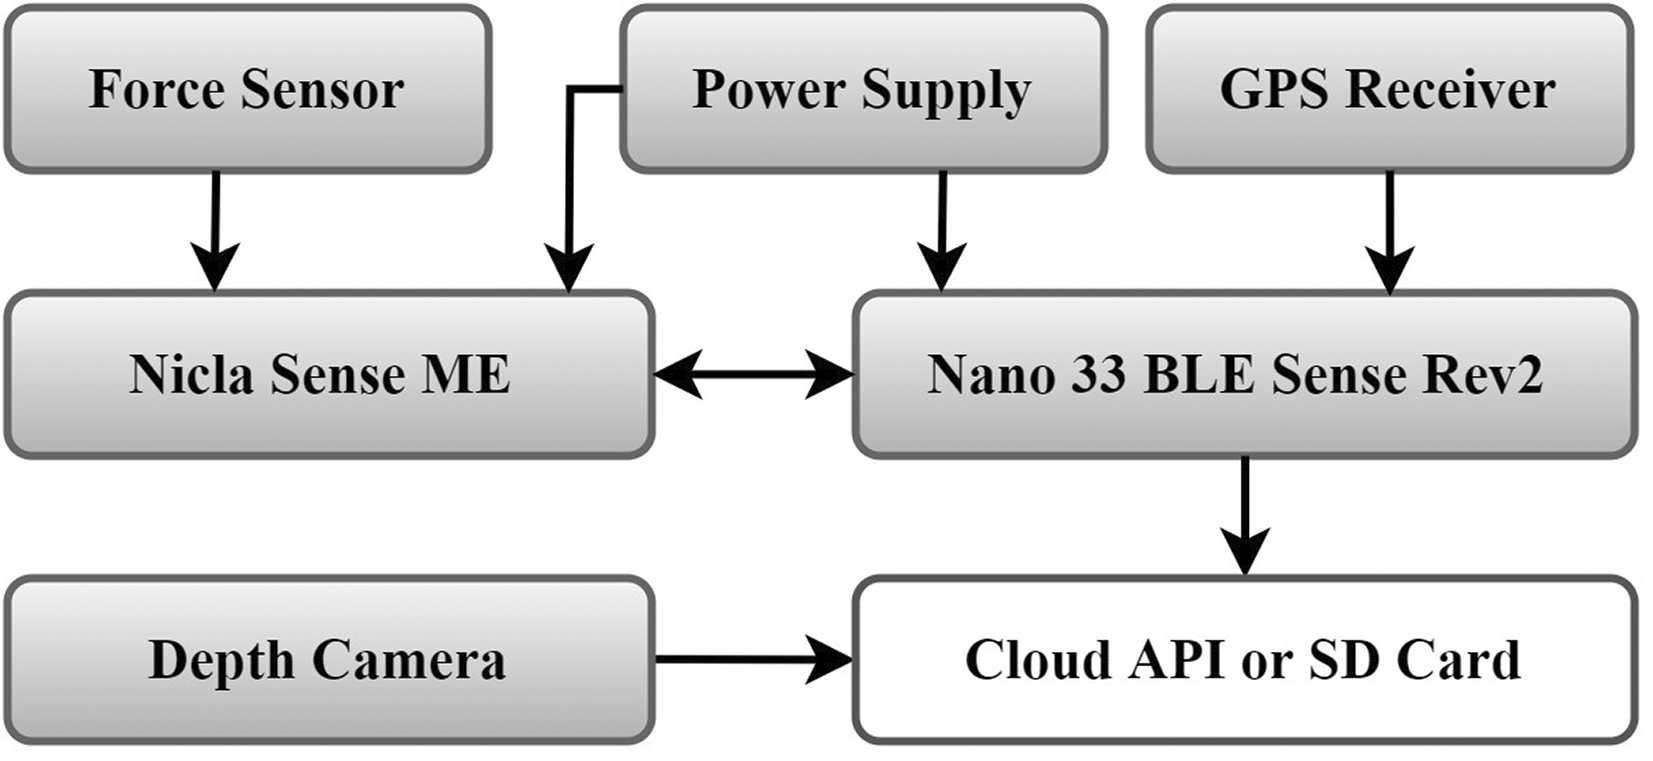
Figure 2. The architecture of the sensory kit.
These integrated sensors and devices including the Secure Digital (SD) card and power supply (except the grip sensors and depth camera) have been fitted in a suitable case particularly designed and printed for this purpose. Essentially, data collected by the sensory kit can be either stored (i.e., as CSV files) in a local storage medium such as SD card or uploaded to the cloud.
3.2 Hazards detector
Hazards detector provides a real-time micro-mobility hazards map and enables users and VRUs to avoid hazardous situations and locations. It uses data collected by the sensory kit to offer a holistic view of urban micro-mobility by mapping high-risk areas and identifying high-conflict zones. Effectively, it aims to enhance the safety of micro-mobility by identifying defected infrastructure and hazardous locations which may affect the wellbeing and comfort of micro-mobility users. Therefore, it has been designed to detect several types of hazards such as road potholes and heavy traffic, as well as three main levels of hazard severity; low, medium, and high.
Figure 3 shows the architecture of the hazards detector which monitors micro-mobility by using the sensory kit to detect and map many types and severities of micro-mobility hazards. Effectively, micro-vehicles equipped with sensory kits will be used on road networks and users may follow routes of their choice. Therefore, data collected by the sensory kit will include speed, grip force, proximity to the surrounding objects, video recordings, acceleration, angular velocity, and orientation. The left side of
Figure 3 shows the procedures of generating machine learning models responsible for detecting a predefined set of micro-mobility hazards. However, the right side shows the procedures of using these generated machine learning models and real-time sensory kit data to detect micro-mobility hazards.
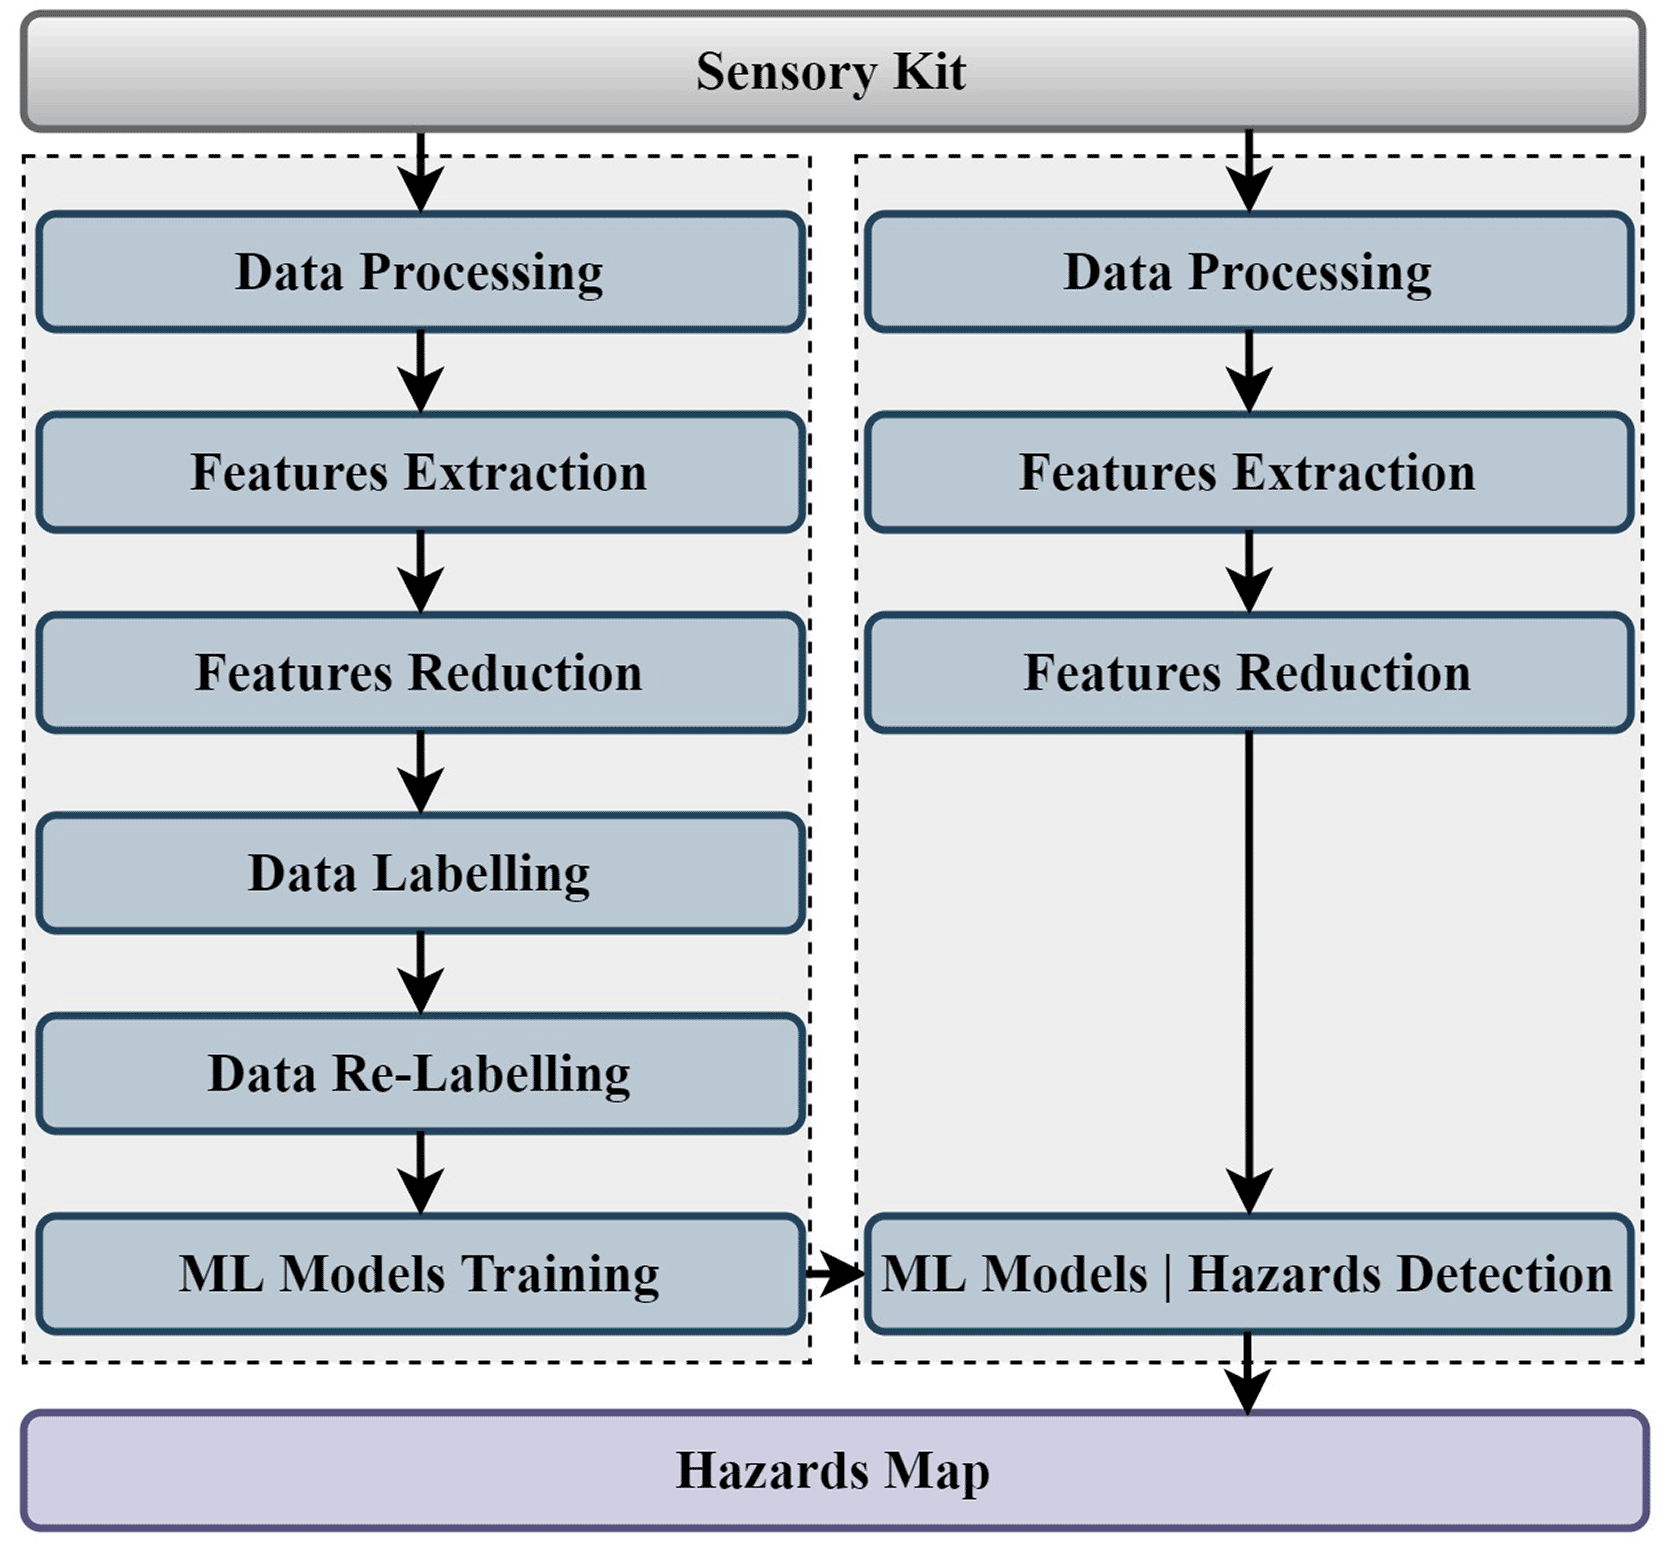
Figure 3. The architecture of the hazards detector.
Data processing in the architecture is responsible for combining and synchronising data collected by different sensors. Also, it aggregates the proximity data collected by the depth camera within three values (front, right, and left side proximity) and aggregates the grip sensors data within one single value. Therefore, the hazards detector considers several input data variables including speed, grip force, proximity to surrounding objects (three values), acceleration (three values), angular velocity (three values) and orientation (three values). Effectively, features extraction is responsible for transforming this input data into a set of features that are more informative and efficient for training machine learning models. So, the average and standard deviation are calculated (per one-second data sample) for acceleration, angular velocity, orientation, proximity, speed and grip force signals while the minimum is calculated only for proximity. However, features reduction is responsible for reducing the number of calculated features, diminishing the computational complexity and speed up machine learning algorithms required to train the input data. Therefore, Principal Component Analysis (PCA) is used to reduce the dimensionality of features to less components while keeping the majority of variance in the input data.
Data labelling in the architecture is responsible for manually tagging data samples (with relevant hazard type) related to the detected hazards as a result of observing and analysing videos recorded by the camera. This process focuses on labelling the following types of micro-mobility hazards: rough-surface points, potholes, obstacles, and dangerous overtakes. However, data re-labelling is responsible for tagging data samples related to a specific hazard type by relevant hazard severity level. This process uses machine learning clustering technique (i.e., K-Means) to cluster data samples of a hazard type into three levels of severities (i.e., low, moderate, and high). Eventually, re-labelled data samples related to all types of hazards will be combined and aggregated with clear data samples in one dataset. Then, machine learning models training is responsible for training this dataset and generating many machine learning classifiers which can detect several types and severity levels of micro-mobility hazards.
Effectively, generated machine learning models (
Figure 3, right side) will facilitate the real-time detection of micro-mobility hazards in terms of hazard type and severity. Therefore, according to the real-time data collected by the sensory kit, these classifiers will identify the location where a specific micro-mobility hazard (type and severity) is detected.
3.3 Speed regulator
Speed regulator aims to regulate the speed of micro-vehicles according to road status, hazards map and potential accidents. It is responsible for providing real-time map of safe speed limits and warning micro-mobility users about safe speed limits. Therefore, these speed advices and warnings which can be provided to micro-mobility users through different means such as mobile applications or on-bike devices will allow them to decelerate when approaching hazards, avoid accidents, and minimise the severity of experienced accidents.
Figure 4 shows the architecture of the speed regulator which monitors micro-mobility hazards map generated by using the hazards detector to estimate the relevant safe speed limits for different road sections and routes. Speed regulator mainly uses the output of hazards detector, sensory kit data, and Open Street Map (OSM) data as input data. It has been mentioned above that the output of the hazards detector includes the location, type, and severity of hazards. Moreover, sensory kit data considered by the speed regulator includes environmental or weather data such as temperature and humidity. Additionally, the speed regulator considers some OSM platform data including road type and characteristics. The left side of
Figure 4 shows the procedures of generating a machine learning model responsible for predicting safe speed limits. However, the right side shows the procedures of using this generated machine learning model and real-time data to estimate safe speed limits.
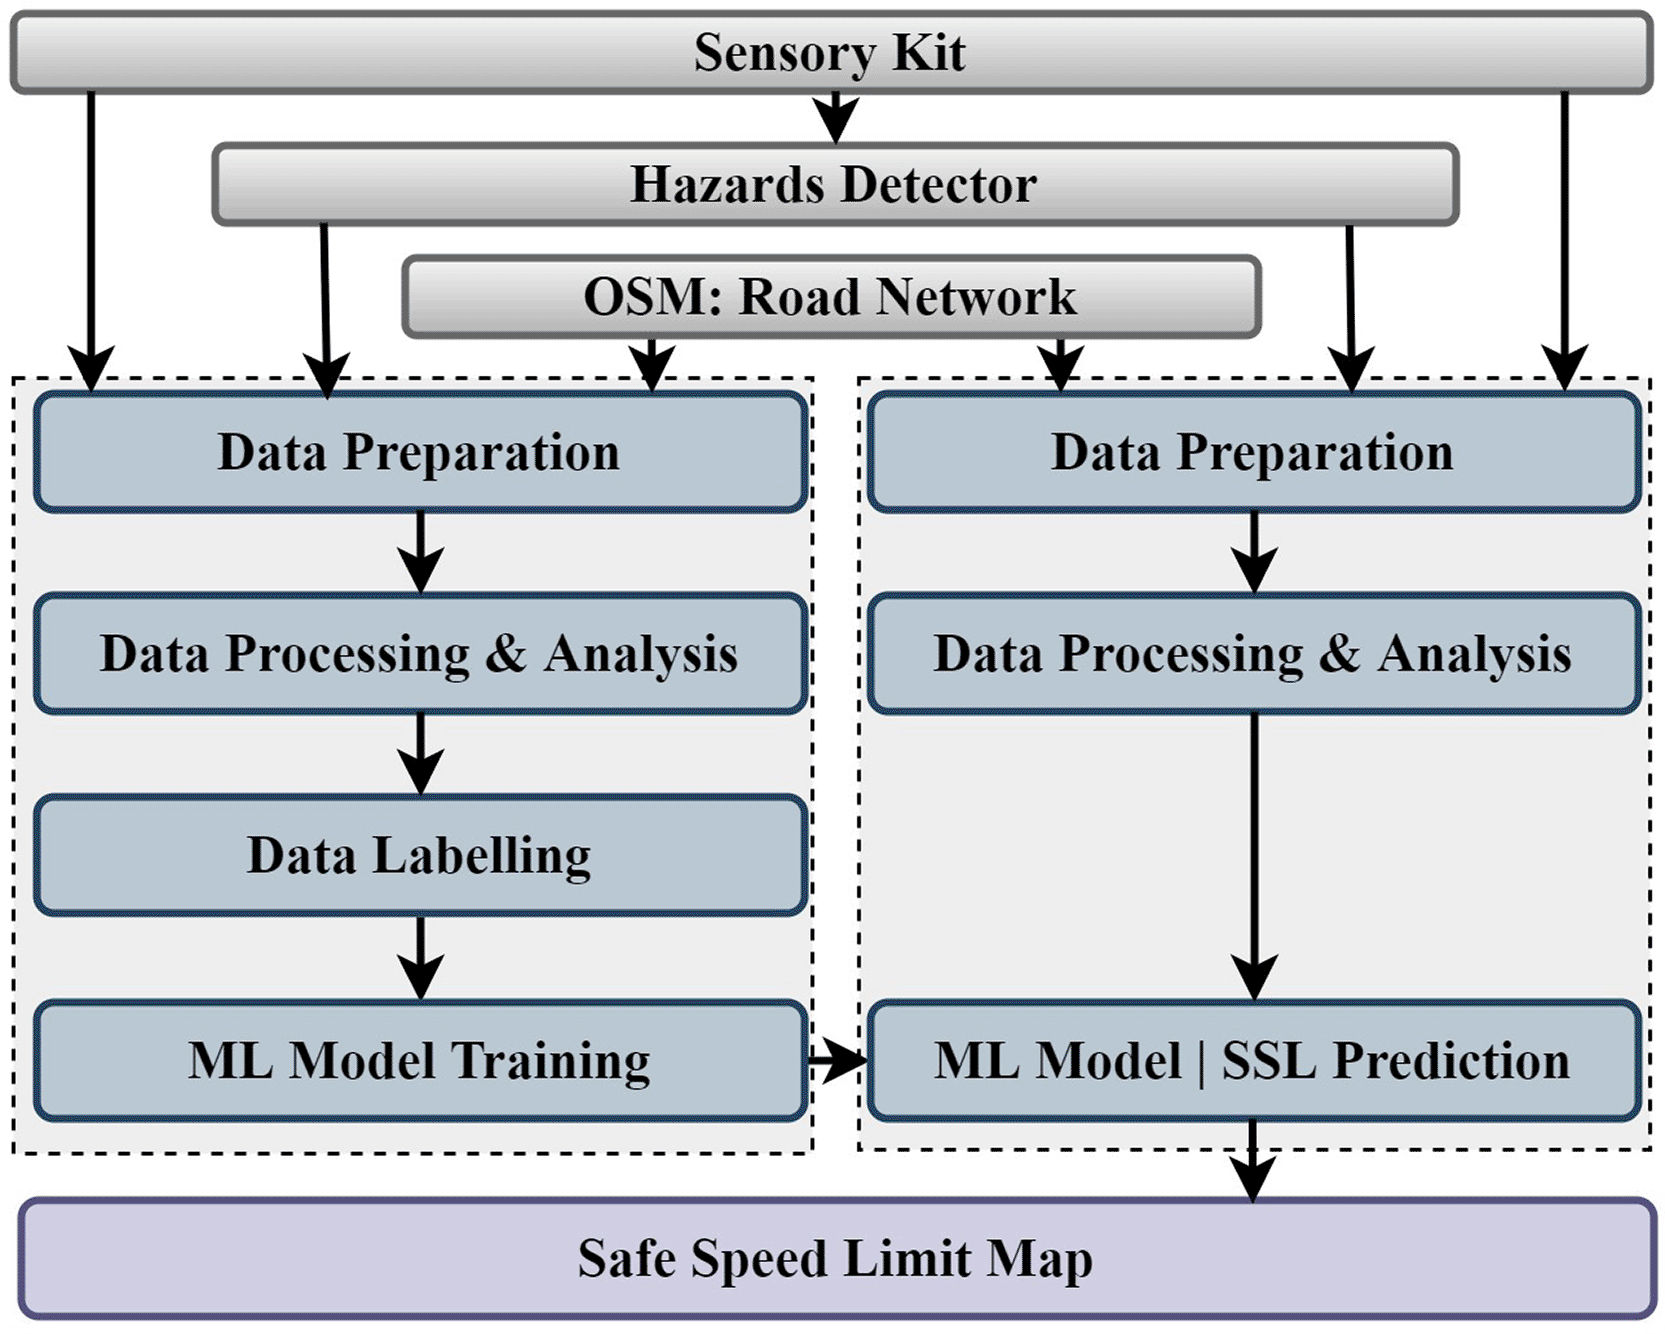
Figure 4. The architecture of the speed regulator.
Data preparation in the architecture is responsible for linking, organising and combining collected data from the hazards detector, sensory kit, and OSM in one dataset. Additionally, locations (i.e., coordinates) of detected hazards are used as a starting point to gather other related data (i.e., road type and weather condition). Therefore, input data to the speed regulator includes detected micro-mobility hazards, weather condition, and road characteristics. Effectively, data processing and analysis is responsible for coding the input data which will be converted into categorical data to facilitate the application of machine learning technologies. For example, the OSM platform considers and uses a long list of roads categories which can be coded or converted to limited road types (i.e., good, average, and poor). This can be applied to the measured temperature values which can be converted to one of three categories. Additionally, data labelling is responsible for tagging data samples (with relevant safe speed limits) related to the detected hazards. This process uses machine learning clustering technique (i.e., K-Means) to cluster data samples of detected hazards into a number of clusters which can be determined by using elbow curve method. Furthermore, machine learning model training is responsible for training the labelled data and generating a machine learning classifier which can predict the level of micro-mobility safe speed limit.
Effectively, generated machine learning model (
Figure 4, right side) will facilitate the real-time prediction of micro-mobility safe speed limit. Therefore, according to the real-time data collected from the micro-mobility hazards detector, sensory kit, and OSM, this classifier will predict safe speed limits for the road sections which include micro-mobility hazards.
3.4 Protective equipment effectiveness evaluator
Protective equipment effectiveness evaluator aims to evaluate the efficiency of various types of protective equipment which can be used by micro-mobility users and VRUs. It correlates metrics related to micro-vehicles and riders’ status with protective equipment characteristics and features. Additionally, it allows the effectiveness evaluation of various types of protective equipment including preventive PE which mainly used to avoid accidents (i.e., reflectors) and protective PE which mainly used to avoid or mitigate injuries (i.e., helmet). Therefore, it will provide micro-mobility users and VRUs with a comprehensive understanding of the capabilities of different PE types, and will help these users to select and use the most appropriate PE.
Figure 5 shows the architecture of the PE effectiveness evaluator which involves data collection procedures and data analysis techniques to assess the effectiveness of various types of PE. It mainly considers features of the protective equipment, characteristics of VRUs, experienced accidents and sustained injuries by micro-mobility users. However, it may consider environmental, road and traffic conditions which can be provided by the sensory kit and hazard detector.
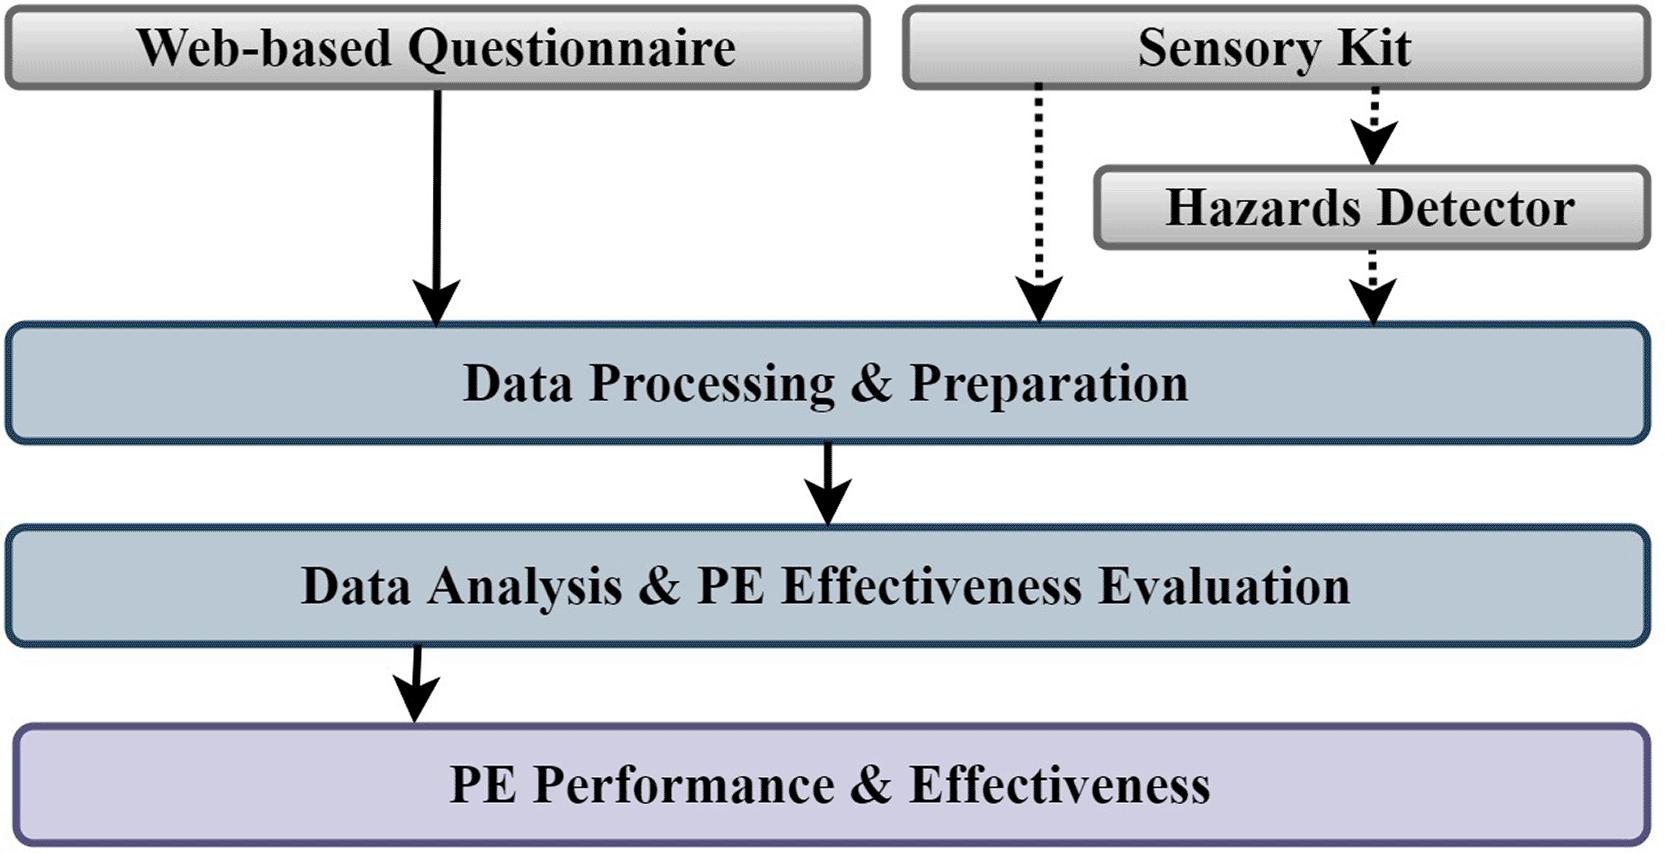
Figure 5. The architecture of the protective equipment effectiveness evaluator.
The main method used to collect the input data for the PE effectiveness evaluator is the survey by deploying a web-based questionnaire disseminated among micro-mobility users. This technique allows us to collect data about micro-mobility users’ behaviour on the road, the protective equipment they usually use and wear, any experienced accidents, and any sustained injuries as a result of these accidents. However, hazards detector and sensory kit data (i.e., environmental and traffic condition data) may be used as optional input data upon availability. The web-based questionnaire is designed and developed to collect data from micro-mobility users (i.e., by sending emails containing the questionnaire link) and it consists of five multiple-choice questions (see
Table 1). Moreover, this questionnaire has been developed in such a way that the responses and answers of micro-mobility users to this questionnaire will be sufficient to evaluate the effectiveness of PE regardless of the availability of optional input data.
Table 1. The questionnaire deployed for collecting input data of PE effectiveness evaluator.
| Questions/Answers |
|---|
| Q1 | When travelling by a micro-vehicle, which of the following tools or equipment do you use? (select ALL that apply) |
| A1 | 1. High visibility clothing, 2. Front light, 3. Rear light, 4. Reflective accessories, 5. Mirror, 6. Bell or horn, 7. None of the above |
| Q2 | When travelling by a micro-vehicle, which of the following protective equipment (PE) do you wear? (select ALL that apply) |
| A2 | 1. Helmet, 2. Gloves or wrist guard, 3. Glasses, mask or shield, 4. Body armour or safety jacket, 5. Chest guard or protector, 6. Back protector, 7. Arm guards or elbow pads, 8. Leg guards or knee pads, 9. Foot protector, ankle guard or over shoes, 10. None of the above |
| Q3 | While travelling by a micro-vehicle, what is the type of incident you have had recently? |
| A3 | 1. Crash or accident, 2. Near miss, 3. Fall down, 4. None of the above |
| Q4 | If you have had a crash or fall down incident, what is the type of injury you have sustained? (select ALL that apply) |
| A4 | 1. Head, 2. Face, 3. Chest, 4. Back, 5. Arms, 6. Hands, 7. Legs, 8. Feet, 9. No injury, 10. Not applicable (i.e., no crash or fall down incident) |
| Q5 | When you use your micro-vehicle, you do the following: (select ALL that apply) |
| A5 | 1. Obey road signs and stop when traffic lights turn to red, 2. Deliberately ride the wrong way down one-way roads, 3. Swap lanes to avoid slowing or stopping, 4. Kerb-jump on the pavement to avoid slowing or stopping, 5. Weave between other vehicles or users to avoid slowing or stopping, 6. Deliberately travel as fast as possible, 7. Eat or drink whilst using your micro-mobility device, 8. Use your mobile pone whilst using your micro-mobility device, 9. Use ear or head phones to listen to music whilst using your micro-mobility device, 10. Use your micro-mobility device after consuming alcohol or using unprescribed medicines, 11. None of the above |
Data processing and preparation in the architecture is responsible for linking, organising, and combining the collected data in one dataset (when hazards detector and sensory kit data are used). Additionally, it is responsible for coding the input data to facilitate the data analysis procedures. For example, answers of micro-mobility users (A5 in
Table 1) related to their riding behaviour can be coded to identify the behaviour of these users as one of three categories: normal, aggressive, or dangerous. Effectively, data analysis and PE effectiveness evaluation is responsible for analysing the responses of all micro-mobility users to the questionnaire (and other available input data) and assess the efficiency of each protective equipment. Therefore, the correlations among the collected data variables will be measured to understand the relationships among these variables and how they affect each other. The phi coefficient (ϕ) correlation which is a special case of the Pearson correlation coefficient will be used to measure the strength of association between two binary variables such as yes/no or true/false. It is calculated from a 2*2 contingency table as follows:
where; TP: true positive, TN: true negative, FP: false positive, FN: false negative.
Additionally, Cramér’s phi (or Cramér’s V) which is the equivalent of an effect size for the chi-square test will be used to measure the strength of association between two categorical variables. It is useful for contingency tables larger than 2*2 and can be calculated as follows:
where; X
2: the chi-square statistic, n: total sample size, r: number of rows, c: number of columns.
4. Implementation and results
The proposed approach for enhancing the safety of micro-mobility has been demonstrated and the included services have been described. Therefore, the procedures, experiments, and technical operations performed to implement, test, and evaluate this approach will be described in this section. This includes the activities and procedures followed to collect input data and some examples of this data. Additionally, it demonstrates the implementation procedures of the proposed safety services, generated machine learning models, and some examples of obtained results.
Effectively, the proposed approach relies on sensory kit data and data collected directly from micro-mobility users by using the web-based questionnaire. However, these data collection process has not been completed and finalised and there is no real data to be used for testing and evaluating the developed safety services. Therefore, synthetic data has been generated and used to demonstrate that the proposed approach is feasible and practical. This data is only used to test the functionalities of different safety services and to demonstrate some results as a proof-of-concept. So, all findings mentioned in this paper are not actual or empirical results but provided only for illustrative purposes to show the format of the expected results when real data is used.
4.1 Data collection and input data
The main data sources used to collect the input data required for the proposed approach include the sensory kit and the web-based questionnaire. Therefore, these data sources and the relevant data collected are described in the following sub-sections.
4.1.1 Sensory kit data
As mentioned above, a sensory kit has been developed and mounted on a bicycle to collect micro-mobility data. The plan was to recruit many volunteers who accept to use the equipped micro-vehicle on sequential basis (user after another) over two weeks. Additionally, each user is supposed to ride the micro-vehicle, choose the travel duration, and follow any preferred route without restrictions. However, the process of collecting real sensory kit data hasn’t been started yet. Therefore, some experiments and test rides have been completed and the measurements and readings of the sensory kit were stable, accurate and reliable.
Table 2 shows a sample of this collected data by the sensory kit including temperature (T), humidity (H), pressure (P), acceleration (A), angular velocity (G), orientation (Q), grip force (F), and speed (S). Effectively, data collected by the sensory kit is very limited and insufficient to train the machine learning models related to the hazards detector and speed regulator. Therefore, some synthetic data has been generated and used to test the functionalities of these services. This generated data is labelled and has a sampling rate of 50 Hz. It represents 42953 seconds (11.93 hours) of sensory kit data generated for several routes in Wolverhampton city (UK). It includes timestamp, coordinates, acceleration, angular velocity, orientation, grip force, proximity, speed, temperature, and label (
Figure 6). Synthetic data generation approach considers rough-surface points, potholes, obstacles, and dangerous overtakes hazards and the variations in the values of relevant data variables.
Table 2. Sample of data collected by the sensory kit.
|
Timestamp |
T |
H |
P |
Ax |
Ay |
Az |
Gx |
Gy |
Gz |
Qx |
Qy |
Qz |
F |
Lat |
Long |
S |
|---|
| 1770830138149 | 9.2 | 37 | 100.35 | −0.144 | 0.266 | 0.967 | 0.4272 | −0.061 | 0.061 | −0.028 | 0.151 | 0.9445 | 2.033 | 52.591 | −2.1209 | 3.98 |
| 1770830138167 | 9.2 | 37 | 100.35 | −0.144 | 0.266 | 0.967 | 0.4272 | −0.061 | 0.061 | −0.028 | 0.151 | 0.9445 | 2.033 | 52.591 | −2.1209 | 3.98 |
| 1770830138191 | 9.2 | 37 | 100.35 | −0.144 | 0.266 | 0.967 | 0.4272 | −0.061 | 0.061 | −0.028 | 0.151 | 0.9445 | 2.033 | 52.591 | −2.1209 | 3.98 |
| 1770830138205 | 9.2 | 37 | 100.35 | −0.144 | 0.266 | 0.967 | 0.4272 | −0.061 | 0.061 | −0.028 | 0.151 | 0.9445 | 2.033 | 52.591 | −2.1209 | 3.98 |
| 1770830138208 | 9.2 | 37 | 100.35 | −0.144 | 0.266 | 0.967 | 0.4272 | −0.061 | 0.061 | −0.028 | 0.151 | 0.9445 | 2.033 | 52.591 | −2.1209 | 3.98 |
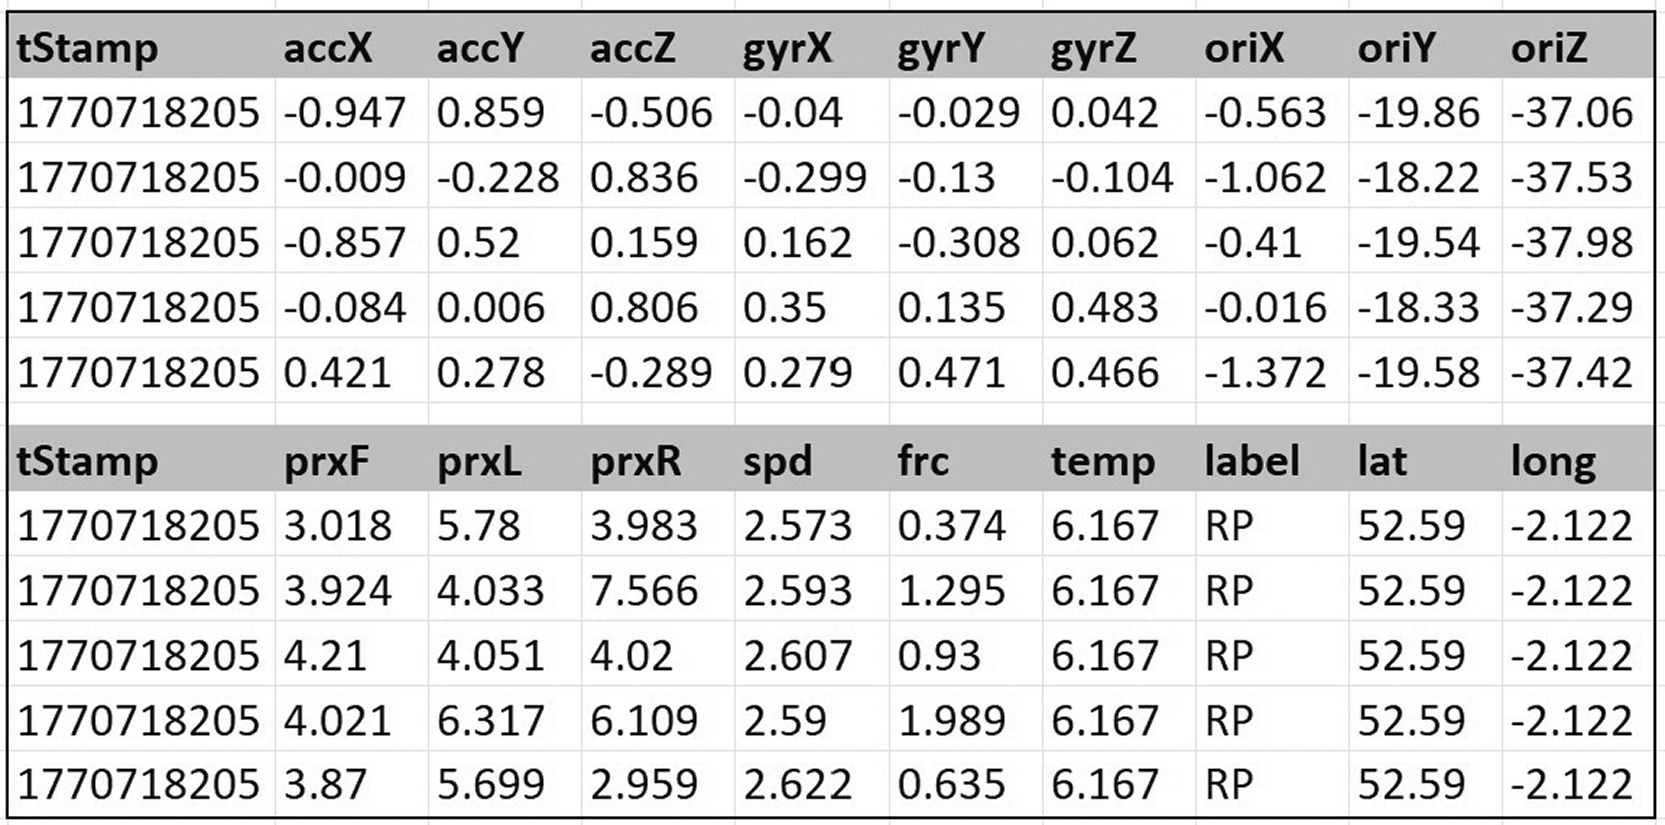
Figure 6. Sample of synthetic data generated to represent the sensory kit data.
4.1.2 Web-based questionnaire data
It has been explained that one of the components involved in the proposed approach, the PE effectiveness evaluator, mainly uses the data collected from micro-mobility users through a web-based questionnaire. As part of the SOTERIA project, a list of email addresses of micro-mobility users who are interested to take part in such a survey has been obtained. The plan was to share the link to the designed and developed questionnaire (through the Google Forms) with these users by email. Additionally, it has been supposed that the responses of the participated users in this survey (i.e., answers to the questionnaire questions) will be stored online anonymously.
Table 3 shows one sample of these responses provided by one user. However, the data collection process hasn’t been started yet. Therefore, synthetic data has been generated to test the PE effectiveness evaluator. This synthetic data is used to provide a proof-of-concept demonstration of this safety service and evaluate the effectiveness of various PE. Additionally, this synthetic data represents the final format of the collected data after the data processing and preparation step and before the data analysis and PE effectiveness evaluation step. Effectively, a sample dataset (48 entries) has been manually created as the authors of this paper have pretended as micro-mobility users, filled in the designed questionnaire and answered all the questions many times. Since this dataset was insufficient to extract significant conclusions, a deep learning-based framework (Conditional Tabular Generative Adversarial Network – CTGAN) has been used to generate realistic synthetic data (a total of 498 entries).
Figure 7 shows an example of three data samples of the generated synthetic data.
Table 3. Example of one user response to the web-based questionnaire.
| timestamp | 2/24/2026 11:04:16 |
|---|
| Q1: When travelling by a micro-vehicle, which of the following tools or equipment do you use?
| Front light, Reflective accessories |
| Q2: When travelling by a micro-vehicle, which of the following protective equipment (PE) do you wear?
| Helmet, Gloves or wrist guard |
| Q3: When travelling by a micro-vehicle, what is the type of incident you have had recently?
| Fall down |
| Q4: If you had a crash or fall down incident, what is the type of injury you have had?
| No injury |
| Q5: When you use your micro-vehicle, you do the following:
| Obey road signs |
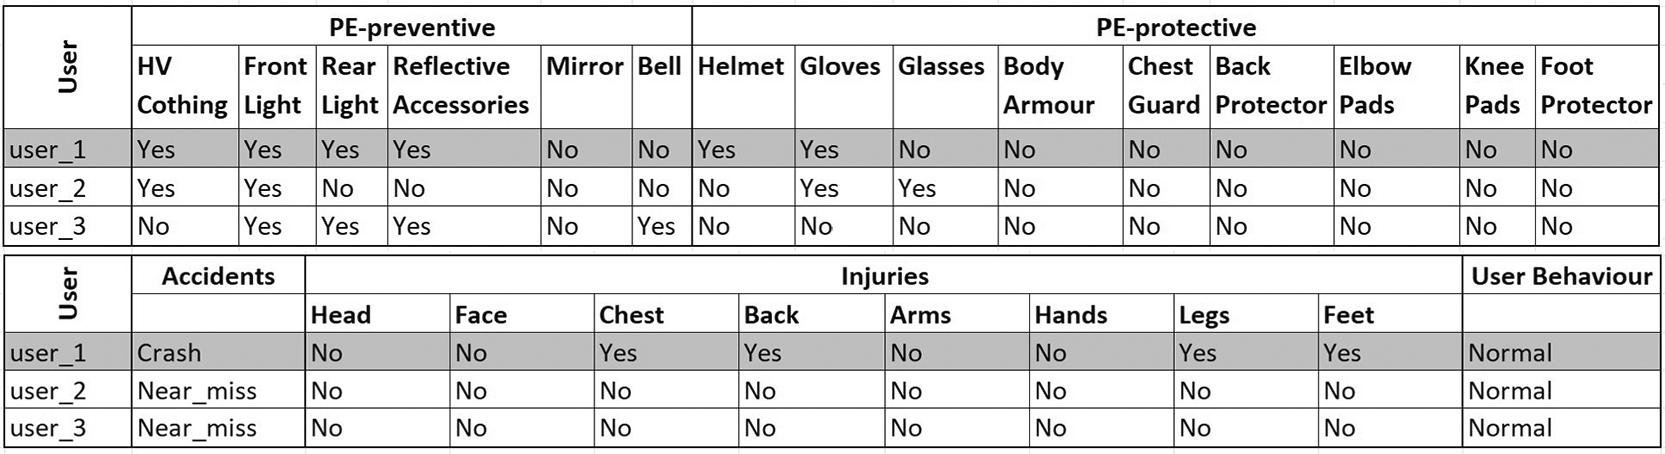
Figure 7. An example of three data samples of the generated synthetic data.
4.2 Hazards detection
Synthetic data has been generated to represent the sensory kit data and to be used as input to the hazards detector. This data has been generated to represent the output of the data processing step and to be used as input to the features extraction step (
Figure 3). Therefore, specific features of each data variable have been extracted as mentioned above, and PCA has been used to reduce the dimensionality of these features. Effectively, two different PCA calculations have been considered so each one involves the relevant data variables. One of these (PCA_X) has been applied to detect rough-surface points (RP) and potholes (PT) while the other one (PCA_Y) to detect obstacles (OB) and dangerous overtakes (DO). Therefore, the first one (PCA_X) is applied to the average and standard deviation values of vertical acceleration, lateral angular velocity, grip force, and speed (8 data variables). However, the second one (PCA_Y) is applied to the average and standard deviation values of longitudinal angular velocity, vertical angular velocity, grip force, and speed. Additionally, this one considers the minimum and standard deviation values of front proximity and right proximity (12 data variables). The number of components that explain a high percentage of the original data’s total variance (80%) has been calculated for both PCAs. Therefore, four components have been considered for PCA_X and six components for PCA_Y to capture 80% of data variance.
Data labelling process (
Figure 3) is responsible for labelling the data manually through observing recorder videos and extracting hazards, when detected. This data labelling process considers only specific pre-defined types of hazards, as mentioned above. Additionally, this process needs to synchronise the produced dataset with the recorded videos so data entries associated with hazards in the videos can be tagged. However, this data labelling process can not be implemented (due to unavailability of camera data) and not even required when synthetic data is used since this data is labelled (in terms of associated hazards) and supervised machine learning technologies can be applied.
Table 4 shows the statistics for the values of “label” field in the synthetic data. Additionally, dataset entries related to each of potholes, obstacles and dangerous overtakes hazards need to be re-labelled in terms of criticality or severity of this hazard. For each of these hazards, K-Means clustering technique is applied on all related data entries to categorise these entries into three levels of hazard severity: low, moderate, and high (i.e., K = 3 clusters). As a result, dataset entries related to these hazards will be labelled in terms of hazard type (e.g., pothole) and severity (e.g., low). Eventually, data entries related to rough-surface points, potholes, and non-hazard entries (PCA_X) are combined and aggregated in one dataset (DS1). However, data entries related to obstacles, dangerous overtakes, and non-hazard entries (PCA_Y) are combined and aggregated in another dataset (DS2). DS1 and DS2 have been trained by a machine learning algorithm (i.e., Support Vector Machines – SVM) to generate two classifiers (saved for future use). One classifier is responsible for detecting the type of RP and the type and severity of PT (
Table 5). However, the other classifier is responsible for detecting the type and severity of OB and DO (
Table 6). Mainly, 80% of DS1 and DS2 have been used for models training while 20% have been used for models testing.
Table 4. Statistics for the values of “label” field in the synthetic data.
| label | hazard | clear | total |
|---|
| rough_points | potholes | obstacles |
dangerous_overtakes |
|---|
| # database entries
| 13391 | 892 | 1399 | 295 | 26976 | 42953 |
Table 5. The results of testing the 1st trained ML classifier (RP and PT).
| hazard | precision | recall | f1-score | support |
|---|
| RP
| 1.00 | 1.00 | 1.00 | 2746 |
| none
| 1.00 | 1.00 | 1.00 | 5352 |
| PT0
| 1.00 | 1.00 | 1.00 | 41 |
| PT1
| 1.00 | 0.98 | 0.99 | 46 |
| PT2
| 0.99 | 1.00 | 0.99 | 67 |
Table 6. The results of testing the 2nd trained ML classifier (OB and DO).
| hazard | precision | recall | f1-score | support |
|---|
| none
| 1.00 | 1.00 | 1.00 | 5397 |
| OB0
| 1.00 | 0.99 | 0.99 | 94 |
| OB1
| 0.99 | 1.00 | 0.99 | 66 |
| OB2
| 1.00 | 1.00 | 1.00 | 110 |
| DO0
| 1.00 | 1.00 | 1.00 | 11 |
| DO1
| 0.97 | 1.00 | 0.99 | 33 |
| DO2
| 1.00 | 0.96 | 0.98 | 23 |
Effectively, generated machine learning models (
Figure 3, right side) will facilitate the real-time detection of micro-mobility hazards in terms of hazard type and severity. Therefore, according to the real-time data collected by the sensory kit, these classifiers will identify the location, type and severity of detected micro-mobility hazard. The hazards detector aims to detect five types of hazards: rough-surface road, potholes, obstacles, heavy traffic, and dangerous overtakes. The generated classifiers can detect rough-surface points and three types of hazards (i.e., potholes, obstacles, and dangerous overtakes). However, the detected rough-surface points is used to identify rough-surface road hazards (> = 5 consecutive RPs) as demonstrated in
Figure 8. Additionally, the detected obstacle hazards are used to identify heavy traffic hazards (> = 4 OBs in 7 consecutive seconds) as demonstrated in
Figure 9. As a result,
Figure 10 shows a screenshot for part of the hazard map generated for the city of Wolverhampton (UK). As mentioned above, this is not empirical findings based on real data but it is based on synthetic data and represents a proof-of-concept demonstration for the hazards detector service.
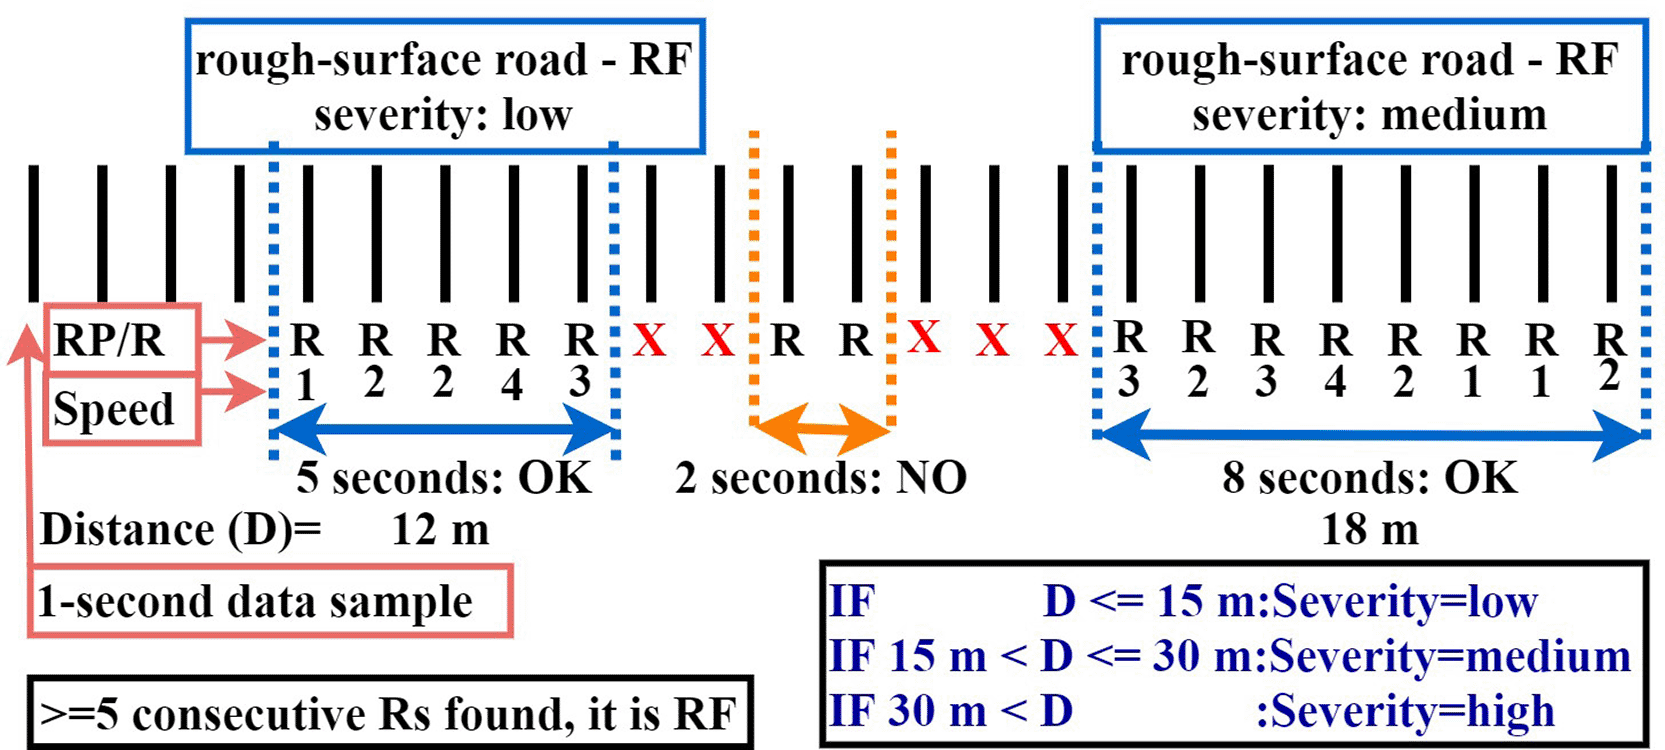
Figure 8. The proposed approach to detect rough-surface road hazard.
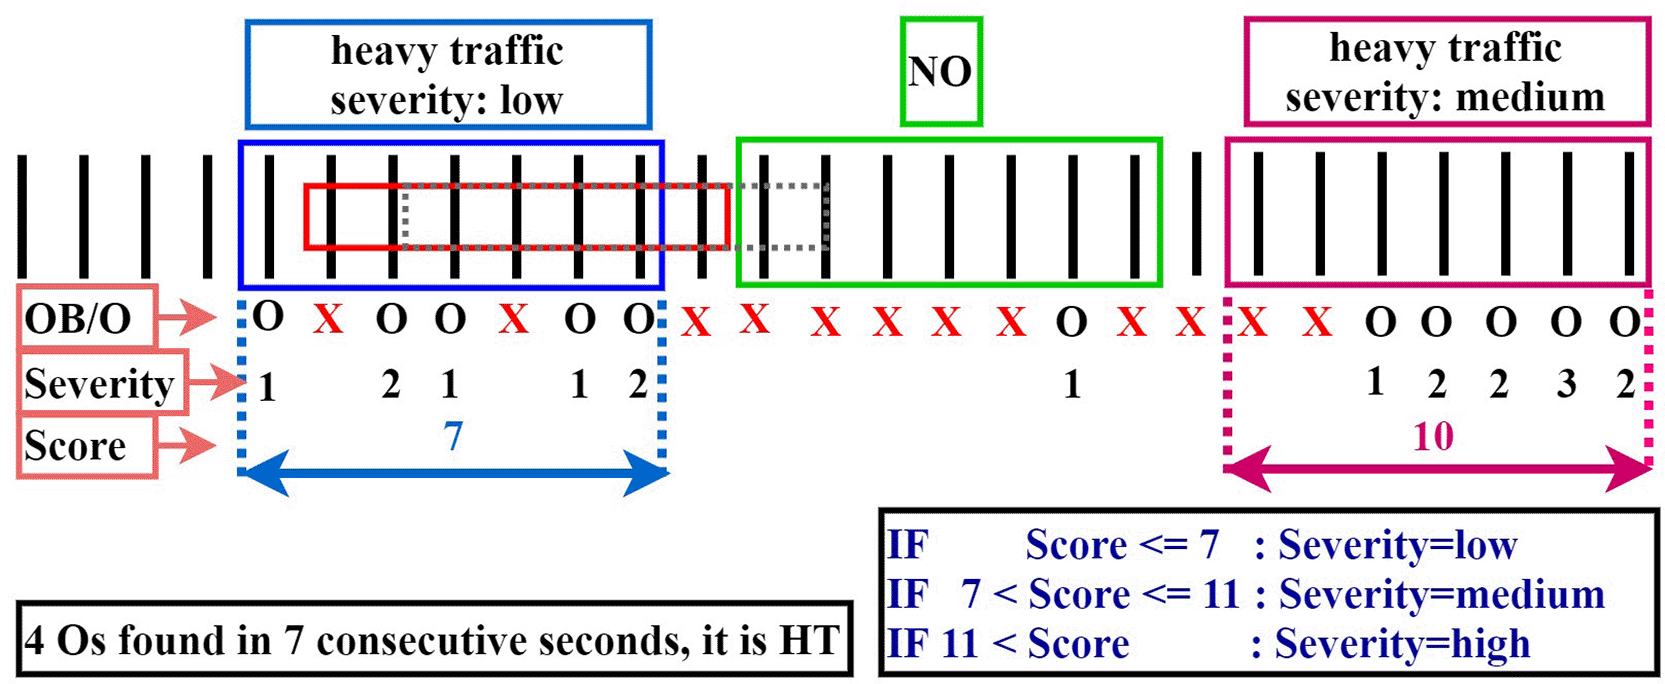
Figure 9. The proposed approach to detect heavy traffic hazard.
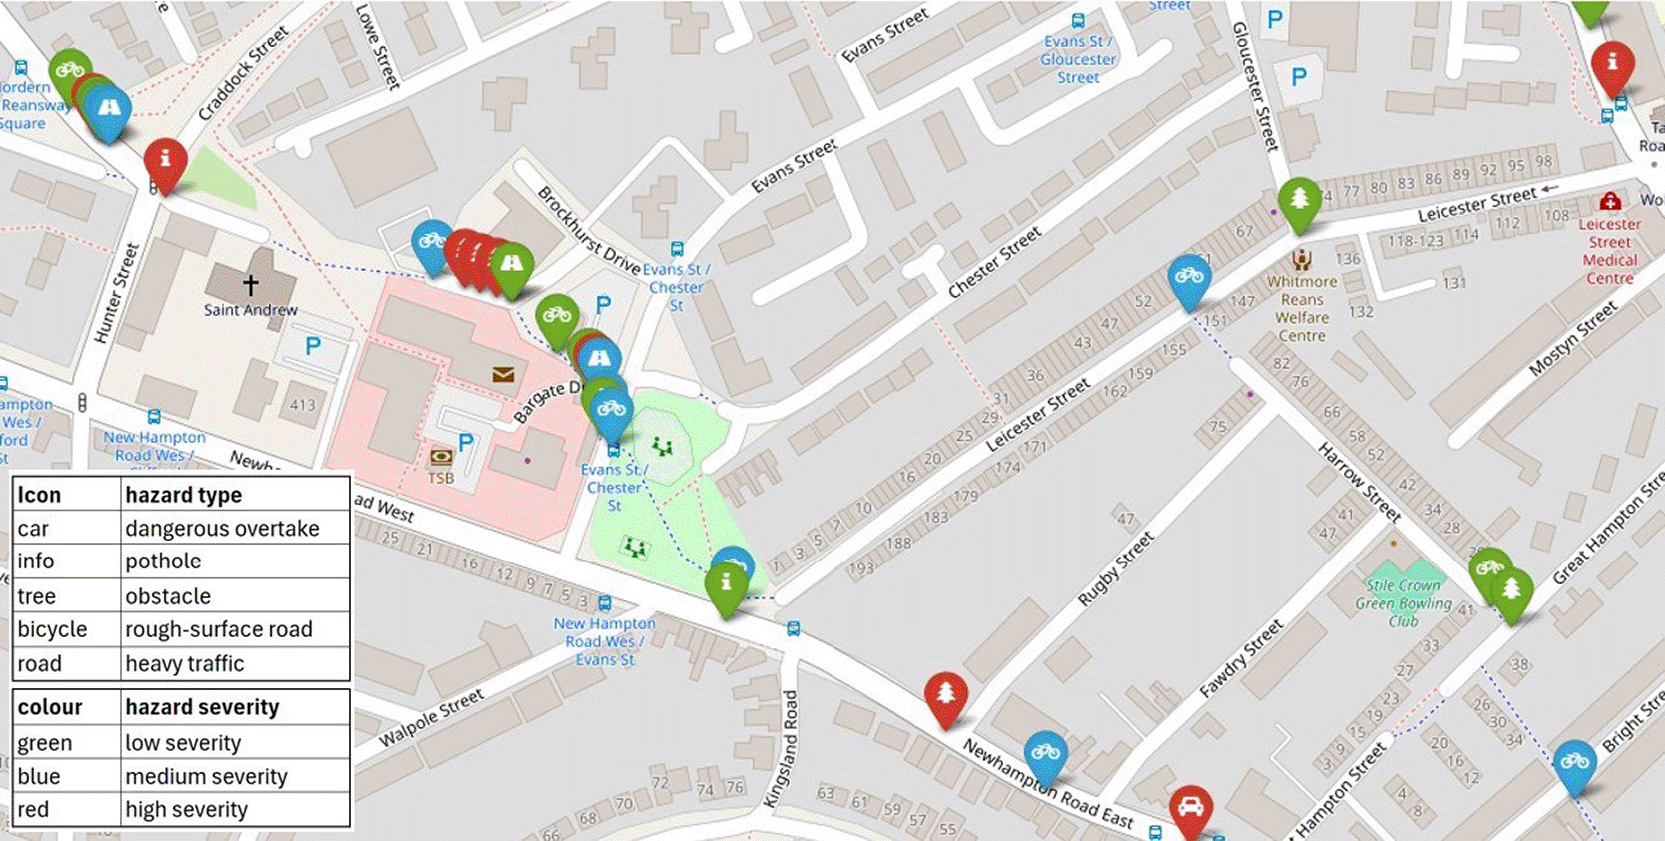
Figure 10. A screenshot from the hazard map generated for the city of Wolverhampton (UK).
4.3 Speed regulation
The output of the hazards detector represents the basis for the speed regulator. Therefore, dataset entries (of the synthetic data) that are related to micro-mobility hazards have been considered and used as input to the speed regulator (3612 entries). This hazard detector output, weather condition data (i.e., synthetic data generated), and data extracted from the OSM are linked and organised in one dataset as part of the data preparation process. Additionally, this input data is coded and converted into a limited categorical data list. Therefore, each value for the road type extracted from the OSM and each value for the temperature (synthetic data) is coded into one of three main categories; good, average, or poor. Effectively, this dataset is unlabelled and therefore K-Means clustering technique is applied to the dataset entries to categorise these entries into a number of clusters which represent safe speed limit levels. Mainly, the number of these clusters has been calculated and identified by using elbow curve method.
Figure 11 shows that the optimal number of clusters (K) is 4. Each cluster refers to speed reduction by a certain percentage (cluster 0: 15%, cluster 1: 30%, cluster 2: 45%, cluster 3: 60%). The labelled dataset is trained by a machine learning algorithm (i.e., Support Vector Machines – SVM) to generate a classifier responsible for estimating the level of micro-mobility safe speed limit (
Table 7). Mainly, 80% of the dataset entries have been used for model training while 20% have been used for models testing.
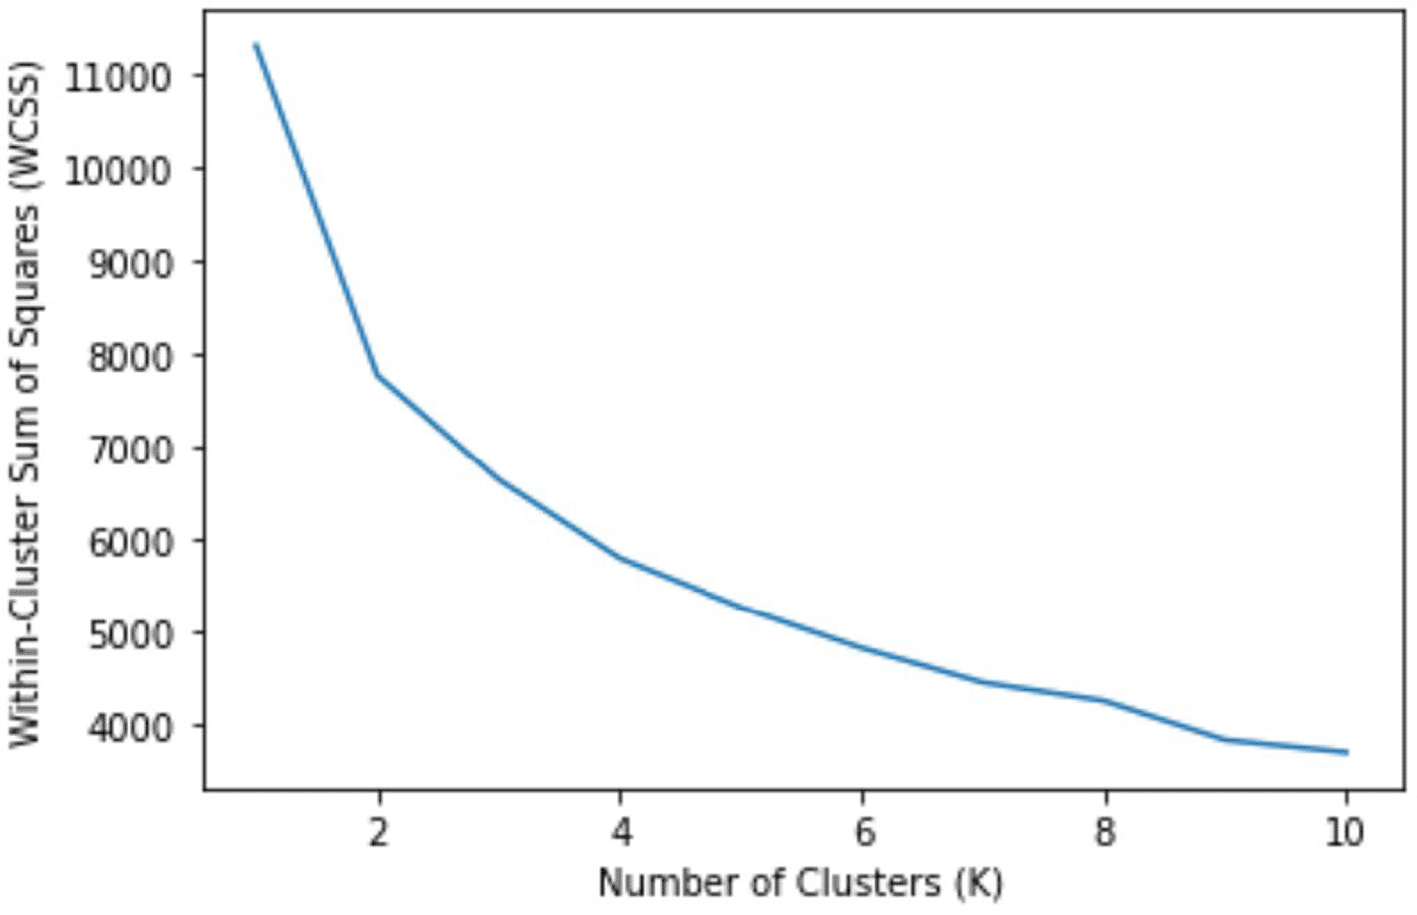
Figure 11. Elbow curve approach to identify the optimal number of clusters (K = 4).
Table 7. The results of testing the trained ML classifier (level of safe speed limit).
| speed limit | precision | recall | f1-score | support |
|---|
| 0
| 1.00 | 1.00 | 1.00 | 139 |
| 1
| 1.00 | 1.00 | 1.00 | 192 |
| 2
| 1.00 | 1.00 | 1.00 | 166 |
| 3
| 1.00 | 1.00 | 1.00 | 226 |
Effectively, generated machine learning model (
Figure 4, right side) will facilitate the real-time prediction of micro-mobility safe speed limit. Therefore, according to the real-time micro-mobility hazards map and other data gathered, this classifier will identify road sections and corresponding safe speed limits. As a result,
Figure 12 shows a screenshot for part of the safe speed limit map generated for the city of Wolverhampton (UK). As mentioned before, this is not empirical findings based on real data but it is based on synthetic data and represents a proof-of-concept demonstration for the speed regulator service.
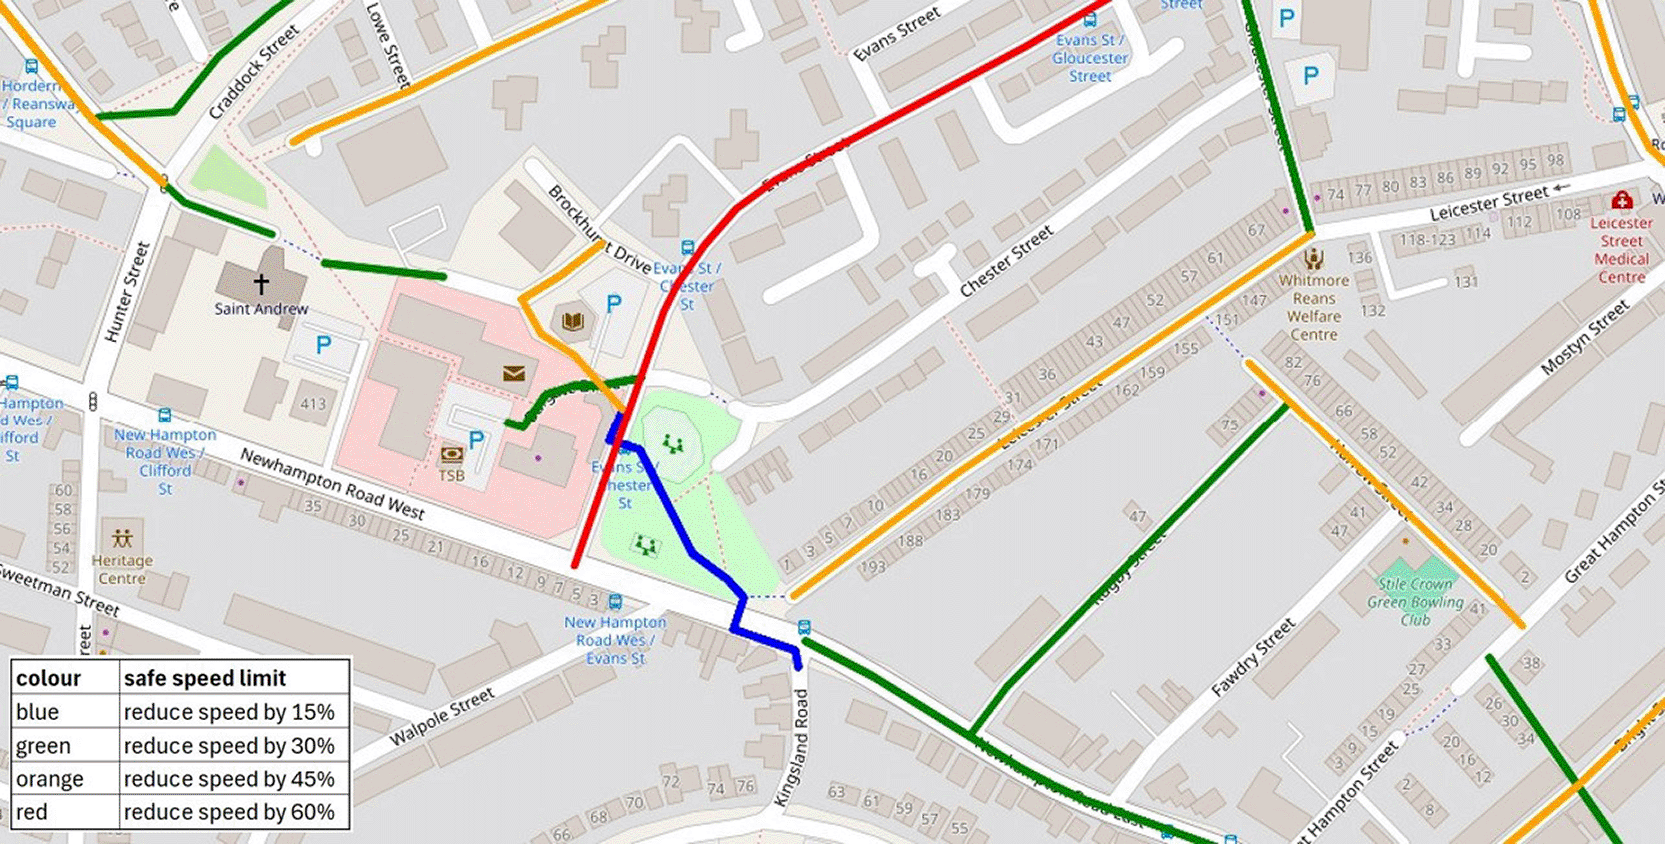
Figure 12. A screenshot from the safe speed map generated for the city of Wolverhampton (UK).
4.4 Protective equipment effectiveness evaluation
The implementation of this micro-mobility safety service merely rely on the data collected by the questionnaire. Collected data is first processed in terms of coding the responses of micro-mobility users to question 5 (i.e., user’s riding behaviour). Therefore, answers of each user to this question will determine the riding behaviour of this user as one of three categories: normal, aggressive, or dangerous. However, the synthetic data generated to represent the responses of micro-mobility users to the questionnaire has the form of data processing and preparation output. Therefore, data analysis and PE effectiveness evaluation process analyses the synthetic data to evaluate the effectiveness of protective equipment. In this context, the phi coefficient (ϕ) correlation and Cramér’s phi have been calculated among selected data variables to understand how these variables affect each other. However, the focus will be only on analysing the relationship type among specific data variables rather than all data variables.
Effectively, the phi coefficient (ϕ) correlation has been calculated between accidents (i.e., all types: crash, fall down, and near miss) and each of the preventive PE (
Figure 13). Additionally, the phi coefficient (ϕ) correlation is calculated between each injury type and the corresponding protective PE (
Figure 14).
Figure 13 shows that there is a relationship between these PE and accidents but the strength of these associations are somehow weak (0.033 < =ϕ < =0.215). It confirms the advantages and usefulness of most preventive PE in reducing accidents and enhancing the safety of micro-mobility. Furthermore,
Figure 14 shows that there is a relationship between injury type and relevant protective PE even though these associations are somehow weak (0.024 < =ϕ < =0.184). Therefore, most of protective PE plays a considerable role in preventing or mitigating the severity of injuries as a result of accidents and this improves the safety of micro-mobility. The Cramér’s V (or Cramér’s phi) has been calculated between user behaviour from one side and other data variables (i.e., accidents, injuries, preventive PE, and protective PE) from the other side (
Figure 15).
Figure 15 (A and B) shows that there is an association (i.e., weak association) between the user behavior from one side and each of experienced accidents (V = 0.167) and sustained injuries (V = 0.194) from the other side. Additionally,
Figure 15 (C and D) shows that there is a negligible association between the user behavior from one side and, the use of preventive PE (V = 0.066) and the use of protective PE (V = 0.025) from the other side. As mentioned previously, these results are not empirical findings based on real data collected from micro-mobility users but they are based on synthetic data and represent a proof-of-concept demonstration for the PE effectiveness evaluator service.
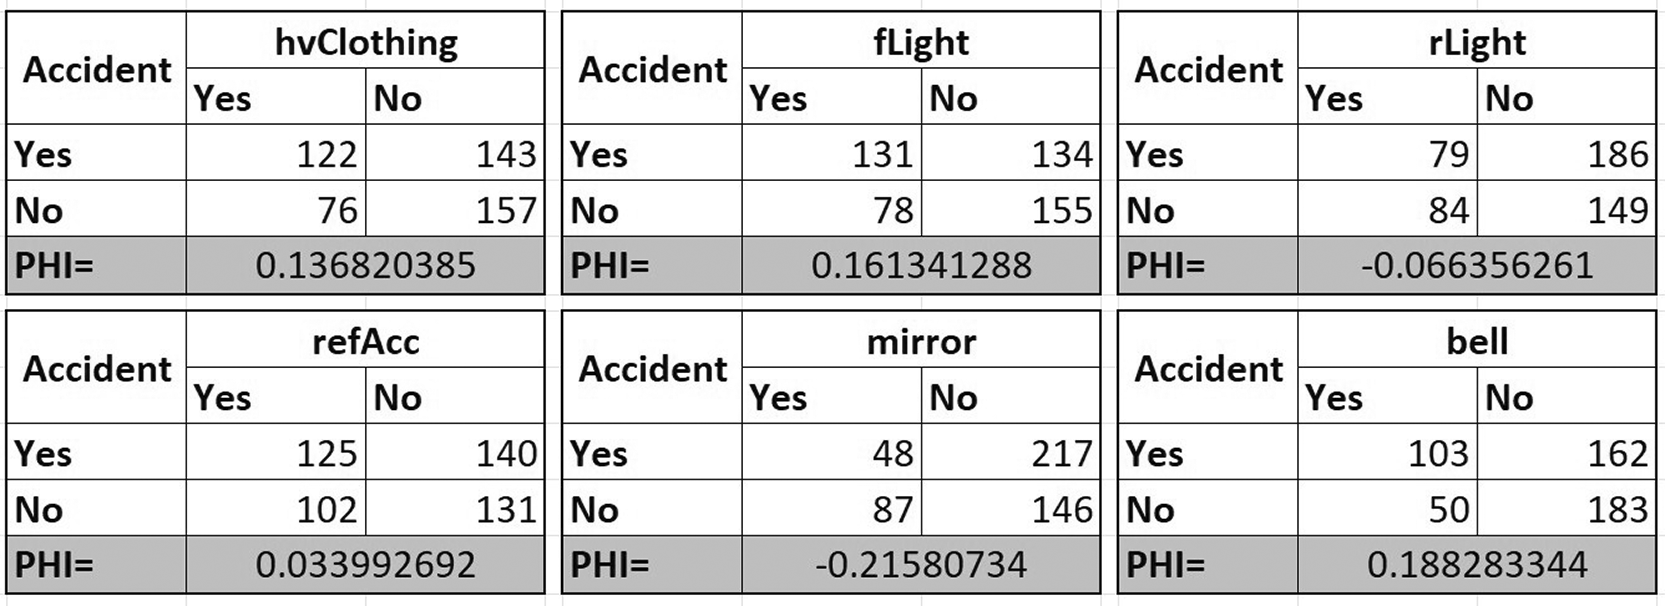
Figure 13. The relationship between accidents and preventive PE type (phi coefficient – ϕ).
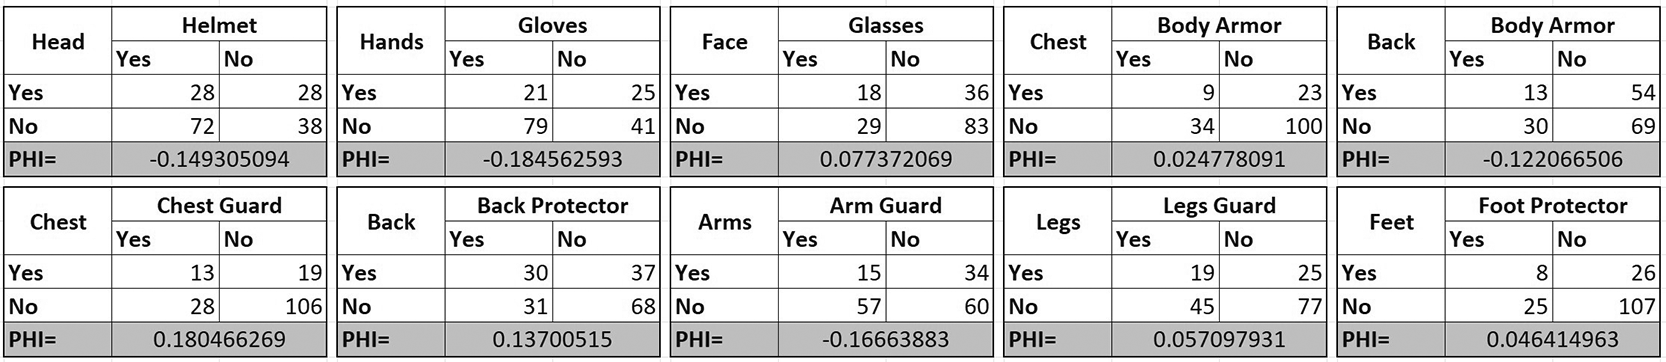
Figure 14. The relationship between injury type and protective PE type (phi coefficient – ϕ).
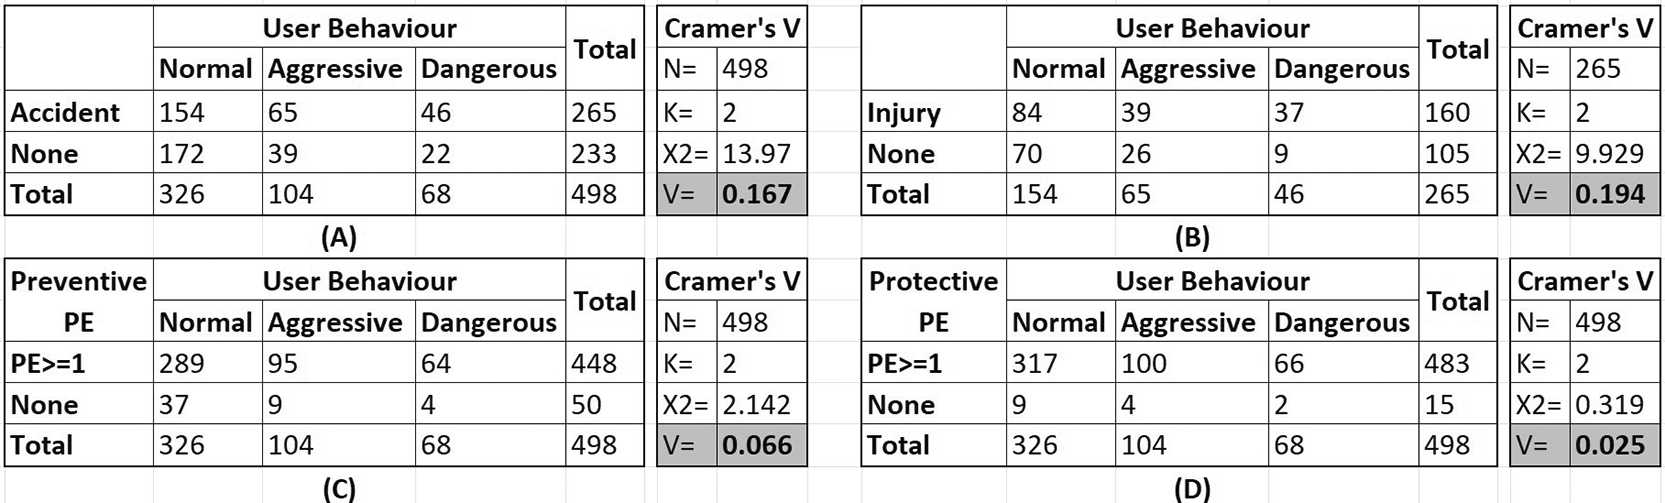
Figure 15. The relationship between user behaviour and, A) accidents, B) injuries, C) preventive PE, and D) protective PE (Cramer’s V).
5. Discussion and future work
Micro-mobility safety including the safety of VRUs is an important and essential factor which may affect the adoption of this mode of transportation nowadays. As mentioned before, this topic has been addressed by many researchers and from different perspectives. In this study, a package of three real-time and data-driven services have been proposed as a micro-mobility safety approach that aim to enhance the safety of micro-mobility. This proposed approach includes the use of a developed sensory kit which can be mounted on micro-vehicles (e.g., bicycles) and used to collect micro-level data about micro-mobility. Additionally, it suggests the use of a developed questionnaire to collect data from micro-mobility users. However, data collection process by using these methods has not been started yet and therefore, there was no real data can be used to test and evaluate the functionalities and performance of this approach and included services. Therefore, some synthetic data has been generated to represent the output of both data collection methods. This synthetic data has been used to test the proposed safety services and provide some results even though for illustrative purposes only since the findings are not actual or empirical results. Effectively, the proposed micro-mobility safety approach involves hazards detector, speed regulator, and protective equipment effectiveness evaluator services. It has been shown that the hazards detector provides a real-time map for micro-mobility hazards which can be actively monitored (i.e., via an integrated mobile application) by users and avoided accordingly. Additionally, the speed regulator provides a real-time map for micro-vehicle safe speed limit which also can be monitored by users to comply with the suggested speed advices. Furthermore, the protective equipment effectiveness evaluator provides a better understanding to micro-mobility users about the impact of using and wearing of PE on avoiding accidents and mitigating injuries. Therefore, the proposed approach represents a comprehensive and effective tool to enhance the safety of micro-mobility through identifying hazardous locations to be avoided, suggesting safe speed limits on road sections to be followed, and enhancing the awareness of micro-mobility users about the benefits and merits of using and wearing protective equipment.
One of the limitations related to this study is the lack of real data which is supposed to be collected by the sensory kit and web-based questionnaire and then used as input to the proposed safety services. Therefore, the future work includes the collection of real input data and the implementation of the proposed approach to get actual results based on real input data. Furthermore, the sensory kit data, the hazards detector output, and the responses of users to the questionnaire may be integrated and incorporated to improve the performance of the PE effectiveness evaluator. Additionally, the output of the developed safety services may be integrated in the future with a dedicated mobile application so real-time hazards map, safe speed limit map, and information about the efficiency of different PE can be shown to micro-mobility users.
6. Conclusion
Micro-mobility safety is very important to achieve the sustainability of this mode of transportation in urban areas. This mode of transportation become increasingly popular but it present unique safety risks that must be managed through various measures and actions including infrastructure improvements and clear regulations enforcement. Key risks related to micro-mobility include falling down, collisions with other road users, and serious injuries as a result of crashes. However, safety measures including speed controlling and helmet wearing may be used to minimise or avoid these risks. In this paper, we presented a real-time data-driven approach for enhancing micro-mobility safety through developing three safety services. The hazards detector service generates a real-time hazards map by detecting five types of hazards with three levels of severity. Moreover, the speed regulator service generates a real-time safe speed limit map by estimating the appropriate safe speeds at the locations of detected hazards. These two safety services mainly rely on the data collected by the sensory kit which is developed and tested for this purpose. Additionally, these services generate a number of machine learning classifiers (i.e., SVM) which are responsible for detecting hazards and estimating safe speed limit. However, the service related to the protective equipment effectiveness evaluation highlights the advantages and impact of using and wearing PE on the safety of micro-mobility users. It mainly considers the responses of micro-mobility users to a web-based questionnaire and uses phi coefficient correlation and Cramer’s V association analysis. However, the real data required for the proposed approach has not been collected yet. Therefore, synthetic data has been generated and used to test the functionalities of the proposed approach and illustrate the expected results. Effectively, examples for the output of the safety services have been provided and illustrated. This proposed approach is comprehensive and covers many micro-mobility safety aspects such as hazards detecting, speed controlling, and PE effectiveness evaluating. Therefore, integrating the output of these services and providing them to the uses may play a great positive impact on the micro-mobility safety.
Ethics and consent
Ethical approval and consent were not required.
Data availability
The data for all the experiments presented in the paper are available via accessible links on the Zenodo platform:
• Synthetic data generated to represent the data collected by the sensory kit, and to be used for testing the functionalities of the hazards detector service, https://doi.org/10.5281/zenodo.18805764 (Almohammad et al., 2026).
• Manually created data, and each entry in this dataset represented all the data types expected from all data sources (i.e., questionnaire, micro-vehicle sensor kit, and micromobility hazard detector), https://doi.org/10.5281/zenodo.17529854 (Almohammad et al., 2025c).
• Synthetic data generated by using Conditional Tabular Generative Adversarial Network (CTGAN) to expand the manually created data, https://doi.org/10.5281/zenodo.17529873 (Almohammad et al., 2025d).
Data are available under the terms of the Creative Commons Attribution 4.0 International license (CC-BY 4.0).
Acknowledgements
This research is part of the Project “SOTERIA” (Systematic and orchestrated deployment of safety solutions in complex urban environments for ageing and vulnerable societies). This project received funding from the European Union’s Horizon 2020 Research and Innovation Programme under grant agreement N° 101077433. This publication only reflects the authors’ view, and the European Union is not liable for any use that may be made of the information contained therein.
References
- Almohammad A, Georgakis P, Renukappa S:
A data-driven approach for micromobility hazards detection and safety enhancement.
Presented at the 2025 International Conference on Electrical, Computer and Energy Technologies (ICECET).
IEEE;
2025a. [in press].
- Almohammad A, Georgakis P, Renukappa S:
A new method for evaluating the effectiveness of micro-mobility protective equipment.
Open Research Europe.
2025b; 5(254): 254. PubMed Abstract
| Publisher Full Text
| Free Full Text
- Almohammad A, Georgakis P, Renukappa S:
Micromobility sensing systems and safety services: a brief review.
Presented at the 2024 IEEE International Humanitarian Technologies Conference (IHTC).
IEEE;
2024; 1–7.
- Almohammad A, Georgakis P, Renukappa S:
Manually created data for evaluating the effectiveness of micromobility protective equipment. [Data set].
Zenodo.
2025c.
- Almohammad A, Georgakis P, Renukappa S:
Synthetic data generated for evaluating the effectiveness of micromobility protective equipment. [Data set].
Zenodo.
2025d.
- Almohammad A, Georgakis P, Renukappa S:
Synthetic data generated to represent sensory kit data and to be used for evaluating the hazards detector service. [Data set].
Zenodo.
2026.
- Billstein L, Svernlov C:
Evaluating the Safety and Performance of Electric Micro-Mobility Vehicles: Comparing E-bike, E-scooter and Segway based on Objective and Subjective Data from a Field Experiment.2021.
- Boufous S, Hatfield J, Grzebieta R:
The impact of environmental factors on cycling speed on shared paths.
Accid. Anal. Prev.
2018; 110: 171–176. PubMed Abstract
| Publisher Full Text
- Ferguson B, Blandino JS:
Shared Micromobility Vehicle Design and Safety.2025.
- Gunawan TS, Azlin AA, Kartiwi M, et al.:
Enhancing Safety of Micro-Mobility and Powered Mobility Devices Using YOLOv12-Based Real-Time Obstacle Detection.
Presented at the 11th International Conference on Smart Instrumentation, Measurement and Applications (ICSIMA).
IEEE;
2025; 80–85.
- Hossein Sabbaghian M, Llopis-Castello D, García A:
A safe infrastructure for micromobility: the current state of knowledge.
Sustainability.
2023; 15(13): 10140. Publisher Full Text
- Hoye AK, Johansson O, Hesjevoll IS:
Safety equipment use and crash involvement among cyclists–Behavioral adaptation, precaution or learning?
Transport. Res. F: Traffic Psychol. Behav.
2020; 72: 117–132. Publisher Full Text
- Inac H:
Micro-mobility sharing system accident case analysis by statistical machine learning algorithms.
Sustainability.
2023; 15(3): 2097. Publisher Full Text
- Kim S, Kim H:
Transformable Helmet Design for Micro-Mobility.
Arch Des Res.
2023; 36(3): 49–65. Publisher Full Text
- Kotsiubynska YZ, Kozan NM, Voloshynovych VM, et al.:
Paediatric trauma related with electric micro-mobility devices.
Probl Forensic Sci.
2023; 133.
- Miah S, Kaparias I, Ayub N, et al.:
Measuring cycle riding comfort in Southampton using an instrumented bicycle.
Presented at the 6th International Conference on Models and Technologies for Intelligent Transportation Systems (MT-ITS).
IEEE;
2019; 1–8.
- Milan P, Fah YF, Feng Z, et al.:
Evaluating the safety of small-wheeled micro-mobility devices: A design-agnostic, performance-based experimental approach.
Transportation Research Interdisciplinary Perspectives.
2025; 31: 101376. Publisher Full Text
- Ozturk EA:
Micromobility Safety.
Presented at the Micromobility: Perspectives from Engineering, Urban Planning, Health Sciences and Social Sciences.
Cham:
Springer Nature Switzerland;
2025; 91–110.
- Qawasmeh B, Oh JS, Kwigizile V:
Micro-Mobility Safety Assessment: Analyzing Factors Influencing the Micro-Mobility Injuries in Michigan by Mining Crash Reports.
Future Transportation.
2024; 4(4): 1580–1601. Publisher Full Text
- Salman OMH;
SAFETY ANALYSIS OF MICRO-MOBILITY: THE CASE OF NABLUS CITY (Doctoral dissertation, Faculty of Graduate Studies SAFETY ANALYSIS OF MICRO-MOBILITY: THE CASE OF NABLUS CITY By Osaid Majed Hamdan Salman Supervisor Prof. Sameer Abu Eisheh This Thesis is Submitted in Partial Fulfillment of the Requirements for the Degree of Master of Roads & Transports Engineering, Faculty of Graduate Studies, An-Najah National University).2024.
- Santacreu A, Yannis G, de Saint Leon O , Crist P:
Safe micromobility.2020.
- Schumann HH, Haitao H, Quddus M:
Passively generated big data for micro-mobility: State-of-the-art and future research directions.
Transp. Res. Part D: Transp. Environ.
2023; 121: 103795. Publisher Full Text
- Tamagusko T, Gomes Correia M, Rita L, et al.:
Data-driven approach for urban micromobility enhancement through safety mapping and intelligent route planning.
Smart Cities.
2023; 6(4): 2035–2056. Publisher Full Text
- Tsami M, Giannakari O, Panou M, et al.:
Development of advanced, safe and sustainable micro-mobility solutions.
Presented at the International Conference on Reliability and Statistics in Transportation and Communication.
Cham:
Springer International Publishing;
2021; 355–362.
- Wallis MJ:
Optimising Urban Mobility and Safety with Micromobility Technologies.2024.
- Yang H, Ma Q, Wang Z, et al.:
Safety of micro-mobility: Analysis of E-Scooter crashes by mining news reports.
Accid. Anal. Prev.
2020; 143: 105608. PubMed Abstract
| Publisher Full Text
- Zhang Y, Nelson JD, Mulley C:
Evidence review on micromobility safety.
Presented at the 44th Australasian Transport Research Forum (ATRF).
2023.







