Introduction
The 21st century is characterised by rapid and pervasive technological advancement, often referred to as the era of the Fourth Industrial Revolution (Schwab, 2017). In this context, digital transformation is no longer just an opportunity, but a strategic necessity for most regions (Hanif et al., 2025) and sectors (Vial, 2019; Caplanova & Szakadatova, 2025). The driving force of this digital transformation is increasingly artificial intelligence (AI), which offers fundamental shifts in data analysis, automation, and decision-making (Kaplan & Haenlein, 2019). The higher education sector is no exception to this trend. Global competition, evolving student expectations, and the drive for efficiency are compelling universities to fundamentally rethink their operational models (Zawacki-Richter et al., 2019; Mohamed Hashim et al., 2022). Institutions that effectively integrate AI-based solutions are positioned to gain a substantial competitive edge, while those that fall behind risk marginalisation (Aithal & Aithal, 2023; Wang et al., 2024).
The potential of artificial intelligence in higher education is extremely diverse and can already be seen in many areas. The domain of learning and teaching processes that is the most frequently researched is the transformation. This includes intelligent tutoring systems that can adjust to students’ individual knowledge levels and learning paces, providing immediate, personalised feedback (Ocaña-Fernández et al., 2019). Adaptive learning environments and learning analytics allow deeper analysis of student performance, early prediction of dropout risks, and improved intervention strategies (Alyahyan & Düştegör, 2020; Jiao et al., 2022; Ouyang et al., 2023). Additionally, AI can transform assessment, such as through automated essay scoring, which helps reduce instructors’ workload (Lim et al., 2021). In general, these advances hold the promise of a more personalised, efficient, and accessible education system (Pelletier et al., 2021).
Although pedagogical applications attract considerable attention, AI can play an equally significant role in the administrative and support functions of higher education institutions. Many administrative processes that support effective institutional operation are well suited for automation, especially through robotic process automation and AI-enhanced workflows (Bhardwaj & Kumar, 2025; Khairullah et al., 2025). Machine learning models can optimise admissions and enrolment by predicting applicants from application data, allowing fairer admission decisions and forecasting course-level enrolments for capacity planning (Jamison, 2017; Shao et al., 2022; Raftopoulos et al., 2024). Additionally, machine learning can also help optimise the allocation of financial aid and scholarships (Phan et al., 2022). AI-driven chatbots and virtual assistants provide always-on support for administrative and academic inquiries, alleviating the workload on support staff (Labadze et al., 2023). Furthermore, AI can optimise institutional resource allocation, such as course scheduling or predicting campus maintenance needs (Hosamo et al., 2022; Diallo & Tudose, 2024). The efficiency gains from these administrative applications are substantial, allowing institutions to better focus resources on core educational and research activities (García Peñalvo, 2024).
Beyond technological barriers, the biggest challenges to AI adoption often arise from organisational and human factors. Many institutions face issues such as inadequate digital infrastructure and high implementation costs (Bond et al., 2024). Additionally, a major problem is the lack of AI skills and digital literacy among both faculty and administrative staff (Ng et al., 2023). Without a clear institutional strategy, appropriate guidelines, and effective training programmes, employees can remain sceptical about new technologies (Khairullah et al., 2025). This scepticism can stem from concerns about the technology’s reliability (Liu, 2025) or fears of job displacement (Lee et al., 2024; Parker, 2024). Therefore, successful implementation requires more than just access to technology; organisational readiness and user acceptance are crucial (Weiner, 2009).
At this point, a notable gap in the existing literature becomes evident. While most research on AI adoption in higher education focuses on the attitudes of students or academic staff, the perspective of administrative (non-academic) staff remains largely unexamined (Zawacki-Richter et al., 2019; Bond et al., 2024). As demonstrated previously, the administrative potential of AI is extensive. However, realising these benefits relies heavily on whether the staff working in these areas are willing to accept and actively adopt these new tools, especially AI. An institution’s operational efficiency may depend on how non-academic staff engage with innovative technologies. Research is lacking that explores which factors encourage or discourage the intention to use AI tools within this specific group, which is critically important for institutional operations.
The study of technology acceptance has depended on established theoretical models for many years. Frameworks such as the Technology Acceptance Model (Davis, 1989) and especially its extended version, the Unified Theory of Acceptance and Use of Technology (Venkatesh et al., 2003, 2012), have proven effective tools for understanding why individuals decide to use or reject specific technologies. Recent studies frequently apply these models to explore the acceptance of AI, particularly generative AI, in higher education (Baig & Yadegaridehkordi, 2024; Nevárez Montes & Elizondo-Garcia, 2025), but as mentioned, their focus is generally limited to students or faculty.
To fill the research gap outlined above, this study aims to investigate the factors influencing the intention to use artificial intelligence among administrative (non-academic) staff in higher education institutions. Building on the theoretical frameworks of technology acceptance (Davis, 1989; Venkatesh et al., 2003, 2012) and organisational readiness (Weiner, 2009), this research explores how factors such as digital readiness, AI readiness, facilitating conditions, ease of use, and usefulness contribute to the intention to use AI tools among administrative staff within a Hungarian higher education institution. The research aims to identify the key drivers that institutional leaders can use when developing a successful AI implementation strategy.
To investigate these relationships, this study employs a quantitative methodology. Data were gathered through a survey administered to employees of a Hungarian higher education institution, resulting in a valid sample of 213 respondents. The data collected was subsequently analysed using PLS-SEM. This approach is particularly well-suited for assessing the complex theoretical framework, allowing for the simultaneous examination of both direct and indirect relationships between the constructs.
The empirical analysis highlights several crucial findings. The results demonstrate that the intention to use AI is most powerfully and directly influenced by facilitating conditions and perceived usefulness. This indicates that university employees’ intentions are primarily driven by the perceived utility of AI in their work and the availability of organisational support, infrastructure, and resources necessary for its use.
In contrast, and surprisingly, the research finds that neither digital readiness nor ai readiness exerts a significant direct effect on AI Use Intention. Instead, their influence is identified as an upstream and indirect mechanism. The analysis confirms that digital readiness has a positive indirect effect on the intention to use AI via AI readiness and AI usefulness. This suggests that while personal readiness is not the final determinant of intention to use, it is an essential prerequisite. They operate by shaping the user’s core belief about whether AI is beneficial, and it is this perception of usefulness that activates the intention to use AI.
This paper is structured as follows: first, the theoretical foundation is established by reviewing the literature on the core dimensions of the study, which leads to the development of our hypotheses. Following this, the methodology is introduced, detailing the data collection process, sample characteristics, and specific measures. The results of our analysis are then presented and subsequently compared with previous research findings. Finally, the paper concludes by addressing the research limitations and summarising its main implications and contributions.
Theoretical foundation and hypotheses development
Digital readiness and AI readiness
Digital readiness can be defined as an organisational state in which the technological infrastructure, digital competencies, data management capabilities, and strategic objectives are aligned to support the adoption and effective use of new technologies. It constitutes a critical prerequisite for digital transformation, as it determines the extent to which organisations can respond to rapid technological change and exploit emerging opportunities (Vial, 2019). Beyond this alignment at the organisation level, digital readiness is a multilevel, multidimensional condition. The dimension of technological resources explicitly spans infrastructure and data tools as well as cloud, IoT, robotics, artificial intelligence, and machine learning, offering a bridge to AI readiness. (Michelotto & Joia, 2024). At the individual level, digital readiness captures the’ knowledge, skills, attitudes and competencies related to technology of users required for effective use of technology. In practice, this combination of knowledge, resources, and perceived control constitutes the proximal enabling conditions that directly support technology adoption (Kim et al., 2019).
AI readiness is commonly framed as the multidimensional extension of AI-specific digital maturity, emphasising an organisation’s capabilities to deploy and use AI. Beyond possessing appropriate technologies, it requires activities that embed AI into daily work, as well as clear organisational boundaries for data management and goal alignment to steer AI toward measurable outcomes (Holmström, 2022). From a resource-based perspective, AI readiness through the development of AI capability where technological artifacts are necessary but insufficient without complementary human and organisational resources such as skills and data governance (Mikalef & Gupta, 2021). This positions digital readiness as a proximal antecedent of AI readiness, because the latter depends on data quality and availability, robust infrastructure, and process maturity that are typically cultivated within broader digital transformation programmes (Mikalef & Gupta, 2021; Holmström, 2022). Empirical evidence underscores this dependency. Organisational AI readiness is conditioned by IT infrastructure, data management and protection practices, financial resources, and firm size. These factors mirror core elements of digital readiness (Hradecky et al., 2022). Systematic reviews similarly identify recurrent enablers of AI readiness. IT infrastructure, resource availability, compatibility, data quality, and budget overlap with digital readiness. (Jöhnk et al., 2021; Akbarighatar, 2022; W. Ali & Khan, 2025). Organizations progress by coupling hands-on experimentation with AI, peer learning, and the formalization of governance, which collectively build realistic expectations and sustained adoption reinforcing that readiness grows on top of existing digital capacities (Übellacker, 2025).
In sum, the literature consistently highlights digital readiness as a foundational building block of AI readiness. Modern infrastructure, advanced data management practices, and strategic technological alignment not only enable the integration of AI, but also enhance its effectiveness and value creation (Vial, 2019; Mikalef & Gupta, 2021; Hradecky et al., 2022; Holmström, 2022).
H1:
Digital readiness has a positive effect on AI readiness.
Facilitating conditions
Facilitating conditions can be defined as the perceived availability of organisational and technical resources and support that enable effective system use. In the Unified Theory of Acceptance and Use of Technology (UTAUT), the construct captures whether users perceive sufficient infrastructure, assistance, and organisational arrangements to remove practical barriers to adoption and continued use (Venkatesh et al., 2003, 2012).
Technology readiness functions as an upstream antecedent of facilitating conditions. By aligning technological infrastructure, data management capabilities, human competencies and governance mechanisms, such readiness materialises as service and system qualities that users recognise as the very conditions that facilitate use (Bharadwaj, 2000; DeLone & McLean, 2003). Flexible and well-integrated IT infrastructures generate reliable access and interoperability (Byrd & Turner, 2001). Investments in skills and support translate into timely assistance and effective training, while leadership commitment and formal support arrangements provide clarity and sustained resourcing (DeLone & McLean, 2003; Weiner, 2009). Integration of technology and organisational readiness further enable assimilation (Zhu et al., 2006). Together, these elements strengthen the perceived organisational and technical support for everyday work, thereby increasing facilitating conditions.
In the context of AI, this linkage becomes particularly salient. Successful deployment requires big data pipelines and computing power. It also requires integration with existing systems, clear governance and policies, and ongoing training and support. Organizations with higher digital readiness are more likely to provide these supports. Users then experience them as facilitating conditions for AI: stable access, interoperability, guidance, and responsive assistance (Jain et al., 2022; Ali & Khan, 2025).
H2:
Digital readiness has a positive effect on AI facilitating conditions.
Perceived ease of use and perceived usefulness
Perceived ease of use refers to the degree to which a person believes that using a system would be free of effort. It is one of the core constructs in the Technology Acceptance Model (TAM) and a predictor of usage intentions (Davis, 1989). In the UTAUT effort expectancy is an equivalent construct that captures the same underlying belief that the system is easy to operate (Venkatesh et al., 2003, 2012).
Perceived usefulness is the degree to which a person believes that using a system will improve their job performance. In TAM, perceived usefulness is the strongest direct predictor of behavioural intention (Davis, 1989). In UTAUT, the counterpart is performance expectancy, which predicts intention across settings (Venkatesh et al., 2003, 2012).
Empirical studies show that the perceived ease of use and perceived usefulness constructs are highly sensitive to contextual enablers such as seamless access to resources and data, and a supportive organisational environment. In studies, behavioural intention is shaped by these factors. When a system appears less effortful to operate, people are more willing to try and continue using it (Hung et al., 2003; Lu et al., 2008). Design that fosters a sense of control, enjoying the task and deep involvement raises both perceived ease of use and perceived usefulness. It does this by lowering mental effort and making the system easier to learn (Agarwal & Karahanna, 2000). Consequently, these mechanisms are technology-agnostic and apply when the focal technology is artificial intelligence.
Digital readiness means reliable infrastructure, accessible data, basic digital skills, and visible user support. Two proximal antecedents drive perceived ease of use: perceptions of external control and computer self-efficacy (Venkatesh & Bala, 2008). Readiness strengthens both. Available resources and help desks raise perceived control. Training and prior experience build self-efficacy. Evidence supports this path. Studies that combine technology readiness with acceptance models report a positive link between readiness and perceived ease of use (Walczuch et al., 2007; Blut & Wang, 2020). Capability studies also find that higher digital competence relates to easier perceived operation and stronger acceptance in educational and work settings (Antonietti et al., 2022; Scheel et al., 2022). Digital readiness should also raise perceived usefulness because it manifests in higher system and information quality and better task-technology fit. These are antecedents that are known to increase usefulness perceptions (Goodhue & Thompson, 1995; DeLone & McLean, 2003; Wixom & Todd, 2005). In parallel, digital transformation research shows that such capabilities translate into observable performance gains (Vial, 2019). Applied to AI, digital readiness should make AI tools easier to use and more beneficial for task performance. Therefore, expect positive effects on AI ease of use and AI usefulness.
H3:
Digital readiness has a positive effect on AI ease of use.
H4:
Digital readiness has a positive effect on AI usefulness.
AI readiness describes the AI-specific conditions that make AI workable in everyday tasks. It includes data pipelines and data quality, suitable tools, integration with existing systems, governance and policies, user skills and training (Jöhnk et al., 2021; Holmström, 2022; Uren & Edwards, 2023). When these conditions are present, users face fewer obstacles during interaction. They have clearer access to data, more stable features, and visible support.
Empirical studies in AI contexts also show that effort expectancy consistently predicts acceptance, indicating that lowering effort matters for AI tools as well (Kelly et al., 2023). AI readiness should increase AI ease of use by minimizing barriers to interaction and reinforcing the beliefs that users can operate AI systems without excessive effort (Jöhnk et al., 2021; Holmström, 2022). AI readiness should also increase AI usefulness. Better data, integration and governance improve the quality of the system and information and improve the fit of the task-technology. These attributes are known to increase perceived usefulness in the context of information systems (Wixom & Todd, 2005). In addition, firms with stronger AI capability report higher performance, reinforcing user beliefs that AI improves job outcomes (Mikalef & Gupta, 2021; Uren & Edwards, 2023). AI readiness creates the technical and organisational conditions that make AI both easier to use and more beneficial for performance, that make AI both easier to use and more beneficial for performance.
H5:
AI readiness has a positive effect on AI ease of use.
H6:
AI readiness has a positive effect on AI usefulness.
Facilitating conditions are the perceived technical and organisational supports that make system use possible, such as infrastructure, compatibility, training, help desks, and clear guidance (Venkatesh et al., 2003, 2012). These supports strengthen perceived external control and self-efficacy, two validated antecedents of perceived ease of use (Venkatesh & Bala, 2008). In AI settings, reviews and meta-analyses consistently show that training, technical support, and workflow integration result in lower effort barriers and increased acceptance (Lambert et al., 2023; Dingel et al., 2024; Hassan et al., 2024). The same conditions also bolster perceived usefulness by improving system and information quality and enabling a better task–technology fit, which are established antecedents of usefulness in information systems research (Goodhue & Thompson, 1995; DeLone & McLean, 2003; Wixom & Todd, 2005). Sector-specific AI reviews further link strong support structures and integration to clearer performance benefits, and work on AI capability ties well-resourced AI deployments to higher organisational performance, reinforcing perceived ease of use and perceived usefulness (Mikalef & Gupta, 2021; Neumann et al., 2024; Roppelt et al., 2024).
H7:
AI facilitating conditions has a positive effect on AI ease of use.
H8:
AI facilitating conditions has a positive effect on AI usefulness.
AI use intention
Use intention (or behavioural intention to use) captures a user’s motivational readiness to engage with a system and is the most proximal predictor of subsequent use in TAM and UTAUT (Davis, 1989; Venkatesh et al., 2003, 2012). Based on the Theory of Planned Behaviour, intention reflects a person’s conscious plan and perceived effort to perform the behaviour, integrating the main beliefs into a single indicator of the likelihood of enactment within a given time frame (Ajzen, 1991). In information systems research, meta-analyses show that intention reliably explains substantial variance in actual usage across technologies and settings, reinforcing its role as the primary criterion variable in acceptance studies (King & He, 2006; Schepers & Wetzels, 2007).
Readiness shapes intention directly. At the general level, higher digital readiness, including skills, confidence, and access to digital tools, shows a positive association with intention to use generative AI at work (Weritz et al., 2024). At the AI-specific level, AI readiness also strengthens behavioural intention. Recent evidence with university teachers finds AI readiness acts as a mediator and increases intention to adopt AI (Liu, 2025). These findings are consistent with meta-analytic results on the adjacent construct of technology readiness, which reliably predicts technology use intention and partly operates through acceptance beliefs (Blut & Wang, 2020). Based on these studies, digital readiness and AI readiness have a positive effect on AI use intention.
H9:
Digital readiness has a positive effect on AI use intention.
H10:
AI readiness has a positive effect on AI use intention.
Facilitating conditions increase intention when users perceive adequate training, responsive technical support, and integration with existing workflows and infrastructure. While UTAUT originally positioned facilitating conditions primarily as a determinant of use behaviour, UTAUT2 identifies a direct path to intention in consumer settings (Venkatesh et al., 2012). At AI-specific studies in healthcare show that facilitating conditions are positively associated with clinicians’ intention to use AI systems, consistent with the idea that facilitating conditions lower barriers before first use (Lambert et al., 2023; Dingel et al., 2024).
H11:
AI facilitating conditions has a positive effect on AI use intention.
The core acceptance beliefs remain central. Decades of meta-analytic evidence demonstrate that perceived usefulness and perceived ease of use are cross-context predictors of intention, with usefulness typically exerting the stronger influence, a pattern consistently replicated across technologies (King & He, 2006; Schepers & Wetzels, 2007; Marikyan et al., 2023). In AI contexts, recent studies corroborate that effort expectancy (ease of use) and performance expectancy (usefulness) are significant predictors of behavioural intention. These effects hold across domains such as healthcare and education, as well as other sectors. Usefulness generally shows the larger direct effect and ease of use contributing both directly and indirectly via usefulness (Dingel et al., 2024; I. Ali et al., 2025). Accordingly, higher perceived ease of use and perceived usefulness are expected to increase AI use intention.
H12:
AI ease of use has a positive effect on AI use intention.
H13:
AI usefulness has a positive effect on AI use intention.
Summary of direct effect hypotheses
The above-mentioned hypotheses can be summarized in
Table 1. The conceptual model with hypotheses is illustrated on
Figure 1.
Table 1. Summary of direct hypotheses.
| Code |
Hypothesis |
|---|
| H1 | Digital readiness has a positive effect on AI readiness. |
| H2 | Digital readiness has a positive effect on AI facilitating conditions. |
| H3 | Digital readiness has a positive effect on AI ease of use. |
| H4 | Digital readiness has a positive effect on AI usefulness. |
| H5 | AI readiness has a positive effect on AI ease of use. |
| H6 | AI readiness has a positive effect on AI usefulness. |
| H7 | AI facilitating conditions has a positive effect on AI ease of use. |
| H8 | AI facilitating conditions has a positive effect on AI usefulness. |
| H9 | Digital readiness has a positive effect on AI use intention. |
| H10 | AI readiness has a positive effect on AI use intention. |
| H11 | AI facilitating conditions has a positive effect on AI use intention. |
| H12 | AI ease of use has a positive effect on AI use intention. |
| H13 | AI usefulness has a positive effect on AI use intention. |
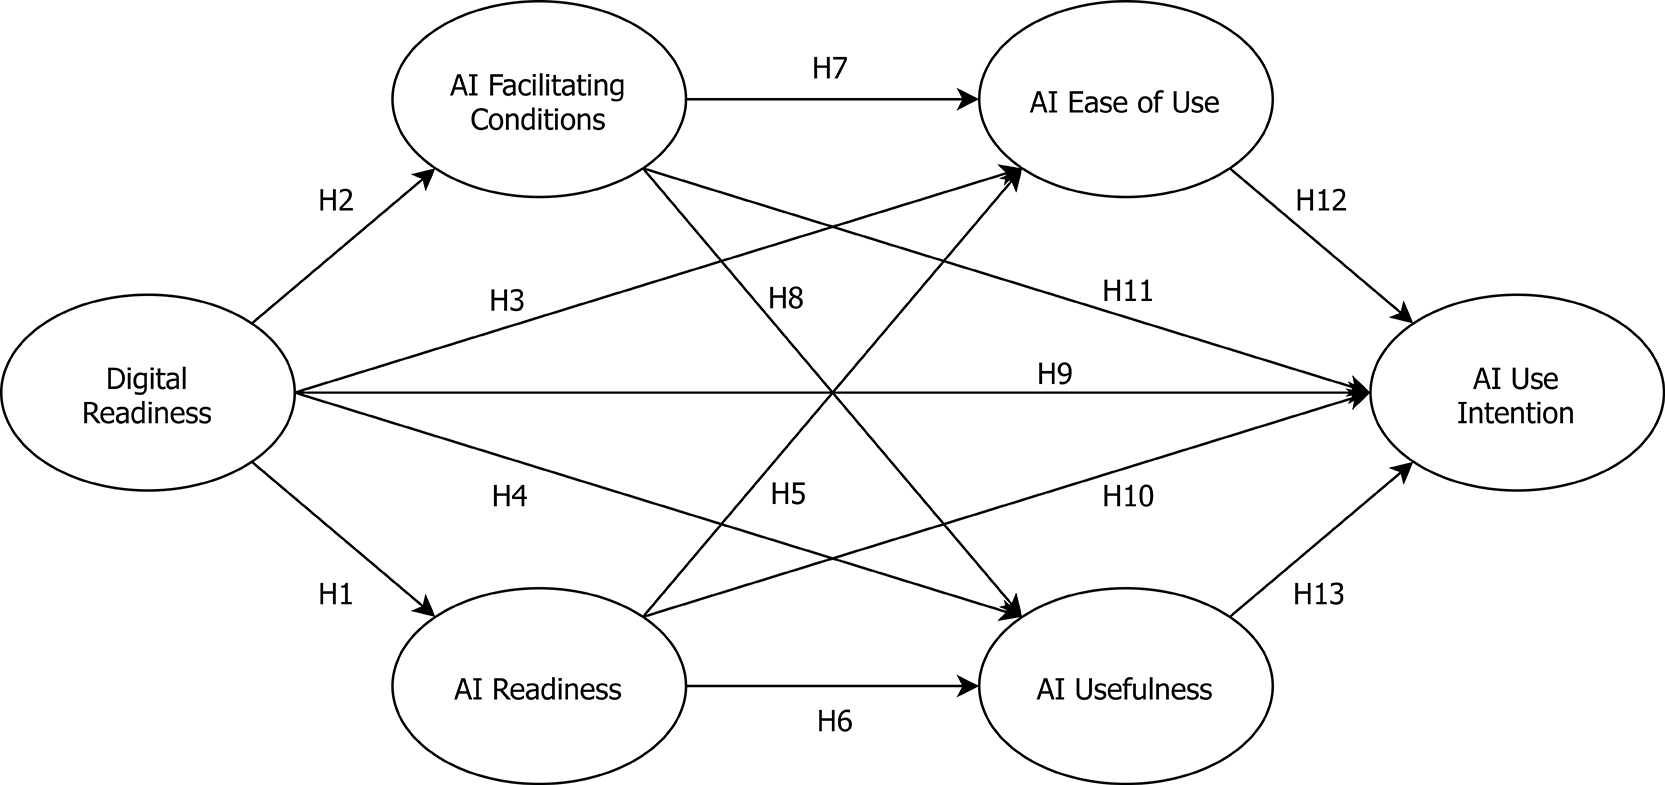
Figure 1. Research model.
Within the model, digital readiness and AI readiness are understood as individual-level endowments (capabilities accumulated in the past and expressed in the present) while facilitating conditions represent organisational-level endowments.
Ease of use and usefulness are viewed as prospective, forward-looking beliefs that collectively influence future behavioural intentions. Consequently, the theoretical framework follows a temporal logic, progressing from evaluations of past and present endowments to prospective intentions, which shape the model’s structure.
Summary of indirect effect hypotheses
Building on the research model and the existing literature, we hypothesise not only direct effects but also significant indirect (mediated) relationships among the focal constructs. The aim of the mediation analysis is to clarify the mechanisms and pathways through which the independent variables influence the dependent outcome via one or more mediating constructs. The specific indirect effects examined in this study, along with their corresponding mediation hypotheses, are summarised in
Table 2.
Table 2. Summary of indirect hypotheses.
| Code | Hypothesis |
|---|
| H14 | Digital readiness has a positive indirect effect on AI ease of use via AI readiness. |
| H15 | Digital readiness has a positive indirect effect on AI usefulness via AI readiness. |
| H16 | Digital readiness has a positive indirect effect on AI use intention via AI readiness. |
| H17 | Digital readiness has a positive indirect effect on AI ease of use via AI facilitating conditions. |
| H18 | Digital readiness has a positive indirect effect on AI usefulness via AI facilitating conditions. |
| H19 | Digital readiness has a positive indirect effect on AI use intention via AI facilitating conditions. |
| H20 | Digital readiness has a positive indirect effect on AI use intention via AI ease of use. |
| H21 | Digital readiness has a positive indirect effect on AI use intention via AI usefulness. |
| H22 | AI readiness has a positive indirect effect on AI use intention via AI ease of use. |
| H23 | AI readiness has a positive indirect effect on AI use intention via AI usefulness. |
| H24 | AI facilitating conditions have a positive indirect effect on AI use intention via AI ease of use. |
| H25 | AI facilitating conditions have a positive indirect effect on AI use intention via AI usefulness. |
| H26 | Digital readiness has a positive sequential indirect effect on AI use intention via AI facilitating conditions and AI usefulness. |
| H27 | Digital readiness has a positive sequential indirect effect on AI use intention via AI readiness and AI usefulness. |
| H28 | Digital readiness has a positive sequential indirect effect on AI use intention via AI facilitating conditions and AI ease of use. |
| H29 | Digital readiness has a positive sequential indirect effect on AI use intention via AI readiness and AI ease of use. |
Methodology
We conducted a quantitative online survey to examine participants readiness for AI. The data collection was carried out among administrative (non-academic) staff members of a Hungarian higher education institution. The target population consisted of employees performing various administrative tasks within the university’s organisational units. A total of 306 staff members were invited to participate in the online survey, 213 completed the questionnaire, resulting in a response rate of 70%. The aim of the study was to explore the connection between digital readiness, AI readiness and facilitating conditions, perceived ease of use, perceived usefulness as well as their impact on the use intention of AI. The self-completed questionnaire method enabled us to reach many respondents in a relatively short time (Marcano Belisario et al., 2015; Regmi et al., 2016). The questionnaire was based on previous studies and relevant literature. The statements evaluated by the participants were based on earlier research and the validated scales were adapted from several internationally recognized studies.
All constructs were measured on a five-point Likert scale (1 = strongly disagree, 5 = strongly agree) with an additional option (0 = do not know) explicitly defined as “has not encountered the situation and therefore cannot form a relevant opinion”. Based on a pilot survey, the inclusion and treatment of the (0 = do not know) option were specified a priori. Respondents inclined to select this option consistently reported no exposure to the target situations and, in many cases, such limited familiarity or competence that they could not meaningfully judge how low their capability actually was. Cognitive non-responses indicated a lack of relevant knowledge, experience, or skill, rather than uncertainty or hidden attitudes (Kalton & Schuman, 1982; Krosnick et al., 2002). Empirically, “do not know” answers are systematically associated with lower knowledge levels (Jessee, 2017). Accordingly, we recoded (0 = do not know) to the lowest ordinal category (1 = strongly disagree). For readiness-type scales, empirical evidence shows that coding “do not know” to the lowest scale level preserves score variance and avoids systematically excluding lower-readiness groups by recognizing that such responses reflect the lowest preparedness state (Lombardi et al., 2011). This coding reduces case loss and preserves the ordinal meaning of the indicators (Denman et al., 2018), and it aligns with established practice that places do not know on the non-affirmative end of Likert-type items (de Figueiredo et al., 2023).
To test the hypotheses, we estimated a Partial Least Squares Structural Equation Model (PLS-SEM) in SmartPLS 4. PLS-SEM is well-suited for early-stage theory building and prediction-oriented research, particularly with non-normally distributed Likert indicators (Sarstedt et al., 2014; Rigdon, 2016). In line with prior work that develops integrative behavioural models using PLS-SEM (Esfandiar et al., 2019; Eisinger Balassa et al., 2024), our study seeks to establish a theoretical framework explaining the relationships among the above-mentioned constructs.
To ensure clarity and shared understanding among participants, the questionnaire began with an operational definition of the main phenomenon. Artificial intelligence was described as digital systems capable of performing tasks similar to human thinking, such as text generation, translation, summarisation, data analysis, or decision support.
Digital readiness & AI readiness
Digital readiness & AI readiness were assessed using a validated higher education digital readiness scale and adapted to the AI domain by rewording items to reference AI tools and contexts while preserving the original multidimensional structure (Kim et al., 2019). Items reflected confidence in learning and applying new AI tools in work tasks. This adaptation approach maintains construct comparability with the original scale while ensuring domain specificity for AI.
AI facilitating conditions
Facilitating conditions were measured with established items from the technology acceptance models that capture the availability of organisational and technical infrastructure, resource support, and compatibility with existing practices (Venkatesh et al., 2003, 2012). To ensure domain specificity, we adapted to the AI context, while preserving the constructs’ conceptual meaning and the original response format.
AI perceived ease of use & AI perceived usefulness
Perceived ease of use and perceived usefulness were measured using TAM-based items (Davis, 1989; Agarwal & Karahanna, 2000) drawn from two 5G adoption studies (Hung et al., 2003; Lu et al., 2008). Items were adapted to the AI context while retaining their original semantics and response format. Perceived ease of use captures the extent to which interacting with AI tools is perceived as effortless, whereas perceived usefulness captures the degree to which AI use is expected to enhance task performance and effectiveness.
AI use intention
AI use intention was measured with established items from the technology acceptance literature (Venkatesh et al., 2012). Items were adapted to the AI context while retaining their original semantics and response format. The scale captures planned, regular, and continued use of AI and is aligned with UTAUT formulations of behavioural intention.
Control variables
Control variables included gender (Venkatesh et al., 2000) and age (Staddon, 2020), given their frequent links to technology adoption. We also used a control variable for educational attainment (Riddell & Song, 2017) and work experience (Sun et al., 2020), because human capital differences can shape access to and comfort with, new technologies. These controls help isolate the focal relationships from demographic and career-stage effects.
Sample demographics
Table 3 presents the demographic characteristics of the respondents who participated in the survey. The sample consists of 213 administrative employees from various organisational units of the university. In terms of gender distribution, 70.89% of the respondents were female, while 29.11% were male, reflecting the gender distribution within the institution’s administrative staff, which aligns with the female predominance typically observed within higher education administrative environments (Advance HE, 2024).
Table 3. Demographic profile.
| Demographic variables | Categories | Frequency |
Ratio (%) |
|---|
| Gender | Male | 62 | 29,11% |
| Female | 151 | 70.89% |
| Age | 18–27 years old | 51 | 23,94% |
| 28–37 years old | 43 | 20.19% |
| 38–47 years old | 69 | 32,39% |
| 48–57 years old | 43 | 20.19% |
| ≥ 58 years old | 7 | 3,29% |
| Educational attainment | Secondary school leaving certificate | 38 | 17,84% |
| Bachelor’s degree | 93 | 43,66% |
| Master’s degree | 77 | 36,15% |
| Doctoral degree | 5 | 2,35% |
| Function areas | Academic and Student Affairs | 52 | 24,41% |
| Finance, Accounting and Human Resources | 38 | 17,84% |
| Institutional Governance and Compliance | 35 | 16,43% |
| IT Infrastructure and Development | 23 | 10.80% |
| Marketing, Communication and Community Engagement | 25 | 11,74% |
| Research, Innovation and External Partnerships | 40 | 18,78% |
| Work experience | < 1 year | 10 | 4,70% |
| 1–3 years | 32 | 15,02% |
| 4–9 years | 37 | 17,37% |
| 10–15 years | 31 | 14,55% |
| 16–20 years | 27 | 12,68% |
| ≥ 20 years | 76 | 35,68% |
Regarding educational attainment, most respondents have at least a bachelor’s degree (43.66%) or a master’s degree (36.15%), while 17.84% completed secondary education and 2.35% hold a doctoral qualification. This educational composition reflects the high academic and professional standards expected within university administration.
The distribution among function areas demonstrates broad institutional representation. Academic and Student Affairs (24.41%), including roles in academic administration, student services, and doctoral management. Finance, Accounting and Human Resources (17.84%), encompassing financial management, payroll, and HR operations. Institutional Governance and Compliance (16.43%), covering legal affairs, quality assurance, and strategic monitoring functions. IT Infrastructure and Development (10.80%), responsible for maintaining and developing digital systems and technical facilities. Marketing, Communication and Community Engagement (11.74%), focusing on institutional branding, media relations, and event management. Research, Innovation and External Partnerships (18.78%), which includes project management, research support, and industrial collaboration offices.
Finally, in terms of work experience, the respondents represent a balanced mix of early-career and experienced professionals: 35.68% have over 20 years of experience, while 31.92% fall within the 4–15 years range, and 19.72% have less than 3 years of experience in administrative roles. This diversity ensures that the findings capture both long term institutional knowledge and emerging competencies among newer employees.
In general, the demographic composition provides a comprehensive and representative overview of the university administrative staff, strengthening the validity and generalisability of the research results across different organisational functions.
Results
Descriptive statistics
We first report descriptive statistics to provide context for baseline levels before analysing the measurement and structural models.
Table 4 summarises the means and average standard deviations for each construct. Construct means are calculated as the average of the item means, and the average standard deviations are calculated as the average of the item-level standard deviations within each construct.
Table 4. Construct means and average standard deviations.
| Construct | Avg. Mean (M) | Avg. Std. dev. (SD) |
N |
|---|
| AIEU
| 3.878 | 1.221 | 213 |
| AIFC
| 3.522 | 1.410 | 213 |
| AIRE
| 3.212 | 1.403 | 213 |
| AIUF
| 3.653 | 1.419 | 213 |
| AIUI
| 3.648 | 1.392 | 213 |
| DIRE
| 4.418 | 0.792 | 213 |
The descriptive statistics for all items appear in Extended data (descriptives.docx, Aschenbrenner & Szabó, 2026).
Overall, construct means are above the scale midpoint. At the construct level, digital readiness was highest (M = 4.418, SD = 0.792), while AI readiness was lowest (M = 3.212, SD = 1.403). Perceived ease of use (M = 3.878, SD = 1.221) and usefulness (M = 3.653, SD = 1.419) were moderate-to-positive. Facilitating conditions were similarly moderate (M = 3.522, SD = 1.410), and AI use intention was moderate (M = 3.648, SD = 1.392).
Item medians and modes were mainly 4–5, with most indicators showing negative skewness, suggesting a tendency towards positive responses. Due to the ordinal scale and slight non-normality, we used PLS-SEM with bootstrapping for model estimation and significance testing.
Common method bias
All measures were collected from a single self-report survey at one point in time. Therefore, we assessed potential common method bias (CMB) (
Table 5). Variance inflation factor (VIF) quantifies how much the variance of an estimated coefficient is inflated by linear dependencies among predictors. We conducted a full collinearity assessment in SmartPLS 4 by regressing each latent construct on the remaining constructs. Under this approach, VIF values at or below the conservative threshold (VIF ≤ 3.3) indicate that neither lateral collinearity nor a single-source method factor threatens the estimates (Kock, 2015).
Table 5. Analysis of full collinearity.
| Construct | AIEU | AIFC | AIRE | AIUF | AIUI | DIRE |
|---|
| AIEU
| | 2.218 | 2.428 | 2.064 | 2.357 | 2.319 |
| AIFC
| 1.890 | | 1.632 | 2.002 | 1.942 | 2.025 |
| AIRE
| 2.287 | 1.788 | | 2.096 | 2.216 | 2.292 |
| AIUF
| 2.420 | 2.795 | 2.651 | | 2.057 | 2.753 |
| AIUI
| 2.170 | 2.100 | 2.171 | 1.578 | | 2.063 |
| DIRE
| 1.078 | 1.203 | 1.203 | 1.216 | 1.191 | |
In our sample, full collinearity values (VIF ≤ 2.795) were below the conservative criterion. Each latent construct individually satisfied this criterion, indicating no evidence of lateral collinearity or single-source method bias. Taken together, these results suggest that CMB is not a serious concern in this study.
Validity and credibility
Cronbach’s alpha (α) indexes internal consistency among a set of reflective indicators and is often reported as a conservative lower bound of reliability. Because α assumes tau-equivalence, it can underestimate reliability in congeneric measures and should be interpreted alongside alternative coefficients in PLS-SEM. As heuristic thresholds, (α ≥ 0.70) indicates acceptable reliability, with (α ≈ 0.80–0.90) typically regarded as good, while very high values (α ≥ 0.95) may flag redundant items or straight-lining. Accordingly, we report α as a descriptive lower bound and place greater weight on composite reliability in line with current guidance (Sijtsma, 2009; McNeish, 2018; Hair, Hult, Ringle, Sarstedt, et al., 2021b).
Composite reliability (ρc) evaluates the reliability of a latent construct under a congeneric model and is preferred in variance-based SEM because it does not impose the tau-equivalence constraint inherent in α. Composite reliability values of (ρc ≈ 0.70–0.95) indicate satisfactory internal consistency; values below (ρc
0.70) suggest insufficient reliability, whereas values (ρc ≥ 0.95) can signal overly similar items and inflated shared error. We therefore emphasize composite reliability as the primary reliability criterion for reflective constructs in PLS-SEM (Raykov, 1997; Hair et al., 2019; Hair, Hult, Ringle, Sarstedt, et al., 2021b).
The average variance extracted (AVE) index represents the average proportion of indicator variance captured by the latent construct and is the standard convergent-validity diagnostic for reflective measures. The conventional benchmark is (AVE ≥ 0.50), indicating that a construct explains at least half of its indicators’ variance; in rare cases, slightly below (AVE
0.50) may still be tolerated when composite reliability is adequate (ρc ≥ 0.60), but the preferred target remains (AVE ≥ 0.50) (Pervan et al., 2018; Cheung et al., 2024) (
Table 6).
Table 6. Overview of constructs reliability and validity.
| Construct | Cronbach’s alpha (α) | Composite reliability (ρc) | Average variance extracted (AVE) |
|---|
| AIEU
| 0.915 | 0.940 | 0.796 |
| AIFC
| 0.803 | 0.872 | 0.637 |
| AIRE
| 0.828 | 0.887 | 0.663 |
| AIUF
| 0.921 | 0.944 | 0.809 |
| AIUI
| 0.924 | 0.952 | 0.868 |
| DIRE
| 0.796 | 0.861 | 0.612 |
All reflective scales met conventional reliability and convergent-validity thresholds. Cronbach’s alpha coefficients are (α ≥ 0.79) for every construct and composite reliability range (ρc ≈ 0.86–0.95), within the recommended band and below the redundancy-risk zone. The average variance extracted values are (AVE ≥ 0.61) across all constructs, indicating that each latent variable explains well over half of its indicators’ variance. Taken together, these results provide strong evidence of internal consistency and convergent validity for the reflective measurement model.
Discriminant validity was assessed with two complementary procedures. First, we applied the Fornell-Larcker criterion (
Table 7), which requires that the square root of a construct’s AVE (on the diagonal of the inter-construct correlation matrix) exceed its correlations with all other constructs. This ensures each latent variable shares more variance with its indicators than with other constructs (Fornell & Larcker, 1981).
Table 7. Fornell-Larcker criterion.
| Construct | AIEU | AIFC | AIRE | AIUF | AIUI | DIRE |
|---|
| AIEU
| 0.892
| | | | | |
| AIFC
| 0.583 | 0.798
| | | | |
| AIRE
| 0.592 | 0.659 | 0.815
| | | |
| AIUF
| 0.662 | 0.459 | 0.610 | 0.899
| | |
| AIUI
| 0.519 | 0.485 | 0.530 | 0.711 | 0.932
| |
| DIRE
| 0.394 | 0.225 | 0.220 | 0.199 | 0.108 | 0.782
|
Second, we used the heterotrait-monotrait ratio of correlations (HTMT) (
Table 8), which simulation studies show to be a more sensitive test of discriminant validity in variance-based SEM than Fornell-Larcker. Recommended decision rules are (HTMT <0.85) conservative or (HTMT <0.90) more liberal, with subsequent inference tests available if needed (Henseler et al., 2015).
Table 8. Heterotrait-monotrait ratio.
| Construct | AIEU | AIFC | AIRE | AIUF | AIUI | DIRE |
|---|
| AIEU
| | | | | | |
| AIFC
| 0.657 | | | | | |
| AIRE
| 0.672 | 0.792 | | | | |
| AIUF
| 0.717 | 0.528 | 0.694 | | | |
| AIUI
| 0.562 | 0.566 | 0.603 | 0.769 | | |
| DIRE
| 0.423 | 0.233 | 0.242 | 0.198 | 0.138 | |
Overall, both the Fornell-Larcker criterion and the HTMT ratios support adequate discriminant validity. The square roots of the AVE values (on the diagonal) exceeded all corresponding inter construct correlations, indicating that each construct shares more variance with its own indicators than with other constructs. Likewise, all values (HTMT <0.792) were below the conservative threshold, providing further evidence that the latent variables are empirically distinct. Therefore, discriminant validity can be considered established for all constructs in the measurement model.
To establish indicator reliability and convergent validity in PLS-SEM, each reflective indicator should load strongly on its hypothesized latent construct (
Table 9). A standardized outer loading of at least (λ ≥ 0.708) is recommended, because its square implies that the indicator shares at least 50% of its variance with the construct (Hair et al., 2020). Indicators with lower loadings (0.40 ≤ λ ≤ 0.70) can still be considered, but only if deleting the item would not improve the composite reliability or the AVE of the construct (Hair et al., 2019; Purwanto, 2021).
Table 9. Outer loadings.
| Item | AIEU | AIFC | AIRE | AIUF | AIUI | DIRE |
|---|
| aieu_1 | 0.905 | | | | | |
| aieu_2 | 0.887 | | | | | |
| aieu_3 | 0.902 | | | | | |
| aieu_4 | 0.874 | | | | | |
| aifc_1 | | 0.859 | | | | |
| aifc_2 | | 0.862 | | | | |
| aifc_3 | | 0.870 | | | | |
| aifc_4 | | 0.558 | | | | |
| aire_1 | | | 0.694 | | | |
| aire_2 | | | 0.883 | | | |
| aire_3 | | | 0.854 | | | |
| aire_4 | | | 0.815 | | | |
| aiuf_1 | | | | 0.898 | | |
| aiuf_2 | | | | 0.899 | | |
| aiuf_3 | | | | 0.915 | | |
| aiuf_4 | | | | 0.885 | | |
| aiui_1 | | | | | 0.915 | |
| aiui_2 | | | | | 0.934 | |
| aiui_3 | | | | | 0.945 | |
| dire_1 | | | | | | 0.635 |
| dire_2 | | | | | | 0.716 |
| dire_3 | | | | | | 0.903 |
| dire_4 | | | | | | 0.846 |
Most indicator loadings exceeded the recommended threshold of confirming satisfactory indicator reliability. Three indicators (aifc_4, λ = 0.558; aire_1, λ = 0.694; dire_1, λ = 0.635) fell slightly below the threshold. However, according to Hair et al. (2019), items with loadings between (0.40 ≤ λ ≤ 0.70) can be retained when their removal would not improve ρc or AVE, and when their theoretical relevance justifies inclusion. Since all three items are theoretically meaningful and their exclusion would not increase ρc or AVE, they were retained in the model. Therefore, all reflective indicators are considered acceptable for further analysis.
Structural model
This subsection reports the empirical results for the structural model estimated with PLS-SEM. Values printed next to the arrows are standardized path coefficients (β). Values in parentheses are bootstrap two-tailed p-values (α = 0.05). The figures inside the endogenous nodes indicate explained variance (R2). During the interpretation, statistical significance is read together with effect size and explanatory power (Hair et al., 2020).
Figure 2 shows the explained variance for all endogenous constructs. These values indicate moderate to substantial explanatory power for AIUI (R2 = 0.542) and AIEU (R2 = 0.476), moderate for AIUF (R2 = 0.382), and weak for AIFC (R2 = 0.050) and AIRE (R2 = 0.048).
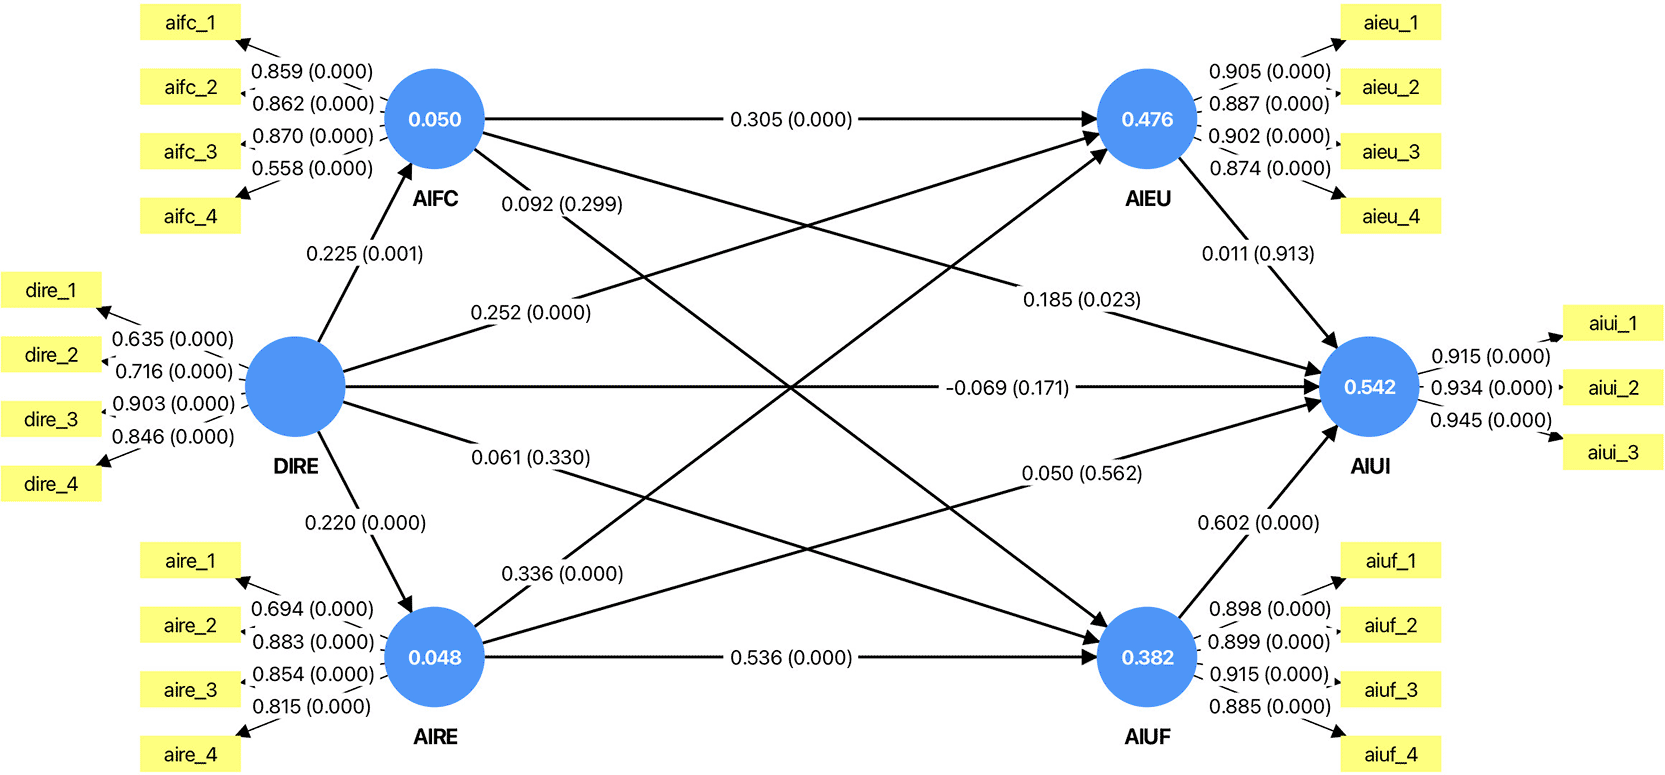
Figure 2. Structural model and results.
DIRE = Digital Readiness, AIRE = AI Readiness, AIFC = AI Facilitating Conditions, AIEU = AI Ease of Use, AIUF = AI Usefulness, and AIUI = AI Use Intention.
In line with reporting guidelines (Hair et al., 2019),
Table 10 summarises the structural model results for the direct effects. The standardised path coefficient (β) is estimated from the original sample. The table additionally reports the bootstrap mean and standard deviation of the path coefficients based on 5,000 resamples, the corresponding t-value computed from the bootstrapped standard error, the two-tailed p-value, and the local effect size (f2).
Table 10. Direct effects in structural model.
|
Direct effect | Code | Original sample | Sample mean | Standard deviation |
t-value
|
f-square
|
p-value
|
|---|
| DIRE → AIRE | H1 | 0.220 | 0.228 | 0.060 | 3,687 | 0.051 | 0.000 |
| DIRE → AIFC | H2 | 0.225 | 0.232 | 0.065 | 3,472 | 0.053 | 0.001 |
| DIRE → AIEU | H3 | 0.252 | 0.253 | 0.064 | 3,925 | 0.114 | 0.000 |
| DIRE → AIUF | H4 | 0.061 | 0.060 | 0.062 | 0.974 | 0.006 | 0.330 |
| AIRE → AIEU | H5 | 0.336 | 0.336 | 0.068 | 4,940 | 0.120 | 0.000 |
| AIRE → AIUF | H6 | 0.536 | 0.534 | 0.083 | 6,461 | 0.260 | 0.000 |
| AIFC → AIEU | H7 | 0.305 | 0.305 | 0.072 | 4,218 | 0.099 | 0.000 |
| AIFC → AIUF | H8 | 0.092 | 0.096 | 0.089 | 1,038 | 0.008 | 0.299 |
| DIRE → AIUI | H9 | −0.069 | −0.068 | 0.050 | 1,370 | 0.009 | 0.171 |
| AIRE → AIUI | H10 | 0.050 | 0.046 | 0.086 | 0.579 | 0.002 | 0.562 |
| AIFC → AIUI | H11 | 0.185 | 0.186 | 0.081 | 2,275 | 0.038 | 0.023 |
| AIEU → AIUI | H12 | 0.011 | 0.012 | 0.096 | 0.110 | 0.000 | 0.913 |
| AIUF → AIUI | H13 | 0.602 | 0.605 | 0.077 | 7,849 | 0.382 | 0.000 |
Eight of the thirteen direct paths are statistically significant (p < 0.05). AIUI is primarily driven by AIUF (β = 0.602, p < 0.001), while the direct effects of AIEU, AIRE, and DIRE on AIUI are non-significant. AIFC retains a small residual direct effect on AIUI (β = 0.185, p < 0.05). Upstream, DIRE positively predicts AIRE, AIFC, and AIEU. AIRE strengthens both AIEU and AIUF, whereas AIFC increases AIEU but not AIUF. Taken together, the hypotheses are evaluated next.
In line with reporting guidelines (Hair et al., 2019),
Table 11 reports the specific indirect effects derived via the product of coefficients approach and assessed with nonparametric bootstrapping (5,000 resamples, two-tailed tests). For each hypothesised mediation path, the table lists the original sample estimate, bootstrap mean, bootstrap standard deviation, the t-value computed from the bootstrapped standard error, and the p-value. Both two-step and serial (multi-step) mediations are included.
Table 11. Indirect effects in structural model.
| Indirect effect | Code | Original sample | Sample mean | Standard deviation |
t-value
|
p-value
|
|---|
| DIRE → AIRE → AIEU | H14 | 0.074 | 0.076 | 0.024 | 3,127 | 0.002 |
| DIRE → AIRE → AIUF | H15 | 0.118 | 0.121 | 0.035 | 3,371 | 0.001 |
| DIRE → AIRE → AIUI | H16 | 0.011 | 0.010 | 0.020 | 0.539 | 0.590 |
| DIRE → AIFC → AIEU | H17 | 0.069 | 0.072 | 0.029 | 2,390 | 0.017 |
| DIRE → AIFC → AIUF | H18 | 0.021 | 0.023 | 0.023 | 0.903 | 0.367 |
| DIRE → AIFC → AIUI | H19 | 0.042 | 0.043 | 0.023 | 1,793 | 0.073 |
| DIRE → AIEU → AIUI | H20 | 0.003 | 0.003 | 0.025 | 0.105 | 0.916 |
| DIRE → AIUF → AIUI | H21 | 0.037 | 0.036 | 0.038 | 0.961 | 0.337 |
| AIRE → AIEU → AIUI | H22 | 0.004 | 0.004 | 0.033 | 0.108 | 0.914 |
| AIRE → AIUF → AIUI | H23 | 0.322 | 0.324 | 0.068 | 4,760 | 0.000 |
| AIFC → AIEU → AIUI | H24 | 0.003 | 0.004 | 0.030 | 0.106 | 0.915 |
| AIFC → AIUF → AIUI | H25 | 0.056 | 0.058 | 0.055 | 1,016 | 0.310 |
| DIRE→AIFC→AIUF→AIUI | H26 | 0.012 | 0.014 | 0.014 | 0.876 | 0.381 |
| DIRE→AIRE→AIUF→AIUI | H27 | 0.071 | 0.074 | 0.024 | 2,913 | 0.004 |
| DIRE→AIFC→AIEU→AIUI | H28 | 0.001 | 0.001 | 0.008 | 0.095 | 0.924 |
| DIRE→AIRE→AIEU→AIUI | H29 | 0.001 | 0.001 | 0.008 | 0.102 | 0.918 |
Five of the sixteen indirect paths are statistically significant (α = 0.05). DIRE increases AIEU via both AIRE (β = 0.074, p < 0.01) and AIFC (β = 0.069, p < 0.05), and it raises AIUF through AIRE (β = 0.118, p < 0.01). Crucially, the serial chain from DIRE to AIUI via AIRE and AIUF is significant (β = 0.071, p < 0.01). By contrast, all routes that rely on the AIEU → AIUI link are negligible, and neither AIFC → AIUF → AIUI nor DIRE → AIFC → AIUF → AIUI are significant.
Hypothesis testing results
Here we present the empirical tests of the structural hypotheses (H1-H13). Decisions are based on the standardised path coefficients (β) and their bootstrap-derived test statistics (two-tailed, α = 0.05). A hypothesis is marked “Supported” when the estimated effect is statistically significant and aligned with the theorised direction. Significance levels are commonly indicated by asterisks in statistical reporting, with *p < 0.05; **p < 0.01; and ***p < 0.001 representing conventional thresholds (Hair et al., 2021a). Effects that do not reach significance or that run counter to the predicted sign are labelled “Not supported”.
Table 12 summarises the outcome for each hypothesis.
Table 12. Hypothesis result of direct effects.
| Code | Hypothesis |
Status |
|---|
| H1 | Digital readiness has a positive effect on AI readiness. | Supported*** |
| H2 | Digital readiness has a positive effect on AI facilitating conditions. | Supported*** |
| H3 | Digital readiness has a positive effect on AI ease of use. | Supported*** |
| H4 | Digital readiness has a positive effect on AI usefulness. | Not supported |
| H5 | AI readiness has a positive effect on AI ease of use. | Supported*** |
| H6 | AI readiness has a positive effect on AI usefulness. | Supported*** |
| H7 | AI facilitating conditions has a positive effect on AI ease of use. | Supported*** |
| H8 | AI facilitating conditions has a positive effect on AI usefulness. | Not supported |
| H9 | Digital readiness has a positive effect on AI use intention. | Not supported |
| H10 | AI readiness has a positive effect on AI use intention. | Not supported |
| H11 | AI facilitating conditions has a positive effect on AI use intention. | Supported* |
| H12 | AI ease of use has a positive effect on AI use intention. | Not supported |
| H13 | AI usefulness has a positive effect on AI use intention. | Supported*** |
Overall, 8 of the 13 direct effect hypotheses are supported (H1-H3, H5-H7, H11, H13), while 5 are not supported (H4, H8-H10. H12) (
Table 13). Digital readiness exhibited significant positive direct effects on AI readiness, AI facilitating conditions, and AI ease of use (H1-H3: Supported). By contrast, the direct path from digital readiness to AI usefulness was not supported (H4: Not supported), and the direct path from digital readiness to AI use intention was likewise not supported (H9: Not supported). AI readiness showed significant positive direct effects on AI ease of use and AI usefulness (H5-H6: Supported), whereas its direct path to AI use intention was not supported (H10: Not supported).
Table 13. Hypothesis results of indirect effects.
| Code | Hypothesis | Status |
|---|
| H14 | Digital readiness has a positive indirect effect on AI ease of use via AI readiness. | Supported** |
| H15 | Digital readiness has a positive indirect effect on AI usefulness via AI readiness. | Supported** |
| H16 | Digital readiness has a positive indirect effect on AI use intention via AI readiness. | Not supported |
| H17 | Digital readiness has a positive indirect effect on AI ease of use via AI facilitating conditions. | Supported* |
| H18 | Digital readiness has a positive indirect effect on AI usefulness via AI facilitating conditions. | Not supported |
| H19 | Digital readiness has a positive indirect effect on AI use intention via AI facilitating conditions. | Not supported |
| H20 | Digital readiness has a positive indirect effect on AI use intention via AI ease of use. | Not supported |
| H21 | Digital readiness has a positive indirect effect on AI use intention via AI usefulness. | Not supported |
| H22 | AI readiness has a positive indirect effect on AI use intention via AI ease of use. | Not supported |
| H23 | AI readiness has a positive indirect effect on AI use intention via AI usefulness. | Supported*** |
| H24 | AI facilitating conditions have a positive indirect effect on AI use intention via AI ease of use. | Not supported |
| H25 | AI facilitating conditions have a positive indirect effect on AI use intention via AI usefulness. | Not supported |
| H26 | Digital readiness has a positive sequential indirect effect on AI use intention via AI facilitating conditions and AI usefulness. | Not supported |
| H27 | Digital readiness has a positive sequential indirect effect on AI use intention via AI readiness and AI usefulness. | Supported** |
| H28 | Digital readiness has a positive sequential indirect effect on AI use intention via AI facilitating conditions and AI ease of use. | Not supported |
| H29 | Digital readiness has a positive sequential indirect effect on AI use intention via AI readiness and AI ease of use. | Not supported |
AI facilitating conditions had a significant positive direct effect on AI ease of use (H7: Supported), but not on AI usefulness (H8: Not supported). AI facilitating exerted a weak yet statistically significant positive direct effect on AI use intention (H11: Supported). The direct effect of AI ease of use on AI use intention was not significant (H12: Not supported), whilst AI usefulness showed a strong and significant positive direct effect on AI use intention (H13: Supported).
Turning to the indirect effects, 5 of the 16 indirect effect hypotheses are supported (H14, H15, H17, H23, H27), while 11 are not supported (H16, H18-H22, H24–26, H28, H29). The sequential mediation path from digital readiness to AI use intention via AI readiness and perceived usefulness was fully supported (H15, H23, H27: Supported). All constituent links were positive and significant. Substantively, this indicates that the influence of digital readiness on intention operates by first elevating AI readiness, which in turn strengthens beliefs about usefulness, and usefulness then mobilises intention to use AI in administrative work.
In contrast, the sequential pathway from digital readiness to AI use intention via AI facilitating conditions did not reach significance as an indirect effect (H19: Not supported), even though the individual paths from digital readiness to AI facilitating conditions and from AI facilitating conditions to AI use intention were each significant (H2, H11: Supported). The non-significant path suggests that facilitating conditions do not transmit the effect of digital readiness on intention when other mediators are considered, particularly perceived usefulness. Conceptually, infrastructure, access, and organisational support appear necessary but insufficient: unless they lead to higher perceived usefulness, they do not translate into AI use intention.
Discussion
Theoretical implications
Descriptive statistics provide an important context for understanding the structural model. While respondents generally report high levels of self-assessed maturity, this coexists with a noticeable gap in imagination regarding the practical application of AI to their specific administrative workflows. A distinction arises between understanding basic generative AI functions and the more advanced potential of AI in collaborative or integrated tasks. This indicates a significant need for new organisational learning and training pathways to develop these advanced competencies. Although our findings, as will be discussed, point towards a strongly usefulness-driven adoption model, this must be understood against a backdrop where ease of use remains important. It is a fundamental, expected trait. The challenge, therefore, is not only to provide usable tools but also to demonstrate their tangible, practical utility in employees’ daily work.
The findings of this study closely align with previous research. Digital competence, online collaboration, and the use of digital tools act as upstream enablers that directly enhance AI readiness and facilitating conditions, thus establishing the foundation for core acceptance beliefs in organisations. However, these enablers do not have a direct impact on the intention to use AI. Instead, AI readiness determines to perceived ease of use and perceived usefulness. This pattern is consistent with capability-based accounts, which connect AI-specific data, integration, and governance to easier operation and clearer performance benefits.
Facilitating conditions follow the classical UTAUT framework. When organisations provide suitable tools, knowledge, compatibility, and support, perceived effort diminishes, and ease of use beliefs are strengthened in the AI context. By contrast, the direct path between AI facilitating conditions and AI usefulness is not significant. When organisations only supply infrastructure, access, compatibility, and help desk support, users do not necessarily recognise performance improvements. Notably, the path from facilitating conditions to AI use intention emerges as weak but statistically significant. In a higher education administrative context, formal access, authorisation, compatibility, and visible support can function as legitimising signals. Communicating that AI is permitted and endorsed can already shape intention even if they do not, by itself, increase perceived usefulness.
When we examine perceived ease of use and perceived usefulness in our model, a usefulness-driven adoption pattern becomes apparent. Perceived usefulness is the most significant direct predictor of AI use intention, whereas the direct path from perceived ease of use to AI use intention is not significant. This pattern aligns with a value and outcome-focused attitude among employees, particularly those in administrative roles, who prioritise immediate, tangible performance benefits such as time savings, accuracy, quality, and standardisation.
Accordingly, the outcome equation for intention to use AI reflects a narrow but strong set of direct predictors. A significant and stable effect of perceived usefulness is observed, along with a smaller but significant direct effect of AI facilitating conditions, while digital readiness, AI readiness, and AI ease of use do not show significant direct effects. The model thus illustrates a usefulness-driven, condition-sensitive decision mechanism: employees form an intention when they perceive a compelling performance benefit and when the organisation clearly signals and guarantees feasibility. Overall, the model accounts for 54% of the variance in intention to use AI, supporting a sequence of capability, belief, and intention in institutional AI adoption. Digital readiness and AI readiness influence intention indirectly, primarily through AI usefulness. Meanwhile, facilitating conditions, which serve as organisational boundary conditions, contribute a small direct effect to intention formation.
Practical and managerial implications
Start with value, not tools. Our findings show that perceived usefulness is the main factor shaping intention in the AI context. Practitioners should therefore start every AI project with a clear value hypothesis linked to specific work outcomes, such as measurement plans and a transparent proof-of-value period that focuses on aspects like turnaround time, error rate, throughput, and service quality. If a use case cannot show measurable benefits, it should be deprioritised, and no amount of UI polish or training can make up for low usefulness.
Make facilitating conditions clear and visible. Access, compatibility, and responsive support act as signals that boost intention. Before launch, ensure seamless identity and permissions, verify technical compatibility and integrations, establish help channels, and publish clear guidelines with examples. Make these supports highly visible across teams to turn organisational readiness into user confidence. Design around tasks and fit, not generic features. Map the target workflow, identify bottlenecks and decision points, and insert AI where it reduces effort or risk. Provide role-based enablement and change support. Offer task-focused training and a champions network to normalise safe experimentation.
Pair investments with outcome communication. Digital and AI readiness enable usefulness beliefs but do not, by themselves, increase intention. Connect data quality, integrations, and role-specific training to the promised outcomes of each use case and present quick before-and-after evidence. Without this transparency, readiness expenditure remains hidden from end users.
Conclusions
This research contributes to technology acceptance literature by validating and extending TAM and UTAUT frameworks for artificial intelligence contexts in higher education. Our findings demonstrate that established models require refinement to capture AI’s unique characteristics. Specifically, we identify a critical mediation pathway where digital readiness influences AI use intention indirectly through AI readiness and perceived usefulness, rather than directly. This finding advances theoretical understanding of how (basic) digital competencies translate into acceptance of advanced, autonomous technologies.
The prominence of facilitating conditions and perceived usefulness as direct predictors, alongside the non-significant effects of digital readiness, AI readiness and perceived ease of use, suggests that AI adoption follows different mechanisms than conventional technology acceptance. This divergence may stem from AI’s distinctive features—adaptive behaviour, data requirements, and potential for autonomous decision-making—which create unique adoption barriers and facilitators. Our results underscore the importance of context-specific model validation. While TAM and UTAUT provide valuable theoretical foundations, researchers must adapt these frameworks to accommodate the specific characteristics of emerging technologies and organizational contexts.
This study reveals critical insights for managing AI adoption in higher education administration. The finding that facilitating conditions and perceived usefulness directly drive AI use intention, while digital readiness operates indirectly, has important implications for institutional strategy. Universities must move beyond generic digital transformation initiatives to develop AI-specific implementation frameworks that address organizational infrastructure, demonstrated value, and targeted capability development.
The mediation pathway from digital readiness through AI readiness highlights the importance of staged implementation. Institutions should sequence their efforts: establish foundational digital competencies, build AI-specific knowledge, and then introduce AI applications with clear value propositions. This approach, grounded in our empirical findings, offers a roadmap for universities seeking to facilitate AI adoption among administrative staff while recognizing the complex interplay of individual readiness and organizational support.
Limitations and future research directions
This study is based on data from a single higher education institution in one country, which limits the external validity across different sectors, governance structures, and cultural contexts. Future research should replicate the model across multiple institutions and sectors to evaluate its generalisability and to examine how organisational characteristics influence the observed relationships. Future work should include institutions from other countries and extend the model to for-profit organisations, for example, manufacturing firms, to test sectoral boundary conditions and governance differences.
The data are self-reported, single-source, and cross-sectional. This design leaves common method and social desirability bias as residual risks and limits causal inference. Future research should use longitudinal designs and include multiple data sources, such as administrative records or interviews, to triangulate perceptions with behaviour and to improve claims about temporal ordering. The structural analysis focuses on direct paths among the key constructs, leaving mechanisms insufficiently detailed.
Besides, a single-context sample may conceal heterogeneity within higher education. Comparative analyses across organisational subunits and staff groups could reveal subgroup-specific drivers that are not visible in aggregate results. Furthermore, future theoretical development should explore additional constructs such as trust, transparency, and ethical concerns that may be particularly salient for AI adoption. Longitudinal studies are needed to examine how acceptance factors evolve as users gain experience with AI systems.
Ethics and consent
This study was conducted in accordance with the principles stated in the Declaration of Helsinki. Ethical approval for this research study was obtained from the Scientific Advisory Board of the Széchenyi István University (SZE/ETT-32/2025). All participants provided written informed consent before participation.
Declaration of generative AI and AI-assisted technologies in the writing process
During the preparation of this work, the authors used Grammarly and DeepL Translate in order to improve the readability and language of the manuscript. After using these tools, the authors reviewed and edited the content as needed and take full responsibility for the content of the publication.









