1. Introduction
The transition to smarter and more integrated energy systems requires coordinated innovation efforts across generation, distribution, storage and consumption of different energy vectors. European research and innovation projects, such as those under the Horizon Europe programme, focus on demonstration activities that validate new technologies and business models developed in real-world environments.
Despite their importance, demonstration activities are often described without a coherent methodological structure that links objectives, technical implementation and validation results. This fragmentation limits the replicability of project results, making it difficult to compare findings or reuse knowledge across different initiatives.
To address these challenges, various standardization efforts have been adopted to support the modelling, communication and interoperability of smart energy systems. Among them, the IEC 62559 provides a structured methodology for defining use cases.1 In particular, the IEC 62559–2:2015 standard defines formal templates for use cases, actor lists and requirement lists. However, although this methodology has proven effective in defining functional requirements and interoperability use cases in smart grids and other interoperable energy systems, it has rarely been applied to demonstration and validation scenarios. In this context, use cases describe functional interactions between actors and systems, while demonstration scenarios focus on the concrete deployment and operation of innovations in real-world environments. Validation scenarios, in turn, define how these demonstrations will be assessed, specifying evaluation criteria, key performance indicators (KPIs), and data collection methods. In this way, use cases capture functional requirements, whereas demonstration and validation scenarios capture the conditions and processes through which these functionalities are tested and evaluated. This paper explores how the IEC 62559–2 methodology can be extended and adapted to describe demonstration scenarios for validation in a structured, traceable and reusable way.
The approach is demonstrated in the context of the InterPED project funded under Horizon Europe grant agreement no. 101138047, which aims to develop and validate integrated energy management solutions at district level.2 The project involves several demonstration sites in different climatic and regulatory contexts, where advanced control, monitoring and interoperability solutions are validated.
Through this adaptation of the IEC 62559–2, the paper presents a practical framework that bridges the methodological gap between standardized functional modelling and experimental validation processes. The proposed approach ensures that the defined KPIs, their calculation method and required data inputs are aligned with the innovation requirements and design from the beginning of the project development.
2. State of the art
With the aim of standardising the modelling of smart energy systems, the International Electrotechnical Commission (IEC) introduced the IEC 62559 standard to define a methodology for the creation and management of use cases.1 The standard was designed to facilitate interoperability or traceability in the development of complex systems such as Smart Grids.
The IEC 62559–2:2015 standard provides templates that require information on the objectives of the use case, the actors involved, the KPIs and graphical diagrams representing the relationship between all the actors involved. It is commonly used in combination with the Smart Grid Architecture Model (SGAM) developed by the CEN-CENELEC-ETSI Smart Grid Coordination Group (SG-CG) for the design of smart grid systems.3 This model is a conceptual framework that proposes a 5-layer architecture (Business, Function, Information, Communication and Component) that allows to represent how use cases are mapped across different levels of abstraction. Together, they enable a holistic view of smart energy systems, linking functional specifications with their architectural and technical context. This conjunction has been widely adopted in European projects and standardization efforts.4,5 In this context, initiatives such as BRIDGE, supported by the European Commission, have played an important role in promoting the standardisation of use case documentation across European energy projects, even offering a repository of use cases based on the IEC 62559 standard.6
Despite the aforementioned advances, the application of the IEC 62559 standard has remained mainly applied to the design phase, without systematically including experimental validation of demonstration scenarios.7 Due to the demands of experimental validation and real-world testing, it is helpful to have a structured framework that supports the traceability of these activities and includes KPIs, the specific objectives of each demo site and the relationship between the actors involved. Due to this gap and the lack of clear references, specific methods have also been developed for scenario demonstration in large-scale pilots like the “funnel approach”.8
The contribution of this paper lies in demonstrating how the IEC 62559–2 use case template may be leveraged to formalize demonstration scenarios, creating a standardized bridge between functional modelling, experimental validation and replicability assessment in innovation initiatives or projects such as InterPED. Establishing a unique methodology for describing demonstration scenarios is essential to ensure alignment across all phases of an innovation project and can be used as a guideline throughout the project. Furthermore, having an established methodology with templates facilitates replicability and enables comparisons between different projects and the IEC 62559–2 standard fits perfectly with this idea.
3. Methods
3.1 Overview of IEC 62559–2
The IEC 62559–2 standard defines a structured methodology for describing use cases in complex and interoperable energy systems. Rather than addressing implementation details, it provides conceptual templates that ensure objectives, actors, constraints, and performance indicators are documented in a consistent and traceable manner.
The methodology begins with the identification of the use case, including a unique identifier, application domain, and descriptive name, enabling clear classification and reference within large projects. Version management is an integral element, requiring explicit information on version number, authorship, change history, and approval status, which supports traceability throughout the project lifecycle. The scope and objectives section defines the system boundaries and intended outcomes of the use case. Objectives are often linked to business. This definition is complemented by a narrative description, which includes both a concise summary and a more detailed explanation of system behaviour and interactions, ensuring accessibility for technical and non-technical stakeholders.
Performance evaluation is addressed through the definition of Key Performance Indicators (KPIs). Each KPI is associated with a clear description and linked to one or more objectives, ensuring that performance assessment is aligned with the intended purpose of the use case. In a table that aims to define the conditions of the use case, the standard requires explicit assumptions and prerequisites, which define the conditions under which the use case is valid. These may include technical, organisational, or environmental constraints and support transparent interpretation of results. Additional contextual information, such as relationships to other use cases, prioritisation, and level of detail, further supports classification and reuse across projects. Diagrams are encouraged to visualise interactions between actors and system components, providing a complementary perspective to the textual description.
Focusing on the technical side, the methodology defines a structured approach to describing the actors involved, including human roles, physical devices, and software systems, along with their responsibilities within the use case. The standard also requests references associated with the use case in this part.
Finally, IEC 62559–2 introduces a scenario-based analysis, allowing use cases to be decomposed into specific situations characterised by triggering events, pre-conditions, and post-conditions. Where required, these scenarios can be further detailed through step-by-step descriptions of interactions and information exchanges. Additional templates for requirements, exchanged information, and common terms support extensibility and adaptability to different application contexts.
3.2 Definition of demonstration scenarios in EU innovation projects in the energy sector
Firstly, the definition of use cases and demonstration scenarios across different types of EU projects will be examined to understand the methodologies applied. Projects involving energy microgrids have been selected to assess how IEC 62559–2 has been used, along with other energy-related projects that share similarities with InterPED, in order to analyse how their validation-oriented demonstration scenarios were defined.
InteGrid sought to empower citizens by linking them with utilities, aggregators, and other energy service providers, thereby evolving the role of DSOs from distribution and access operators to facilitators of active markets and system optimization. InteGrid used the IEC 62559–2 standard to define its high-level and primary use cases. These use cases focused on the needs of DSOs and on enabling the integration of distributed flexibility into distribution networks through planning, operation, maintenance, automation, consumer engagement and resource aggregation.9
Flexgrid project proposed a holistic smart grid architecture to automate the management of advanced energy services like market services. Although it did not strictly refer to IEC 62559–2 standard, it included a simplified template based on IEC 62559–2 that covered objectives, actors or scenario steps, although KPIs are not included.10
Taken together, these examples illustrate two complementary approaches to scenario definition: InteGrid relied directly on the IEC 62559–2 standard to formalize its use cases, ensuring consistency in the representation of actors, objectives and processes, while Flexgrid opted for a simplified adaptation of the template that captured essential elements of use cases but omitted other elements like KPIs. This contrast highlights both the value of standardized methodologies for interoperability and the practical challenges of applying them fully in complex innovation projects.
Projects with similar objectives to InterPED, such as React, Indigo, Platoon and Fedecom, are also examined to understand how their demonstration scenarios have been defined. These projects have in common the development of different tools that aim to improve the efficiency of facilities, such as Model Predictive Controllers (MPCs).
React defines its demonstration scenarios through a common structure applied across all pilots, starting with the selection of feasible technological configurations for the buildings and systems involved, followed by the development of an energy model to evaluate performance, sizing, and potential benefits via simulations. Each scenario is then complemented by the design of suitable demand response schemes within the project context and concludes with practical recommendations for deployment and operation. This approach ensures that the defined scenarios are both technically and economically viable, while being directly applicable to real demonstration environments.11
In the Indigo project, demonstration scenarios are defined to validate an advanced predictive control strategy that optimises cooling system operation based on forecasts of demand, weather, and energy prices. The validation approach combines real and virtual testing, starting from a baseline scenario where the predictive controller is applied to the existing system to benchmark energy efficiency and cost performance against traditional control. Additional virtual scenarios progressively introduce renewable energy integration and enhanced thermal storage to assess flexibility, RES utilisation and load-shifting capabilities. Across all cases, performance is quantified through indicators such as energy cost reduction, efficiency improvements, comfort conditions and prediction accuracy, ensuring scalability and applicability to diverse system configurations.12
In the Platoon project, demonstration scenarios were articulated through project-specific templates designed to capture the essential elements of each pilot. These templates described the objectives pursued, the actors involved, and the sequence of steps or processes to be implemented, with a strong emphasis on the role of digital platforms and energy big data. The scenarios were oriented towards validating how advanced analytics, interoperability frameworks, and data-driven services could enhance efficiency, flexibility and sustainability in energy systems. Each pilot documented its scenario in terms of the technological solutions deployed, the expected outcomes and the operational context, thereby providing a structured yet adaptable framework for assessing the added value of digitalization in real-world environments.13
In the Fedecom project, the definition of pilot-specific demonstration scenarios followed a funnel approach to validate innovative solutions for sector coupling and interoperable energy communities at different levels.8 Each scenario was structured to identify the technologies involved, the planned actions across different interaction levels, and the performance indicators to be measured. The pilots addressed diverse contexts, including hydrogen integration, residential hydropower, and cross-country e-mobility, with scenarios focusing on renewable integration, demand-side flexibility, peer-to-peer energy trading and advanced control strategies. The definition of these scenarios also incorporated stakeholder perspectives, boundary conditions and related business models, ensuring that validation was not limited to technical feasibility but extended to operational and economic sustainability.14
Overall, the analysis of these energy projects (React, Indigo, Platoon, Fedecom) reveals that demonstration scenarios are typically defined through project-specific templates or ad hoc structures rather than standardized methodologies as shown in
Table 1. While this allows each consortium to tailor the scenarios to its technological focus and pilot context, it also results in heterogeneous formats that complicate cross-project comparison and limit methodological consistency. The absence of a common standard makes it difficult to assess validation approaches in a uniform way, underscoring the need for structured frameworks that can enhance reproducibility and comparability across EU energy innovation projects.
Table 1. Project demonstration comparison.
| Project | Main focus | Methodology | Scope |
|---|
| InteGrid | Microgrid | IEC 62559–2 | System use cases |
| Flexgrid | Microgrid | IEC 62559–2 adaptation | System use cases |
| React | Energy | Project-specific
| Demonstration and validation |
| Indigo | Energy | Project-specific
| Demonstration and validation |
| Platoon | Energy | Project-specific
| Demonstration and validation |
| Fedecom | Energy | Project-specific
| Demonstration and validation |
| InterPED | Energy | IEC 62559–2 adaptation | Demonstration and validation |
3.3 Adaptation of IEC 62559–2 for demonstration scenarios
Use cases describe the value of the innovation, while demonstration scenarios describe how the innovation will be tested and validated in real-world conditions to assess the stated value. Use cases support functional design, whereas demonstration scenarios guide experimental validation. Due to the differences between the two concepts and given that IEC 62559–2 was created for the definition of use cases, it is necessary to make certain modifications to the templates or change the interpretation of some of these fields.
First, the interpretation of the ‘Scope and objectives’ template must shift from describing system capabilities to detailing the specific targets of the demonstration. Therefore, the information described in this section will be closely linked to KPIs, which should quantify the degree of compliance with these objectives and not the system-level performance they seek in their original definition. This adaptation ensures that the scenario definition becomes directly actionable for validation, establishing an explicit and measurable link between what the demonstration aims to achieve and how its success will be evaluated.
Secondly, due to the need to consider field application constraints such as data acquisition capabilities or time constraints, the ‘Use case conditions’ template, which defines assumptions and prerequisites, will be approached from this perspective. In demonstration scenarios, these conditions no longer represent abstract system assumptions but instead capture operational constraints that directly affect the feasibility, execution and interpretation of the validation activities. Explicitly documenting these elements helps ensure that the scenario remains realistic, reproducible across different sites and that deviations in results can be properly attributed to contextual or infrastructural limitations rather than to methodological inconsistencies.
Furthermore, in the application of the standard carried out for the InterPED project, the ‘Scenario steps’ table was omitted. Originally, this template focused on defining a service-oriented sequence. In the case of demonstration scenarios, it would make more sense to describe the experimental demonstration procedure, but due to the status of the InterPED project at the time the scenarios were created, it was ultimately discarded.
The grouping proposed in the ‘Actors’ template will be also omitted. In the case of demonstration scenarios, the actors do not have such abstract roles and, therefore, it is believed that this grouping does not add value to the definition of the demonstration scenario. In typical scenarios for a project such as InterPED, actors could be grouped into humans (e.g., operators), hardware (e.g., assets) and software applications (e.g., SCADAs), and this can be defined in ‘Actor type’ within the ‘Actors’ template.
Additionally, to avoid terminology confusion, templates that previously referred to ‘Use cases’ will now refer to ‘Demonstration’. Overall, these adaptations make the IEC 62559–2 template more suitable for validation activities, enabling a unified methodology in which objectives, KPIs, assumptions and actors are consistently documented from the outset. This contributes to improved traceability between design and validation phases, strengthens cross-site comparability and ultimately enhances the reproducibility and transparency of the demonstration process.
3.4 Workflow for building demonstration scenarios
As mentioned above, one of the main focuses of this work is to ensure traceability and reproducibility at the different demonstration sites. Therefore, a structured workflow based on the IEC 62559–2 template has been defined.
Despite the original focus of the standard, if the defined workflow is systematically applied to actual demonstrations by adapting the key elements (objectives, actors, conditions, and KPIs), it is perfectly suited to the needs of validation activities. The workflow consists of five main steps, which are shown in
Figure 1.
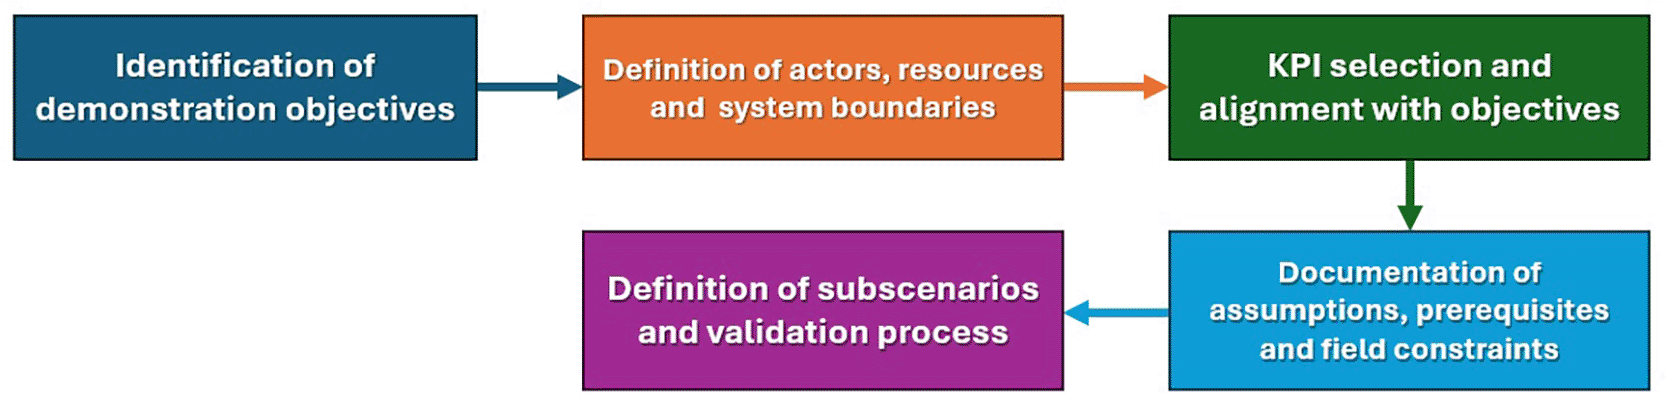
Figure 1. Workflow for defining demonstration scenarios.
Before detailing the individual steps, it is important to highlight that the proposed workflow not only guides the construction of demonstration scenarios but also establishes a consistent logical sequence that links high-level objectives with measurable validation outcomes. By structuring the process from objectives to KPIs, and from actors to operational constraints, the workflow ensures that all elements of the demonstration are defined with coherence and mutual dependency. This avoids fragmented or ad hoc descriptions and enables a transparent chain of reasoning from the initial validation goals to the final execution steps.
3.4.1 Identification of demonstration objectives
The first step in the process is to explicitly define the objectives of the demonstration, emphasising what is being validated in this particular scenario. In this case, the focus should be on the demonstration targets rather than on the system’s functionalities.
3.4.2 Definition of actors, resources and system boundaries
Once the objectives of the demonstration scenario have been established, all the virtual and physical elements involved are identified. This includes physical equipment, ICT infrastructure, algorithms or software services and the human actors responsible for operating or supervising the system.
3.4.3 KPI selection and alignment with objectives
Next, KPIs are defined to quantify the degree to which the demonstration objectives have been achieved. As mentioned above, these indicators must align with the validation purposes. Each KPI must be directly related to the objectives defined in the first step. In line with the idea of standardising the definition of scenarios, it is proposed that the calculation of the KPIs follow the International Performance Measurement and Verification Protocol (IPMVP) defined by EVO.16 This protocol ensures a rigorous and comparable methodology for quantifying energy, economic and environmental performance and further links the definition of demonstration scenarios to the validation process. Section 3.5 will explore this point in greater depth.
3.4.4 Documentation of assumptions, prerequisites and field constraints
The purpose of this step is to clearly identify the practical limitations of the scenario in a template. This section should consider data acquisition capabilities, time synchronisation, security restrictions, and operating policies, ensuring that the scenario is realistic and implementable.
3.4.5 Definition of subscenarios and validation process
Finally, the sections ‘Overview of scenarios’ and ‘Scenario steps’ renamed as ‘Overview of subscenarios’ and ‘Subcenario steps’ are used to describe the experimental process for running the demonstration. These steps articulate how the actors interact, what triggers each action, how KPIs will be measured and which external systems or platforms are involved.
3.5 Applying the IPMVP methodology for KPI calculation
The International Performance Measurement and Verification Protocol (IPMVP) provides a structured framework for assessing the performance of energy measures through well-defined baseline conditions, measurement boundaries and verification rules. Its role in demonstration scenarios is not to impose a single calculation method for all indicators, but to offer a set of principles that can be adapted to the characteristics of each KPI. As a result, different KPIs may require different IPMVP options, modelling approaches or measurement assumptions.16
A key IPMVP concept is the baseline, which represents how the system would have operated under normal conditions before the Energy Efficiency Measure (EMM), that is, before the demonstration scenario is implemented and begins affecting energy performance. In contrast, the reporting period refers to the time after the demonstration scenario is implemented, during which the interventions are active and their impact on energy, cost, or emissions is measured.
KPIs focused on savings—such as avoided energy, cost, or emissions—compare the reporting period to a baseline adjusted to reporting conditions. By contrast, ratio-based or descriptive KPIs—such as self-sufficiency or self-consumption—when defined as absolute or percentage-based values rather than as an increase or reduction, are calculated directly from measured data and do not require baseline modelling (unless the change in ratio is a desired KPI which is not always the case).
When a baseline is required, the IPMVP states that it should reflect normal and repeatable operation. The protocol does not define a fixed duration; instead, both the baseline and the reporting periods must be long enough to represent the typical operating patterns relevant to each KPI. For example, if the system is affected by seasonal cycles, a full year may be needed to capture them, while systems with short, stable operating cycles might require only a shorter representative period. The variables used to describe baseline behaviour should be selected because they meaningfully influence the KPI, not because they are convenient to include.
Measurement boundaries are another essential element. The boundary defines which equipment, flows and conditions are included in the KPI. Boundaries depend on the KPI itself: a narrow boundary is suitable for KPIs evaluating a specific device, while a whole-facility boundary is required when the KPI depends on interactions between multiple components. Clear boundaries also help determine which IPMVP option is appropriate. A short summary of the IPMVP options is provided in
Table 2.
Table 2. IPMVP measurement options.
| Option | Name | Description |
|---|
| A | Retrofit Isolation (partial measurement) | Some parameters measured, others estimated |
| B | Retrofit Isolation (full measurement) | All key parameters measured; suitable for subsystem-level KPIs |
| C | Whole Facility | Uses whole-facility metering and models with independent variables; suitable for KPIs based on system-level behaviour |
| D | Calibrated Simulation | Used when measured baseline data are not available |
Each KPI must be matched with the option that best fits its scope. A KPI describing overall energy or emission savings usually requires Option C, while a KPI measuring the performance of a single device often fits Option B. Even though KPIs like energy ratios do not measure savings and thus do not directly use an IPMVP option, it is still possible to assign an Option (A, B, C or D) to maintain consistency with IPMVP principles and clearly define the measurement boundaries.
In summary, applying the IPMVP to KPI calculation involves defining whether a baseline is required, selecting the duration of both baseline and reporting periods, establishing clear boundaries, and choosing the independent variables and IPMVP option that best match the purpose of the KPI. Making these decisions explicit ensures that all indicators are calculated in a transparent and consistent way. All of this justifies the intention to integrate these considerations into the templates.
4. InterPED demonstration scenarios
This section presents an example of how IEC 62559–2 was applied in the InterPED project. The example presents a demonstration scenario where optimisation tools are applied in a pilot site within the project detailing the objective of each one and how they interact.15
Table 3,
Table 4,
Table 5,
Table 6,
Table 7,
Table 8,
Table 9,
Table 10,
Table 11,
Table 12,
Table 13 and
Figure 2 are used to illustrate this example.
4.1 Scenario for validating optimisation services
4.1.1 Description of the demonstration
Table 3. “Demonstration identification” for P1-D1.
| Demonstration identification |
|---|
| ID | Area/Domain(s) /Zone(s) | Name of demonstration |
|---|
| P1-D1 | Pilot 1, Matía-Lugaritz
| Energy production and consumption optimization |
Table 4. “Version management” for P1-D1.
| Version management |
|---|
| Version No. | Date | Name of author(s) | Changes | Approval status |
|---|
| 0.1 | 27/05/2024 | Andoni Osorio
Ane López | - | - |
Table 5. “Scope and objectives of demonstration” for P1-D1.
| Scope and objectives of demonstration |
|---|
| Scope | This demonstration seeks to improve the efficiency of energy production, distribution and consumption from the various sources involved in Matía-Lugaritz Community’s thermal system. To this end, MPC algorithms and cross-vector optimization services will be used. |
| Objective(s) |
•
P1-D1-O1: Maximise the utilisation of RES by aligning production with consumption patterns and storage capabilities. •
P1-D1-O2: Lower energy costs through efficient energy management practices and the use of predictive analytics to anticipate and mitigate high-cost scenarios. •
P1-D1-O3: Decrease greenhouse gas emissions by optimizing the energy mix and enhancing the use of cleaner energy sources.
|
| Related business case(s) |
•
P1-D1-BC1: Predictive demand-side energy analytics •
P1-D1-BC2: Model predictive controllers (MPCs) •
P1-D1-BC3: Cross-vector optimizer (Energy Hub)
|
Table 6. “Narrative of demonstration” for P1-D1.
| Narrative of demonstration |
|---|
| Short description |
Three sequences or tasks can be distinguished in this demonstration scenario:
•
Generate forecasters of flexibility: based on historical data of the community and weather forecasts provided by commercial solutions, a model will be developed to provide predictions. •
Cross-vector energy optimization: based on the forecasts generated in the previous sequence, the cross-vector energy optimizer will identify district-level control strategy across various systems (thermal and electric in this case) resulting in optimal demand profiles. •
Field-level control via MPC: using the optimal demand profiles generated by the cross-vector optimiser, the Model Predictive Controller (MPC) will generate the corresponding optimal setpoints for the control of the assets by minimising the error in the profile tracking and based on the models of the installation.
|
| Complete description |
In order to optimize the thermal energy production and consumption of the Lugaritz-Matía community, acting at field-level in real time, this scenario has been defined, describing the services involved, the interaction between them and the way they should work to meet the objectives. It should be noted that the architecture of the platform and the location of these services are still to be defined. As summarised previously, three services are mainly involved in this use case: the forecasting models, the cross-vector optimiser and the MPCs.
Prediction models should be developed to provide forecasts of different variables that are needed for the cross-vector optimiser and MPCs. The Energy Hub will require RES production forecasts for each generator and demand forecasts for each consumer. On the other hand, the MPC will need to have thermal demand forecasts. Machine Learning models are used by selecting the predictor variables (time and weather variables) that have the most influence on the variable to be predicted. These models will be trained with historical data from both the predictor variables and the variable to be predicted.
Based on the forecasts and the definition of the systems and resources available in the installation, a multi-objective optimisation (costs reduction, energy savings, CO2 emissions reduction, etc.) will be carried out that will suggest an energy mix at the supply side, a demand profile, and an energy asset scheduling.
The MPCs will receive the thermal demand forecasts and cross-vector optimiser profiles as input to manage the operation of the field-level assets. A multi-objective optimisation will also be carried out in an attempt to minimise demand profile tracking, reduce energy costs and meet the thermal requirements of the installation. The controller will have embedded models with which it can simulate the behaviour of the installation over time. |
Table 7. “Key performance indicators (KPIs)” for P1-D1.
| Key performance indicators |
|---|
| ID | Name |
Description | Objective(s) |
Baseline | Reporting | IPMVP option |
|---|
| SSRES | RES Self-Sufficiency
|
: Local energy consumption [kWh]
: Total energy demand [kWh]
: RES self-sufficiency
| P1-D1-O1 | N/A | 12 months | C |
| SCRES | RES Self-Consumption
|
: Local energy consumption [kWh]
: Local energy production [kWh]
: RES self-consumption
| P1-D1-O1 | N/A | 12 months | C |
| ECR | Energy Cost Reduction |
: Energy [kWh]
: Energy price [€/kWh]
: Cost reduction [€]
: Energy source identifiers
: Available energy sources
: Baseline (S1) and test (S2) identifiers | P1-D1-O2 | 12 months. Adjusted for climate and demand, and energy bills information. | 12 months | C |
| CO2R | CO2 Reduction |
: Energy demand from grid [kWh]
: Emission factor of grid [kgCO2/kWh]
: Energy demand from fuel [kWh]
: Emission factor of fuel [kgCO2/kWh]
: CO2 emissions reduced [kgCO2]
: Baseline (S1) and test (S2) identifiers | P1-D1-O3 | 12 months.
Adjusted for climate and demand, and emission factors data. | 12 months | C |
Table 8. “Demonstration conditions” for P1-D1.
| Demonstration conditions |
|---|
| Assumptions |
|
| Prerequisites |
• Availability of historical data for developing forecasting models • Correct communication and synchronisation between services • Integration and communication between MPC and field-level assets • Assets are operational
|
Table 9. “Classification information” for P1-D1.
| Classification information |
|---|
| Relation to other demonstrations |
| The cooperative DR strategy (P1-D2) must be considered for this demo, especially by the cross-vector optimizer. |
| Level of depth |
| Detailed |
| Prioritisation |
| High |
| Generic, regional or national relation |
| Generic |
| Nature of the demonstration |
| System use case |
| Further keywords for classification |
| Mathematical optimization, Cross-vector optimizer, Model predictive controller (MPC), Predictive data analytics, Energy production, Field-level control |
Table 10. “General remarks” for P1-D1.
| General remarks |
|---|
| Due to the current phase of the project and the fact that the platform architecture has not yet been defined, the scenarios within each demonstration and the information exchanged have not been defined. |
4.1.2 Diagrams of demonstration scenario
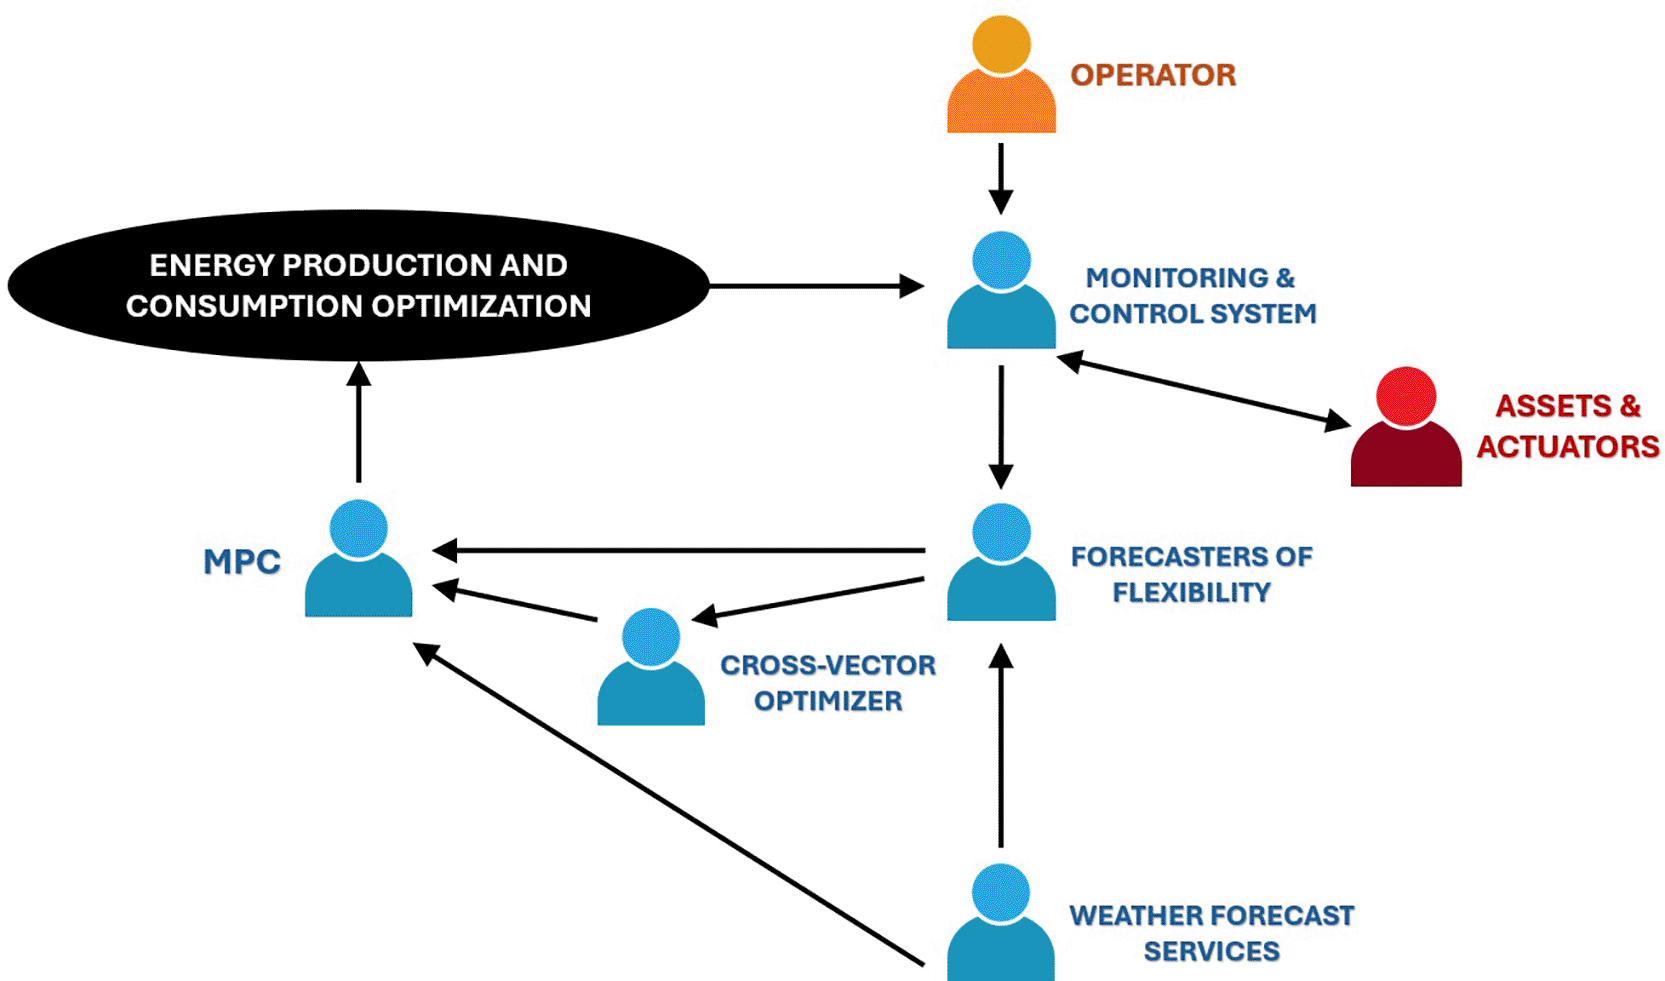
Figure 2. Diagram of P1-D1.
4.1.3 Technical details
Table 11. “Actors” for P1-D1.
| Actors |
|---|
| Actor name | Actor type | Actor description |
|---|
| Operator | Person | This person will be responsible for activating the setpoints produced by the optimizer, either by changing the operating mode or by accepting the recommendations. |
| Monitoring and control system | Application | This system has different tasks within the demo scenario. It monitors the current state of the system, can store historical data and controls actuators and assets. |
| Assets, storage systems and actuators | Devices | Refers to equipment that can generate and modify thermal energy. They are monitored and controlled by the monitoring and control system. |
| Weather forecast services | Application | These are commercial services that offer weather forecasts to be used in other services. |
| Forecasters of flexibility | Application | This service will provide predictions of certain variables using historical data of related variables and the variable to be predicted. |
| Cross-vector optimizer | Application | This system will suggest an energy mix at the supply side, a demand profile, and an energy asset scheduling based on the forecasts and the definition of the systems and resources available in the installation. |
| Model Predictive Controller | Application | The MPC will calculate control signals that will try to optimize different objectives (track demand profile, reduce energy costs, meet thermal requirements, etc.) based on model-based simulations of a future horizon. |
Table 12. “References” for P1-D1.
| References |
|---|
| Type | Reference | Organisation |
Description |
|---|
| Standard | ISO/IEC 25010 | ISO/IEC JTC1/SC 7 | Specifies a model for evaluating the quality of software and system products, focusing on characteristics like functionality, reliability, usability, and performance efficiency. |
| Standard | RITE | Spanish Government | Spanish regulation that sets the requirements for the design, installation, and maintenance of thermal installations in buildings to ensure energy efficiency and safety. |
| Guideline | ASHRAE 36 | ASHRAE | Provides high-performance sequences of operation for HVAC systems to ensure efficient, reliable, and optimized control strategies. |
| Standard | ASHRAE 55 | ASHRAE | Defines the standards for acceptable thermal environmental conditions for human occupancy, ensuring thermal comfort in buildings |
| Standard | ISO 52000 | ISO/TC 163 | Establishes a framework for the assessment of the overall energy performance of buildings, considering energy efficiency and renewable energy contributions. |
| Standard | IEC 62443 | IEC | A series of standards focused on cybersecurity for industrial automation and control systems, providing guidelines to protect critical infrastructure. |
| Standard | IEC 61850 | IEC TC 57 | Defines communication protocols for intelligent electronic devices at electrical substations, facilitating interoperability and automation. |
| Standard | IEC 61968 | IEC TC 57 | Specifies standards for the integration of application software used in utility management systems, enhancing communication and data exchange among different utility systems. |
4.1.4 Subscenarios
Table 13. “Overview of subscenarios” for P1-D1.
| Subscenario conditions |
|---|
| No. | Name | Description | Primary actor | Triggering event | Pre-condition
| Post-condition
|
|---|
| P1-D1-S1 | Prerequisites are met | Ensures that the prerequisites are met to apply the “optimized mode”. | “Monitoring and control system” | Prerequisites are met | Correct communication between different services and with field-level assets. Assets operational. | Optimization process begins |
| P1-D1-S2 | Provide data to services | Confirm availability, send and provide the required data for each of the services. | “Monitoring and control system” & “Weather forecast services” | Optimization process active | Optimization process initiated | Start running services |
| P1-D1-S3 | Flexibility forecasting | Forecasting services are executed | “Forecasters of flexibility” | Service execution process initiated | Data for forecasting available | Provide forecasters |
| P1-D1-S4 | Cross-vector optimization | Multi-objective optimisation based on predictions and pilot characteristics | “Cross-vector optimizer” | Forecasters provided | Have all the necessary data to run the service | Provide the necessary supply of each vector and demand profiles |
| P1-D1-S5 | MPC execution | Execution of the thermal MPC that generates the optimal control signals to meet demand profiles | “MPC” | Demand profiles generated | Have all the necessary data to run the service | Manage the setpoints generated for assets |
| P1-D1-S6 | Write and store outputs | Write and store calculated optimal setpoints | “Monitoring and control system” | Setpoints generated | Execution of services completed | End the execution cycle |
5. Conclusions
5.1 Summary of contributions
This paper demonstrates how the IEC 62559–2:2015 standard, originally designed for functional use case modelling in smart grids, can be adapted to structure demonstration scenarios in energy innovation projects. By redefining templates to focus on validation objectives, KPIs, operational constraints, and actors, the proposed methodology bridges the gap between functional design and experimental validation. In addition, the IPMVP protocol is integrated for calculating validation KPIs.
5.2 Impact and added value
The adaptation of IEC 62559–2 provides a unified framework for documenting demonstration scenarios, which is particularly relevant for Horizon Europe projects and initiatives such as BRIDGE, a European Commission initiative that brings together projects from Horizon Europe with a focus on smart energy systems. It enables systematic alignment between high-level objectives and measurable outcomes, facilitating stakeholder coordination and supporting the creation of interoperable repositories of demonstration scenarios and relevant KPIs. This contributes to methodological consistency and knowledge transfer across projects.
5.3 Limitations
The application of the methodology within the InterPED project faced constraints due to the project planning timeline. Scenario steps and detailed information exchange were not fully defined and therefore were not included. These limitations highlight the need for early integration of scenario definition workflows in project planning, which requires earlier requirements definition for project developments and earlier assessment of data availability and data quality.
5.4 Future work
Future research should focus on:
• Automating template generation and data population to reduce complexity and improve usability.
• Assess the possibility of defining scenarios by applying IEC 62559–2 in different phases according to the degree of progress of the project
• Extending the methodology to other PEDs, energy communities and large-scale pilots to validate its scalability and interoperability.
• Developing digital tools for KPI calculation and scenario benchmarking to support real-time validation and cross-project comparison.
• Consider other possible changes in the adaptation of templates to further deepen the application of IPMVP.
Ethics and consent
Ethical approval and consent were not required for this study, as it does not involve human participants, personal data, or animal experimentation.







