Introduction
According to the World Health Organization (WHO), low fruit and vegetable intake causes approximately 1.7 million deaths per year.1 Globally, studies predict serious fruit shortages up to 2050, with the world population reaching 9 billion,2,3 while pests and diseases are responsible for 25% to 40% yield loss before harvest.4 Moreover, pesticide residues are the most important food-related concern for EU citizens,5 and the
European Food Safety Authority (EFSA) announced that more than 45% of the food products analysed (apples, head cabbage, lettuce, peaches, spinach, strawberries, tomatoes, barley, oats, wine grapes, swine fat, and milk) contain pesticide residues.6
Thus, reducing the use of pesticides in fruit production is a major global societal challenge, and it is in line with European Directive 2009/128/EC,7 which demands Integrated Pest Management (IPM), as well as 2016/2031/EC,8 which requires that a proportionate and effective response to plant health threats is established through a combination of technological, ecological, and institutional management. However, large parts of the conventional spraying equipment are currently highly inefficient. The size of the problem was quantified in the 3-year study ‘Save Spray’, directed by the Valencian Institute of Agriculture Research (IVIA) in collaboration with Pulverizadores Fede (FEDE), the University of Lleida (UDL), and the Polytechnical University of Catalonia (UPC).9 The study revealed that 50% of plant protection product (PPP) do not reach the plants but are lost owing to drift, run-off, and ground losses when using conventional spraying equipment. As a result, many pesticides are found in ambient air, contaminating the environment,10 with considerable negative effects on biodiversity, bee life, bystanders,11 and the ecosystem as a whole. Addressing this serious environmental problem, the EU’s Life-F3 project12 demonstrated, in the case of the Spanish vineyard (Viñas del Vero) and the Portuguese olive plantation (Do Outeiro Sociedade Agricola, S.A.), that reduction of over 25% of biocidal products and/or pesticides is possible simply through the correct set-up and use of existing high-end spraying equipment.13,14 Similarly, the recent case study in15 indicates even higher savings with constant rate high-end equipment in combination with Best Management Practice (BMP). While these are already significant advancements, the work presented here as part of the Life-AIs project16 takes the developments one step further by adding the capability to individually switch all nozzles based on input commands from a 3D stereo vision system with artificial intelligence edge processing capabilities (AIs). The AIs system can be considered as growers’ “eyes on the ground.” Edge processing algorithms, with a well-balanced degree of detail and temporal resolution, provide information on crop dimensions, which facilitates real-time sprayer adjustments, i.e. important enablers to pesticide and foliar fertilizer reduction under the umbrella of Precision Agriculture (PA).
Materials and methods
AIs sprayer technology
The AIs system, as shown in Fig. 1, was fitted on a tractor and contained two stereo vision cameras per side. Mounting AIs on tractors enables the collection of sprayer-independent crop statistics. However, collecting data with AIs also presents significant technical challenges; for example, e.g. the timing for spray nozzle actuation is dependent on information captured from another vehicle, with the sprayer and tractor only loosely coupled. Furthermore, establishing a reliable high-speed data connection between vehicles that are frequently disconnected and reconnected under harsh field conditions is challenging. Here, AIs provide a robust Ethernet solution.
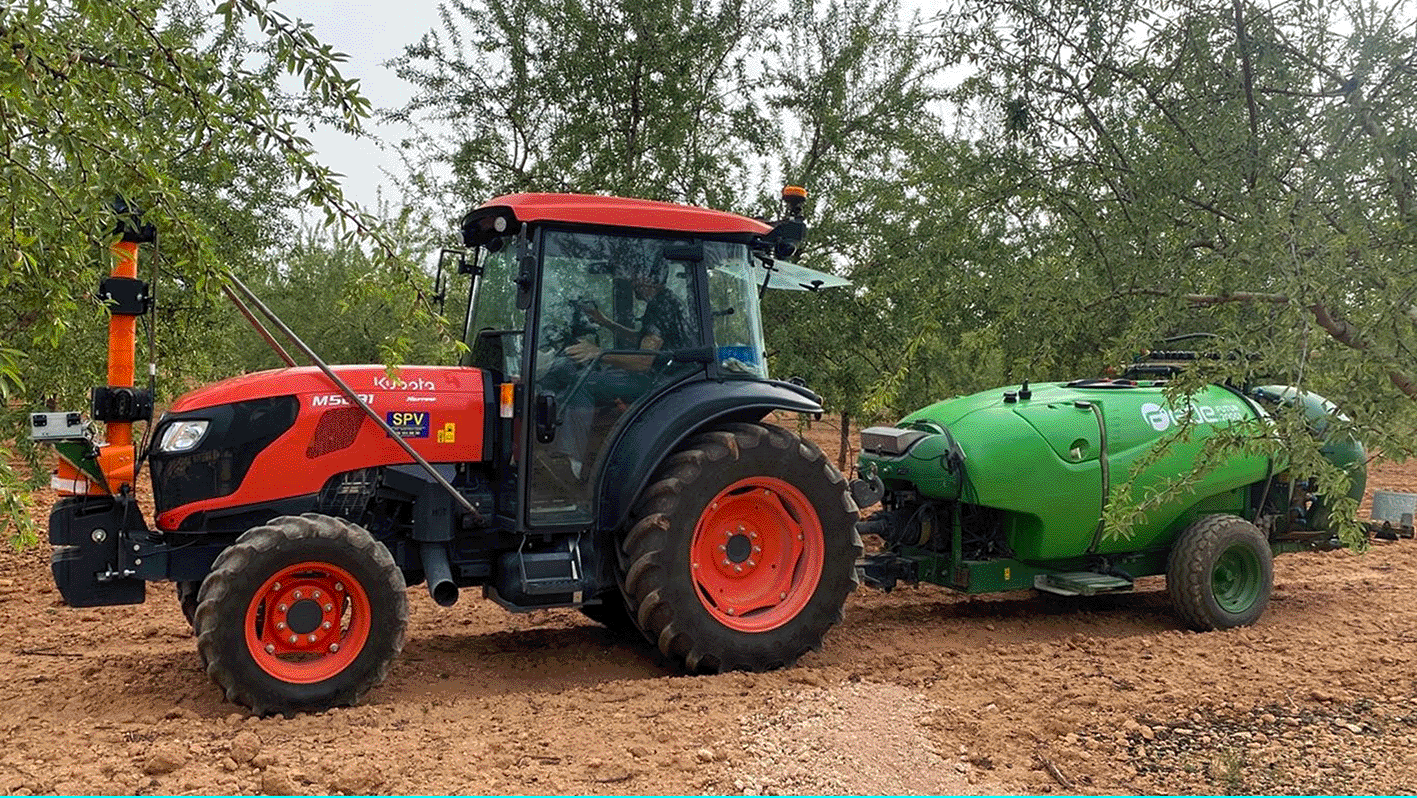
Fig. 1. Fede’s AIs system connected to an AIs-enabled
sprayer in almond field.
Moreover, the issue of keeping camera lenses clean is addressed with a pressurized air curtain system that shields off the lenses from dust, rain, etc. Pressurized air is also used to cool the cameras and the AIs’ edge processing unit at its core.
The data collected can be directly used to act on the sprayer, e.g. to open and close spray nozzles, as a function of the detected tree dimensions and density. To do so, sprayers must be “AIs-enabled
,” which means, they need a connection into the Sprayer Control System (SCS) over which to receive proprietary AIs commands, and they must be fitted with actuators, i.e. the Nozzle Control Unit (NCU), to open and close nozzles individually, while maintaining spray pressure constant (Fig. 2).
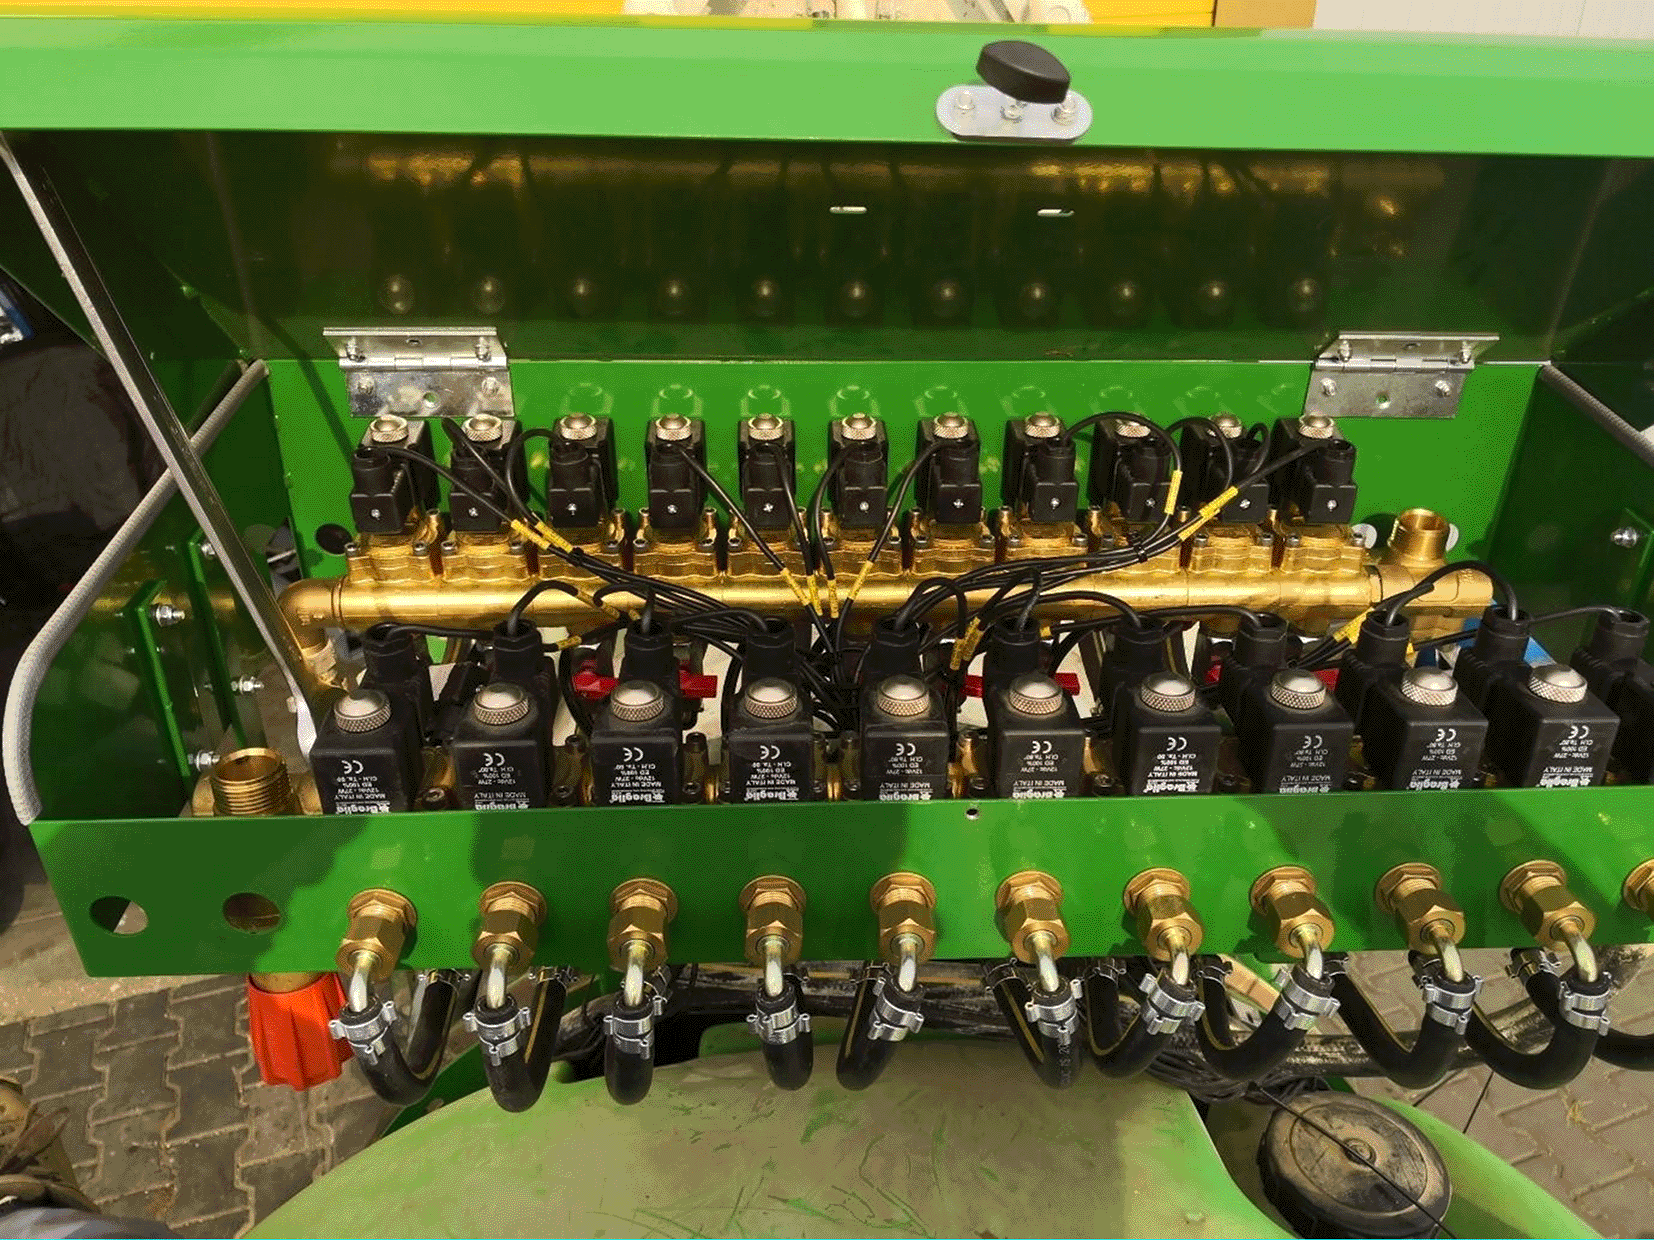
Fig. 2. Nozzle Control Unit (NCU) to open and close nozzles individually, while maintaining spray pressure constant.
Turning to the high-level system deployment view in Fig. 3, it becomes apparent that the Life-AIs
material is much more than a sprayer. It is a specialized crop agricultural management environment that brings digitalization and precision to 3D crops. The lower part of Fig. 3 shows a sprayer with a Fede Sprayer Control System (SCS) connected via Wi-Fi with a Terminal Application in the tractor’s cabin (TAPP).
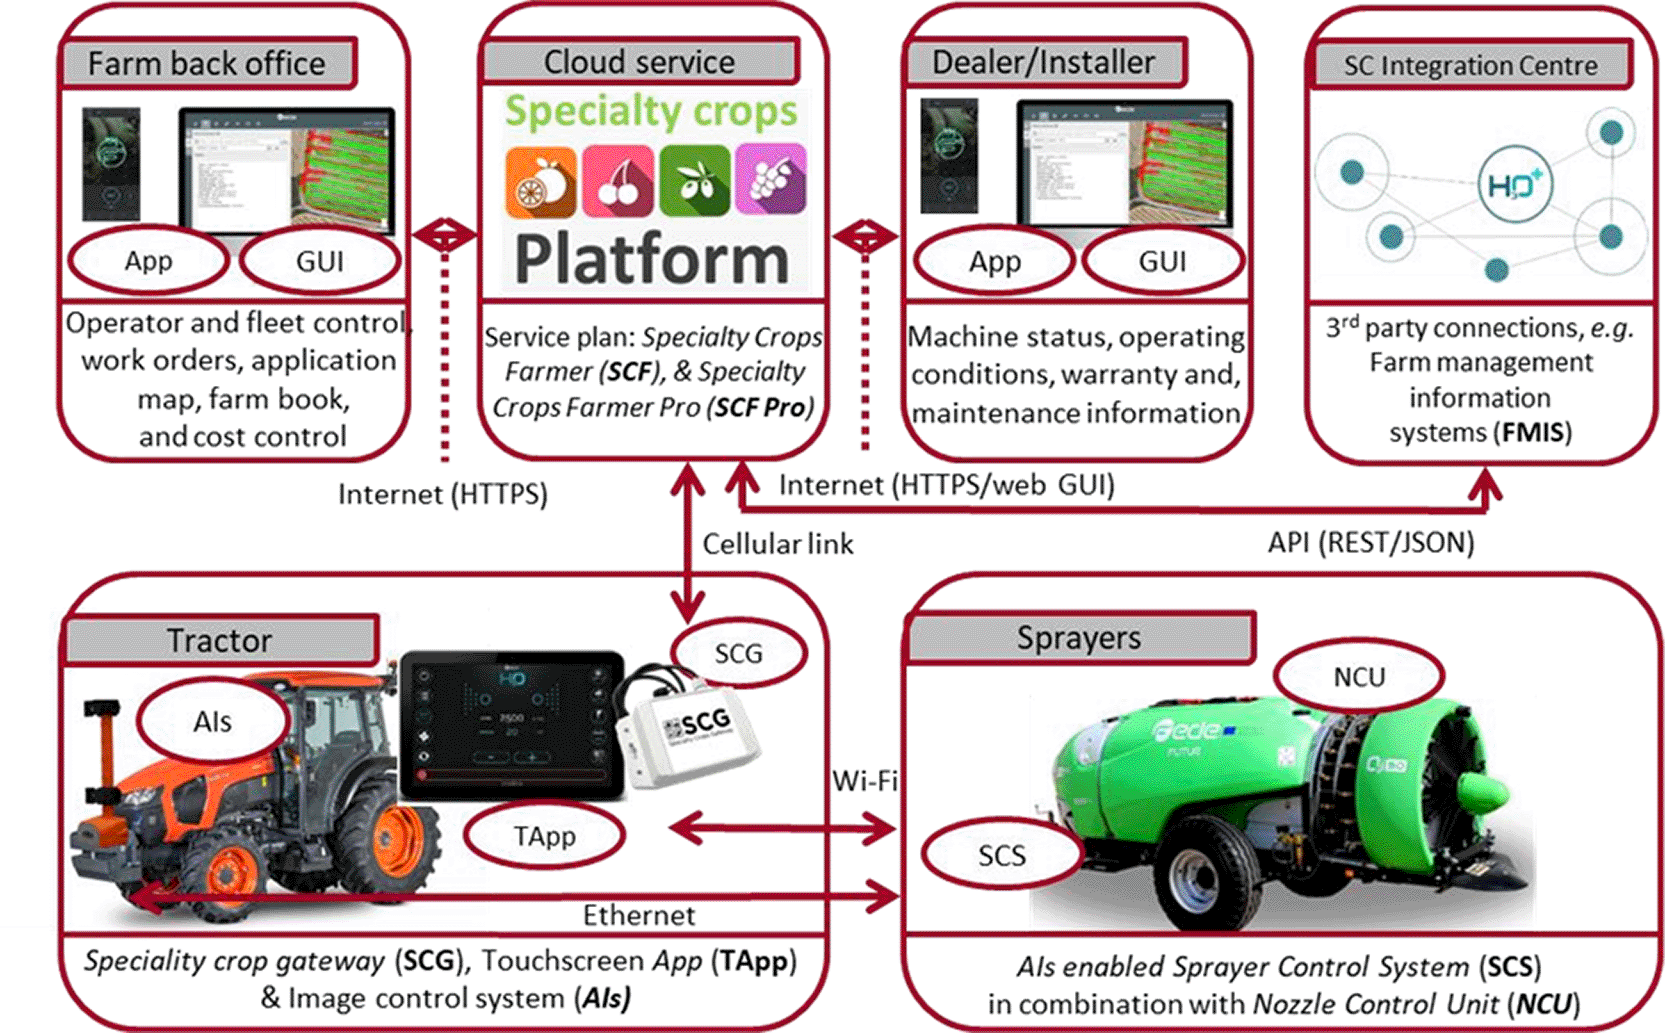
Fig. 3. Fede’s AIs system embedded into the Specialty Crops Platform (SCP).
The tractor carries a speciality crops gateway (SCG) that guides the sprayer operator and connects the tractor and sprayer via a cellular modem to the Internet and from there to Fede’s Cloud, referred to as Speciality Crops Platform (SCP). Farmers and agronomic advisors have access to the Speciality Crops Platform via web graphical user interfaces (GUIs). In this way, they can perform actions such as sending prescriptions or work orders to the sprayer operator as well as monitoring and documenting results. Moreover, through a GUI, back-office staff can process the data. For example, it can automatically produce a farm book that records all treatments for plant protection products. Moreover, interoperability with third-party service providers is ensured through Application Programming Interfaces (APIs) bundled in the Specialty Crop Integration Centre (SCIC).
AIs and baseline reference set-up
The baseline sprayer was a Smartomizer H3O of 2000 l,
with n = 26 identical individual switchable nozzles, n/2 per side. The test results were obtained for traditional citrus, almond, and olive groves under spraying conditions, as outlined in Fig. 4. Fig. 4. (a) shows the baseline situation, where the sprayer is configured manually in a conventional manner by selecting the baseline spray volume Q (L ha−1) with respect to the Tree Row Volume (TRV),17
i.e.,
(equ. 1)
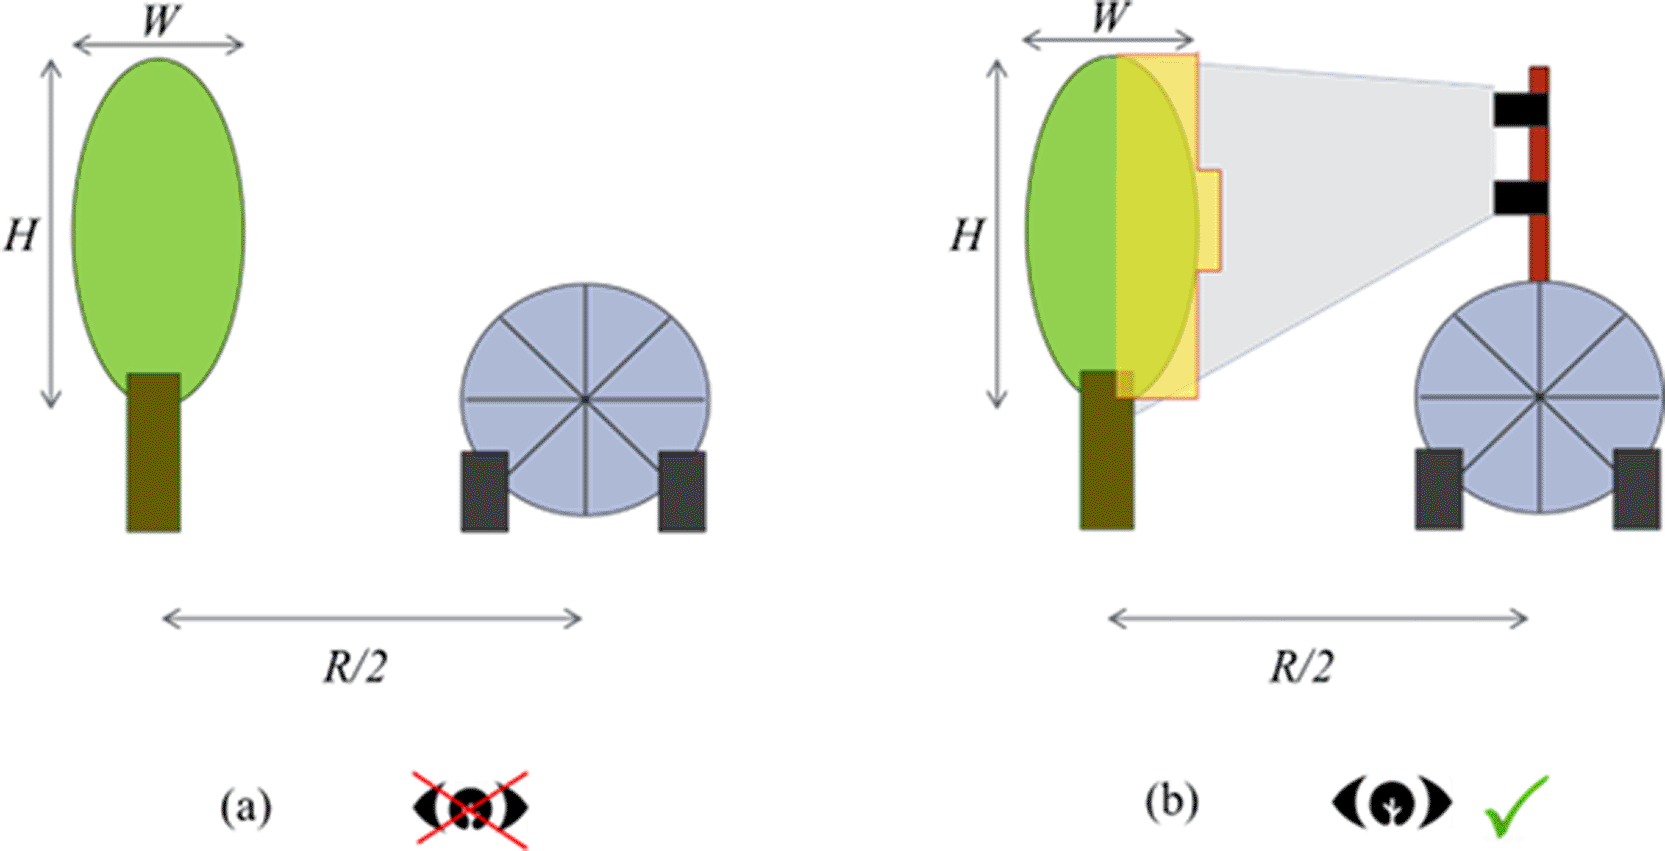
Fig. 4. Spraying situation.
(a) baseline without AIs. (b) with AIs scanning of tree dimensions.
where H is the tree height excluding the bare trunk (m), W is the tree width (m), R is the interrow distance (m), and k is the unit volume (L m−3).
The flow rate per nozzle q is then calculated as in,17 i.e.
(equ. 2)
where additionally v is the driving velocity in km h−1.
In Fig. 4 (b), the sprayer receives input from the AIs system with instructions to switch individual nozzles on and off for segments of the canopy where little or no foliar mass is detected.
The nozzle opening and closing times were digitally logged for post-processing data analysis. To monitor and ensure no negative impact of the AIs system on distribution and deposition, water sensitive paper was deployed over the canopy, placing special emphasis on edges and areas close to canopy holes where AIs are expected to perform nozzle switching.
The citrus, almond, and olive test fields
Trials were performed in citrus, almond, and olive plantations throughout Spain, with field satellite maps as well as individual tree views, as shown in Fig. 5.
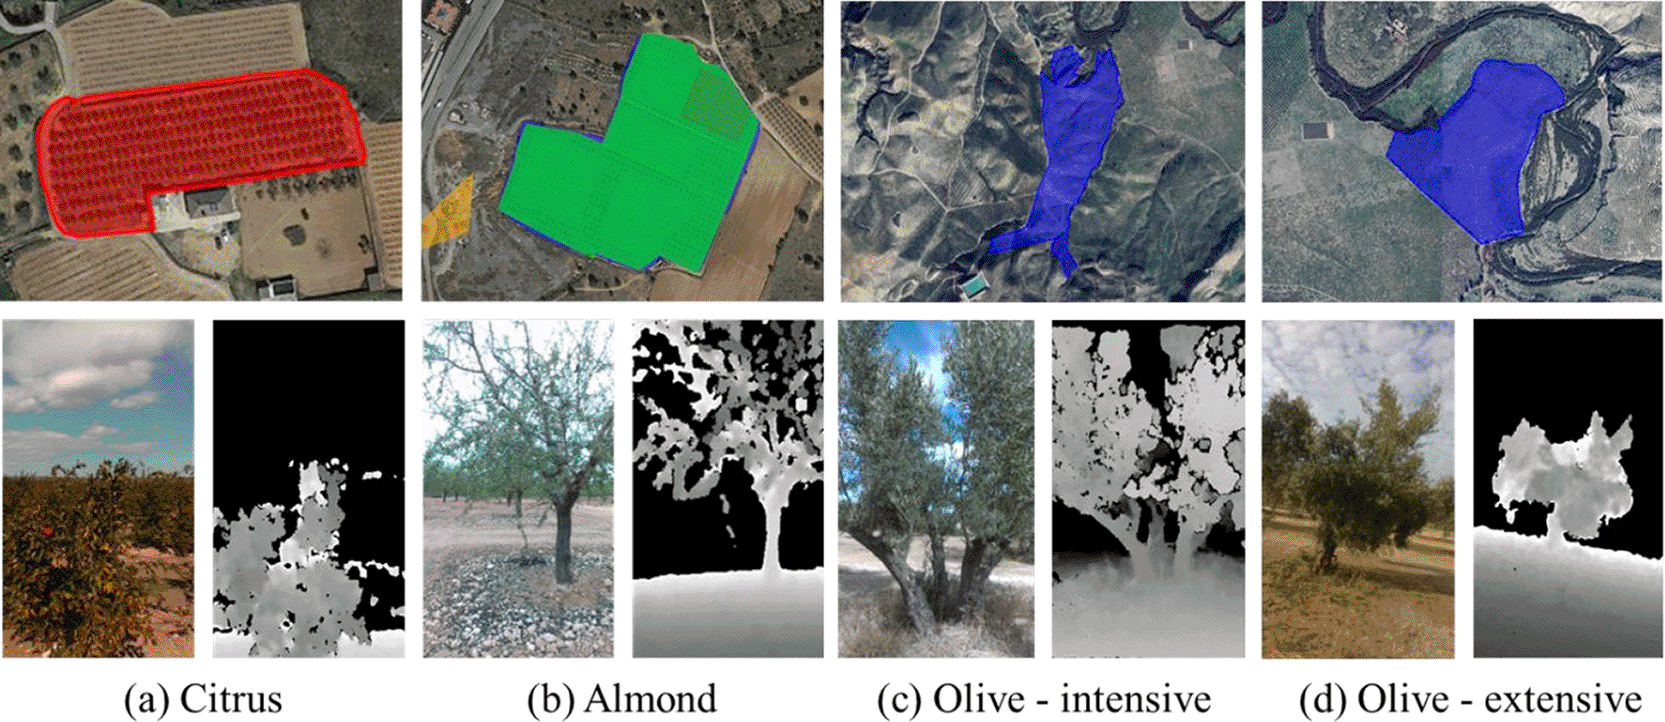
Fig. 5. Satellite, RGB, and depth view of (a) Citrus, (b) Almond, (c, d) Olive test fields/trees.
Comparing in the lower part of Fig. 5. the RGB (Red, Green, Blue) image to the left and the depth image to the right, one gets an understanding of the type of information the 3D cameras are gathering. In fact, all the grey shadings correspond to different depths that are then converted by AIs´ processing algorithms into actionable nozzle opening and closing commands.
Furthermore, the olive results are obtained in two different fields, as shown in Fig. 5 (c), in a 7 m × 7 m intensive setting and in Fig. 5 (d) in an 11 m × 11 m extensive setting. The target spray volumes Qtarget in the case of constant rate uniform application were selected as 3125 L ha−1, 1000 L ha−1, 1180 L ha−1, and 1100 L ha−1 for the citrus, almond, intensive, and extensive olive cases, respectively.
Results
PPP savings due to AIs
Monitoring of the baseline spray parameter shows that the sprayer regulates the spraying processes so that the actual applied spray volume Qapplied stays in all four cases within ±2.5% of the target.
For the AIs situation, the notion of treatment “equivalent to” was devised because many growers are used to define a constant-rate target spray volume per field surface area. However, when AIs autonomously closes nozzles, while maintaining the spray pressure approximately constant, the sprayer applies over the whole area a quantity that results in spray coverage “equivalent to” having ordered a uniform treatment with Qtarget, but where due to AIs induces savings the actual applied spray volume stays below,
i.e. Qapplied ≤ Qtarget. To express that AIs enabled sprayers intentionally stay most of the time below the uniform spray volume, Qtarget is renamed into “Qequivalent,” and AIs induced spray volume savings are expressed as,
(equ. 3)
which in relative terms delivers the savings ratio,
(equ. 4)
To ensure that the precision treatment is “equivalent to” the uniform baseline treatment, it is of utmost importance that the spray efficacy does not diminish. Although spray efficacy trials were not feasible owing to time constraints in the present work, a visual inspection of water sensitive paper distributed in the canopy was conducted for the baseline cases and the AIs cases, which showed comparable spray distribution and deposition. Water sensitive paper spray impact quantification performed using the SnapCard spray APP18 revealed that, in all situations, the minimum coverage was above 10%.
To obtain a feeling for the nozzle opening and closing processes, Fig. 6. shows the number of nozzles opened over time in the citrus case.
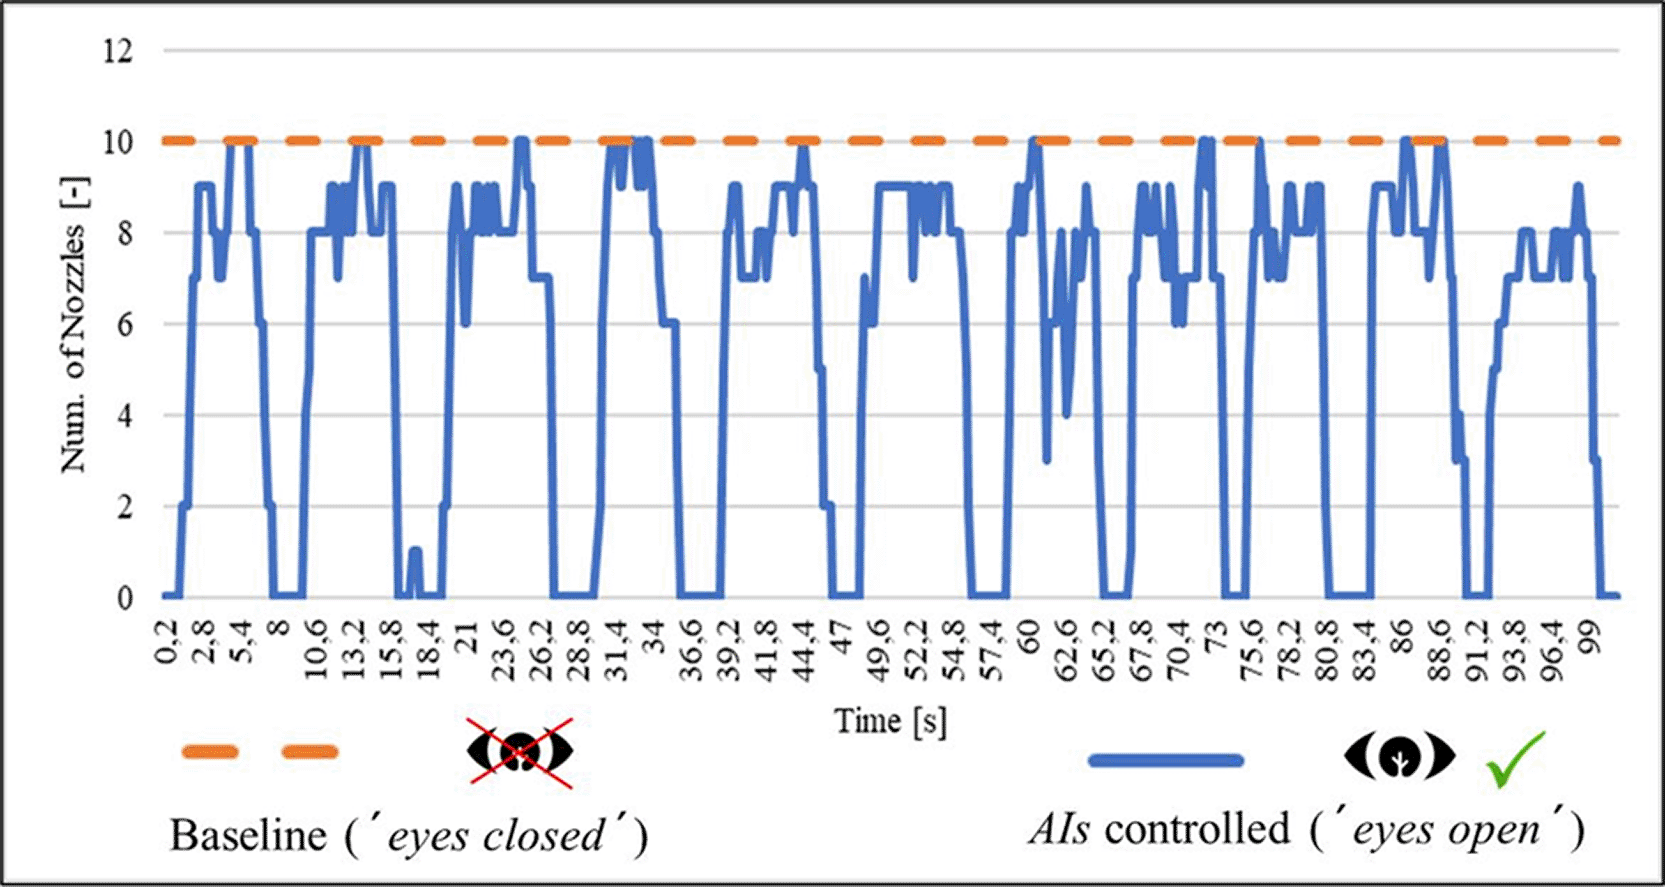
Fig. 6. Time series nozzle opening example in citrus case.
With the baseline sprayer manually adjusted to the maximum tree size, it operates with ten constantly open nozzles per side. However, the AIs-enabled sprayer dynamically regulates the number of nozzles, reaching a maximum of ten nozzles open per side. Thus, AIs control does not at any moment in time lead to an increase in spray volume, while in many instances, it leads to a spray volume reduction.19
The results of the spray volume reductions achieved in the citrus, almond, and olive cases are shown in Fig. 7 rounded to the nearest integer.
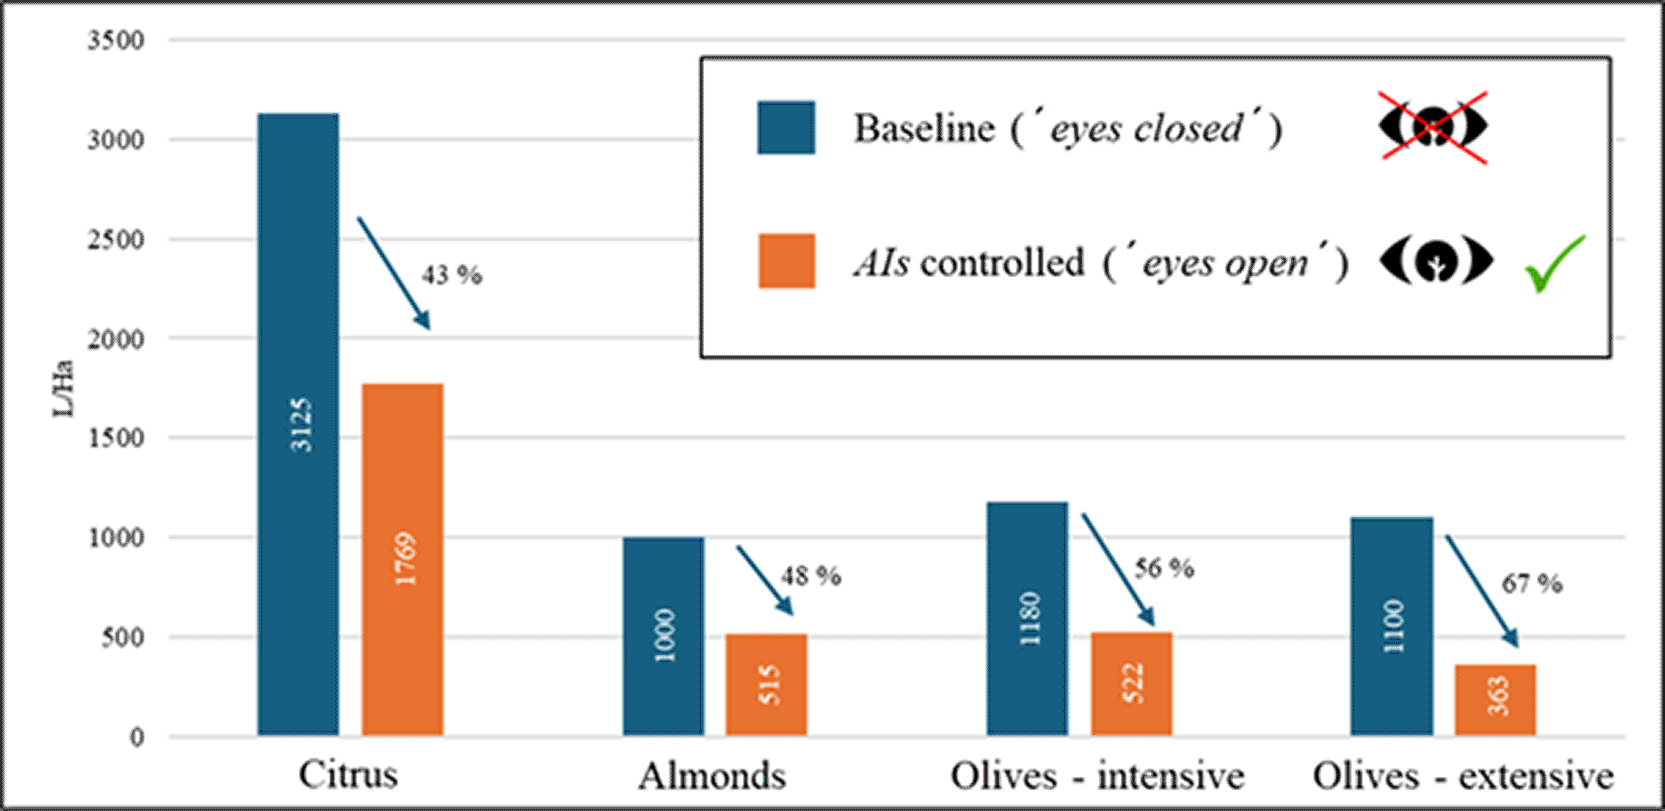
Fig. 7. Spray volume as applied in baseline and AIs case in Citrus, Almond and Olive fields.
Fig. 7 shows that AIs induced spray volume savings SAIs are 1329 L, 485 L, 658 L, and 737 L in citrus, almond, and intensive and extensive olive fields, respectively. This relates to savings percentages of 43%, 48%, 56%, and 67%, respectively, and is a clear indication that with AIs additional savings can be obtained in comparison to a high-end well-adjusted constant-rate sprayer.
Discussion
For our health and well-being, pesticide use in crop production needs to be reduced, which is also in line with EU policies such as the Green Deal and the Farm-to-Fork strategy. A significant percentage can already be gained by following the “Calibration of Orchard Sprayers” procedures, as in.17 Respective trials in the predecessor Life-F3 project12 revealed savings of up to 25% using manually well-adjusted spraying equipment.14
This work goes a step further and demonstrates additional savings of up to 67% even over a well-adjusted constant-rate sprayer owing to AIs enabled precision spraying.
To approximate and predict savings theoretically, let us make the simplifying assumption that tree crowns seen from the side can be represented by circles of diameter d. Denoting the tree spacing from trunk to trunk with r, the simplified 2D tree canopy area can then be modelled, as shown in Fig. 8,
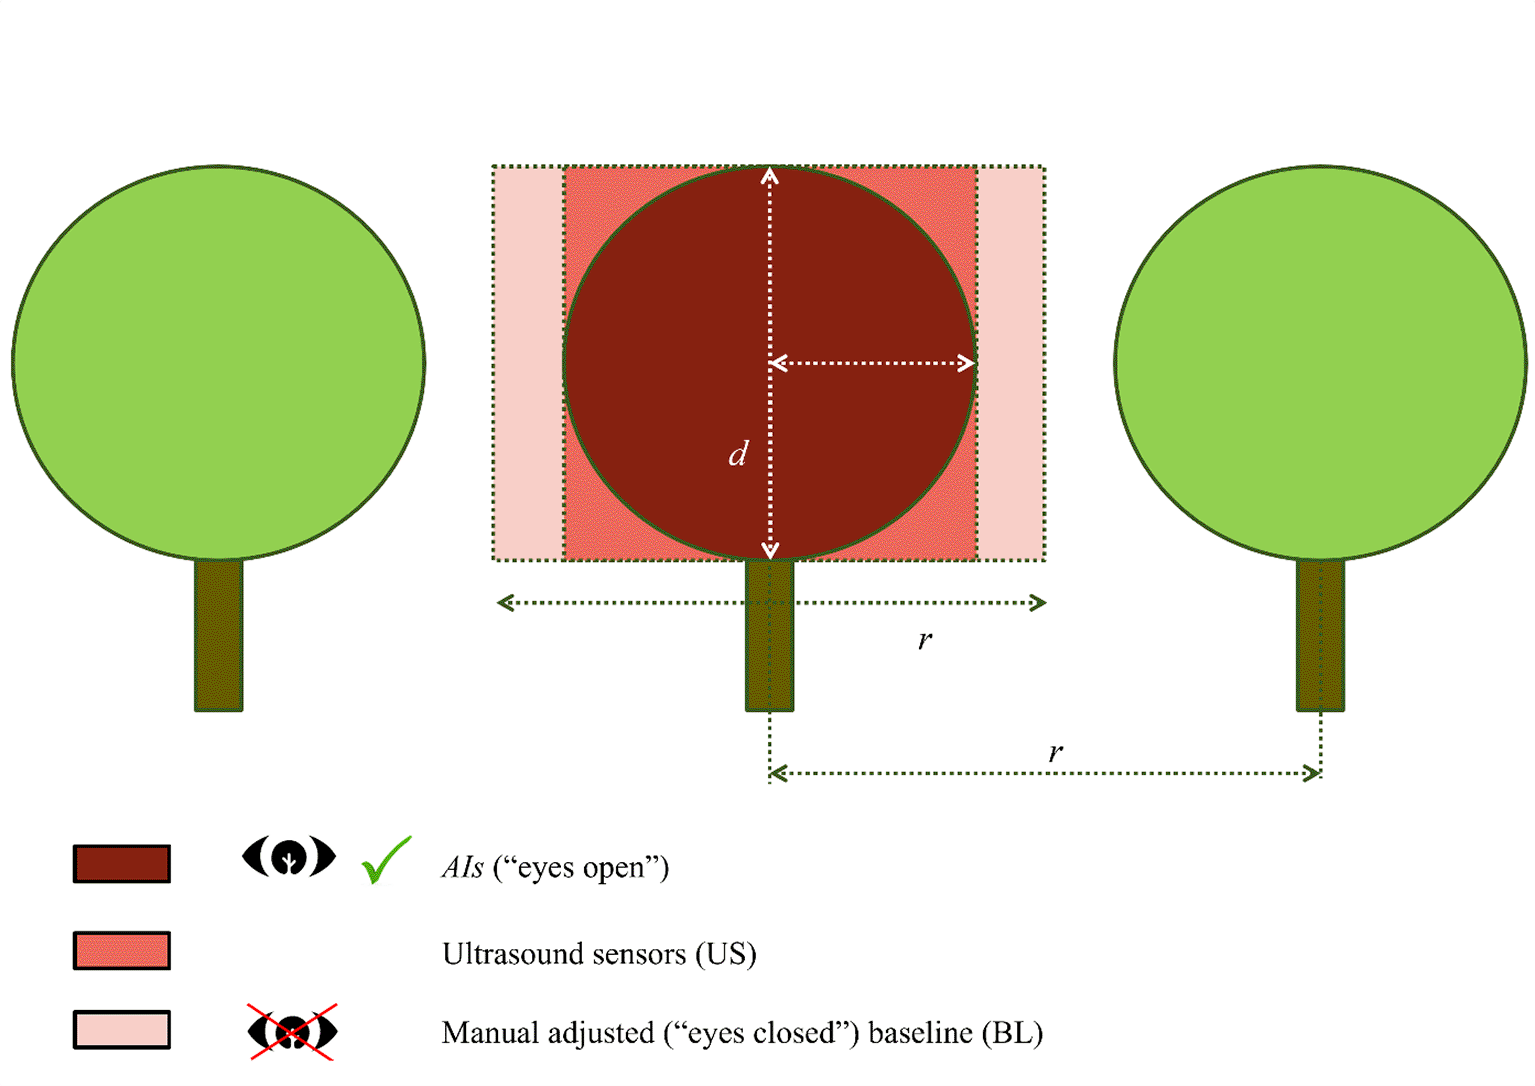
Fig. 8. Simplified 2D representation of the canopy area sprayed when “seen” in side view.
where
(equ. 5)
(equ. 6)
(equ. 7)
are the expressions for the surface under the ideal case. In Fig. 8, the light red rectangular area corresponds to the ideal area of a single tree sprayed with uniform constant rate baseline (BL) equipment, i.e. with eyes closed (equ. 7)). The medium red quadratic area corresponds to the ideal area sprayed when a single ultrasound sensor (US) per side is used to detect the presence of the canopy, which triggers the entire left or right side of the spray nozzles to turn on (equ. 6)).1 The dark red circular area indicates the ideal sprayed area using the AIs system (equ. 5)). Forming the quotient of these areas, the mathematical expressions for the savings upper bounds are
(equ. 8)
and,
(equ. 9)
for the ideal ultrasound (US) and ideal AIs case, respectively.
Table 1 presents a comparison of the predicted savings upper bounds from equ. 8) and equ. 9) with actual measured savings.
Table 1. Comparison of predicted and achieved spray volume savings for different field situations.
|
r
|
d
|
Qequivalent
|
Qapplied
|
S
|
s
|
ŝ
|
ŝ-s
|
|---|
| [m] | [m] | [L ha−1] | [L ha−1] | [L ha−1] | [−] | [−] | [−] |
|---|
| Citrus
| | | | | | | | |
| AIs
| 3.5 | 2.5 | 3125 | 1796 | 1329 | 43% | 44% | 1% |
| Almonds
| | | | | | | | |
| AIs
| 6 | 3.7 | 1000 | 515 | 485 | 48% | 52% | 3% |
| Olives intensive
| | | | | | | | |
| US
| 7 | 2.5 | 1180 | 689 | 491 | 42% | 64% | 23% |
| US´ (1.5 m) | 7 | 2.5 | 1180 | 689 | 491 | 42% | 43% | 1% |
| AIs
| 7 | 2.5 | 1180 | 522 | 658 | 56% | 72% | 16% |
| Olives extensive
| | | | | | | | |
| US
| 11 | 4.25 | 1100 | 595 | 505 | 46% | 61% | 15% |
| US´ (1.5 m) | 11 | 4.25 | 1100 | 595 | 505 | 46% | 48% | 2% |
| AIs
| 11 | 4.25 | 1100 | 363 | 737 | 67% | 70% | 3% |
The calculated savings upper bounds, ŝ, are, in all cases, higher than the actual savings obtained. This is due to real-world imperfections, such as the finite resolution of the AIs vision system and, more importantly, the finite granularity with which the spraying nozzle elements operate.
Moreover, especially for the ultrasound system (US), the difference between prediction and measurement was approximately 15 and 23 percent, respectively. Hence, it was investigated what could have caused this difference, and it was found that the US system was programmed to trigger nozzle opening slightly earlier and close slightly later than the actual observation, to stay on the safe side, and effectively treat slightly more than the canopy. It was found that the extra opening at the used speed of 3.6 km h−1 corresponds to 1.5 m. Adding these 1.5 m to d in equ. 8) delivers the modified US results in
Table 1, marked as US´ (1.5 m). Accounting for this known margin leads to predicted savings results that are now within 2 percentage points of the measured results (see the last column of
Table 1).
Regarding the AIs savings in
Table 1, it can be seen that mathematical upper bounds are, in most cases, very similar to the actual savings. Only in the case of AIs in Olive - intensive the mathematical upper bound exceeds the actual measured result by 16 percentage points.
Looking at the AIs savings upper bound in the intensive and extensive olive cases, it can be seen that the results remain with 72% and 70% within the same range. However, looking at the actually measured values, it is found that AIs performs in an Olive - extensive situation with a saving of 67%, even better than in the Olive - intensive case, with a saving of 56%. To obtain a better understanding of the underlying effects, consider the schematic drawing in Fig. 9, which sketches out what is happening when spraying with “real-world” AIs and US systems, where “real-world” refers to the fact that actual system implementations have a limited spraying resolution/spraying granularity.
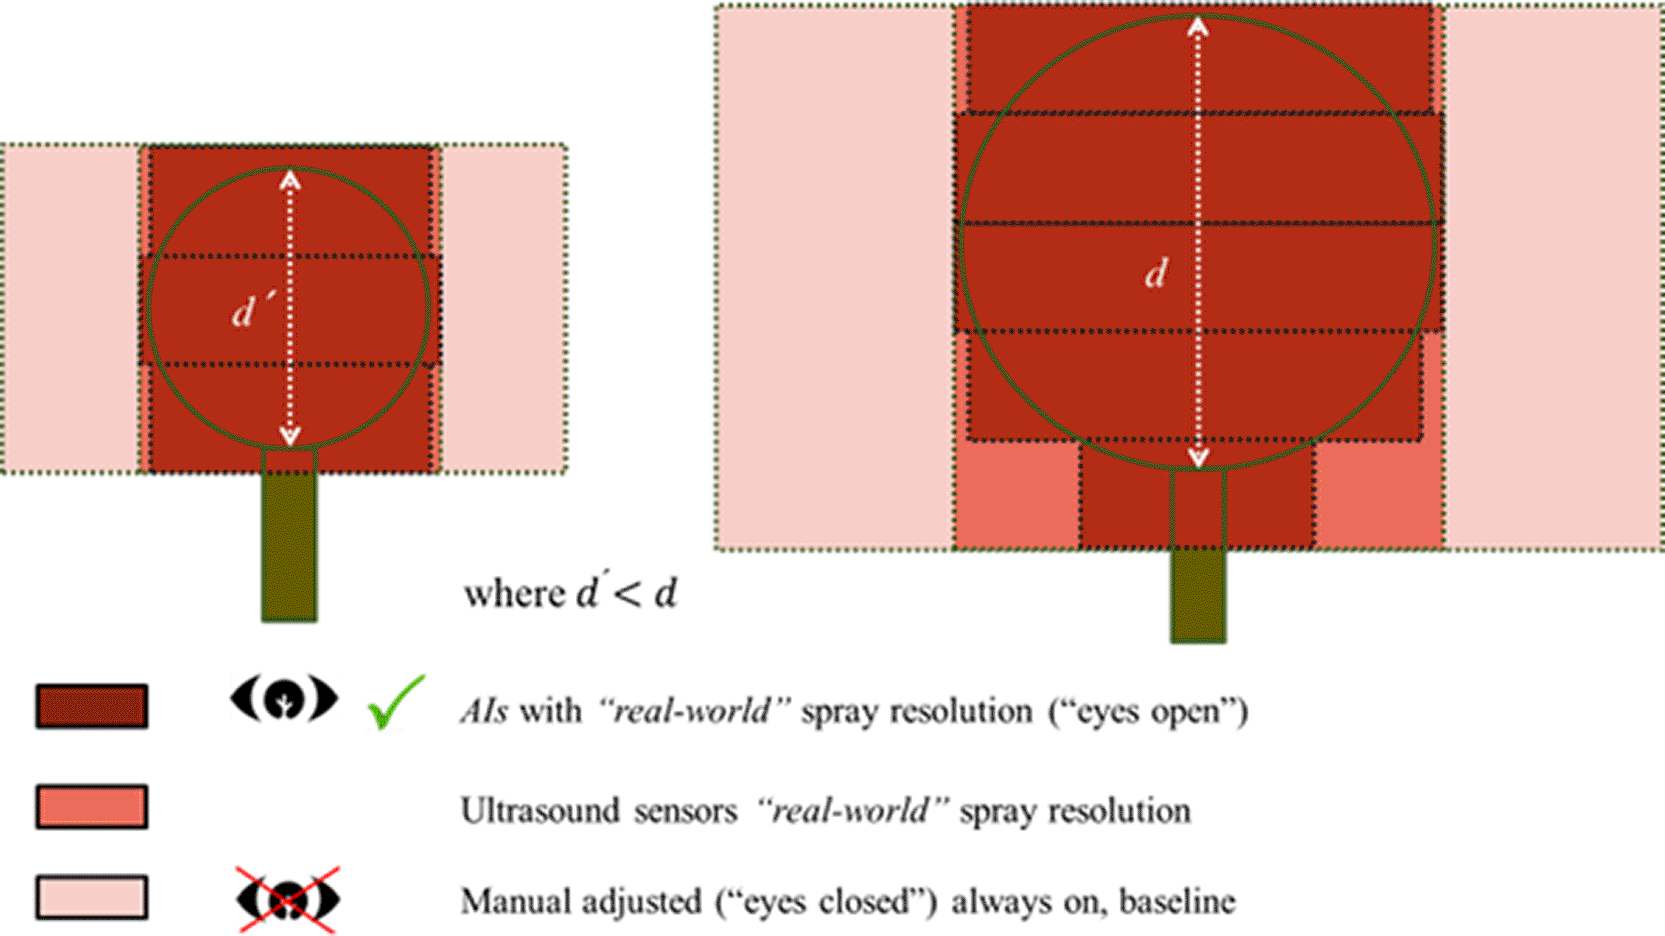
Fig. 9. Impact of non-ideal AIs resolution on savings result in small and big tree representation.
The left-hand side in Fig. 9 could, for example, represent the Olive-intensive
case with smaller trees, while the right-hand side could represent the Olive-extensive
case with larger trees.
The granularity of the spraying process is determined by two factors: resolution of the detection system and resolution of the spray pattern. The dark red bands symbolize the spray patterns that can be activated with AIs, the medium red rectangle symbolizes an entire side switched either on or off based on ultrasound sensor commands, and the light red rectangle symbolizes the area of the continuously on baseline. From the right-hand side in Fig. 9, it can be seen that the AIs spray bands largely follow the tree crown circumference, and there is a clear differentiation towards the medium red area sprayed by the US-based sprayer.2 However, when shifting to the smaller tree on the left (while not increasing the resolution of the sprayer), it can be seen that following the circumference of the crown is now much less accurate. Furthermore, the difference between AIs operation in bands and spray operation based on a single US diminishes. This effect of decreasing returns of AIs over the US for smaller trees is reflected by the savings advantage decreasing from 21 percentage points for Olives-extensive
to only 14 percentage points in Olives-intensive.
While AIs works well in all investigated situations, with savings results ranging from 42% to 67% in comparison to a high-end constant-rate sprayer, it should be noted that the effectively achievable savings depend on the variability of the canopy and the exploitability of gaps and their relationship to the sprayer resolution. In very heterogeneous canopies with little gaps/spacing between trees, less savings will be achievable, whereas in highly variable canopies with considerable tree gaps/spacing, or even missing trees, savings can be very significant. Moreover, if the spatial resolution of an AIs enabled sprayer stays constant, then higher saving percentages are expected in trees with larger crowns than in trees with smaller crowns because of AIs´ increased ability to follow the crown circumference in bigger trees. Moreover, it should be noted that the derived analytic saving upper bounds assume round tree crowns with spacing between trees. For other growing systems such as hedge-type orchards or vineyards, these predictions are not equally applicable and must be adjusted.
Overall, the presented results indicate that the latest advances in computer vision enabled specialty crop sprayer developments allow growers to significantly reduce their production costs due to PPP savings in line with EU objectives and in tune with the environment along the motto:
Ethics and consent
This study did not involve human participants, human data, identifiable personal information, animals, or biological samples requiring oversight. An ethical self-assessment was performed. Ethical approval and consent were not required.
Data Availability
The datasets supporting the findings of this study are openly available in the Zenodo repository under the title “Accompanying data to ‘Upper Bounds on real-time Spot Spraying of Tree and Bush Crops”.19 The dataset displays the comprising raw measurements relevant to the evaluation of real-time spot spraying performance in tree and bush crops.
DOI:
https://doi.org/10.5281/zenodo.18845206
.19
Citation: 1. Berger LT, Perales P, Esteve E, Alarcón J. Accompanying data to “Upper Bounds on real-time Spot Spraying of Tree and Bush Crops”. Zenodo; 2024.
All files in the dataset are made available under a Creative Commons Attribution 4.0 allowing re-distribution and re-use of a licensed work on the condition that the creator is appropriately credited.
Acknowledgements
The authors are very much in debt to the remaining Life-AIs
consortium partners. Parts of the presented article were first published in13,14,21,22 and are reused with friendly permission from the respective copyright holders, Association of Applied Biologists (AAB), and Suprofruit Contributors.
References
- 1.
World Health Organization (WHO):
Promoting fruit and vegetable consumption around the world. Information sheet.2019.
Reference Source
- 2.
Food and Agriculture Organization (FAO):
How to feed the world. Expert report.2009.
Reference Source
- 3.
Grethe H, Dembele A, Duman N:
How to feed the world’s growing billions.
Heinrich Böll Foundation & WWF Deutschland;
2011.
Reference Source
- 4.
Food and Agriculture Organization (FAO):
Preventing, anticipating and responding to high-impact animal and plant diseases and pests. Web press release.2020.
Reference Source
- 5.
European Commission:
Special Eurobarometer 354: food-related risks.2010.
Reference Source
- 6.
European Food Safety Authority:
The 2019 European Union report on pesticide residues in food.
EFSA J.
2021; 19(4): e06491.
- 7.
Directive 2009/128/EC of the European Parliament and of the Council of 21 October 2009 establishing a framework for Community action to achieve the sustainable use of pesticides.
Off. J. Eur. Union.
2009 Nov 24; L 309: 71–86.
- 8.
Regulation (EU) 2016/2031 of the European Parliament and of the Council of 26 October 2016 on protective measures against pests of plants.
Off. J. Eur. Union.
2016 Nov 23; L 317: 4–104.
- 9.
Moltó E, Rosell JR, Gil E, et al.:
Integrated strategies for a safe and efficient use of phytosanitary products.
Vida Rural.
2012; 353.
Reference Source
- 10.
Coscollà C, Hart E, Pastor A, et al.:
LC–MS characterization of contemporary pesticides in PM10 of Valencia Region, Spain.
Atmos. Environ.
2013; 77: 394–403. Publisher Full Text
- 11.
Blaschke U, Felkers E, Hewitt NJ, et al.:
Proposals for new spray drift exposure values in orchards and vineyards for residents and bystanders.
Asp. Appl. Biol.
2024; 148.
- 12.
European Climate, Infrastructure and Environment Executive Agency (CINEA):
Life Farm, Fresh Fruit. LIFE Public Database.;
2022.
https://webgate.ec.europa.eu/life/publicWebsite/project/LIFE18-ENV-ESReference Source
- 13.
Berger LT, Gil E, Ortega P:
Smartomizer – proactivity and traceability in orchard spray.
Suprofruit: 15th Workshop on Spray Application and Precision Technology in Fruit Growing.
East Malling, UK:
2019 Jul 16–18; 2019.
- 14.
Berger LT, Ukhandeeva E, Andreu F, et al.:
Life Farm, Fresh Fruit – effects of operator training and sprayer adjustments on agronomic inputs.
Asp. Appl. Biol.
2022; 147: 19–26.
- 15.
Gil E, Goñi JM, Mackay N, et al.:
Implications of Precision Application Technology for Refinement of Environmental Risk Assessment Default Representations: A Case Study.
Presented at: 15th European Conference on Precision Agriculture (ECPA 2025).
Barcelona, Spain:
29 June–3 July 2025.
- 16.
European Climate, Infrastructure and Environment Executive Agency (CINEA):
Life AIs – See & Save.
LIFE Public Database;
2024.
Reference Source
- 17.
Świechowski W, Godyń A, Hołownicki R, et al.:
Calibration of orchard sprayers – parameters and methods.
SPISE 4.
Lana, Italy:
Julius Kühn-Archiv;
2012.
- 18.
Government of Western Australia (GOVWAU):
SnapCard spray app.2023.
Reference SourceReference Source
- 19.
Berger LT, Perales P, Esteve E, et al.:
Accompanying data to "Upper Bounds on real-time Spot Spraying of Tree and Bush Crops".
Zenodo.
2024.
- 20.
Salas B, Ortega P, Berger LT, et al.:
Smart orchard sprayer to adjust pesticide dose to canopy characteristics.
Asp. Appl. Biol.
2022; 147: 157–164.
Reference Source
- 21.
Berger LT, Alarcon J, Perales P, et al.:
3D computer vision for real-time sprayer adjustments.
Suprofruit: 16th Workshop on Spray Application and Precision Technology in Fruit Growing.
Montpellier, France:
Agropolis International;
2023; p. 15–16. Publisher Full Text
Reference Source
- 22.
Berger LT, Perales P, Alarcon J:
Real-time variable rate spraying based on 3D visual inputs.
Asp. Appl. Biol.
2024; 148: 81–88.