Introduction
More than 60% of global primary energy consumption is ultimately dissipated as waste heat1, and recovering this energy could significantly contribute to reducing greenhouse gas emissions. Thermoelectric (TE) devices provide a direct route to waste-heat harvesting by converting temperature gradients into electricity.2,3 Their solid-state nature enables silent, reliable operation and long service lifetimes with minimal maintenance owing to the absence of moving parts.4,5 TE generators can be integrated across a wide range of energy systems,6 with demonstrated applications ranging from gas pipelines, spacecraft power systems, and marine engines to domestic biomass stoves and wearable electronics.7–13
Unlike mechanical heat engines, which are typically suited to large-scale power generation,14,15 thermoelectrics offer distinct advantages in waste-heat recovery applications where simplicity, reliability, and design flexibility often outweigh the need for maximum efficiency. In addition, they are also well suited to low-power operation16 and cooling applications.17 Nevertheless, the widespread deployment of TE technologies remains constrained by the scarcity, toxicity, and cost of many high-performance materials.18–20 Consequently, there is a strong need for compounds that combine competitive TE performance with earth-abundant composition.
In this context, tetrahedrite (Cu12Sb4S13) emerges as a compelling candidate for mid-temperature TE power generation (∼ 350 °C).21,22 Tetrahedrite is a non-toxic, low-cost p-type semiconductor and the most abundant sulphosalt in the Earth’s crust. As it is often discarded as gangue during Cu and Zn mining, it offers an opportunity for waste valorisation and resource efficiency,23–25 reducing reliance on primary materials while mitigating environmental impacts associated with sulphide waste, including acid mine drainage.26
High TE efficiency requires a large Seebeck coefficient (S), high electrical conductivity (σ), and low thermal conductivity (
), the latter comprising an electronic component from charge-carrier transport (Ke) and a lattice component from phonon transport (Kl).2,13 However, these properties cannot be optimised independently because κe is coupled to σ through the Wiedemann–Franz law. These competing requirements are captured by the dimensionless figure of merit, defined as
27–29 Efficient TE materials are typically semiconductors, in which the characteristic dependence of σ, S, and κ on carrier-concentration (n) maximizes zT30 (
Figure 1a). Performance can be further enhanced by suppressing κl through phonon scattering,31 in combination with tuning n to lower Ke and increase S. Provided the associated decrease in σ remains moderate, this shifts transport toward the optimal balance of transport properties32 (
Figure 1b).
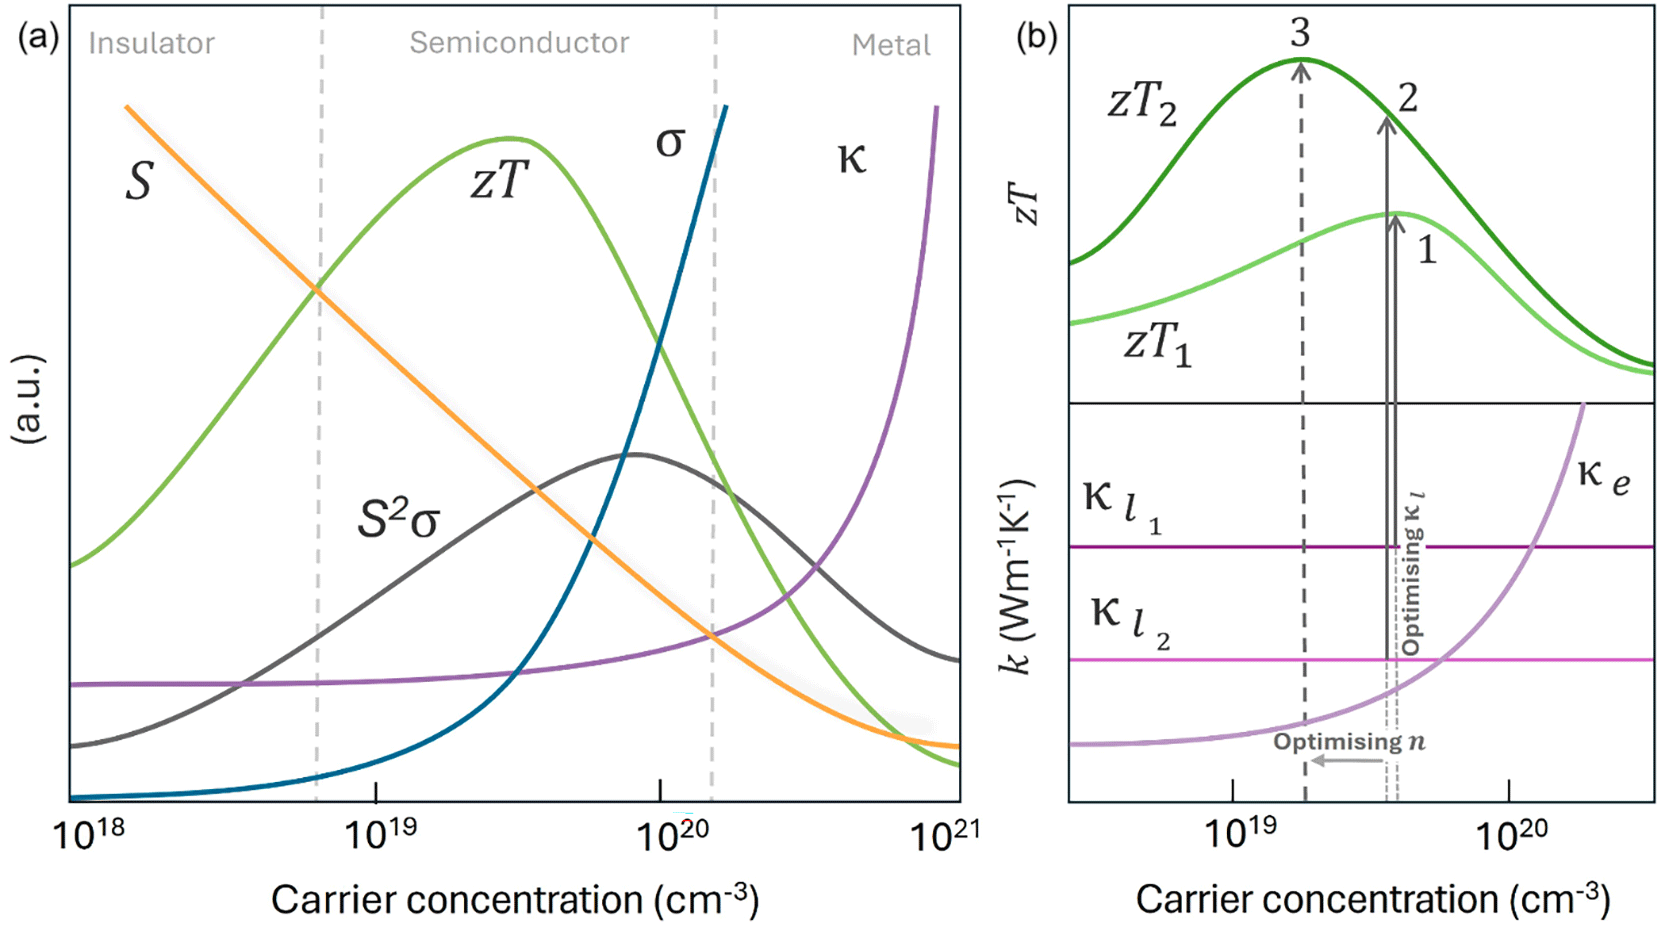
Figure 1. Tuning TE performance.
(a) Transport properties vs. carrier concentration across material classes. (b) Strategies to maximise zT: reducing the relatively n-independent 𝜅l through enhanced phonon scattering (1→2), and lowering n to decrease 𝜅e while increasing S, shifting performance toward the optimal regime (3). Adapted from Snyder et al.32
Interest in tetrahedrite as a TE material grew in the 2010s when its exceptionally low Kl was reported.23,33 The compound crystallises in a complex body-centred cubic structure (space group
) with a lattice parameter a ≈ 10.33 Å and 58 atoms per conventional unit cell34 (
Figure 2a). The framework contains two distinct Cu sites (Cu(1) at 12d and Cu(2) at 12e) and two distinct S sites (S(1) at 24g and S(2) at 2a), while Sb occupies a single position (8c).35,36 Cu(1) is tetrahedrally coordinated by S(1) (
Figure 2b), whereas Cu(2) adopts a trigonal–planar coordination with two S(1) and one S(2) atoms, forming CuS3 units on {110} planes (
Figure 2c). Six such triangles assemble into Cu6S13 clusters centred on S(2), generating sodalite-like truncated octahedra37 (
Figure 2d). Sb is coordinated by three S(1) nearest-neighbours in pyramidal SbS3 units (
Figure 2e). In addition, it interacts with nearby CuS3 units resulting in trigonal-bipyramidal Sb[CuS3]Sb cages with an enclosed central Cu(2) atom, reminiscent of frameworks found in skutterudites and clathrates38 (
Figure 2f). The stereochemically active lone electron pairs on Sb atoms generate electrostatic repulsion of the encapsulated Cu(2) atoms, driving a characteristic rattling motion perpendicular to the trigonal S plane.39,40 Displacements approaching 0.8 Å induce pronounced lattice anharmonicity, strongly enhancing thermal phonon scattering and underpinning the intrinsically low Kl.41
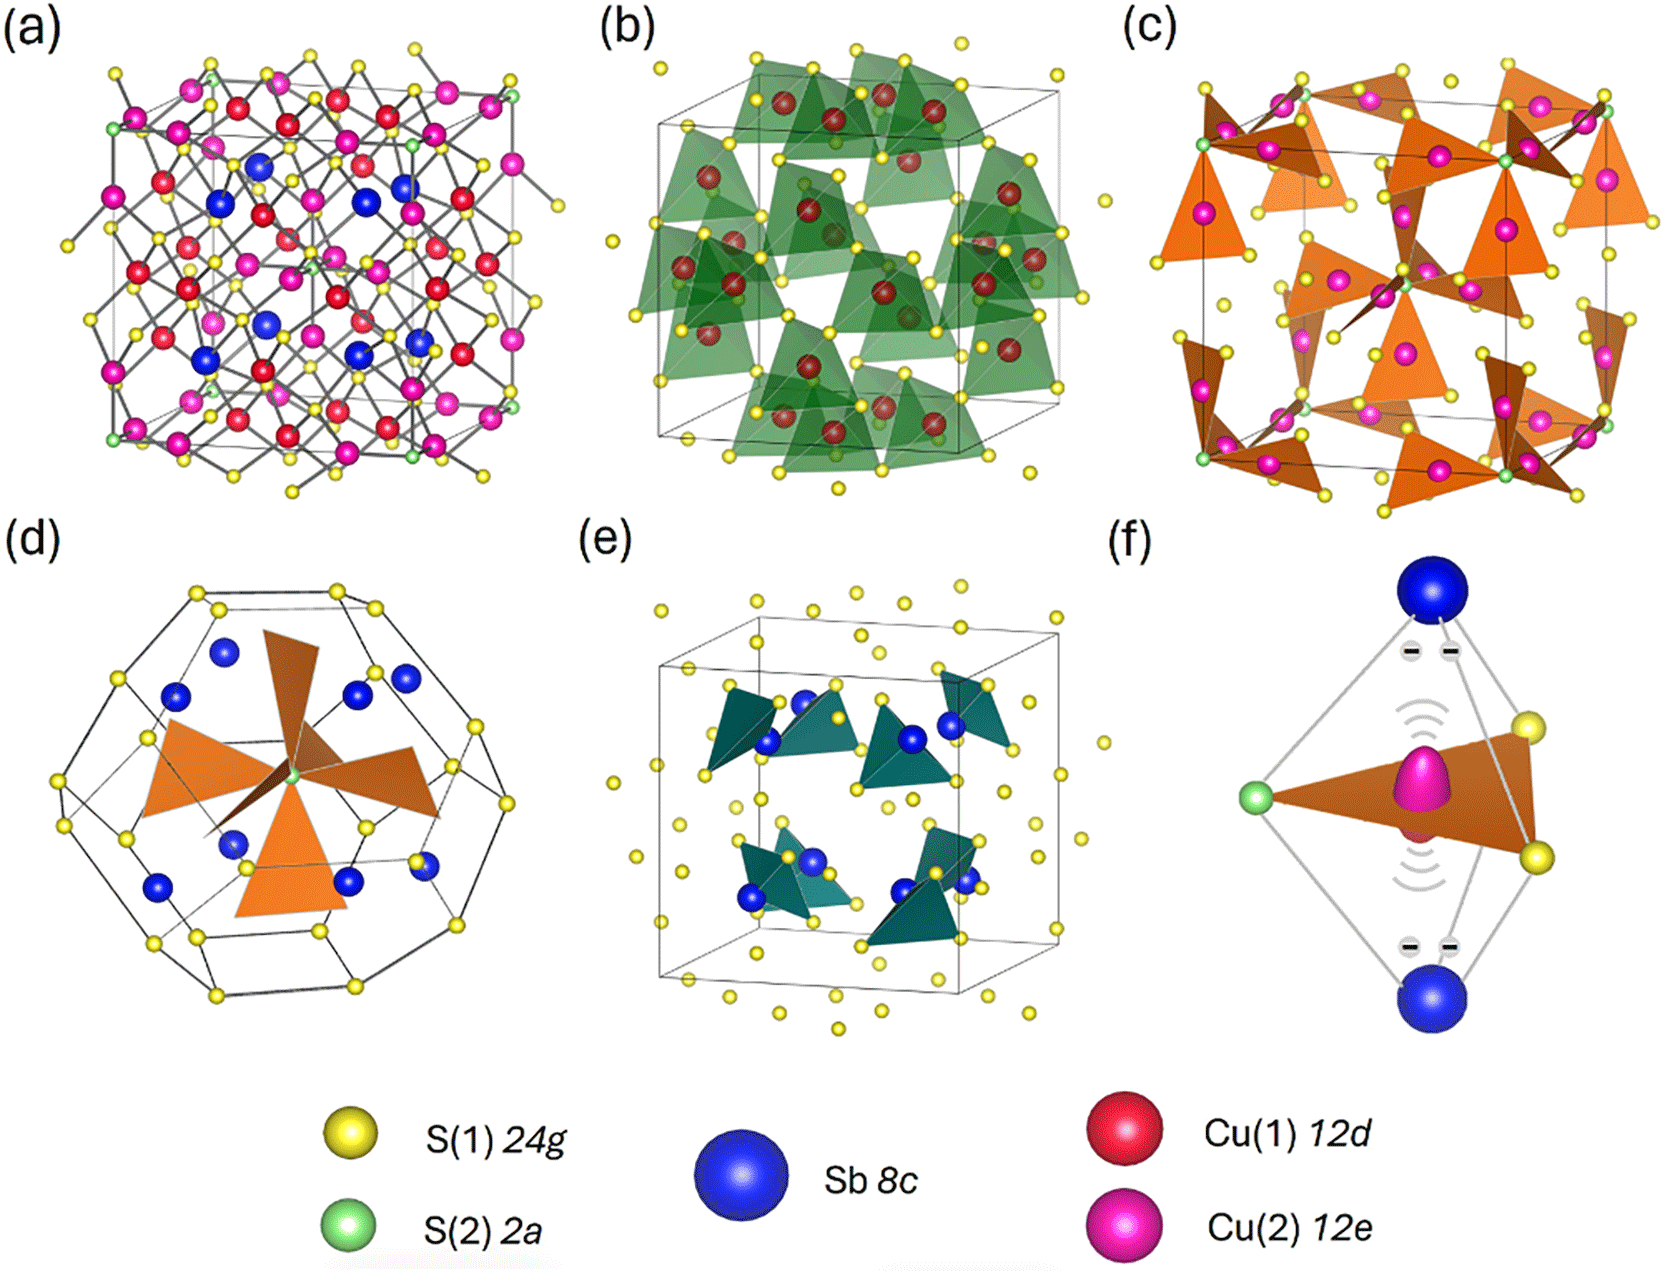
Figure 2. Tetrahedrite crystal structure.
(a) Conventional unit cell of Cu12Sb4S13. (b) CuS4 tetrahedra each formed with one Cu(1) (12d) and four S(1) (24g) atoms. (c) Cu(2) (12e) trigonal-planar coordinated with two S(1) (24g) and one S(2) (2a) atoms. (d) Cu6S13 cluster inside an S(1) truncated octahedron. (e) SbS3 trigonal pyramids where Sb is coordinated by S(1). (f
) Cage-like Sb[CuS3]Sb trigonal-bipyramid framework enclosing each Cu(2), which rattles between Sb lone pairs. The displacement ellipsoid is shown at the 90% probability level. Structural models created with VESTA.42
The oxidation state of Cu in tetrahedrite remains debated. The most common interpretation describes tetrahedrite as a mixed-valence system, in which tetrahedrally coordinated Cu(1) ions adopt both Cu+ and Cu2+ states, often represented as:
, where t, tr, π, and o denote triangular, tetrahedral, pyramidal, and octahedral coordination, respectively.43 The two Cu2+ ions, located in the tetrahedral Cu(1) sites, introduce holes into the structure40,43,44 and are preferentially substituted during doping, which is consistent with the commonly reported limit of two substitutional atoms per formula unit.45 This model is supported by spectroscopic studies, including near-edge X-ray absorption fine structure (NEXAFS) and X-ray photoelectron spectroscopy (XPS), which report signatures of both Cu+ and Cu2+ states.46–48 However, the Cu2+ features are typically weak and often approach the noise level, limiting the robustness of the assignment. Moreover, strong electronic delocalisation within metal–sulphur bonds, characteristic of Cu-rich sulphides, further challenges the validity of a Cu mixed-valence description.
An alternative interpretation proposes that all Cu ions remain monovalent, with unoccupied states arising from band-structure effects.24,49 Consistent with this model, density functional theory (DFT) calculations indicate that two holes per formula unit—corresponding to the formal
composition—are delocalized throughout the lattice (Figure 2d).37 Tetrahedrite is predicted to be an indirect band-gap semiconductor with a gap of 1.2–1.7 eV and a Fermi level located near, or even within, the valence band, giving rise to highly degenerate p-type behaviour.23,50 In this model, strong Cu 3d – S 3p hybridisation dominates the valence band, promoting hole delocalisation and enabling quasi-metallic transport.
The electronic flexibility of tetrahedrites gives rise to an accommodating crystal that supports multiple chemical substitutions as evidenced by the partial substitution of Cu with Fe, Zn and Ag, and of Sb with As in natural tetrahedrites.25,51,52 This versatility has enabled a broad range of doping strategies in synthetic materials.22,53 However, despite extensive exploration, reported TE performance of tetrahedrites varies inconsistently across the literature reflecting differences in doping strategy, synthesis route and sintering conditions.
Existing data resources provide only limited support for systematic studies: for example, the Starrydata database compiles transport properties from the literature but currently includes only a small number of tetrahedrite entries (≈20), restricting its utility for comparative studies.54 Similarly, available reviews lack a unified framework capable of separating the respective contributions of composition and processing.55–57
To address this gap, a comprehensive meta-analysis was performed using virtually all available transport data for mechanochemically synthesised, pressure-assisted sintered tetrahedrites, spanning 58 studies and more than 6,000 data points. Performance was normalised to account for the intrinsic temperature dependence of zT, enabling statistically consistent comparison across compositions and processing conditions. Complementary experimental observations and first-principles calculations were used to interpret and contextualise the results.
The analysis reveals that, at the current stage of development, dopant chemistry plays a secondary role in determining TE performance, whereas processing quality dominates the observed variability. Beyond tetrahedrites, this work illustrates how literature-scale datasets can reveal hidden processing variables in functional materials, for which nominal composition is often overemphasised, and provides a transferable framework for separating intrinsic chemical contributions from extrinsic microstructural variability across TE materials.
Methods
Data analysis
Data were extracted from published figures through a combination of automated and manual digitisation. Automated retrieval was performed using PlotExtract, an artificial intelligence-based graph-digitisation workflow,58 followed by systematic validation against the original figures. In cases where overlapping curves, dense data points, or graphical annotations prevented reliable automated parsing, manual digitisation was performed using WebPlotDigitizer.59 Approximately 1,000 curves were processed, yielding more than 6,000 transport-property data points representing 276 tetrahedrite samples. The compositions and corresponding references are listed in
Table 1. Approximately half of the dataset required manual digitisation owing to limitations in fully automated extraction. The resulting database is openly available.60 Nanoparticle-based materials,61–66 composites,67–69 mineral-derived samples,70,71 and materials prepared by alternative routes (e.g., solvothermal synthesis)72–75 were excluded to ensure methodological comparability, although these classes may be incorporated in future updates.
Table 1. Thermoelectric properties of tetrahedrites at 350 °C.
| Composition |
zT
|
S μV/K |
σ S/m |
κ W/(mK) |
D % | Ref. |
Composition |
zT
|
S μV/K |
σ S/m |
κ W/(mK) |
D % |
Ref. |
|---|
| Undoped
|
| Cu12Sb4S13 | 0.45 | 122.7 | 2.27 | - | 98 | 23 | Cu12Sb4S13 | - | - | - | - | 96 | 127 |
| Cu12Sb4S13 | 0.49 | 121.3 | 7.69 | 1.48 | 98 | 24 | Cu12Sb4S13 | 0.69 | 173.0 | 3.00 | 0.80 | 99 | 128 |
| Cu12Sb4S13 | - | - | - | - | 75 | 33 | Cu12Sb4S13 | 0.49 | 122.9 | 7.17 | 1.46 | 95 | 129 |
| Cu12Sb4S13 | 0.64 | 122.5 | 10.00 | 1.37 | - | 43 | Cu12Sb4S13 | 0.76 | 137.0 | 9.09 | 1.37 | 95 | 134 |
| Cu12Sb4S13 | 0.64 | 145.0 | 6.80 | 1.37 | 95 | 47 | Cu12Sb4S13 | 0.43 | 110.0 | 8.40 | 1.52 | 96 | 136 |
| Cu12Sb4S13 | 0.70 | - | - | - | 98 | 48 | Cu12Sb4S13 | 0.77 | 127.0 | 8.33 | 1.16 | 90 | 140 |
| Cu12Sb4S13 | 0.02 | 138.0 | 0.19 | 0.65 | 93 | 77 | Cu12Sb4S13 | 0.46 | 116.0 | 7.10 | 1.45 | 98 | 141 |
| Cu12Sb4S13 | 0.44 | 114.0 | 8.40 | 1.54 | 96 | 96 | Cu12Sb4S13 | 0.39 | 122.0 | 7.20 | 1.72 | 98 | 143 |
| Cu12Sb4S13 | 0.15 | 160.0 | 0.50 | 0.38 | 94 | 97 | Cu12Sb4S13 | 0.46 | 122.0 | 7.14 | 1.46 | - | 144 |
| Cu12Sb4S13 | - | - | - | - | 88 | 100 | Cu12Sb4S13 | 0.30 | 119.0 | 3.20 | 0.96 | 86 | 145 |
| Cu12Sb4S13 | 0.54 | 135.0 | 5.26 | 1.20 | 98 | 102 | Cu12Sb4S13 | 0.44 | 110.0 | 8.80 | 1.60 | 96 | 146 |
| Cu12Sb4S13 | 0.76 | 130.0 | 10.50 | 1.32 | 95 | 103 | Cu12Sb4S13 | 0.61 | 122.0 | 6.80 | 0.99 | 99 | 148 |
| Cu12Sb4S13 | 0.69 | 175.0 | 3.00 | 0.82 | - | 106 | Cu12Sb4S13 | 0.69 | 175.0 | 2.90 | 0.80 | 99 | 153 |
| Cu12Sb4S13 | 0.64 | 155.0 | 3.80 | 0.95 | - | 106 | Cu12Sb4S13 | 0.43 | 122.3 | 7.14 | 1.49 | 98 | 154 |
| Cu12Sb4S13 | 0.62 | 150.0 | 3.90 | 0.92 | - | 106 | Cu12Sb4S13 | 0.42 | 120.0 | 7.14 | 1.45 | 95 | 155 |
| Cu12Sb4S13 | 0.60 | 170.0 | 2.90 | 0.90 | - | 106 | Cu12Sb4S13 | 0.60 | 245.0 | 0.91 | 0.55 | 95 | 156 |
| Cu12Sb4S13 | 0.50 | 194.0 | 1.89 | 0.80 | 99 | 107 | Cu12Sb4S13 | 0.61 | 245.0 | 1.00 | 0.58 | 95 | 156 |
| Cu12Sb4S13 | 0.55 | 154.4 | 4.42 | 1.11 | 95 | 109 | Cu12Sb4S13 | 0.80 | 155.0 | 5.50 | 0.93 | 99 | 157 |
| Cu12Sb4S13 | 0.48 | 136.0 | 5.23 | 1.21 | 95 | 109 | Cu12Sb4S13 | 0.69 | 176.0 | 3.00 | 0.77 | 99 | 158 |
| Cu12Sb4S13 | 0.45 | 134.5 | 4.99 | 1.24 | 95 | 109 | Cu12Sb4S13 | 0.70 | 167.0 | 3.60 | 0.90 | 99 | 158 |
| Cu12Sb4S13 | 0.40 | 127.8 | 5.19 | 1.28 | 95 | 109 | Cu12Sb4S13 | 0.60 | 186.0 | 2.30 | 0.80 | 99 | 155 |
| Cu12Sb4S13 | 0.39 | 128.3 | 5.08 | 1.32 | 95 | 109 | Cu12Sb4S13 | 0.42 | 120.0 | 8.00 | 1.74 | 97 | 159 |
| Cu12Sb4S13 | 0.41 | 125.0 | 8.00 | 1.73 | 96 | 113 | Cu12Sb4S13 | 0.48 | 123.0 | 7.60 | 1.49 | 95 | 160 |
| Cu12Sb4S13 | 0.44 | 113.0 | 8.30 | 1.50 | 96 | 118 | Cu12Sb4S13 | 0.69 | 125.0 | 7.50 | 0.99 | - | 161 |
| Cu12Sb4S13 | 0.00 | 140.0 | 0.00 | 1.15 | 95 | 119 | Cu12Sb4S13 | 0.50 | 125.0 | 7.75 | 1.40 | 95 | 162 |
| Cu deficiency
|
| Cu11.9Sb4S13 | 0.70 | 155.0 | 4.10 | 0.82 | 99 | 128 | Cu11.7Sb4S13 | 0.60 | 150.0 | 4.50 | 1.00 | 99 | 128 |
| Cu11.8Sb4S13 | 0.65 | 155.0 | 3.50 | 0.82 | 99 | 128 | |
| Cu excess
|
| Cu12.1Sb4S13 | 0.60 | 194.0 | 1.50 | 0.60 | 99 | 128 | Cu13Sb4S13 | 0.67 | 163.0 | 2.46 | 0.59 | 95 | 129 |
| Cu12.2Sb4S13 | 0.68 | 204.0 | 1.50 | 0.60 | 99 | 128 | Cu13Sb4S12Se | 0.78 | 142.4 | 5.59 | 0.91 | 95 | 129 |
| Cu12.3Sb4S13 | - | - | - | - | 96 | 127 | Cu13.5Sb4S13 | - | - | - | - | 96 | 127 |
| Cu12.3Sb4S13 | 0.60 | 208.0 | 1.30 | 0.60 | 99 | 128 | Cu13.5Sb4S13 | 0.85 | 180.0 | 2.09 | 0.48 | 95 | 129 |
| Cu12.5Sb4S13 | 0.51 | 136.0 | 3.52 | 0.81 | 95 | 129 | Cu13.5Sb4S12Se | 0.80 | 159.7 | 3.77 | 0.76 | 95 | 129 |
| Cu12.5Sb4S12Se | 0.76 | 124.0 | 7.13 | 0.89 | 95 | 129 | Cu14Sb4S13 | - | - | - | - | 96 | 127 |
| Cu13Sb4S13 | - | - | - | - | 96 | 127 | |
| Al doping (Cu)
|
| Cu11.9Al0.1Sb4S13 | 0.54 | 121.5 | 6.80 | 1.19 | 96 | 115 | Cu11.5Al0.5Sb4S13 | 0.47 | 126.4 | 5.30 | 1.12 | 95 | 115 |
| Cu11.75Al0.25Sb4S13 | 0.53 | 122.3 | 6.60 | 1.18 | 96 | 115 | Cu11.25Al0.75Sb4S13 | 0.42 | 130.2 | 4.48 | 1.10 | 94 | 115 |
| Mg doping (Cu)
|
| Cu11.5Mg0.5Sb4S13 | 0.46 | 135.0 | 4.45 | 1.01 | 95 | 162 | Cu10.5Mg1.5Sb4S13 | 0.51 | 160.0 | 2.33 | 0.72 | 95 | 162 |
| Cu11MgSb4S13 | 0.49 | 155.0 | 3.24 | 0.92 | 95 | 162 | |
| Cr doping (Cu)
|
| Cu11.85Cr0.15Sb4S13 | 0.61 | 138.0 | 6.67 | 1.24 | 93 | 108 | Cu11.5Cr0.5Sb4S13 | 0.70 | 155.0 | 5.00 | 1.05 | 93 | 108 |
| Cu11.75Cr0.25Sb4S13 | 0.64 | 130.0 | 8.33 | 1.22 | 89 | 108 | Cu11.25Cr0.75Sb4S13 | 0.73 | 167.0 | 3.23 | 0.82 | 95 | 108 |
| Cu11.65Cr0.35Sb4S13 | 0.85 | 185.0 | 2.78 | 0.71 | 97 | 108 | Cu11CrSb4S13 | 0.43 | 167.0 | 3.23 | 0.82 | 94 | 108 |
| Mn doping (Cu)
|
| Cu11.5Mn0.5Sb4S13 | - | - | - | - | 85 | 100 | Cu11MnSb4S13 | 0.48 | 170.0 | 1.80 | 0.65 | 94 | 101 |
| Cu11.5Mn0.5Sb4S13 | 0.56 | 139.2 | 5.00 | 1.24 | 95 | 43 | Cu11MnSb4S13 | 0.33 | 264.0 | 0.42 | 0.53 | 97 | 107 |
| Cu11.5Mn0.5Sb4S13 | 0.75 | 142.0 | 4.50 | 0.76 | - | 161 | Cu10.6Mn1.4Sb4S13 | 0.34 | 230.0 | 0.77 | 0.78 | 95 | 134 |
| Cu11.1Mn0.9Sb4S13 | 0.46 | 167.0 | 2.95 | 1.10 | 95 | 134 | Cu10.5Mn1.5Sb4S13 | - | - | - | - | 85 | 100 |
| Cu11.6Mn0.4Sb4S13 | 0.56 | 135.0 | 6.17 | 1.22 | 95 | 134 | Cu10.2Mn1.8Sb4S13 | 0.18 | 330.0 | 0.15 | 0.62 | 98 | 134 |
| Cu11MnSb4S13 | - | - | - | - | 85 | 100 | Cu10Mn2Sb4S13 | - | - | - | - | 75-80 | 33 |
| Cu11MnSb4S13 | 0.59 | 215.0 | 1.10 | 0.54 | - | 161 | Cu10Mn2Sb4S13 | - | - | - | - | 88 | 100 |
| Cu11MnSb4S13 | 0.61 | 175.0 | 2.20 | 0.68 | 96 | 101 | Cu10Mn2Sb4S13 | 0.35 | 332.0 | 0.20 | 0.32 | - | 161 |
| Fe doping (Cu)
|
| Cu11.9Fe0.1Sb4S13 | 0.53 | 172.8 | 2.59 | 0.87 | 99 | 110 | Cu11FeSb4S13 | 0.36 | 235.0 | 0.50 | 0.48 | 93 | 132 |
| Cu11.8Fe0.2Sb4S13 | 0.61 | 187.0 | 2.06 | 0.72 | 100 | 110 | Cu10FeZnSb4S13 | 0.03 | 212.0 | 0.10 | 1.10 | 95 | 119 |
| Cu11.8Fe0.2Sb4S13 | - | - | - | - | 98 | 154 | Cu10.7Fe1.3Sb4S13 | 0.25 | 235.0 | 0.29 | 0.39 | 93 | 132 |
| Cu11.7Fe0.3Sb4S13 | 0.55 | 211.4 | 1.31 | 0.65 | 100 | 110 | Cu10.5Fe1.5Sb4S13 | 0.06 | 271.0 | 0.04 | 0.37 | 87 | 77 |
| Cu11.6Fe0.4Sb4S13 | 0.39 | 234.6 | 0.70 | 0.61 | 98 | 110 | Cu10Fe2Sb4S13 | - | - | - | - | 75-80 | 33 |
| Cu11.5Fe0.5Sb4S13 | 0.54 | 168.3 | 3.33 | 1.09 | 95 | 43 | Cu10Fe2Sb4S13 | 0.02 | 196.0 | 0.04 | 0.43 | 85 | 77 |
| Cu11.5Fe0.5Sb4S13 | - | - | - | - | 98 | 154 | Cu10Fe2Sb4S13 | - | - | 0.01 | 0.20 | 85 | 100 |
| Cu11FeSb4S13 | 0.10 | 190.0 | 0.24 | 0.55 | 98 | 107 | |
| Co doping (Cu)
|
| Cu11.8Co0.2Sb4S13 | 0.73 | 171.5 | 3.10 | 0.76 | 99 | 163 | Cu11CoSb4S13 | 0.71 | 187.0 | 3.27 | 1.03 | 95 | 56 |
| Cu12.18Co0.25Sb3.68Te0.62S13 | 0.55 | 145.0 | 5.20 | 0.93 | 92 | 150 | Cu11CoSb4S13 | 0.34 | 290.0 | 0.35 | 0.55 | 98 | 107 |
| Cu11.88Co0.32Sb3.11Te1.05S13 | 0.58 | 180.0 | 2.55 | 0.76 | 92 | 150 | Cu11CoSb4S13 | 0.51 | 251.8 | 0.80 | 0.58 | 98 | 163 |
| Cu11.6Co0.4Sb4S13 | 0.59 | 191.0 | 2.10 | 0.80 | 98 | 163 | Cu10.7Co1.3Sb4S13 | 0.64 | 171.7 | 2.12 | 0.68 | 92 | 150 |
| Cu11.67Co0.47Sb3.36Te0.77S13 | 0.57 | 170.0 | 3.10 | 0.77 | 92 | 150 | Cu10.5Co1.5Sb4S13 | 0.72 | 230.0 | 1.71 | 0.72 | 95 | 150 |
| Cu11.5Co0.5Sb4S13 | 0.79 | 157.2 | 6.00 | 1.24 | 98 | 43 | Cu10.49Co1.51Sb4S13 | 0.59 | 199.3 | 1.51 | 0.60 | 92 | 150 |
| Cu11.5Co0.5Sb4S13 | 0.80 | 158.0 | 6.25 | 1.25 | 95 | 56 | Cu10.3Co1.7Sb4S13 | 0.56 | 219.0 | 0.94 | 0.53 | 92 | 150 |
| Cu11.4Co0.6Sb4S13 | 0.61 | 198.9 | 1.90 | 0.74 | 98 | 163 | Cu10Co2Sb4S13 | - | - | - | - | 75-80 | 33 |
| Cu11.2Co0.8Sb4S13 | 0.50 | 234.1 | 0.90 | 0.62 | 97 | 163 | Cu10Co2Sb4S13 | 0.25 | 288.0 | 0.27 | 0.62 | 95 | 56 |
| Cu11.47Co0.82Sb3.78Te0.41S13 | 0.69 | 175.0 | 6.10 | 0.81 | 92 | 150 | Cu10Co2Sb4S13 | - | - | - | - | 85 | 100 |
| Cu11.1Co0.9Sb4S13 | 0.65 | 157.0 | 3.00 | 0.76 | 92 | 150 | |
| Ni doping (Cu)
|
| Cu11.5Ni0.5Sb4S13 | 0.54 | 125.0 | 7.04 | 1.37 | 96 | 96 | Cu10NiZnSb4S13 | 0.52 | 250.0 | 0.66 | 0.50 | 95 | 156 |
| Cu11.5Ni0.5Sb4S13 | 0.55 | 140.0 | 6.00 | 1.38 | 98 | 105 | Cu10NiZnSb4S13 | 0.45 | 200.0 | 1.10 | 0.63 | 95 | 156 |
| Cu10.5Ni0.5ZnSb4S13 | 0.62 | 220.0 | 1.06 | 0.50 | 98 | 130 | Cu10.5Ni1.3Zn0.2Sb4S13 | 0.78 | 188.0 | 2.43 | 0.70 | 98 | 130 |
| Cu10Ni0.5Zn1.5Sb4S13 | 0.34 | 320.0 | 0.22 | 0.41 | 95 | 156 | Cu10.5Ni1.5Sb4S13 | 0.65 | 177.0 | 2.50 | 0.81 | 96 | 96 |
| Cu10Ni0.5Zn1.5Sb4S13 | 0.39 | 275.0 | 0.35 | 0.48 | 95 | 156 | Cu10.5Ni1.5Sb4S13 | 0.74 | 220.0 | 1.70 | 0.70 | 98 | 105 |
| Cu11NiSb4S13 | 0.68 | 167.8 | 5.00 | 1.06 | 89 | 43 | Cu10.5Ni1.5Sb4S13 | 0.67 | 180.0 | 2.56 | 0.76 | 98 | 130 |
| Cu11NiSb4S13 | 0.61 | 150.0 | 4.60 | 1.08 | 96 | 96 | Cu10Ni1.5Zn0.5Sb4S13 | 0.51 | 215.0 | 1.25 | 0.68 | 95 | 156 |
| Cu11NiSb4S13 | 0.56 | 215.0 | 1.20 | 0.65 | 93 | 97 | Cu10Ni1.5Zn0.5Sb4S13 | 0.55 | 220.0 | 1.10 | 0.58 | 95 | 156 |
| Cu11NiSb4S13 | 0.76 | 165.0 | 4.00 | 0.90 | 98 | 105 | Cu10.4Ni1.6Sb4S13 | 0.65 | 182.0 | 2.78 | 0.86 | 98 | 102 |
| Cu11NiSb4S13 | 0.36 | 265.0 | 0.40 | 0.53 | 98 | 107 | Cu10Ni2Sb4S13 | - | - | - | - | 75-80 | 33 |
| Cu11NiSb4S13 | 0.55 | 135.0 | 4.85 | 1.00 | 95 | 160 | Cu10Ni2Sb4S13 | 0.58 | 216.0 | 1.20 | 0.67 | 96 | 96 |
| Cu10.5NiZn0.5Sb4S13 | 0.44 | 321.0 | 0.25 | 0.40 | 91 | 97 | Cu10Ni2Sb4S13 | - | - | - | - | 85 | 100 |
| Cu10.5NiZn0.5Sb4S13 | 0.84 | 200.0 | 2.05 | 0.58 | 98 | 134 | Cu10Ni2Sb4S13 | 0.61 | 254.0 | 1.00 | 0.60 | 98 | 105 |
| Cu10.2NiZn0.7Sb4S13 | 0.32 | 320.0 | 0.16 | 0.39 | 90 | 97 | |
| Zn doping (Cu)
|
| Cu11.075Zn0.025Sb4S12.8Se0.2 | 0.54 | 122.0 | 9.00 | 1.41 | 97 | 146 | Cu11ZnSb4S13 | 0.70 | 182.0 | 3.13 | 0.88 | 98 | 23 |
| Cu11.95Zn0.05Sb4S12.8Se0.2 | 0.65 | 135.0 | 8.00 | 1.34 | 96 | 146 | Cu11ZnSb4S13 | 0.63 | 202.1 | 2.00 | 0.77 | 90 | 43 |
| Cu11.025Zn0.075Sb4S12.8Se0.2 | 0.63 | 130.0 | 7.50 | 1.37 | 96 | 146 | Cu11ZnSb4S13 | 0.24 | 305.0 | 0.20 | 0.48 | 98 | 107 |
| Cu11.9Zn0.1Sb4S12.8Se0.2 | 0.49 | 120.0 | 7.60 | 1.38 | 97 | 146 | Cu11ZnSb4S13 | 0.81 | 184.7 | 2.94 | 0.75 | 98 | 154 |
| Cu11.9Zn0.1Sb3.9Bi0.1S13 | 0.55 | 177.0 | 2.50 | 0.87 | 99 | 112 | Cu10FeZnSb4S13 | 0.03 | 212.0 | 0.10 | 1.10 | 95 | 119 |
| Cu11.9Zn0.1Sb3.8Bi0.2S13 | 0.51 | 160.0 | 2.90 | 0.97 | 99 | 112 | Cu10NiZnSb4S13 | 0.45 | 200.0 | 1.10 | 0.63 | 95 | 156 |
| Cu11.8Zn0.2Sb3.8Bi0.2S13 | 0.50 | 225.0 | 0.90 | 0.58 | 99 | 112 | Cu10NiZnSb4S13 | 0.52 | 250.0 | 0.66 | 0.50 | 95 | 156 |
| Cu11.8Zn0.2Sb3.6Bi0.4S13 | 0.42 | 190.0 | 1.20 | 0.67 | 99 | 112 | Cu10.8Zn1.2Sb4S13 | 0.31 | 303.0 | 0.35 | 0.53 | 99 | 153 |
| Cu10.5Ni1.3Zn0.2Sb4S13 | 0.78 | 188.0 | 2.43 | 0.70 | 98 | 130 | Cu10.5Zn1.5Sb4S13 | 0.06 | 146.0 | 0.15 | 0.40 | 83 | 77 |
| Cu11.6Zn0.4Sb4S13 | 0.60 | 207.0 | 1.65 | 0.67 | 97 | 153 | Cu10.5Zn1.5Sb4S13 | - | - | - | - | 98 | 164 |
| Cu10.5NiZn0.5Sb4S13 | 0.44 | 321.0 | 0.25 | 0.40 | 91 | 97 | Cu10Ni0.5Zn1.5Sb4S13 | 0.34 | 320.0 | 0.22 | 0.41 | 95 | 156 |
| Cu10.5NiZn0.5Sb4S13 | 0.84 | 200.0 | 2.05 | 0.58 | 98 | 130 | Cu10Ni0.5Zn1.5Sb4S13 | 0.39 | 275.0 | 0.35 | 0.48 | 95 | 156 |
| Cu10Ni1.5Zn0.5Sb4S13 | 0.51 | 215.0 | 1.25 | 0.68 | 95 | 156 | Cu10.5Zn1.5Sb4S13 | 0.53 | 246.0 | 0.81 | 0.57 | 98 | 23 |
| Cu10Ni1.5Zn0.5Sb4S13 | 0.55 | 220.0 | 1.10 | 0.58 | 95 | 156 | Cu10.5Zn1.5Sb4S13 | 0.62 | 246.2 | 0.79 | 0.48 | 98 | 154 |
| Cu11.5Zn0.5Sb4S13 | 0.60 | 137.0 | 6.00 | 1.20 | 98 | 23 | Cu10Zn2Sb4S13 | - | - | - | - | 75-80 | 33 |
| Cu11.5Zn0.5Sb4S13 | 0.80 | 154.1 | 5.00 | 0.95 | 98 | 43 | Cu10Zn2Sb4S13 | 0.02 | 152.0 | 0.07 | 0.43 | 87 | 77 |
| Cu10.2NiZn0.7Sb4S13 | 0.32 | 320.0 | 0.16 | 0.39 | 90 | 97 | Cu10Zn2Sb4S13 | - | - | - | - | 88 | 100 |
| Cu11.2Zn0.8Sb4S13 | 0.48 | 223.0 | 0.98 | 0.69 | 99 | 153 | |
| Ga doping (Cu)
|
| Cu11.9Ga0.1Sb3.85Te0.15S14 | 0.52 | 149.0 | 5.10 | 1.38 | 98 | 143 | Cu11.7Ga0.3Sb3.55Te0.45S15 | 0.67 | 190.0 | 2.80 | 0.85 | 98 | 143 |
| Cu11.8Ga0.2Sb3.7Te0.3S13 | 0.80 | 175.0 | 4.20 | 0.96 | 98 | 143 | |
| Ge doping (Cu)
|
| Cu11.9Ge0.1Sb4S13 | 0.50 | 125.0 | 6.50 | 1.28 | 96 | 155 | Cu11.5Ge0.5Sb4S13 | 0.54 | 182.0 | 1.47 | 0.55 | 90 | 155 |
| Cu11.7Ge0.3Sb4S13 | 0.58 | 158.0 | 2.80 | 0.75 | 97 | 155 | Cu11.4Ge0.6Sb4S13 | 0.50 | 215.0 | 0.82 | 0.49 | 94 | 155 |
| Cu11.6Ge0.4Sb4S13 | 0.58 | 148.0 | 4.20 | 1.02 | 93 | 155 | |
| Cd doping (Cu)
|
| Cu11.75Cd0.25Sb4S13 | 0.60 | 132.0 | 8.33 | 1.40 | 92 | 103 | Cu10.75Cd1.25Sb4S13 | 0.57 | 215.0 | 1.61 | 0.82 | 87 | 103 |
| Cu11.5Cd0.5Sb4S13 | 0.84 | 150.0 | 5.26 | 0.90 | 92 | 103 | Cu10.5Cd1.5Sb4S13 | 0.02 | 134.0 | 0.08 | 0.51 | 85 | 77 |
| Cu11.25Cd0.75Sb4S13 | 0.90 | 155.0 | 4.54 | 0.72 | 85 | 103 | Cu10.5Cd1.5Sb4S13 | 0.52 | 255.0 | 0.87 | 0.65 | 80 | 103 |
| Cu11CdSb4S13 | 0.72 | 185.0 | 2.86 | 0.85 | 93 | 103 | Cu10Cd2Sb4S13 | 0.02 | 129.0 | 0.05 | 0.29 | 89 | 77 |
| In doping (Cu)
|
| Cu11.975In0.025Sb4S12.8Se0.2 | 0.69 | 120.0 | 8.80 | 1.15 | 95 | 118 | Cu11.925In0.075Sb4S12.8Se0.2 | 0.61 | 126.0 | 7.50 | 1.22 | 96 | 118 |
| Cu11.95In0.05Sb4S12.8Se0.2 | 0.72 | 122.0 | 8.40 | 1.11 | 96 | 118 | |
| Sn doping (Cu)
|
| Cu11.9Sn0.1Sb4S13 | 0.53 | 130.0 | 6.66 | 1.28 | 93 | 155 | Cu11.5Sn0.5Sb4S13 | 0.60 | 193.0 | 1.50 | 0.61 | 96 | 155 |
| Cu11.7Sn0.3Sb4S13 | 0.60 | 150.0 | 4.10 | 1.00 | 98 | 155 | Cu11.4Sn0.6Sb4S13 | 0.53 | 240.0 | 0.74 | 0.52 | 98 | 155 |
| Cu11.6Sn0.4Sb4S13 | 0.62 | 171.0 | 2.43 | 0.73 | 95 | 155 | |
| Pb doping (Cu)
|
| Cu11.75Pb0.25Sb4S13 | 0.52 | 132.2 | 5.65 | 1.20 | 98 | 159 | Cu11PbSb4S13 | 0.57 | 181.7 | 1.90 | 0.68 | 99 | 159 |
| Cu11.5Pb0.5Sb4S13 | 0.56 | 146.3 | 4.40 | 1.09 | 99 | 159 | Cu10.75Pb1.25Sb4S13 | 0.50 | 194.2 | 1.45 | 0.68 | 99 | 159 |
| Cu11.25Pb0.75Sb4S13 | 0.44 | 160.0 | 2.55 | 1.00 | 96 | 159 | Cu10.5Pb1.5Sb4S13 | 0.42 | 237.2 | 0.75 | 0.69 | 99 | 159 |
| Gd doping (Cu)
|
| Cu11.95Gd0.05Sb4S12.6Se0.4 | 0.64 | 128.0 | 8.10 | 1.30 | 98 | 48 | Cu11.7Gd0.3Sb4S13 | 0.60 | 118.0 | 9.00 | 1.46 | 96 | 136 |
| Cu11.9Gd0.1Sb4S13 | 0.48 | 115.0 | 8.80 | 1.51 | 97 | 136 | Cu11.6Gd0.4Sb4S13 | 0.55 | 118.0 | 8.70 | 1.40 | 96 | 136 |
| Cu11.9Gd0.2Sb4S13 | 0.52 | 115.0 | 8.70 | 1.45 | 97 | 136 | Cu11.5Gd0.5Sb4S13 | 0.53 | 120.0 | 8.30 | 1.45 | 96 | 136 |
| Sb deficiency
|
| Cu12Sb3.8S13 | 0.50 | 135.0 | 6.10 | 1.25 | 95 | 113 | Cu12Sb3.9S13 | 0.47 | 125.0 | 6.90 | 1.55 | 95 | 113 |
| Sb excess
|
| Cu12Sb4.1S13 | 0.59 | 125.0 | 9.00 | 1.42 | 97 | 113 | Cu12Sb4.3S13 | 0.48 | 134.0 | 6.50 | 1.46 | 97 | 113 |
| Cu12Sb4.2S13 | 0.65 | 135.0 | 7.40 | 1.24 | 95 | 113 | |
| Ge doping (Sb)
|
| Cu12Sb3.6Ge0.4S13 | 0.40 | 224.0 | 0.55 | 0.60 | 98 | 117 | Cu12Sb3.8Ge0.2S13 | 0.52 | 180.0 | 2.20 | 0.81 | 100 | 117 |
| Cu12Sb3.7Ge0.3S13 | 0.29 | 200.0 | 1.20 | 0.72 | 99 | 117 | Cu12Sb3.9Ge0.1S13 | 0.50 | 155.0 | 3.25 | 1.00 | 99 | 117 |
| Sn doping (Sb)
|
| Cu12Sb3.9Sn0.1S13 | 0.50 | 170.0 | 2.40 | 0.87 | 99 | 116 | Cu12Sb3.65Sn0.35S13 | 0.81 | 165.0 | 3.95 | 0.89 | 98 | 135 |
| Cu12Sb3.8Sn0.2S13 | 0.44 | 175.0 | 1.80 | 0.85 | 100 | 116 | Cu12Sb3.6Sn0.4S13 | 0.20 | 238.0 | 0.30 | 0.61 | 99 | 116 |
| Cu12Sb3.75Sn0.25S13 | 0.80 | 155.0 | 4.78 | 0.85 | 98 | 135 | Cu12Sb3.5Sn0.5S13 | 0.66 | 160.0 | 3.80 | 0.98 | 98 | 135 |
| Cu12Sb3.7Sn0.3S13 | 0.40 | 200.0 | 1.05 | 0.71 | 99 | 116 | Cu12Sb3SnS13 | 0.30 | 135.0 | 3.23 | 1.25 | 98 | 135 |
| Te doping (Sb)
|
| Cu12Sb3.9Te0.1S13 | 0.70 | 133.0 | 7.30 | 1.20 | 98 | 141 | Cu12Sb3.2Te0.8S13 | 0.79 | 175.0 | 2.00 | 0.50 | 95 | 133 |
| Cu12Sb3.9Te0.1S13 | 0.60 | 175.0 | 2.65 | 0.85 | 100 | 142 | Cu12Sb3.6Te1.4S13 | 0.54 | 167.0 | 1.34 | 0.54 | 95 | 133 |
| Cu11.9Ga0.1Sb3.85Te0.15S14 | 0.52 | 149.0 | 5.10 | 1.38 | 98 | 143 | Cu12Sb2.19Te1.81S13 | 0.39 | 250.0 | 0.46 | 0.48 | 95 | 133 |
| Cu12Sb3.8Te0.2S13 | 0.55 | 180.0 | 2.05 | 0.75 | 99 | 142 | Cu12Sb2.21Te1.79S13 | 0.30 | 220.0 | 0.53 | 0.54 | 95 | 133 |
| Cu12Sb3.7Te0.3S13 | 0.55 | 185.0 | 1.95 | 0.75 | 99 | 142 | Cu12Sb3.59Te1.41S13 | 0.64 | 212.0 | 1.35 | 0.58 | 93 | 133 |
| Cu11.8Ga0.2Sb3.7Te0.3S13 | 0.80 | 175.0 | 4.20 | 0.96 | 98 | 143 | Cu12Sb2.99Te1.01S13 | 0.63 | 163.0 | 2.86 | 0.80 | 93 | 133 |
| Cu12Sb3.6Te0.4S13 | 0.54 | 195.0 | 1.65 | 0.74 | 99 | 142 | Cu12Sb3.48Te0.52S13 | 0.61 | 127.0 | 6.20 | 1.28 | 93 | 133 |
| Cu11.47Co0.82Sb3.78Te0.41S13 | 0.69 | 175.0 | 6.10 | 0.81 | 92 | 150 | Cu12Sb2.15Te1.85S13 | 0.39 | 252.0 | 0.47 | 0.49 | 93 | 133 |
| Cu11.7Ga0.3Sb3.55Te0.45S15 | 0.67 | 190.0 | 2.80 | 0.85 | 98 | 143 | Cu12Sb3TeS12.8Se0.25 | 0.74 | 182.0 | 2.63 | 0.72 | 92 | 148 |
| Cu12Sb3.5Te0.5S13 | 0.70 | 145.0 | 5.10 | 0.99 | 98 | 141 | Cu12Sb4TeS12.5Se0.5 | 0.53 | 165.0 | 2.74 | 0.80 | 91 | 148 |
| Cu12Sb3.39Te0.61S13 | 0.76 | 183.0 | 1.82 | 0.50 | 95 | 133 | Cu12Sb3TeS12Se | 0.51 | 162.0 | 2.75 | 0.83 | 92 | 148 |
| Cu12Sb3TeS13 | 0.76 | 180.0 | 2.70 | 0.75 | 98 | 141 | Cu12Sb3TeS11.5Se1.5 | 0.52 | 163.0 | 3.09 | 0.85 | 95 | 148 |
| Bi doping (Sb)
|
| Cu12Sb3.9Bi0.1S13 | 0.70 | 182.0 | 2.80 | 0.82 | 97 | 120 | Cu12Sb3.7Bi0.3S13 | 0.50 | 150.0 | 3.50 | 0.95 | 98 | 120 |
| Cu11.9Zn0.1Sb3.9Bi0.1S13 | 0.55 | 177.0 | 2.50 | 0.87 | 99 | 112 | Cu11.8Zn0.2Sb3.6Bi0.4S13 | 0.42 | 190.0 | 1.20 | 0.67 | 99 | 112 |
| Cu12Sb3.8Bi0.2S13 | 0.56 | 160.0 | 3.30 | 0.95 | 98 | 120 | Cu12Sb3.6Bi0.4S13 | 0.45 | 160.0 | 2.00 | 0.76 | 99 | 120 |
| Cu12Sb3.8Bi0.2S13 | 0.78 | 138.0 | 6.65 | 1.12 | 90 | 140 | Cu12Sb3.6Bi0.4S13 | 0.71 | 166.0 | 3.90 | 0.96 | 90 | 140 |
| Cu11.9Zn0.1Sb3.8Bi0.2S13 | 0.51 | 160.0 | 2.90 | 0.97 | 99 | 112 | Cu12Sb3.4Bi0.6S13 | 0.51 | 180.0 | 2.21 | 0.92 | 90 | 140 |
| Cu11.8Zn0.2Sb3.8Bi0.2S13 | 0.50 | 225.0 | 0.90 | 0.58 | 99 | 112 | Cu12Sb3.2Bi0.8S13 | 0.47 | 178.0 | 1.86 | 0.84 | 90 | 140 |
| S deficiency
|
| Cu12Sb4S12.6 | 0.45 | 122.0 | 5.35 | 1.14 | 86 | 145 | Cu12Sb4S12.7 | 0.45 | 118.0 | 5.35 | 1.06 | 86 | 145 |
| Se doping (S)
|
| Cu12Sb4S12.9Se0.1 | 0.50 | 110.0 | 9.40 | 1.48 | 97 | 146 | Cu12Sb4S12.6Se0.4 | 0.43 | 212.0 | 1.00 | 0.65 | 96 | 147 |
| Cu12Sb4S12.9Se0.1 | 0.58 | 156.0 | 3.70 | 0.95 | 97 | 147 | Cu11.95Gd0.05Sb4S12.6Se0.4 | 0.64 | 128.0 | 8.10 | 1.30 | 98 | 48 |
| Cu12Sb4S12.8Se0.2 | 0.59 | 114.0 | 10.80 | 1.51 | 98 | 146 | Cu12Sb4S12.5Se0.5 | 0.49 | 121.0 | 1.62 | 1.44 | - | 144 |
| Cu12Sb4S12.8Se0.2 | 0.58 | 170.0 | 3.05 | 0.85 | 99 | 147 | Cu12Sb4TeS12.5Se0.5 | 0.53 | 165.0 | 2.74 | 0.80 | 91 | 148 |
| Cu11.975In0.025Sb4S12.8Se0.2 | 0.69 | 120.0 | 8.80 | 1.15 | 95 | 118 | Cu12.5Sb4S12Se | 0.76 | 124.0 | 7.13 | 0.89 | 95 | 129 |
| Cu11.95In0.05Sb4S12.8Se0.2 | 0.72 | 122.0 | 8.40 | 1.11 | 96 | 118 | Cu12Sb4S12Se | 0.56 | 116.0 | 1.62 | 1.43 | - | 144 |
| Cu11.925In0.075Sb4S12.8Se0.2 | 0.61 | 126.0 | 7.50 | 1.22 | 96 | 118 | Cu13Sb4S12Se | 0.78 | 142.4 | 5.59 | 0.91 | 95 | 129 |
| Cu12Sb3TeS12.8Se0.25 | 0.74 | 182.0 | 2.63 | 0.72 | 92 | 148 | Cu12Sb3TeS12Se | 0.51 | 162.0 | 2.75 | 0.83 | 92 | 148 |
| Cu12Sb4S12.7Se0.3 | 0.52 | 115.0 | 9.40 | 1.48 | 98 | 146 | Cu12Sb3TeS11.5Se1.5 | 0.52 | 163.0 | 3.09 | 0.85 | 95 | 148 |
| Cu12Sb4S12.7Se0.3 | 0.50 | 173.0 | 1.70 | 0.60 | 97 | 147 | Cu12Sb4S11Se2 | 0.47 | 120.0 | 1.62 | 1.43 | - | 144 |
| Cu12Sb4S12.6Se0.4 | 0.48 | 123.0 | 8.60 | 1.61 | 97 | 146 | |
For cross-study comparability, all TE properties were evaluated at 350 °C (interpolated where necessary), as this temperature lies safely below reported decomposition onsets (492°C for natural tetrahedrite76 and 400°C for Cu10Cd2Sb4S13).77 Quantile regression was employed to estimate conditional zT quantiles as functions of measurement temperature and composition using, respectively, first- and second-order polynomial models fitted with the standard quantile loss function. This approach is well suited to aggregated literature datasets, in which variability in composition, synthesis routes, and measurement conditions produces heteroscedastic distributions. In this context, quantile regression provides a robust statistical framework, as it estimates conditional percentiles of the response variable without assuming normally distributed or homoscedastic residuals.
Statistical analyses were performed to compare the undoped reference subset with each dopant subset. The subsets were constructed by excluding co-doped samples, while pooling measurements across all doping levels for a given dopant to increase statistical power. Due to skewed distributions and unequal group sizes, differences were assessed using two-sided Mann–Whitney
tests at a significance level of α = 0.05. Effect sizes were estimated using the rank-biserial correlation coefficient, defined as
, where
denotes the sample size. The undoped group was treated as the reference, such that the sign of rrb reflects the direction of the difference. Effect sizes were categorised as none (|rrb|< 0.1), small (0.1 ≤|rrb|< 0.3), medium (0.3 ≤|rrb|<0.5), or large (|rrb|≥0.5).
Experimental
Experimental investigations were performed to support and contextualise the findings of the data analysis. Undoped and Fe,Zn-doped (Cu11Fe0.5Zn0.5Sb4S13) samples were produced by mechanochemical synthesis and spark plasma sintering (SPS). Elemental powders were mechanically alloyed in a Retsch EMAX high-energy ball mill at 1200 rpm for 2 h using 125 mL stainless steel jars and 12 mm stainless steel balls, with a ball-to-powder ratio of 10:1, under an argon atmosphere to prevent oxidation. Consolidation was performed in a Genicore U-FAST system, under vacuum, using graphite dies, at temperatures in the range of 340–500°C and under uniaxial pressures of 60–70 MPa. The resulting bulk densities were measured using the Archimedes method.
Crystal structure and phase purity were confirmed by X-ray diffraction (XRD) using a PANalytical Empyrean diffractometer in Bragg-Brentano geometry with Cu Kα radiation, a step size of 0.013° in 2θ, and an acquisition time of 148.92 s per step.
Microstructures were examined by field-emission scanning electron microscopy (SEM) using an FEI NanoLab 600 instrument in backscattered electron (BSE) mode at 8 kV, following standard metallographic sample preparation. Image analysis was carried out with ImajeJ. The TE properties of the sintered samples were measured using a LINSEIS LZT-Meter (LZT L33) under a helium atmosphere at 1 bar.
Density functional theory calculations
To further complement the data analysis, a systematic spin-polarised DFT study was conducted to elucidate the effects of representative dopants on the electronic structure of Cu12-xMxSb4S13, with M = Mn, Fe, Co, Ni and Zn. First-principles calculations were performed using the Vienna ab initio Simulation Package (VASP),78,79 with electron–ion interactions described by the projector-augmented-wave (PAW) method,80 and exchange–correlation treated within the Perdew-Burke-Ernzerhof (PBE) generalised gradient approximation.81 A plane-wave kinetic energy cut-off of 500 eV was employed. The Brillouin zone was sampled using a 10×10×10 k-point mesh for structural relaxations and a 20×20×20 mesh for density-of-states calculations. Doped compositions were modelled using 29-atom unit cells (one formula unit), with a representative substitution level of x = 1. Atomic positions and cell volume were relaxed while constraining the cell shape.
Band-decomposed charge densities were analysed to examine the spatial distribution of valence-band states near the Fermi level, and Bader charge analysis was performed to evaluate site-resolved charge trends. Additional calculations using the SCAN meta-GGA functional82 were conducted to verify the robustness of the observed charge-distribution trends.
Results and discussion
Temperature dependence of thermoelectric performance
Benchmarking TE materials requires accounting for the temperature dependence of zT. The hexagonal binning heatmap in
Figure 3a presents the distribution of experimental zT values for tetrahedrites as a function of measurement temperature, with overlaid linear quantiles at the 50%, 75% and 95% levels. The corresponding scatter plot (together with hexagonal binning plots for S, σ and κ) is provided in Figure S1 in the Supplementary Materials.83 The dispersion in zT values is substantial but comparable to that reported for other TE materials, such as skutterudites and half-Heusler alloys, for which meta-analyses have also been conducted.84,85 As shown in
Figure 3b, a similarly wide dispersion is observed among undoped samples (the largest nominally identical subset, with the corresponding scatter plot also provided in Figure S183). This demonstrates that, beyond dopant-induced modifications to the electronic structure, the dispersion in
Figure 3a arises from variations in processing conditions and measurement methodologies across independent studies.
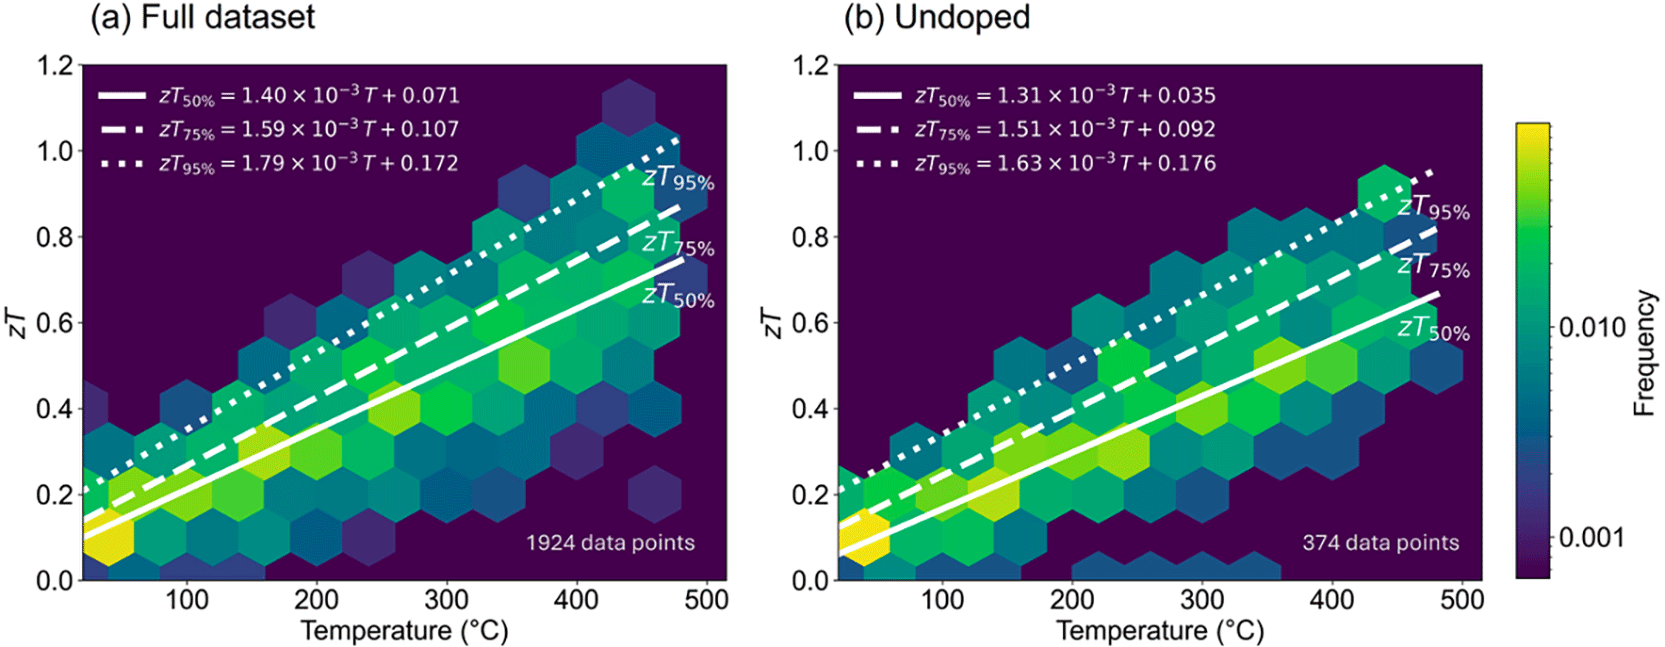
Figure 3. Hexagonal binning plots of zT vs. measurement temperature.
a) full dataset and (b) undoped tetrahedrites. Linear quantile regressions corresponding to 50%, 75%, and 95% levels are overlaid. The colour scale represents frequency (number of data points within each hexagon normalized by the total number of points in the dataset).
Near-zero zT outliers (see Figure S1a and b83) are likely to substantially underestimate the intrinsic TE performance of the tested compositions, systematically skewing the temperature-dependent zT distributions toward underperforming samples as evidenced by the pronounced lower-tails of the heatmaps in
Figure 3a and b. Therefore, standard central-tendency metrics, such as the mean or median, fail to reliably capture the performance of well-processed materials. The linear quantile regressions address this limitation by emphasising the upper portion of the distributions where samples produced under optimised processing conditions are expected to reside. Within this framework, the 75% quantile emerges as a pragmatic benchmark for assessing high-quality tetrahedrites, yielding zT75%(350°C) ≈ 0.7 for the full dataset and ≈ 0.6 for undoped tetrahedrite.
At the upper end of the temperature-dependent zT distributions, the reported values are seldom reproduced and carry substantial propagated errors. Typical relative uncertainties exceed 7% for σ, 5% for S, and 10% for K.86 The latter is calculated from K = D Cp λ, where D is density, Cp is specific heat capacity, and λ is thermal diffusivity, which alone contributes an uncertainty of ~7%.86 As a result, the compounded uncertainty in zT can exceed 15%, complicating quantitative cross-study comparisons.87,88 In this context, the 95% quantile is used to represent optimised performance, as it mitigates the influence of high-end outliers. At 350°C, the 95% performance frontier is zT95%(350°C) ≈ 0.8 for the full dataset and ≈ 0.7 for undoped tetrahedrite. This provides a robust and consistent benchmark for evaluating high-performing samples.
Processing effects
Processing conditions affect the final chemistry and determine the microstructure, thereby shaping TE behaviour. Mechanochemical synthesis is the dominant method for producing tetrahedrites directly from elemental precursors.89 Milling parameters control the resulting chemical homogeneity, crystallite size, and particle size, as well as the extent of contamination by the milling media and milling atmosphere. Iron contamination from steel milling media is well documented in high-energy ball milling, typically reaching ∼1–2 wt.% Fe under conventional conditions and increasing with milling time.90,91 In addition, contamination by inert gas and by oxygen introduced via leaks or incorporation of passivation layers from milling media surfaces must also be considered.92 XRD is typically used to confirm phase purity; however, other key properties relevant to consolidation and transport, including particle-size distribution and impurity uptake, are seldom reported, limiting reproducibility and cross-study comparability.
Tetrahedrite powders are typically consolidated by hot pressing (HP) or SPS, two uniaxial pressure–assisted methods that achieve high densification while limiting grain growth.93 In HP, the die–powder assembly is heated by conventional resistance heating,94 whereas in SPS, pulsed direct current is passed through the graphite tooling and the compact, enabling substantially higher heating rates and faster consolidation.95 Alternative approaches such as cold pressing followed by pressure-less sintering and open-die pressing have also been explored.33,96,97 Die materials such as graphite constitute an additional (yet typically unquantified) source of contamination.
Figure 4a compares the different consolidation techniques in terms of zT values measured at 350 °C. Although HP is the most adopted method, both the average zT and its dispersion are comparable across consolidation routes, indicating that the technique chosen is not a determining factor within the explored processing space.
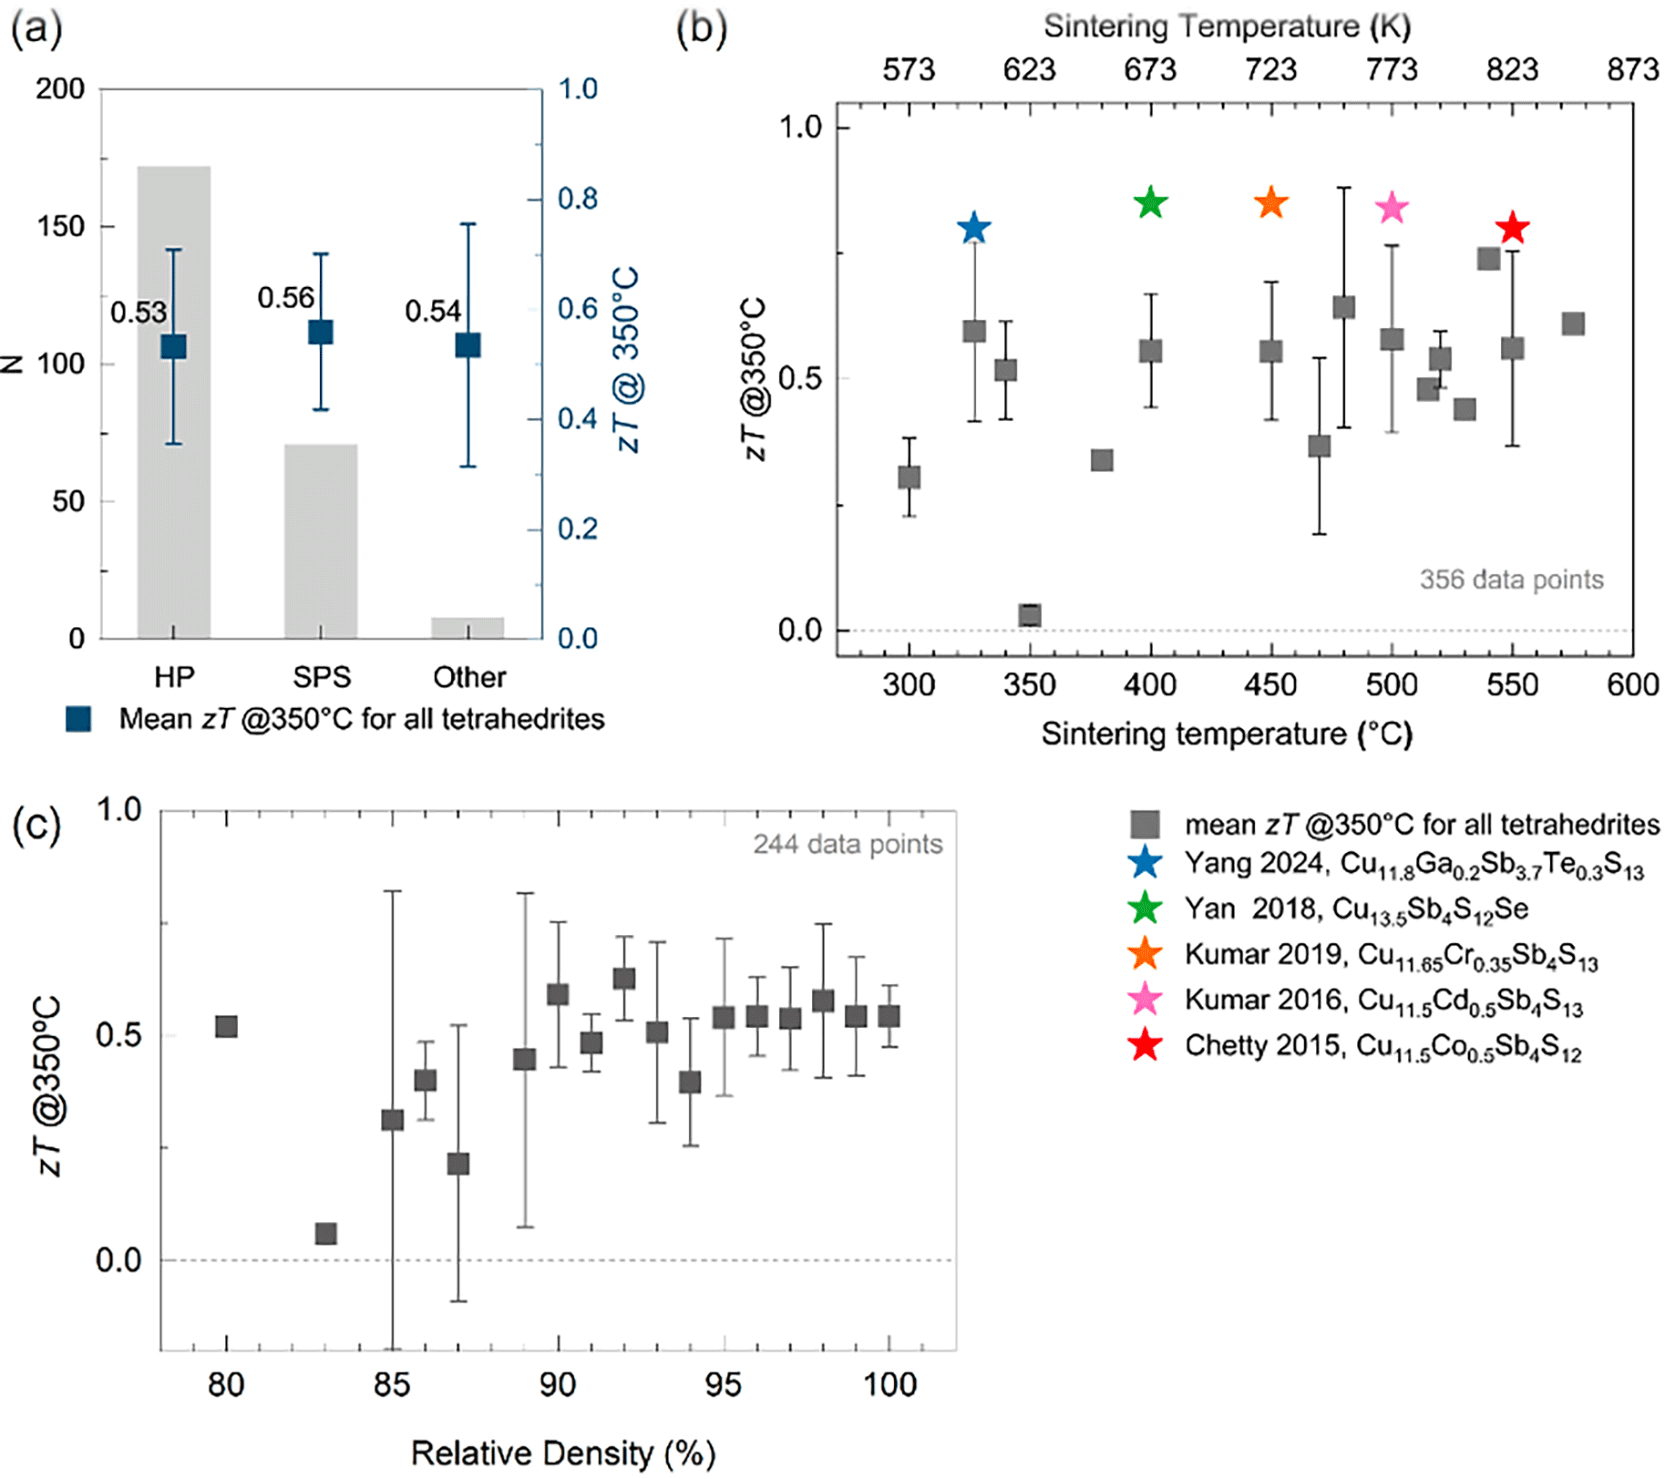
Figure 4. Effect of processing variables.
(a) Comparison of consolidation routes in terms of zT at 350 °C, where bars represent the number of samples (N) processed by each technique in the full datase. (b) zT at 350 °C vs. sintering temperature for all compositions with notable values (stars) identified in the legend. (c) zT at 350 °C vs. relative density for all tetrahedrites. Relative density values within ±2% are binned together to reduce visual clutter.
During sintering, a complex interplay of variables governs the final crystallinity and microstructure, ultimately influencing TE performance.98 Although the sintering temperature is typically a critical processing parameter, the full dataset shows comparable average performance at 350 °C for samples sintered in the 300–550 °C range, with peak zT values (stars) consistently close to 0.8 (
Figure 4b). Despite their limited size, similar behaviour is observed for subsets with the same nominal composition, as illustrated for undoped tetrahedrite in Figure S3.83 This apparent insensitivity to the sintering temperature points to competing temperature-dependent processes that can only be clarified through detailed microstructural characterisation.
Figure 4c presents the average zT at 350 °C as a function of relative density for the full dataset. Although relative densities are often referenced to unverified theoretical values, introducing additional variability, a clear dependence of zT on relative density is nonetheless evident. Lower-density samples exhibit reduced average zT and greater dispersion, whereas for relative densities above 95%, the average zT consistently exceeds 0.5 and the spread narrows markedly, indicating improved reproducibility (
Figure 4c).
Consistent with recommendations for reliable benchmarking,99 restricting the analysis to samples with relative densities ≥ 95% (77% of the dataset) substantially reduces scatter (compare Figure S4a83 with Figure S1a).83 Nevertheless, the quantile regression envelopes remain essentially unchanged, indicating that both the highest and lowest reported zT values are predominantly associated with densities below 95%. Notably, the high-density subset also shows zT insensitivity to the sintering temperature (compare Figure S4b83 with
Figure 4b). Data from Heo et al. 100 were excluded from
Figure 4 because the reported TE properties extend only up to 300 °C (green and yellow stars in Figure S1a),83 precluding direct comparison at 350°C. These samples exhibit particularly low relative densities (≤ 88%), leading to markedly reduced K values (∼0.2 Wm−1K−1) and correspondingly outlying zT behaviour (see Figure S1a).83
Microstructural evidence linking processing conditions to TE performance remains scarce for tetrahedrites.101 To address this gap, undoped, Fe-, Zn- and Fe,Zn-doped tetrahedrites have been produced by mechanochemical synthesis followed by SPS at temperatures in the 340–500°C range. The compositions and processing conditions were selected to probe representative microstructures rather than to perform an exhaustive parametric survey. Powder XRD confirmed tetrahedrite as the dominant phase (Figure S5).83 All undoped and doped samples sintered across the 340–500 °C range exhibited submicrometre-scale intergranular pores with predominantly rounded morphologies, consistent with internal vapour-pressure build-up driven by sulphur sublimation. Pure sulphur reaches a vapour pressure of 1 atm at 445 °C, underscoring the strong thermodynamic driving force for volatilisation in sulphur-containing compounds and indicating that pore size and distribution are expected to depend strongly on the sintering temperature.
The observations revealed that pore morphology evolves with sintering temperature: larger and less spherical pores at lower temperatures suggest concurrent densification and gas release (
Figure 5a), whereas smaller and more spherical pores distributed along the boundaries of polygonal grains reflect capillarity-driven pore equilibration at higher temperatures (
Figure 5b). The latter type of pore distribution severely disrupts connectivity between the grains, affecting transport pathways. These results demonstrate competing effects of densification and sublimation-driven pore formation across the sintering temperature range, providing a mechanistic explanation for the apparent insensitivity of zT to the sintering temperature.
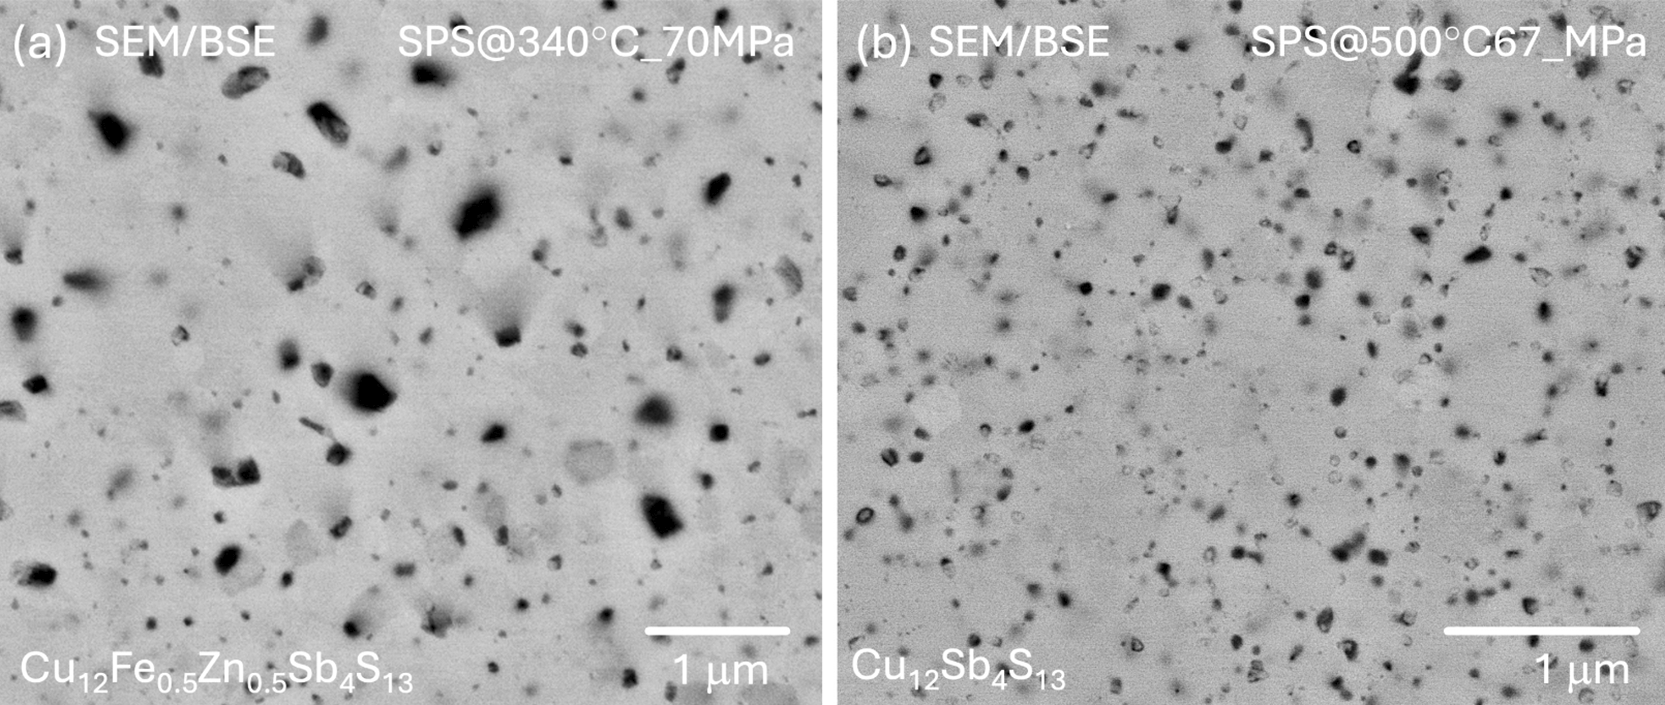
Figure 5. Microstructures of tetrahedrites sintered by SPS.
(a) Cu11Fe0.5Zn0.5Sb4S13 at 340°C under 70 MPa (D = 4.9 g.cm−3, 6% porosity and 90 ±70 nm pores), and (b) Cu12Sb4S13 at 500°C under 70 MPa (D = 4.8 gcm−3, 11% porosity and 70 ±40 nm pores). Direct use of D in 𝜅 = D.
Cp.
λ yields in apparent zT(350°C) = 0.91 and 0.77, respectively (with high level of uncertainty due to the porosity).
Several studies report microstructures of tetrahedrites, yet porosity is typically overlooked.47,101–119 In most cases, standard metallographic preparation is not employed, or the spatial resolution of the micrographs is inappropriate—either too low to resolve pores or atomically resolved but over a limited field of view—hindering reliable assessment of porosity. Nonetheless, pores similar to those shown in
Figure 5 are clearly visible in other SPS-consolidated tetrahedrites103,109 or can be inferred from published micrographs.110,113,116–118,120 This suggests that sulphur-driven pore formation is widespread, although rarely explicitly addressed. The phenomenon may be specific to SPS; however, the comparable average zT and standard deviation observed for samples produced by HP (see
Figure 4a) indicate that it is likely a general feature. Although pore formation remains to be quantitatively characterised, pervasive porosity contributes to the broad zT variability in the literature (
Figure 1).
The influence of porosity on zT is inherently non-trivial because density is not an independent variable but rather a proxy for microstructure. When density variations arise from pores, interpreting K through K = D Cp λ becomes problematic, because this identity, while locally valid, does not rigorously describe effective transport in heterogeneous media. In such systems, macroscopic heat transport is governed by interfacial resistance, tortuosity, and connectivity, resulting in a non-linear relation between D and K.121,122 Only under restrictive conditions—namely, low porosity, clear scale separation, local thermal equilibrium, and diffusive transport—can an effective (eff
) description of thermal transport be provided by a proportional Keff ≈ (DCp)eff λeff relation, an approximation possible because both D and Cp are volumetric quantities that can be homogenised through geometric averaging.121,122 Outside those conditions, however, the use of bulk density to infer Keff leads to inconsistent estimates of zT. The same limitation applies to electrical transport: although σ = n e μ, where e is the elementary charge and μ is carrier mobility, is locally valid, porosity introduces voids and interfaces that reduce μ through energy barriers and disrupt percolation pathways, leading to a non-linear dependence of σeff on microstructure.32 Consequently, porosity rarely modifies zT in a predictable manner.
The competition between electronic and thermal transport disruption by microstructural features is particularly relevant in tetrahedrites, where strong intrinsic anharmonicity already confines the mean free paths of heat-carrying phonons to near-atomic length scales.24,75,123 Green–Kubo and diffuson analyses show that Kl saturates below ∼1 nm.41,123,124 Because pores are orders of magnitude larger than the relevant phonon length scales, they contribute negligibly to additional scattering, with reductions in Keff arising primarily from geometric effects such as reduced solid fraction and increased tortuosity.125 In contrast, electrical transport remains highly sensitive to connectivity, such that σ typically decreases more strongly than K, rendering net improvements in zT through enhanced porosity unlikely for tetrahedrites.
An apparent exception was reported by Hu
et al.,
114 who observed that porosity induced in tetrahedrite via sublimation of co-processed BiI3 produced large reductions in K and high zT values, attributed to reduced heat-conduction pathways and unexpectedly enhanced μ. However, such behaviour is not representative, and incomplete densification can generally be expected to amplify variability in reported transport properties, thereby obscuring intrinsic and dopant-specific trends.
In summary, porosity is not a simple tuning parameter but a coupled perturbation of transport pathways and must be treated explicitly using microstructure-aware frameworks, including effective-medium, percolation, or Boltzmann transport models.32 Accordingly, controlling sulphur volatilisation and minimising residual porosity is essential for isolating intrinsic TE behaviour and enabling meaningful chemical optimisation of tetrahedrites.
Copper substitution and excess
Substitution of Cu(1) with 3d transition metals is the primary strategy for tuning the TE performance of tetrahedrites. Neutron-diffraction studies show that such dopants, namely Ni and Fe, preferentially occupy the tetrahedrally coordinated 12d sites rather than the trigonal 12e sites.102,126 This site selectivity enables control of n while preserving the rattling behaviour of Cu(2) atoms, thereby allowing partial decoupling of electrical and thermal transport. However, substitution of monovalent Cu with higher-valence metals is constrained by charge balance, typically limiting dopant solubility to x ≤ 2 in Cu12–xMxSb4S13.
Each Cu+ → M2+ substitution reduces hole concentration, shifting the Fermi level toward the band gap, and simultaneously introduces mass and strain disorder that suppresses Kl.24,50,108 At moderate substitution levels, the reduction in n is offset by an enhancement in S, leading to enhanced zT. Beyond this optimum, further substitution causes excessive carrier depletion, degrading TE performance (see
Figure 1b).
A wide range of dopants has been explored owing to the structural flexibility of tetrahedrites (see
Table 1 for compositions and references). While most studies focus on 3d metals, other elements such as Zn, Ge, Cd and Pb and have also been investigated. In addition, co-doping strategies include substitution of Cu with simultaneously Ni and Zn, or Fe and Zn, as well as substitution at multiple sublattices, namely Cu/Sb (Zn/Bi, Co/Te and Ga/Te), Cu/S (Gd/Se), and Sb/S (Te/Se).
The dependence of zT (350 °C) on Cu content is shown in
Figure 6, for compositions with the general formula (CuwMxTy)(Sb4-iQi)(S13-jRj), where M and T denote elements substituting Cu, and Q and R denote elements substituting Sb and S, respectively. Within the Cu-substitution regime (w < 12), second-order polynomial regressions were used to estimate conditional quantiles as a function of Cu content, reflecting the expectation that optimal performance occurs at moderate substitution levels. Typically, heavy Cu substitution (w < 10.5) suppresses zT, whereas moderate substitution (w ≈ 11-11.5) enhances performance relative to both undoped materials and samples substituted only at Sb/S sites (all nominally at w = 12). Reports on the Cu-excess regime (w > 12) remain more limited127–129 but suggest an increase in zT with increasing Cu content compared to the mean value for w = 12 (black square). This behaviour has been attributed to the emergence of a “liquid-like” Cu sublattice with enhanced ionic mobility, which suppresses Kl via reduced phonon mean free paths, consistent with phonon–liquid electron–crystal (PLEC) behaviour.73,127 This interpretation remains largely phenomenological, as direct evidence for liquid-like Cu dynamics under operating conditions is scarce. Some of the highest-performing compositions occur in this regime, including Cu13.5Sb4Se13,129 which exhibited zT = 1.1 at 450 °C, corresponding to ≈ 0.85 at 350 °C (star in
Figure 6).
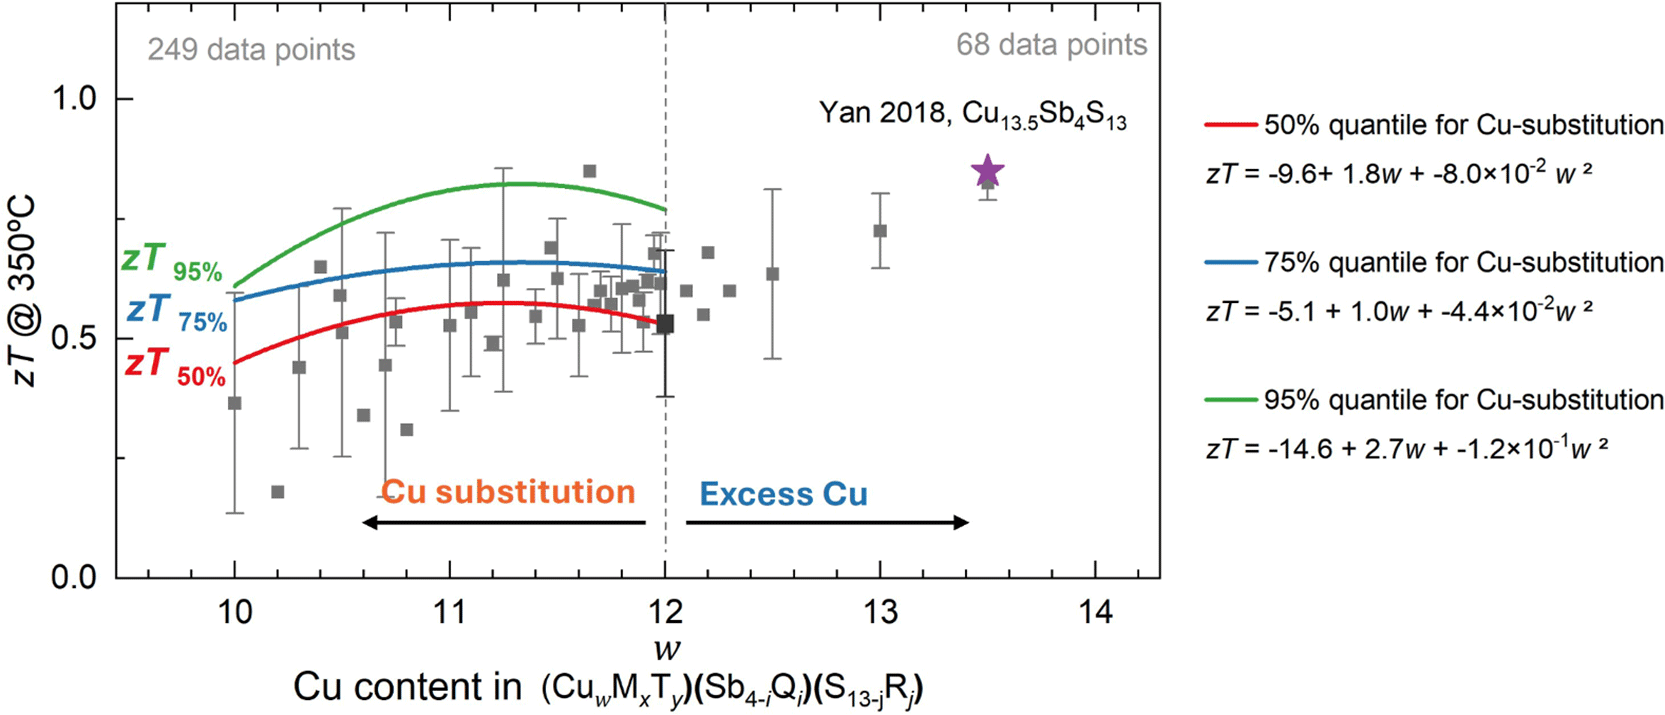
Figure 6.
zT at 350 °C vs. Cu content for (CuwMxTy)(Sb4−iQi)(S13−jRj), where M and T denote Cu substitution, and Q and R denote Sb and S substitutions, respectively, while w = 12-
x-y+z with z being excess Cu.
Compositions with w < 12 and w > 12 correspond to Cu-substituted and Cu-excess regimes, respectively. Samples with w = 12 (58 data points) include undoped and Sb/S-substituted materials. Squares and error bars indicate means and standard deviations. Second-order quantile regressions are shown for w < 12. The star denotes a high-performing composition.
Figure 7 presents the average zT and standard deviation at 350 °C for single-dopant Cu substitutions, alongside values for the undoped, Cu excess, and Cu deficiency conditions. Data within each class were pooled across doping levels owing to limited sample sizes. Blue stars denote the highest reported/interpolated zT values at 350 °C, with the corresponding compositions listed in Table S1.83 zT values obtained at higher temperatures or drawn from studies restricted to temperatures below 350 °C are excluded from
Figure 7.
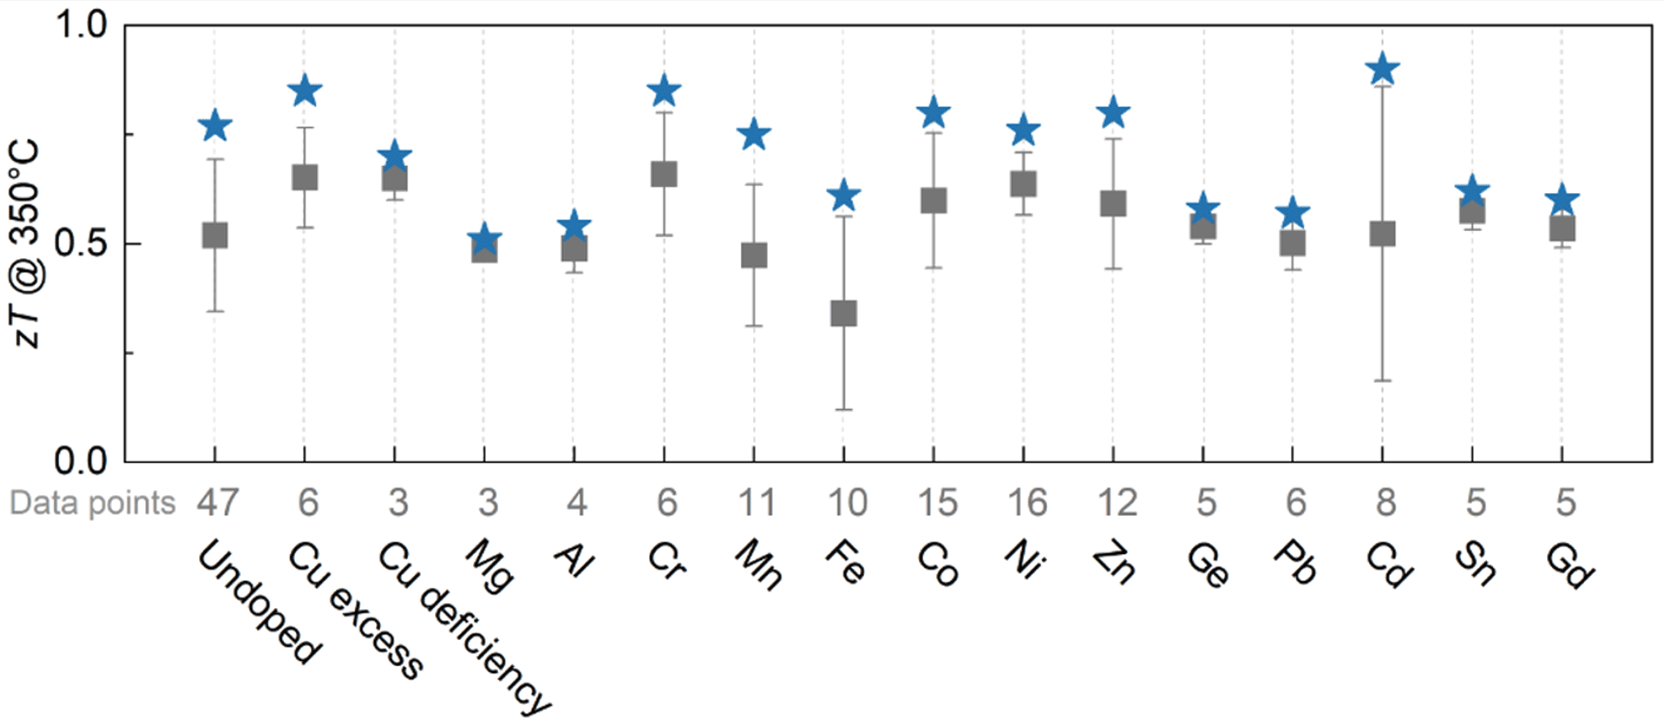
Figure 7. Average zT at 350 °C (squares) for undoped, Cu excess and deficiency conditions, and Cu-substituted tetrahedrites.
Error bars represent standard deviations, and stars denote the highest value in each class (compositions and references provided in Table S1).83 Co-doped compositions are excluded, and each class pools measurements across all doping levels. The number of data points is indicated below each class. The statistical analysis of dopant effects is presented in Table S2.83
Statistical analysis using the Mann–Whitney U test indicates that, for most dopant classes shown in
Figure 7, the differences in zT at 350 °C relative to undoped tetrahedrite are not statistically significant (see Table S2).83 The exception is Fe doping, which produces a significant reduction in TE performance (p = 0.022), a finding particularly relevant given the likelihood of unintentional Fe incorporation during synthesis when using steel milling media.90,91 The lack of statistical significance reflects limited sample sizes implying that the analysis is underpowered to resolve moderate dopant effects. In addition, since performance depends on dopant concentration (see
Figure 6 for w < 12), pooling across the substitution levels increases within-class variability. Furthermore, although statistical significance is not observed, several conditions—including Cu excess and deficiency as well and Cr-, Co- and Ni-doping—exhibit medium-to-large effect sizes (rrb), suggesting systematic deviations from the undoped reference (see Table S2).83
Collectively, these findings indicate that the dopant concentration dependence and extrinsic factors such as measurement uncertainty, processing-related impurities, and especially microstructural factors mask electronic effects. This is particularly evident when comparing the high-performing Cu excess, Cr-, Co-, Ni-, and Zn-doped samples (stars in
Figure 7), whose electronic bands are expected to be different.
Although several first-principles studies have examined how 3d transition-metal dopants modify the electronic structure of tetrahedrite,23,43,47,50,130,131 a systematic comparison of their effects was lacking. Here, a comprehensive and consistent DFT analysis is presented for the most common Cu substitutions, namely Mn, Co, Fe, Ni and Zn.
Figure 8a shows the electronic band structure and element-projected density of states (PDOS) for undoped tetrahedrite at 0 K. Stoichiometric
is intrinsically electron-deficient, resulting in partially occupied valence-band states. To relate the electronic structure to charge transport, the spatial distribution of these holes was analysed. The real-space charge density associated with valence-band states crossing the Fermi level (EF) is uniform across symmetry-equivalent Cu sites, with no evidence of site-specific depletion or accumulation. Bader analysis using both PBE and SCAN functionals yields nearly identical charges for equivalent Cu atoms, confirming the absence of site-selective hole localisation. Furthermore, only a small charge difference is observed between Cu(1) 12d and Cu(2) 12e, reflecting their distinct coordination environments (Figure S6).83
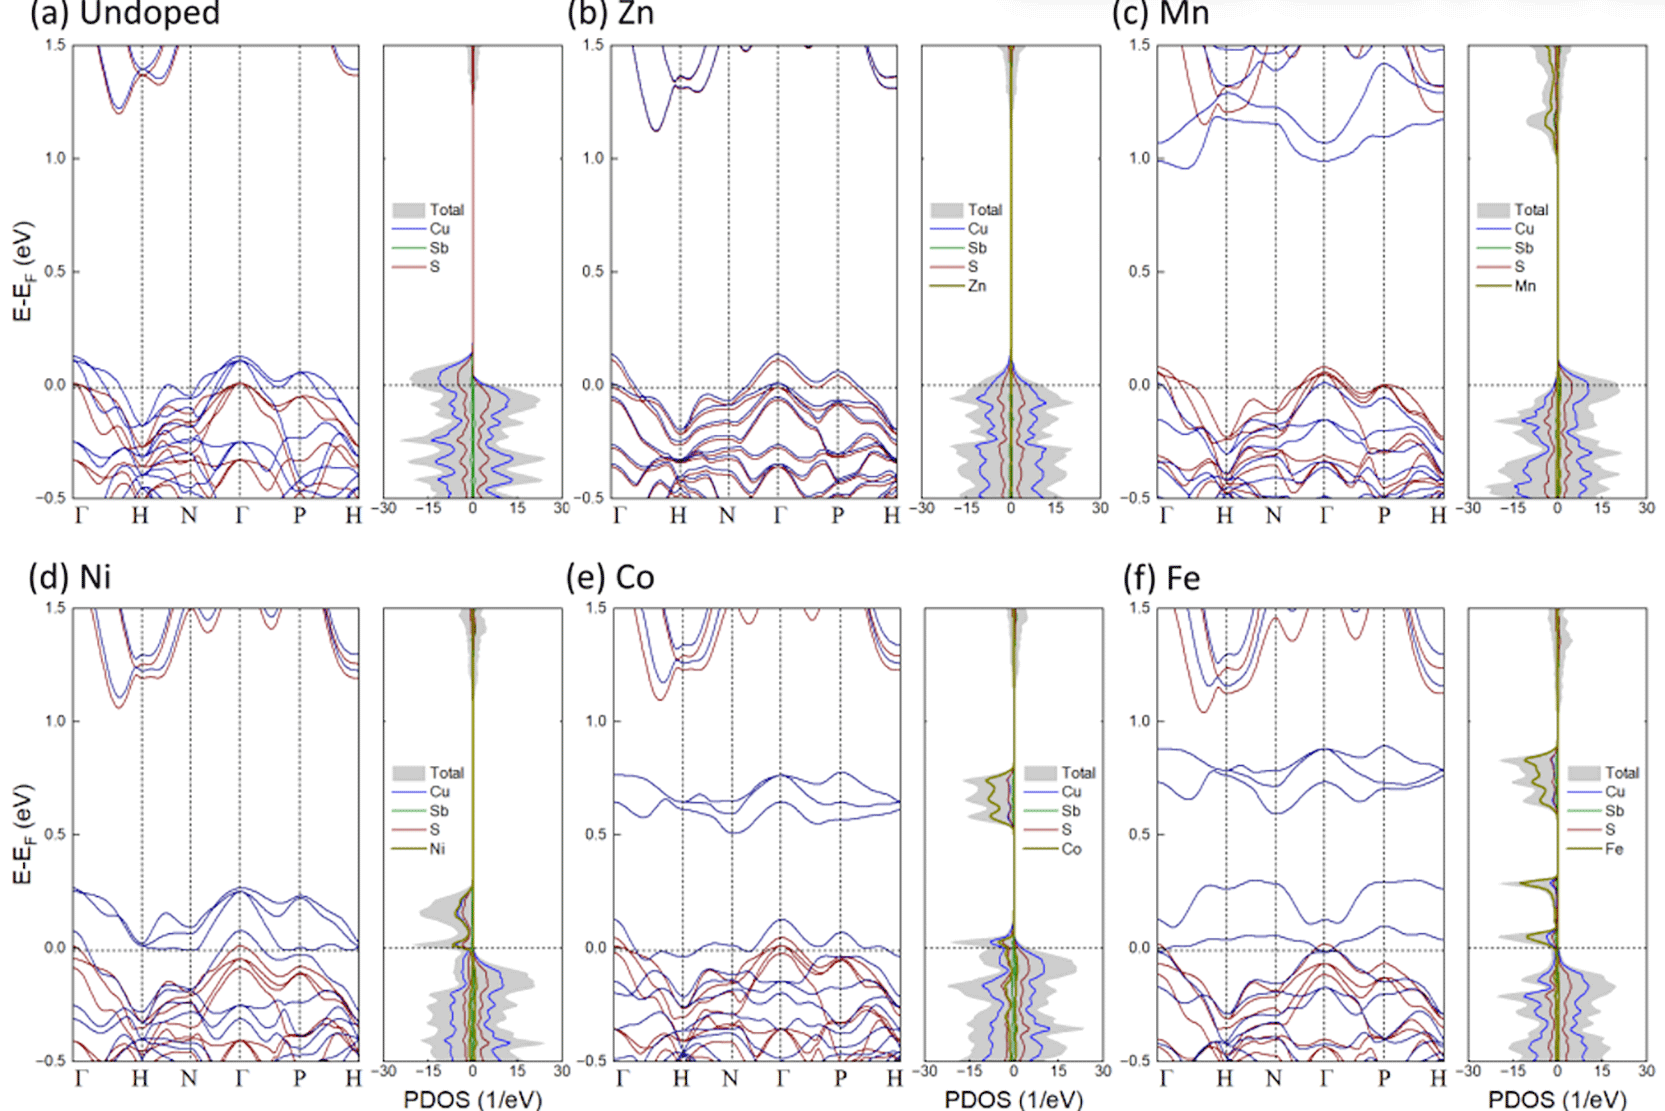
Figure 8. Spin-polarized electronic band structures and element-projected densities of states (PDOS)
, illustrating the progressive perturbation of the valence-band edge across the dopants.
(a) undoped tetrahedrite and Cu12–xMxSb4S13 with x = 1 and M being (b) Zn, (c) Mn, (d) Ni, (e) Co and (f
) Fe at Cu-12d. The PDOS highlights the increasing contribution of dopant d states near the valence-band edge across the series. In the band structures, blue and red lines correspond to spin-up-like and spin-down-like states, respectively, whereas in the PDOS positive and negative values represent spin-up and spin-down contributions.
Overall, these results confirm that holes are delocalised over the Cu–S network rather than associated with mixed Cu+/Cu2+ valence at 12d. Accordingly, the valence band is dominated by Cu 3d – S 3p hybridisation, supporting hole delocalisation near the Fermi level and underpinning quasi-metallic transport.
Figure 8b to 8h presents the band structures and PDOS of Cu12-xMxSb4S13 (x = 1). In all cases, substitution at the 12d site is found to be energetically preferred. The electronic response to doping is governed by the energy and hybridisation of dopant d states relative to the valence-band edge, which control band dispersion and thus μ. The dopants fall into three regimes of increasing perturbation of the undoped electronic structure (
Figure 8a).
In the weak perturbation regime (Zn, Mn), the valence-band edge remains largely unchanged. Zn adopts a closed-shell 3d10 configuration, placing its d states deep in the valence region, resulting in negligible hybridisation with valence states near the Fermi level. Consequently, band dispersion and high μ are preserved (
Figure 8b). The fully occupied shell also leads to identical spin-up and spin-down PDOS, reflecting the absence of exchange splitting. Mn introduces a partially filled d shell and spin polarisation; however, its states remain sufficiently removed from the valence-band edge and weakly hybridised, leaving the dispersive valence bands near the Fermi level largely intact (
Figure 8c).
In the moderate perturbation regime (Ni, Co), dopant d states lie closer to the Fermi level and hybridise with the Cu–S network, leading to noticeable but non-disruptive modifications of band dispersion. Ni induces moderate distortion of the valence band, while Co produces a slightly stronger restructuring and increased density of states near the Fermi level. In both cases, spin-dependent features arise from partially filled d shells, but the bands remain sufficiently dispersive to sustain carrier transport (
Figure 8d and 8e).
In the strong perturbation regime (Fe), the electronic structure is markedly altered. Fe-derived d states appear at the valence-band edge, forming a weakly dispersive band intersecting the Fermi level (
Figure 8f). The reduced dispersion and weak hybridisation indicate increased localisation, causing holes to occupy less delocalised orbitals. This enhances carrier scattering and disrupts transport pathways. The pronounced spin asymmetry reflects the partially filled 3d6 configuration and strong exchange splitting, leading to the most localised electronic behaviour among the dopants. This mechanism accounts for the experimentally observed reduction in σ for higher Fe concentrations).33,77,100,132
These calculations reveal that TE transport is governed by the degree of dopant–host hybridisation near the valence-band edge. Strong hybridisation preserves band dispersion and μ, whereas weakly hybridised states promote localisation and carrier scattering. Dopant–host hybridisation thus emerges as a unifying descriptor for the diverse transport behaviour reported across tetrahedrites.133–136 Finally, tetrahedrite exhibits temperature-dependent behaviour; a Jahn–Teller-driven structural transition of the Cu sublattice has been reported at low temperature,37 modifying the electronic states near the Fermi level. This suggests that hole distribution and transport evolve with temperature, and that a complete description requires coupling between electronic structure, lattice dynamics and structural distortions.
While the DFT calculations were restricted to x = 1—owing to the large supercells required for dilute substitution and the configurational complexity arising from multiple dopant arrangements—they provide a clear framework for interpreting concentration-dependent transport properties. Thus, DFT supports the statistical result that Fe is electronically distinct, while also showing why dopant identity alone cannot explain the broader performance dispersion.
The influence of dopant concentration for 0< x ≤ 2 on the measured σ, K and S was examined for Ni, which offers the largest dataset (N = 16), and for Fe and Zn, which are of particular interest due to their natural occurrence in mineral tetrahedrite (
Figure 9). Despite the limited datasets, discernible trends emerge: increasing dopant concentration generally reduces both σ and K for all three elements, whereas S increases nearly monotonically for Ni and exhibits apparent maxima for Fe and Zn (
Figure 9). The corresponding zT values are shown in
Figure 10, with high-performing data points highlighted by stars.
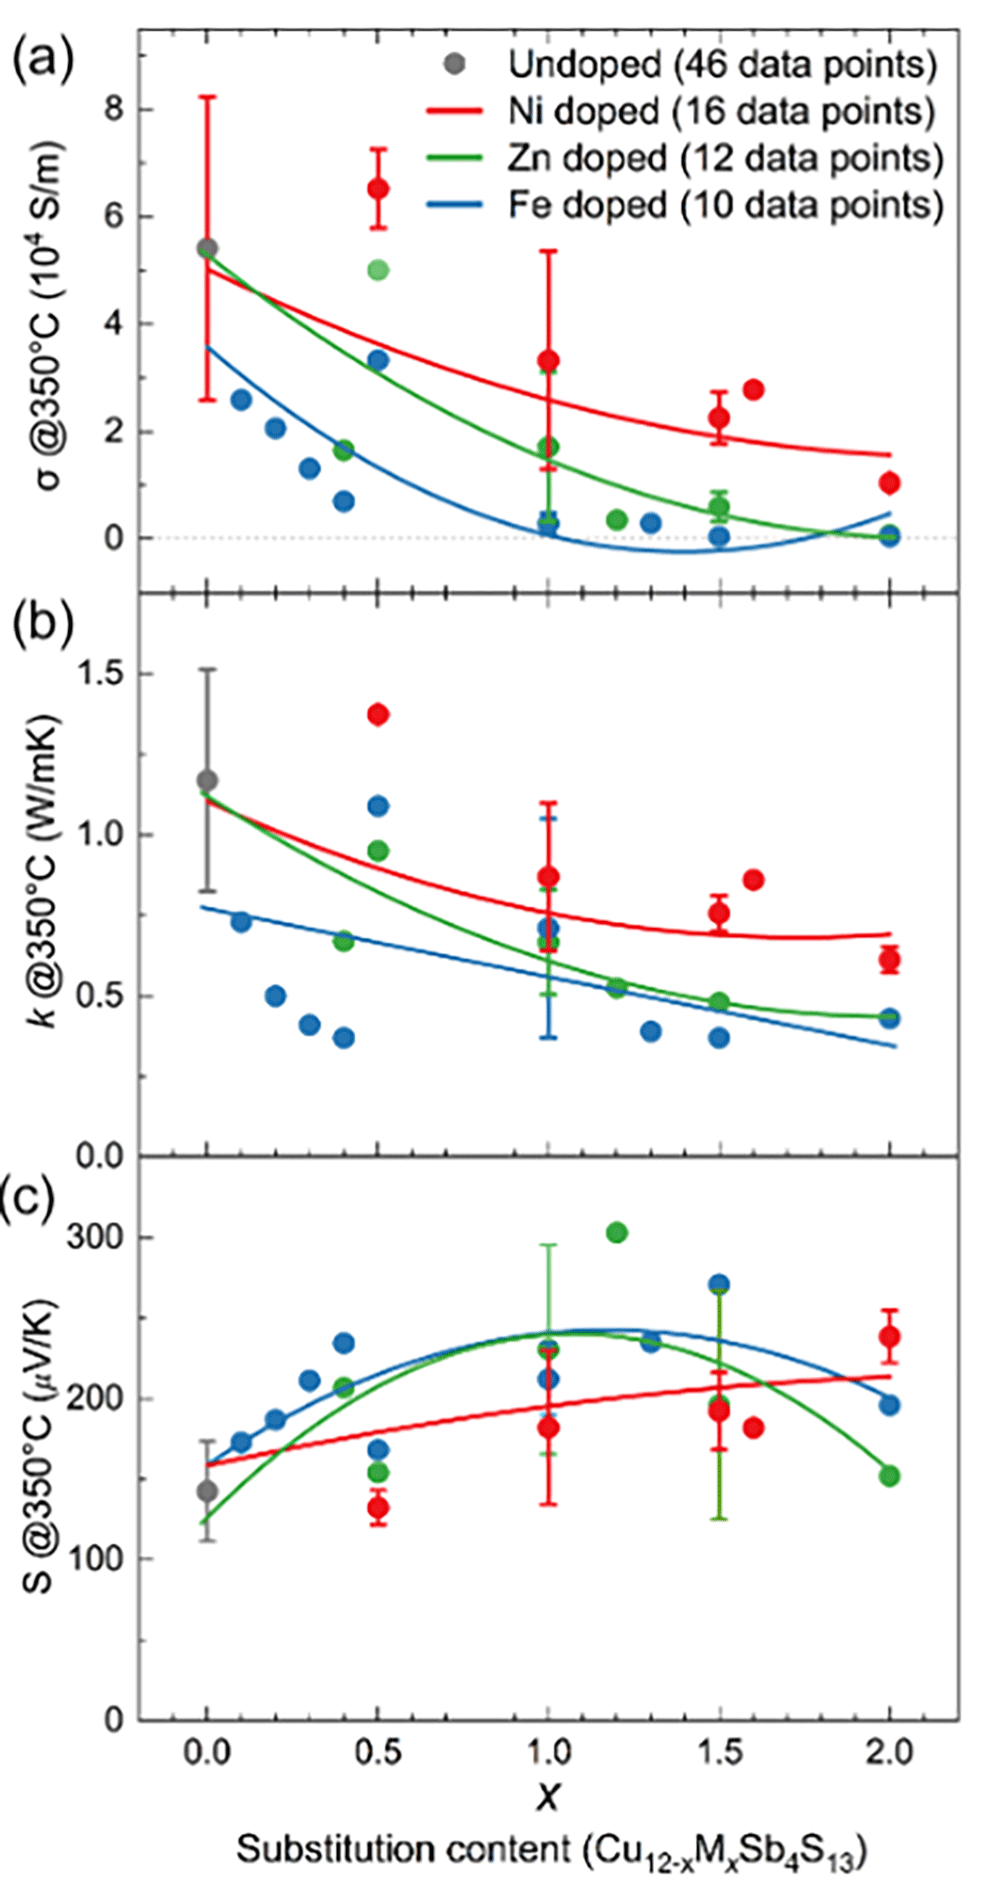
Figure 9. Effect of Ni-, Zn- and Fe-doping on the average transport properties.
(a) electrical conductivity, (b) thermal conductivity and (c) Seebeck coefficient measured at 350 °C. Values at x = 0 correspond to the undoped composition (grey circles representing 46 data points). Error bars correspond to the standard deviation. Co-doping data are excluded. Parabolic fits were added to guide the eye.
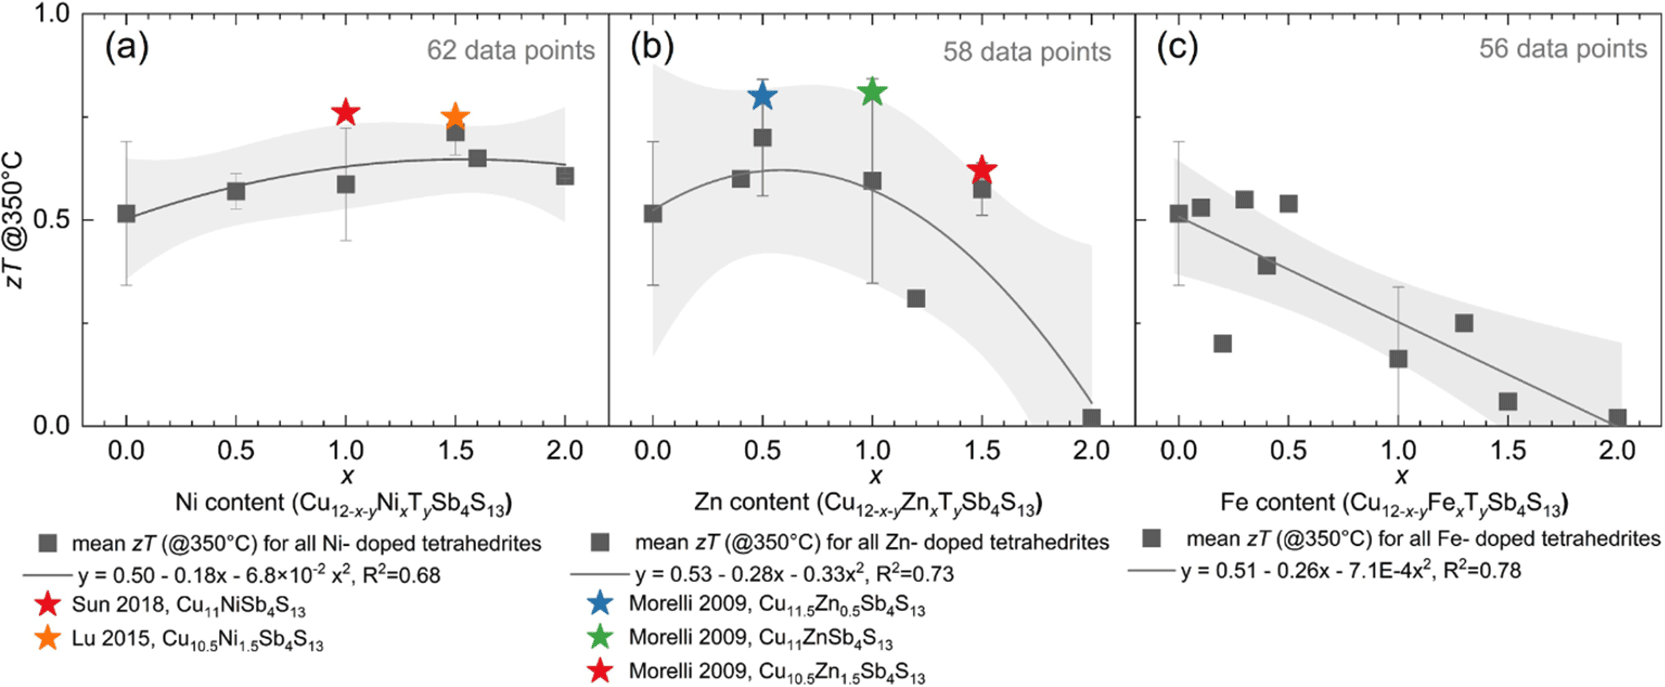
Figure 10. Average zT values at 350 °C.
(a) Ni-, (b) Zn- and (c) Fe-doped samples. Error bars correspond to standard deviation. Co-doped samples are excluded. The undoped material corresponds to 38 data points (at x = 0). The curves represent parabolas fitted to the points, with 95% confidence intervals shown in grey. Stars highlight individual values identified below the plots.
Doping with Ni yields consistently higher σ than the other elements across 0 ≤ x ≤ 2 (
Figure 9), indicating a more favourable balance between n and μ. This behaviour is consistent with the DFT results, where Ni belongs to the moderate perturbation regime and preserves relatively dispersive valence-band states. The resulting stability of zT over the full substitution range suggests that the modest reduction in μ is compensated by sustained enhancement in S and moderate suppression of K (
Figure 10a).
Since Zn has a fully filled 3d shell, it acts primarily as a charge-compensating dopant, reducing hole concentration and shifting the Fermi level deeper into the band gap as concentration increases. This behaviour aligns with the weak perturbation regime identified from DFT, where the Cu–S-derived valence band remains largely unchanged. Up to x = 1, the reduction in σ is relatively modest and is offset by decreases in K and increases in S, yielding zT values comparable to or slightly exceeding those of undoped tetrahedrite (
Figure 10b). At higher substitution levels, however, the strong reduction in n and the accompanying decline in S lead to suppressed zT, with the system approaching insulating behaviour at x = 2.24
Fe exhibits markedly different behaviour, consistent with its classification in the strong perturbation regime identified by DFT. Experimental studies indicate a concentration-dependent oxidation state, with Fe3+ dominating at low substitution levels (0 ≤ x ≤ 1) and increasing contributions from Fe2+ at higher concentrations.34,137 At high Fe content, mixed valence states enable electron hopping between Fe sites.138 The increasing activation energy for this process contributes to the suppression of σ with increasing Fe content.139 This behaviour is consistent with the DFT results, which show that Fe introduces weakly dispersive states at the valence-band edge, promoting localisation. Even at low substitution levels, this perturbation induces a pronounced reduction in σ. For x ≤ 0.5, the decrease in κ and enhancement in S partially compensate for this effect, maintaining zT comparable to undoped samples. At higher substitution levels, however, increased localisation and carrier scattering lead to substantial degradation of TE performance (
Figure 10c).
Antimony and sulphur substitution
Substitution at the Sb sublattice remains comparatively underexplored relative to the extensively studied Cu-site chemistry. Yet such substitutions are intrinsically relevant: natural tetrahedrites commonly incorporate elements such as As, Bi, and Te on Sb positions, reflecting a broad geochemical tolerance.140 Understanding how these substitutions influence TE performance is therefore essential for guiding compositional optimisation.
Figure 11 presents the average zT values for Sb-substituted tetrahedrites together with those of S-substituted materials, excluding co-doped compositions to isolate single-dopant effects. Statistical analysis using the Mann–Whitney U test shows no significant difference between either Sb or S substitutions and undoped tetrahedrite
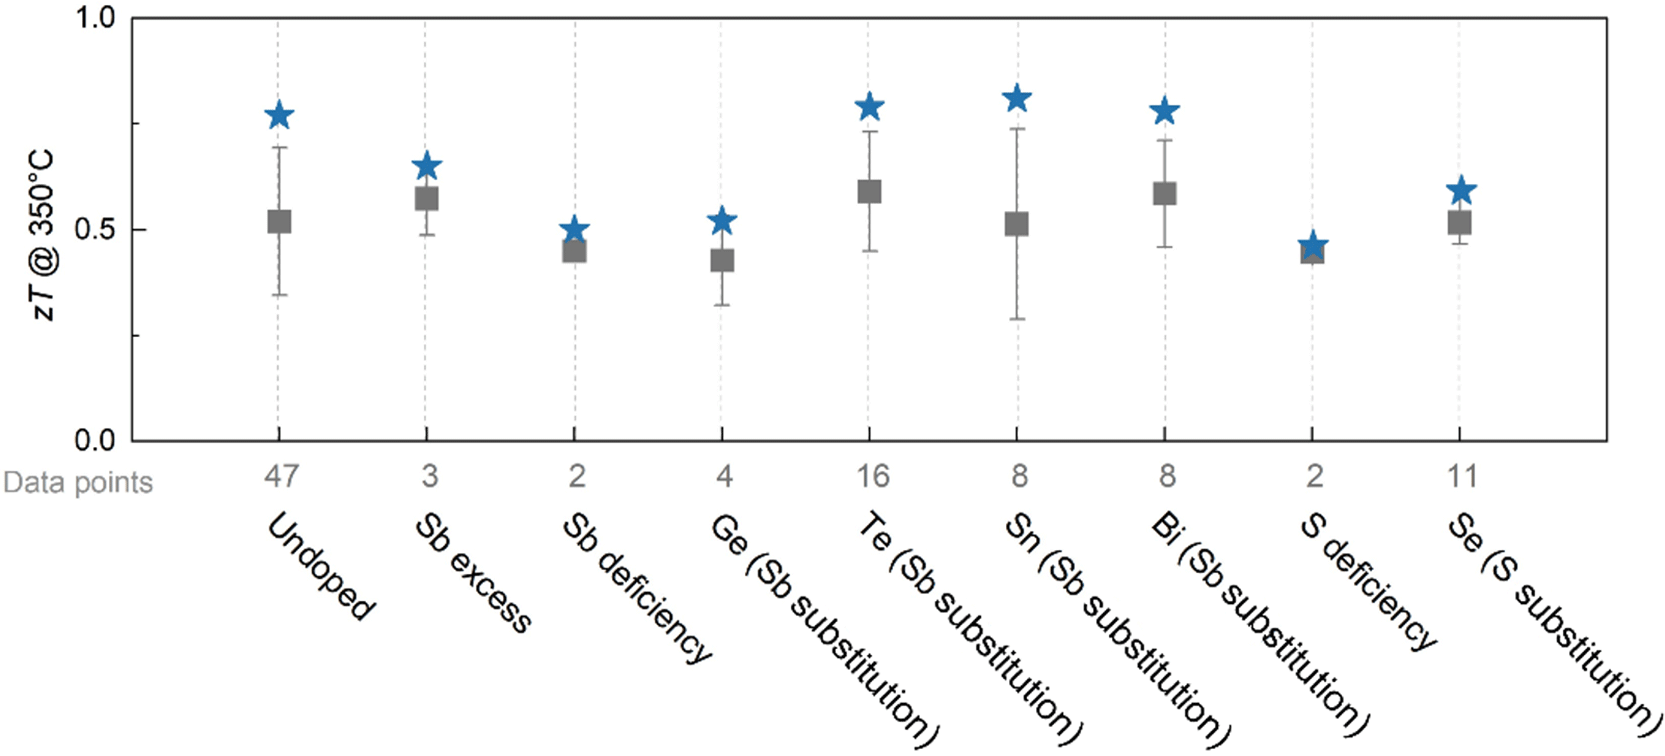
Figure 11. Average zT at 350 °C (squares) for undoped, Sb excess and deficiency, and S deficiency conditions, and Sb- and S-substituted tetrahedrites.
The error bars correspond to the standard deviation. The stars correspond to the highest value in each set, with details and references provided in Table S1.83 Co-doped compositions are excluded, and each class pools measurements across all doping levels. The number of data points is indicated below each class. The statistical analysis of dopant effects is presented in Table S2.83
(Table S2),83 indicating that any dopant-induced trends are masked by the scatter inherent to the limited dataset, the pooling of mixed concentrations within each class, and processing-induced variations.
Among Sb-site dopants, Te consistently yields high zT values (above 0.7).133,141,142 This behaviour can be rationalised by Te4+ substituting for Sb3+, with the excess electrons lowering the hole concentration, which enhances S.141,143 Bismuth substitution120,140 is nominally isovalent with Sb, but the possible presence of Bi5+ may similarly donate electrons, producing comparable reductions in hole concentration and corresponding increases in S.140
Substitution of sulphur has been investigated even less thoroughly.144–147 Although both the 24g and 2a sites have been proposed as viable substitutional positions,141 systematic studies are lacking, and S substitution is typically introduced indirectly as part of broader doping strategies.118,148
Overall, neither Sb nor S substitutions produce statistically significant changes in zT. However, several Sb-site dopants exhibit small but discernible effect sizes in the Mann–Whitney analysis, whereas S substitution shows no measurable influence within the available data, and its independent contribution to TE performance remains unclear.
Challenges in Hall effect measurements
Accurate determination of n and μ is essential for understanding the effects of doping, particularly when comparing different dopant species and substitution levels. However, obtaining reliable Hall effect data in these materials remains a significant experimental challenge. Numerous studies report Hall measurements as unreliable or inconclusive,23,43,63,112,116,117,149,150 and even when n and μ values are published, they are often accompanied by large uncertainties and require extensive averaging over repeated measurements.147,151 These difficulties arise from the relatively low μ in tetrahedrites, combined with microstructural complexity—such as porosity—which further reduces the measurable Hall voltage and increases susceptibility to artefacts.
Consequently, the underlying electrical transport mechanisms remain poorly resolved,151 hindering direct verification of n inferred from electronic-structure analysis and complicating quantitative comparison with theoretical predictions. Most Hall measurements are performed in the van der Pauw geometry, where the Hall voltages are extremely small and easily obscured by spurious Seebeck voltages generated by minute temperature gradients across the sample. More robust strategies are therefore required to obtain reliable values of n; these include low-temperature measurements, which suppress TE parasitic voltages, as well as AC Hall techniques, which can distinguish genuine Hall signals from thermally induced contributions.152
Conclusions
Tetrahedrites represent a promising class of p-type TE materials owing to their natural abundance, low toxicity, and intrinsically favourable transport properties. However, chemical optimisation in this system has been hindered by the large scatter in reported TE performance, which confounds clear optimisation strategies. To address this, a comprehensive meta-analysis of published transport data was performed, aggregating more than 6,000 TE property data points.
The meta-analysis reveals substantial variability in reported performance, underscoring the absence of clear optimisation pathways. Despite this variability, compositional trends emerged: moderate Cu substitution (x < 1) generally enhances zT through increased S and reduced κ, whereas higher substitution levels typically suppress σ and degrade overall performance. However, dopant identity is not the primary determinant of TE performance. Across most dopants, peak zT values vary only modestly, with Fe representing a notable exception due to its tendency to produce highly resistive samples. Instead, the analysis indicates that densification quality and microstructural features exert a stronger influence on zT than dopant chemistry at the present stage of material development.
The present findings indicate that the large variability reported in tetrahedrite performance arises primarily from differences in processing rather than composition. Advancing this material system therefore requires a shift in emphasis from compositional exploration toward improved control over consolidation, microstructure, and measurement reproducibility. Establishing standardised processing protocols together with quantitative correlations between microstructure and transport properties will be critical to fully realise the potential of tetrahedrites as sustainable TE materials.







