Introduction
Human-induced or natural habitat fragmentation has long been known to adversely affect population persistence and distribution (Fahrig & Merriam, 1994). In a fragmented habitat, theory predicts that the limited movement of individuals or limited gene exchanges among habitats enhances reproductive isolation and opens the way to genetic drift and loss of genetic diversity in small populations (Aguilar et al., 2008; Gittleman et al., 2000; Vranckx et al., 2012). As a consequence, the long-term survival and adaptive potential of populations is expected to decline in a fragmented habitat (Frankham, 1995; Wade et al., 2017). However, a recent meta-analysis demonstrated that a non-negligible part of populations thrived in fragmented habitats (Fahrig, 2017). For example, a higher abundance of sawtooth grain beetle and a higher species richness in ant communities were found in fragmented rather than continuous habitats (Bancroft & Turchin, 2003; Dauber et al., 2006). The mechanisms underlying the resilience of populations in fragmented landscapes remain poorly understood. (Fahrig, 2017; Fahrig et al., 2019).
Maintenance of high functional connectivity (i.e., the net flow of organisms and their genes moving among suitable habitat patches, Tischendorf & Fahrig, 2000) counteracting reproductive isolation might explain why some populations thrive in a fragmented habitat (Dick et al., 2003; Nason & Hamrick, 1997). To date, functional connectivity has been widely evaluated by using estimates of dispersal rates and genetic differentiation (Auffret et al., 2017). The flow of individuals or genes can only counteract reproductive isolation in the long term if migrant individuals successfully reproduce and migrant genes are successfully transmitted to the next generations (a mechanism known as effective connectivity; Cayuela et al., 2018; Robertson et al., 2018). For example, in snail kite populations characterised by a high dispersal rate, and therefore high functional connectivity, effective connectivity was limited because migrants had a low reproductive success (Robertson et al., 2018). Conversely, populations characterised by limited dispersal rates but thriving in a fragmented habitat might have maintained effective connectivity through high migrant reproductive success (Lowe & Allendorf, 2010). This latter hypothesis remains poorly tested, as few studies jointly assessed connectivity and migrant reproductive success in the wild (but see Robertson et al., 2018; Robertson et al., 2019; Vasudev & Fletcher, 2016).
In plants, functional connectivity involves the dispersal of seed and pollen, resulting in the establishment of a new adult plant (i.e., effective dispersal, Auffret et al., 2017; Schupp et al., 2010). Despite the use of parentage assignment in plant functional connectivity studies (Kamm et al., 2010; Moran & Clark, 2011; Sork et al., 1999), which offers the opportunity to assess the reproductive success of these new plants, their reproductive success has received little attention (Aguilar et al., 2019; Auffret et al., 2017). One reason for this is the need for a pedigree based on a long-term study. Here, we reconstructed a ten-year multigenerational pedigree of wild snapdragon plants (Antirrhinum majus L.) thriving in a fragmented landscape in southern France. These snapdragon plants inhabit patches of suitable Mediterranean scrubland isolated for a few hundred meters by seawater, which corresponds to the remains of a site where salt was manufactured by exploiting semi-natural crystallisation ponds. Here we assessed jointly functional connectivity between patches and the reproductive success of plants.
Seed dispersal by small animals and insects can generally reach ca. hundred meters (Uroy et al., 2019) and up to several kilometres when large or migratory animals are involved (Mueller et al., 2014; Vittoz & Engler, 2007). In snapdragon plants, seed dispersal occurs by gravity and should therefore be geographically-limited. We therefore did not expect seed dispersal to connect patches of land separated by seawater. Pollen dispersal might enable connectivity because snapdragon plants are pollinated by bumblebees, carpenter bees and other large-sized pollinators known to fly distances larger than the distance separating patches in this fragmented landscape (Chapman et al., 2003). However, the distance covered by these pollinators is potentially limited in a fragmented landscape, even at an extremely small spatial scale, e.g., across distances of ca. 40m (Goverde et al., 2002). Although landscape fragmentation may affect forests at the scale of kilometres, it might affect insect pollinated plants at the scale of a few hundred meters. We therefore expect to find typically limited functional connectivity and possibly genetic differentiation between these patches of snapdragon plants thriving in a fragmented landscape. We tested for the rarely explored hypothesis that connectivity would be effective on the long term; in other words, that the progeny resulting from migration between patches would successfully reproduce.
Results
Demographic expansion of snapdragon plants in a fragmented landscape
Over ten years (2010–2019), we sampled ca. twelve thousand flowering plants (N=12594) on six patches (from 2508 to 12547m 2 area) isolated from each other by a few hundred meters of seawater (from 158 to 1627m, Table 1). Our long-term survey data showed that these snapdragons are ongoing a demographic expansion. The population size has increased tenfold in ten years, with an average annual population growth rate (λ) ranging from 1.25 for the easternmost patch (Patch 6) to 1.75 for the patch3 and 5 (Table 2).
Table 1. Mean distance between and within patches in meters.
On the diagonal is the mean distance between individuals within a patch, in meters. Off-diagonal is the mean distance between individuals of the different patches, in meters.
| Patch 1 | Patch 2 | Patch 3 | Patch 4 | Patch 5 | Patch 6 |
|---|
| Patch 1 | 94.8 | | | | | |
| Patch 2 | 579.9 | 47.6 | | | | |
| Patch 3 | 947.9 | 407.5 | 23.5 | | | |
| Patch 4 | 1177.7 | 630.8 | 229.9 | 40.5 | | |
| Patch 5 | 1570 | 1014.9 | 622.1 | 392.6 | 46.2 | |
| Patch 6 | 1627.9 | 1057 | 690.1 | 472 | 158.7 | 20.4 |
Table 2. Growth rates per patch and year.
Population growth rates >1 (reflecting expansion) are in bold. If there was no individual sampled or only one individual sampled in a patch on a given year, the growth rate of the subsequent year could not be calculated. In this case, we reported the number of plants, in italics between brackets. Caution should be taken when interpreting patch 1 growth rates (see methods). Patch 1 growth rates are indicated for information only.
| patch |
|---|
| growth rate | 1 | 2 | 3 | 4 | 5 | 6 |
|---|
| Median | NA | 1.32 | 1.75 | 1.41 | 1.75 | 1.25 |
| 2011 | [11] | [43] | [1] | [28] | 3.17 | 1.4 |
| 2012 | [0] | 1.4 | 8 | 1.36 | 0.08 | 0.57 |
| 2013 | [161] | 6.72 | 7.5 | 2.53 | 14.5 | 5.5 |
| 2014 | 0.04 | 0.22 | 0.13 | 0.58 | 1.11 | 0.22 |
| 2015 | 78 | 4.69 | 14.88 | 1.46 | 3.46 | 5.05 |
| 2016 | 0.92 | 2.12 | 2.16 | 4.26 | 1.86 | 2.33 |
| 2017 | 2.04 | 0.6 | 0.32 | 0.21 | 0.7 | 0.49 |
| 2018 | 0.18 | 0.64 | 0.98 | 0.73 | 1.75 | 1.12 |
| 2019 | 3.02 | 1.23 | 1.33 | 2.04 | 0.91 | 1.25 |
High genetic diversity and low genetic differentiation
Genetic diversity (estimated by Nei’s expected heterozygosity and associated standard error; Hs±SE) was high in every patch of snapdragon plants in this fragmented landscape ranging from 0.678 for patch 4 to 0.707 for patch 5 (average Hs=0.69 ± 0.004). These diversity values are similar to those previously found in populations distributed across the species geographic range (average Hs=0.65±0,02; Pujol et al., 2017). Other genetic parameters (e.g., allelic richness) corroborating this high diversity can be found in Table 3). We also found low but significantly different from zero genetic differentiation amongst patches (Fst=0.04, p=0.001). Fst between pairs of patches ranged from 0.014 to 0.079 (p<0.001 for all pairwise Fst estimates; Table 4). We did not observe any identifiable trend in time or space shaping Fst (Figure 1).
Table 3. Descriptive statistics for microsatellites markers.
It includes the name of the locus (Locus), allelic richness (A), number of plants genotyped at a given marker (N), observed heterozygosity (Hobs), expected heterozygosity (Hexp), polymorphic information content (PIC), Parent-pair exclusion probability (PPexp). Estimates were calculated on data pooled among years and patches.
| Locus | A | N | Hobs | Hexp | PIC | PPexp |
|---|
| Antibg36 | 17 | 12486 | 0.848 | 0.880 | 0.868 | 0.910 |
| Antibg38 | 6 | 12541 | 0.594 | 0.608 | 0.533 | 0.488 |
| Antibg23 | 7 | 12539 | 0.546 | 0.579 | 0.545 | 0.558 |
| Antibg40 | 3 | 12546 | 0.642 | 0.658 | 0.584 | 0.513 |
| Antibg11 | 19 | 12526 | 0.831 | 0.829 | 0.811 | 0.853 |
| Antibg18 | 6 | 12542 | 0.587 | 0.604 | 0.559 | 0.552 |
| Antibg03 | 17 | 12512 | 0.633 | 0.659 | 0.627 | 0.656 |
| Antibg02 | 10 | 12516 | 0.773 | 0.809 | 0.785 | 0.815 |
| Antibg10 | 29 | 12317 | 0.642 | 0.842 | 0.824 | 0.864 |
| Antibg12 | 10 | 12550 | 0.653 | 0.65 | 0.597 | 0.564 |
| Antibg20 | 9 | 12494 | 0.691 | 0.723 | 0.80 | 0.687 |
| Antibg30 | 29 | 12470 | 0.875 | 0.925 | 0.920 | 0.961 |
| Antibg29 | 7 | 12545 | 0.564 | 0.576 | 0.494 | 0.436 |
| Antibg33 | 24 | 12511 | 0.827 | 0.888 | 0.878 | 0.926 |
| Antibg39 | 9 | 12536 | 0.576 | 0.598 | 0.569 | 0.591 |
| Antibg22 | 6 | 12517 | 0.691 | 0.742 | 0.699 | 0.692 |
| Antibg14 | 17 | 12503 | 0.855 | 0.893 | 0.884 | 0.928 |
| Antibg27 | 6 | 12557 | 0.457 | 0.461 | 0.385 | 0.326 |
Table 4. Pairwise Fst values between patches estimated in 2019.
All p-values are <0.0001.
| Patch | 1 | 2 | 3 | 4 | 5 |
|---|
| 2 | 0.042 | - | | | |
| 3 | 0.079 | 0.049 | - | | |
| 4 | 0.067 | 0.043 | 0.015 | - | |
| 5 | 0.048 | 0.035 | 0.035 | 0.022 | - |
| 6 | 0.064 | 0.048 | 0.034 | 0.029 | 0.014 |
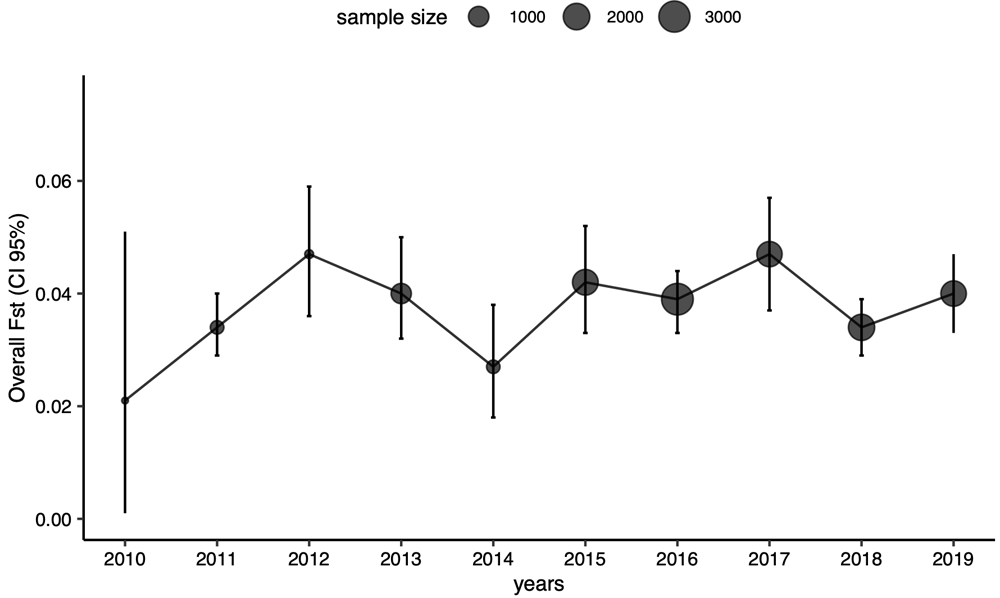
Figure 1. Genetic differentiation (multilocus Fst) amongst patches over 10 years.
Dots and bars around the dots correspond respectively to global Fst estimates measured amongst patches and their associated 95% confidence intervals. Dot size is proportional to the sample size used to estimate Fst.
Conservative parentage assignment and missing parentage links
The long-term survey of snapdragon plants allowed us to build a multigenerational pedigree including ca. 40% of the genotyped plants (N=5053; Figure 2). For 23% of the genotyped plants, both parents were assigned (n=2818 parent-offspring triads). We used greatly effective markers to reconstruct the pedigree (cumulated markers probability to exclude a ‘random’ individual from parentage, Wang, 2007, PPexp>0.999, see Table 3 for more details). Our assignment approach was highly selective. We only included parents with high assignment probability (above 95%) in the pedigree. Although this final pedigree is highly conservative, it comprises a large number of plants and family links; 5053 individuals with 2235 founders, 2818 offspring with two identified parents (for which 2815 have spatial coordinates), 805 offspring with only one identified parent, 2571 parents, 420 full-sibling links, 17170 half-sibling links (see Table 5 and Figure 2), which we except to be a representative sample at the scale of the six patches. These plants are grouped in 234 families spanning across one to five generations (Figure 2B) and composed on average by 21.5 individuals. The non-negligible part of plants with only one or no assigned parents was likely mothered or fathered by plants that we did not sample (Table 6). Plants measured at the beginning of the survey probably had parents from before the sampling campaign (e.g., 94 % of unassigned parents in 2012 against 52% in 2019). In addition, some parents were likely missed in the surveyed area during fieldwork even if we conducted a thorough search of sexually mature plants in the area. Unidentified parents might also likely be located outside the surveyed area. The presence of plants with at least one unidentified parent suggests migration from outside the studied area (Bacles et al., 2006; Sebbenn et al., 2011).
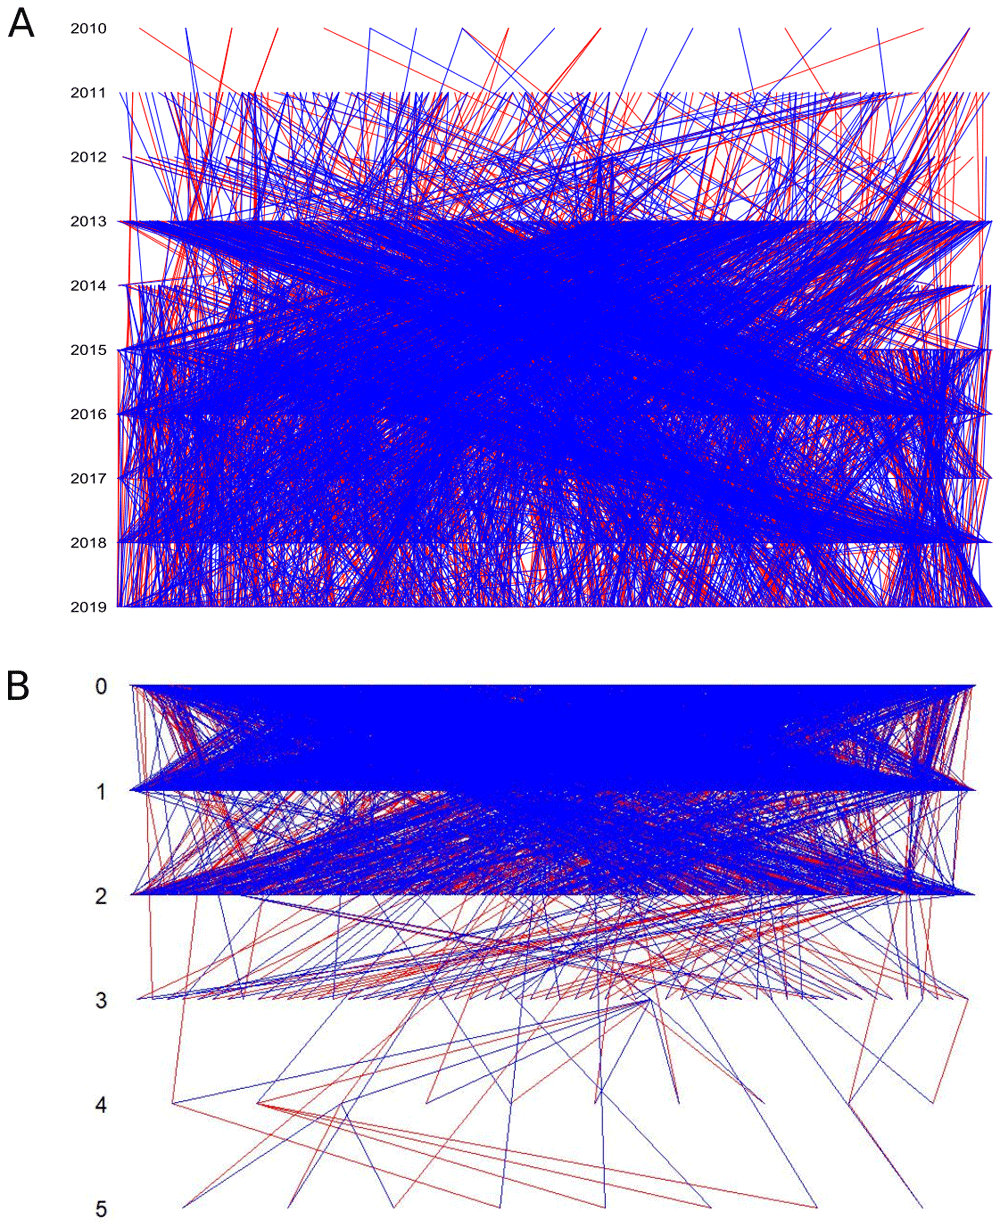
Figure 2.
Pedigree represented per year (A) and by generations (B). Each line represents a parent-offspring link. Red and blue lines represent the closest and the farthest parents, respectively.
Table 5. Pedigree description.
The final pedigree is only composed of parent-offspring triads.
| Quantity |
|---|
| Number of individuals in the pedigree | 5053 |
| Parent-offspring links | 5636 |
| Full sibling links | 420 |
| Half-sibling links | 17170 |
| Grand-parent offspring links | 1362 |
| Full avuncular links | 86 |
| Full first cousin links | 56 |
| Half avuncular links | 4596 |
| Number of founders | 2235 |
| Maximum pedigree depth (in generations) | 5 |
Table 6. Proportion of plants with one or two-unidentified parents per patches and year.
Due to A.majus biology and the beginning of the study, we identified parents only from 2012.
| Patches | 1 | 2 | 3 | 4 | 5 | 6 |
|---|
| 2 unidentified parents |
|---|
| 2012 | NA | 0.96 | 1 | 0.86 | 0.92 | 1 |
| 2013 | 0.92 | 0.88 | 0.91 | 0.77 | 0.83 | 0.87 |
| 2014 | 0.88 | 0.89 | 1 | 0.8 | 0.76 | 0.56 |
| 2015 | 0.81 | 0.75 | 0.65 | 0.65 | 0.7 | 0.75 |
| 2016 | 0.72 | 0.62 | 0.69 | 0.72 | 0.74 | 0.66 |
| 2017 | 0.75 | 0.64 | 0.45 | 0.68 | 0.69 | 0.63 |
| 2018 | 0.76 | 0.58 | 0.51 | 0.43 | 0.68 | 0.54 |
| 2019 | 0.61 | 0.52 | 0.38 | 0.47 | 0.6 | 0.54 |
| Median | 0.77 | 0.67 | 0.65 | 0.67 | 0.71 | 0.64 |
| Patches | 1 | 2 | 3 | 4 | 5 | 6 |
|---|
| 1 unidentified parent |
|---|
| 2012 | NA | 0.04 | 0 | 0.1 | 0.08 | 0 |
| 2013 | 0.08 | 0.07 | 0.07 | 0.16 | 0.12 | 0.09 |
| 2014 | 0.13 | 0.08 | 0 | 0.09 | 0.12 | 0 |
| 2015 | 0.11 | 0.07 | 0.15 | 0.15 | 0.11 | 0.11 |
| 2016 | 0.14 | 0.07 | 0.04 | 0.1 | 0.03 | 0.09 |
| 2017 | 0.11 | 0.07 | 0.18 | 0.21 | 0.06 | 0.04 |
| 2018 | 0.03 | 0.03 | 0.04 | 0.03 | 0.03 | 0.03 |
| 2019 | 0.06 | 0.03 | 0.01 | 0.08 | 0.03 | 0 |
| Median | 0.11 | 0.07 | 0.04 | 0.10 | 0.06 | 0.04 |
Low functional connectivity between the six patches
Functional connectivity was estimated by the rate of between-patch effective dispersal events (Auffret et al., 2017). The use of the multigenerational pedigree in combination with the spatial coordinates of the plants revealed that only 2.9% of offspring had one parent on a different patch (n=81 out of a total of 2818 offspring with two known parents, details per patch in Figure 3 and Table 7). This small proportion likely indicates low functional connectivity through effective pollen dispersal events among patches. On average, the pollen dispersal distance between patches was 345m (ranging from 99 to 1656m). In addition, we assumed that dispersal events between patches allowed us to identify the maternal parent located on the same site as the offspring. We estimated an average seed dispersal distance of 3.86m (ranging from 0.22 to 31.28m, Figure 4). Dispersal distance within patches ranged from 0.02 to 256.17m, including seed and pollen. Dispersal distances between patches were not necessarily higher than within patches (e.g., larger distances are found within patch 5 than between patch 5 and 6 or 3 and 4, Table 1). Yet only 37 dispersal events within patches out of 5359 (0.7%) occurred at a similar spatial scale than between-patch dispersal events (Figure 4).
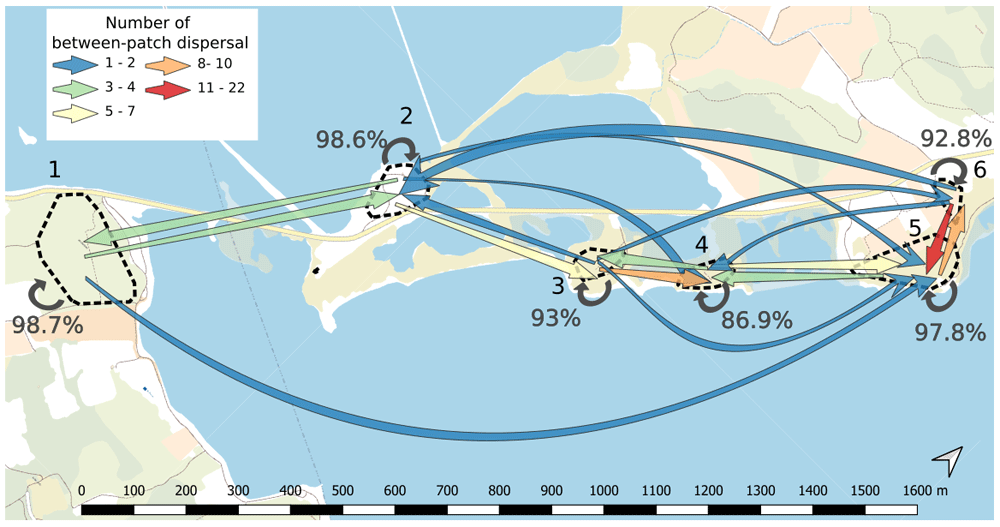
Figure 3. Connectivity map between patches.
Each patch is delimited by dashed line and its corresponding number going from 1 to 6. Arrows indicate the presence of effective pollen dispersal from a given patch to another. The number of between-patch dispersal events ranges from 1 to 22 events and the colour of arrows represents this number (from blue to red, see legend on the figure). Circular arrows on each patch represent self-recruitment and are accompanied by the corresponding percentage. Background map is provided freely by IGN at https://www.geoportail.gouv.fr/donnees/plan-ign-v2.
Table 7. Functional connectivity per patch all years combined.
Outbound connectivity is the percentage of offspring on a different patch with the farthest parent on a given focal patch. Inbound connectivity is the percentage of offspring on the given focal patch with the farthest parent on a different patch. Total connectivity is the sum of inbound and outbound connectivity.
| Patch | 1 | 2 | 3 | 4 | 5 | 6 |
|---|
| Outbound connectivity | 1.7% | 2.3% | 8.6% | 8.1% | 1% | 16% |
| Inbound connectivity | 1.3% | 1.4% | 6.9% | 13% | 2% | 7.2% |
| Total functional connectivity | 2.95% | 3.69% | 14.45% | 19.29% | 2.98% | 20.86% |
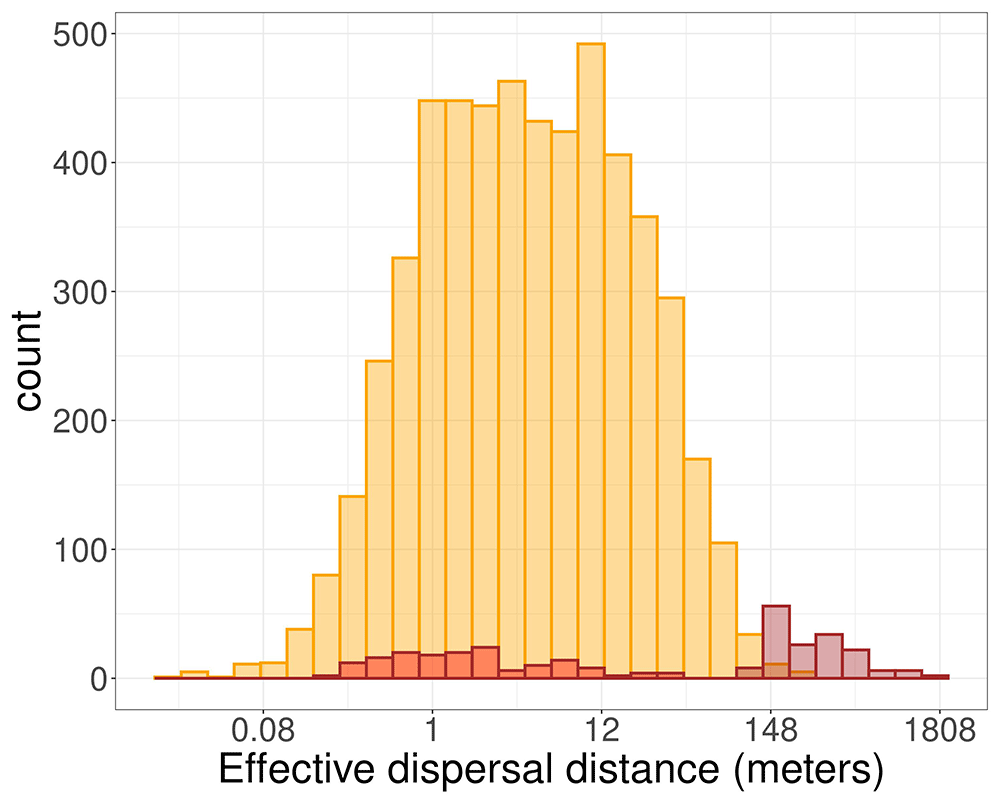
Figure 4. Distributions of the effective dispersal distances.
Yellow bars represent dispersal distance between parent-offspring triads inhabiting the same patch. Bars with brown borders represents distance between parent-offspring triads, with one parent inhabiting on a different patch. Brown-bordered bars filled in red represent the distance between the closest parents and the offspring, which is more likely representing seed dispersal, while brown-bordered bars filled in brown represent the distance between the farthest parents and the offspring.
Little spatial and temporal variation in connectivity
Functional connectivity varied both spatially and temporally, but to a low extent. It increased from 2.8% in 2014 to 4.5% in 2016 and finally decreased to 1.4% in 2019.
At the spatial level, it decreased with the between-patch geographical distance (rho=-0.75, p=0.001), ranging from 0% between several pairs of patches separated by distance ranging from 472m to 1627.9m; to 1.9% between patches 5 and 6 separated by 158.7m (Figure 3).
Effective connectivity
Functional connectivity between patches was effective. We found that 64% of plants resulting from between-patch dispersal events successfully reproduced over the duration of the survey. Plants resulting from between-patch dispersal events had on average 0.79 offspring per plant. These plants had around twice as many offspring as plants with two resident parents that had on average 0.43 offspring (regression model parameter back-transformed estimate: 2.151, CI95%: 1.05-4.41, p=0.036).
Discussion
Our survey revealed that thousands of snapdragon plants were thriving on patches of Mediterranean scrubland interrupted by seawater ponds formerly exploited for salt production. We found that these plants were undergoing demographic growth and characterized by high levels of genetic diversity that were similar to those of continuous populations at similar spatial scales (Pujol et al., 2017; Ringbauer et al., 2018). The good condition of these snapdragon plants makes it an interesting system for investigating the mechanisms by which populations are not adversely affected in a fragmented landscape. The low but statistically significant genetic differentiation between patches, which illustrates the balance of evolutionary forces that are migration and genetic drift, provided an ambiguous message about the potential actual reproductive isolation of patches. This result could be explained by genetic drift being at equilibrium with migration, with genetic drift caused by a low effective population size resulting from a small number of founders and migration being limited as a result of weak connectivity. Genetic differentiation would then reflect a history of patches drifting apart. An alternative scenario is that of evolutionary change, where this same divergence reflected by genetic differentiation would be in the process of being resolved by recent migration resulting from effective connectivity. We used a connectivity approach based on the reconstruction of a multigenerational pedigree to clarify whether these snapdragon plants were reproductively isolated in this fragmented landscape.
Low functional connectivity across the fragmented landscape
Our results showed that 2.9% of offspring resulted from dispersal events between patches of snapdragon plants, which is coherent with our genetic differentiation results (e.g. one migrant per generation rule, Whitlock & McCauley, 1999; Mills & Allendorf, 1996). Similar low percentages have previously been found in other species inhabiting fragmented landscapes and were considered to indicate limited functional connectivity (Mueller et al., 2014; Sebbenn et al., 2011). Higher connectivity – up to an order of magnitude greater – has also been found in other species inhabiting fragmented landscapes (Bacles & Ennos, 2008; Hebel et al., 2007; Wang et al., 2010). It is therefore legitimate to consider that our results show functional connectivity between snapdragon plant patches. However, our results also outlined that connectivity is limited in this fragmented Mediterranean scrubland landscape where ecological barriers such as the seawater ponds separating the patches might have limited the movement of pollinators. Bumblebees and carpenter bees are the main pollinators of snapdragon plants (Tastard et al., 2012). They are known to cover long distances (Chapman et al., 2003). For instance, we detected pollen dispersal events between patches over distances up to 1656 meters. However, pollinators able to cover long distances rarely do so frequently (Walther-Hellwig & Frankl, 2000; Zurbuchen et al., 2010). Pollination might have typically been favoured between neighbouring plants 2 (Kunin, 1997; Tastard et al., 2012). Our findings therefore did not support one of the possible explanations put forward for populations thriving in fragmented landscapes, namely the presence of high functional connectivity (Fahrig, 2017; Fahrig et al., 2019).
Higher reproductive success associated with connectivity
Reconstructing the multigenerational pedigree of wild populations is challenging but rewarding because it also provides information about the reproductive success of plants. Our results showed that plants resulting from between-patch dispersal events had higher reproductive success than plants with resident parents. While this might be the result of random processes (e.g. colinisation waves, Excoffier et al., 2009), organisms colonising new habitats (e.g., geographic range expansion, biological invasion) are expected to have a higher fitness than the average fitness of resident organisms (Bonte et al., 2014; Ronce, 2007). Organisms inhabiting fragmented landscapes can also be selected for their potential to invade other patches (e.g, plant height, seed mass Williams et al., 2019). Our findings highlight the knowledge gained by evaluating offspring quality beyond the count of their number (Aguilar et al., 2019). Although functional connectivity was low, migrant genes from other patches were therefore successfully integrated into the resident gene pool. Our findings contrast with a study in endangered birds where functional connectivity remained high in the fragmented landscape but the reproductive success was low, which was detrimental to the species (Robertson et al., 2018; Robertson et al., 2019). Our approach in the wild cannot identify the mechanisms underlying the higher reproductive success of snapdragon plants resulting from between-patch dispersal events nor the causal relationship between this reproductive success and population demographic expansion. However, it exposed a remarkable aspect whereby low functional connectivity in fragmented landscapes is at least partly effective because of a high migrant reproductive success. The high reproductive success of migrants likely participates to compensate the negative impact of reproductive isolation. The links between this mechanism and population growth remains to be explored.
Conclusion
Our study in snapdragon plants adds up to the recent awareness that some species have the potential to thrive in a fragmented landscape. Our findings support an often-neglected hypothesis whereby typical low connectivity in a fragmented landscape might be rendered more effective by a higher reproductive success of migrants. The extent to which migrants successfully transmit their genes to the next generations is rarely evaluated (Aguilar et al., 2019; Robertson et al., 2018). Our findings highlight the benefit of integrating the reproductive success of migrants in studies evaluating connectivity in a fragmented landscape.
Methods
Study population and data collection
Snapdragon plants (Antirrhinum majus L., Plantaginaceae) are short-lived, herbaceous perennials. Their geographic distribution is restricted to southern Europe, over the eastern half of Pyrenees Mountains, and extending south and north along the Mediterranean coast from Barcelona to Montpellier (Khimoun et al., 2011). They grow in a variety of environments, including Mediterranean scrubland, scree, understorey vegetation, grassland meadows and sparse shrubland (Khimoun et al., 2013). They are hermaphroditic, self-incompatible, and produce annual inflorescences with zygomorphic flowers pollinated mainly by bumblebees (Bombus spp) and carpenter bees (Xylocopa violacea) and small seeds dispersed by gravity a few meters apart from the plant (Andalo et al., 2010)
Here we focus on snapdragon plants located in a Mediterranean scrubland ecosystem in southern France; between Bages (Latitude: 43.1167; Longitude: 2.9833) and Peyriac de Mer (Latitude: 43.0833; Longitude: 2.9667). Those plants persist on six small isolated rocky hills separated by salt lakes that used to be “Saline d’Estarac”; a site where salt was manufactured from crystalisation ponds using solar evaporation between the years 1007 and 1940 (Dupont, 1958; Larguier, 2014). As a consequence, this fragmented landscape constrains plants to a patchy distribution.
Between 2010 and 2019, we monitored wild snapdragon plants in the six patches isolated by a few hundred meters of seawater. All patches (numbered 1 to 6 from southwest to northeast) were surveyed between June and early July when plants are sexually mature and the reproductive season ends. All sexually mature snapdragon plants were identified after a thorough search of the area of the six patches (n=12594). Four leaves per plant were sampled for DNA extractions. The geographic location of most plants (12495 out of 12594) was recorded using a GNSS receiver (GNSS device Geo7X, Trimble, Westminster, USA) that provided us with high precision coordinates (sub-meter precision) after the data were post-processed by comparison with data from an independent monitoring station. Based on the barycenter of plant coordinates within a given patch, we calculated the mean distance between patches in meters. We also calculated the mean distances separating plants within patches. All plants, including those without geographical location (n=99), have a patch number corresponding to their location.
To assess the demography of snapdragon plants, we estimated the annual growth rate in every patch as λ = NT–1/ NT , where NT is the number of individuals in the current year and NT-1 the number of individuals in the previous year. If λ>1 the population is increasing, if λ<1 the population is decreasing, if λ=1 the population is stable (Pradel, 1996). Caution should be taken with patch 1 growth rates. We reported these values for information only. They are not interpretable per se because as the sampling strategy area might have varied form one year to the next (notably in 2015) due to the spatial heterogeneity of the patch. We do not expect this issue with patch 1 growth rates to interfere with genetic analyses.
DNA extraction and genotyping
DNA was extracted from leaf tissue using the Nucleospin 96 Plant II (Macherey Nagel, Hoerdt, France). After DNA extraction, samples were amplified at 20 polymorphic microsatellite loci (Debout et al., 2012) using 3 multiplexes (A, B, C, Table 7). Each PCR was performed on a 10 μL total volume: 2 μL of a DNA extract; 3.5 μL QIAGEN Multiplex PCR Kit (Qiagen, Venlo, Limburg, The Netherlands); 0.4 to 0.6 μL of primer mix solution (Eurofins Genomics, Luxembourg, Luxembourg, depending on the multiplex see Table 7) and the remaining volume was completed with DNA-free water. PCRs were performed using a Mastercycler pro Thermal Cyclers (Eppendorf, Hamburg, Germany) with the following protocol for each multiplex: an initial denaturation step at 94°C for 15 minutes, followed by 35 cycles of 94°C for 30 seconds; 56°C (primer-specific annealing temperature) for 135 seconds; 72°C for 30 seconds; and a final extension at 60°C for 30 minutes. PCR products were sent to the Genoscreen DNA sequencing platform (Lille, France) where samples were analysed on an Automated Capillary DNA Sequencer (ABI 3730, Applied Biosystems, Foster City, CA, USA) using 2 μL of multiplexed PCR products, which were added to 7.75 μL of Hi-Di Formamide and 0.25 μL of the GeneScan-500 LIZ size standard (Applied Biosystems). Allele sizes were scored using GENEIOUS version 9.1 software (Biomatters, Auckland, New Zealand) and double cross-checked. We ensured that there were no genotype duplicates with the R package Allelematch (Galpern et al., 2012). Finally, we ensured marker quality by keeping loci with less than 5% missing data (n=18 microsatellites), and kept individuals with less than 10% missing data (n=12428) for further analysis.
Table 8. Primer sequences for 20 microsatellites loci in the A.majus population.
For more details on the markers see Debout et al., 2012.
| Locus | Primer sequences (5’-3’) | Multiplex
markers sets |
|---|
| Antibg11 | ATCAACCTGCATCACACCTG
TGAATTACGTGAGCGTCGTC | A |
| Antibg23 | TCATCACATTTCAATTCATCACA
TTGCTTGCTCCAAGTGTTTG | A |
| Antibg32 | GATCCGTGAGGAGTGTGGTT
CGGCAATCTAATCTCCGAAA | A |
| Antibg36 | TGCGTTAGATGATTGCCAAA
AAGCTTCCGCTACGTCAGTT | A |
| Antibg38 | CCAAGGAGAAGAAAATGTGAGG
ATTAGGGAACCTCCAACGCT | A |
| Antibg40 | CTCCTCTTCTCACCCGACAT
CCCCTCCCTTTCCTAGTTCTT | A |
| Antibg02 | TCTGGCAGCAAAAGGTAGAAA
CGTGGGAGTTGAAGGAATGA | B |
| Antibg03 | TTCTTCAAAGGCAAGCAGGT
CATGCTCCTCGTGTGGAAT | B |
| Antibg10 | AAACGCATATCCAAAGCAGG
CGAAGACCTGCATGACAAAC | B |
| Antibg12 | GCATGAAGCCCTGGAAATAA
CTCAATGTGACAACTGCATCA | B |
| Antibg18 | TTTGCTTTATGTCTTGGTCACCT
GACGTGGTGATCAGCTAGGA | B |
| Antibg20 | AACCAACAAAGCGAACAACC
ATTCGTGACCGTAGAGACCG | B |
| Antibg21 | AACTGGGTTTCCTTTCCCAG
TTGAGAAATTACCATCATTGTTGTC | B |
| Antibg14 | GAGGAAGCGATATCAAGGTATGA
TGCTGCCTCCATACAGAAGA | C |
| Antibg22 | TTCATCGAATTCTTCGTTCG
AAACAACGCAATCCGATCTC | C |
| Antibg27 | CGTCGCTAGTTTTCAGCCTC
AAATGGTTGCATCCTCCAAG | C |
| Antibg29 | TTTGAAAGCATTTTCGGGAC
CTGTACACTCTGCCGGTCAA | C |
| Antibg30 | TCCTTTCATTCCTCTCCATCA
TTTGGAGCCACCTTCATTTC | C |
| Antibg33 | CAAATGACATCCAAAAGATAATACAA
AGAGATTTAGGCGATACAAGCA | C |
| Antibg39 | ATACTGGGACCCACAAGCTG
CTTCACCAAACCGCAAGATT | C |
Population genetic differentiation
We estimated the genetic diversity of snapdragon plants in the six patches by using estimates of expected heterozygosity (Hexp), observed heterozygosity (Hobs), polymorphic information content (PIC), and allelic richness (A) for each markers. We also used Nei’s multilocus estimates of expected heterozygosity with its standard error , within patch (Hs±SE). Analyses were conducted with the FRANz software (Riester et al., 2009; Riester et al., 2010).
We estimated genetic differentiation between pairs of patches by calculating Wright’s fixation indices (Fst) using Weir and Cockerham’s θST estimates (1984) in GENODIVE v2.0 (Meirmans & Van Tienderen, 2004). For genetic differentiation analyses, we removed markers that deviated significantly from Hardy-Weinberg equilibrium (all years confounded, n=7 removed markers) as implemented in GENODIVE v2.0. We also estimated global Fst amongst patches. Genetic differentiation was also measured per year to investigate temporal variation in Fst. Significance of probabilities for Fst values were estimated using permutations of alleles, either overall or between pairs of populations.
Parentage analysis and pedigree reconstruction
We ensured that the set of microsatellite markers that we used was highly reliable for parentage analysis by estimating Parent-Pair exclusion probability (PPexp, Wang, 2007). PPexp for each marker and cumulative PPexp were estimated with the FRANz software (Riester et al., 2009; Riester et al., 2010). Individuals were assigned to parental genotypes using a Bayesian pedigree reconstruction approach that takes into account uncertainty about age; with age being estimated by the software on the basis the first year of sampling of each plant. We performed the parentage analysis in FRANz with the default parameter settings, except for: maximum number of candidate fathers (Nmax=14000), age range in which females and males can reproduce (femrepro=0:20; malerepro=0:20) to largely cover their lifespan, minimum number of typed loci (mintyped=16), convergence tolerance (saepsilon=0.1) and increment in the steady states distribution variation (sadelta=0.01) (see Almudevar, 2003 for more details on parameterisation).
We only included in the final pedigree the parentage assignments with a posterior probability higher than 0.95, which indicates that this parentage link was found in at least 95 of the 100 potential pedigrees reconstructed by using the assignment approach presented above. We only kept individuals with two reliably assigned parents (triads) to avoid false assignments arising from overlapping generations when using dyads. Each triad (offspring, parent1 & parent2) is also characterised by location information (patches from 1 to 6), GNSS coordinates, and their first year of sampling. We produced descriptive pedigree statistics (e.g. number of parent-offspring relationships, number of full sibling links, etc.) by using the Sequoia (v2.1.3, updates for hermaphrodites, Huisman, 2017) and Pedantics (Morrissey & Wilson, 2010) R packages. The type of family relationship between individuals were identified with the function GetRelCat of the Sequoia package. Individuals were then assigned to families to identify the different types of families, the number of family members, and their spread across generations with the package kinship2 (Sinnwell et al., 2014) (makefamid function).
Functional connectivity and geographical distance among patches
Based on the parentage assignment and the location of plants, we estimated the number of within-patch dispersal events (i.e., when parents and offspring are found in the same patch), and between-patch dispersal events (i.e., when at least one parent is found on a different patch than the offspring). Dispersal distance was estimated by the geographical Euclidean distance in meters between parents and offspring using the R package Raster (Hijmans et al., 2021). The closest parent (P1) was consistently located in the same patch than the offspring, which was expected because seeds are dispersed by gravity. Functional connectivity was estimated as the ratio of the total number of between-patch dispersal events and the total number of effective dispersal events overall patches. We also estimated per patch, outbound connectivity as the percentage of offspring on a different patch with the farthest parent on a given focal patch, inbound connectivity as the percentage of offspring on the given focal patch with the farthest parent on a different patch and total connectivity per patch as the sum of inbound and outbound connectivity. Finally, we tested whether patch-pairwise functional connectivity – estimated as the sum of effective dispersal events between two patches divided by the sum of effective dispersal events of these patches multiplied by 100 – was correlated with between-patch geographical distance by using a Spearman correlation test.
Reproductive success
To assess if functional connectivity was effective, we used the multigenerational pedigree to calculate the reproductive success estimated by the number of offspring of each plant resulting from a between-patch dispersal event, and each plant with resident parents. We removed plants sampled during the last two years of the survey (2018 and 2019) to avoid a temporal bias because the probability of finding their offspring in the field was weak. We assessed if the reproductive success was different between plants resulting from between-patch dispersal events, and plants with resident parents. To this aim, we built a negative binomial linear mixed model with a logit function to linearize the reproductive success count data, which accounts for count data overdispersion. We included the “dispersal status” of parents as a fixed effect (0 for resident parents and 1 for parents from different patches). We also included in the model the random effects on the intercept of the identity of patches and the closest and farthest parent to account for the non-independence of observations due to their location and genotype. This model was computed with the glmmTMB package (Magnusson et al., 2021). We checked that the necessary assumptions of the model were respected (e.g., uniformity, overdispersion, outliers) with the DHARMA package (Hartig & Lohse, 2021). All analyses have been conducted with R version 3.6.3 (R Core Team, 2020).
Acknowledgements
We thank the two reviewers for their comments that significantly improved the quality of this article. We thank Sara Marin for her contribution to phenotypic and genetic data collection. We would also like to thank numerous co-workers and volunteers for their assistance in the field data collection over the last ten years.
Faculty Opinions recommendedReferences
- Aguilar R, Cristóbal‐Pérez EJ, Balvino‐Olvera FJ, et al.:
Habitat fragmentation reduces plant progeny quality: A global synthesis.
Ecol Lett.
2019; 22(7): 1163–1173. PubMed Abstract
| Publisher Full Text
- Aguilar R, Quesada M, Ashworth L, et al.:
Genetic consequences of habitat fragmentation in plant populations: Susceptible signals in plant traits and methodological approaches.
Mol Ecol.
2008; 17(24): 5177–5188. PubMed Abstract
| Publisher Full Text
- Almudevar A:
A simulated annealing algorithm for maximum likelihood pedigree reconstruction.
Theor Popul Biol.
2003; 63(2): 63–75. PubMed Abstract
| Publisher Full Text
- Andalo C, Cruzan MB, Cazettes C, et al.:
Post-pollination barriers do not explain the persistence of two distinct Antirrhinum subspecies with parapatric distribution.
Plant Syst Evol.
2010; 286(3): 223–234. Publisher Full Text
- Auffret AG, Rico Y, Bullock JM, et al.:
Plant functional connectivity – integrating landscape structure and effective dispersal.
J Ecol.
2017; 105(6): 1648–1656. Publisher Full Text
- Bacles CFE, Ennos RA:
Paternity analysis of pollen-mediated gene flow for Fraxinus excelsior L. in a chronically fragmented landscape.
Heredity (Edinb).
2008; 101(4): 368–380. PubMed Abstract
| Publisher Full Text
- Bacles CFE, Lowe AJ, Ennos RA:
Effective Seed Dispersal Across a Fragmented Landscape.
Science.
2006; 311(5761): 628. PubMed Abstract
| Publisher Full Text
- Bancroft JS, Turchin P:
An Experimental Test of Fragmentation and Loss of Habitat with Oryzaephilus Surinamensis.
Ecology.
2003; 84(7): 1756–1767. Publisher Full Text
- Bonte D, De Roissart A, Wybouw N, et al.:
Fitness maximization by dispersal: Evidence from an invasion experiment.
Ecology.
2014; 95(11): 3104–3111. Publisher Full Text
- Cayuela H, Rougemont Q, Prunier JG, et al.:
Demographic and genetic approaches to study dispersal in wild animal populations: A methodological review.
Mol Ecol.
2018; 27(20): 3976–4010. PubMed Abstract
| Publisher Full Text
- Chapman RE, Wang J, Bourke AFG:
Genetic analysis of spatial foraging patterns and resource sharing in bumble bee pollinators.
Mol Ecol.
2003; 12(10): 2801–2808. PubMed Abstract
| Publisher Full Text
- Dauber J, Bengtsson J, Lenoir L:
Evaluating effects of habitat loss and land-use continuity on ant species richness in seminatural grassland remnants.
Conserv Biol.
2006; 20(4): 1150–1160. PubMed Abstract
| Publisher Full Text
- Debout GDG, Lhuillier E, Malé PJG, et al.:
Development and characterization of 24 polymorphic microsatellite loci in two Antirrhinum majus subspecies (Plantaginaceae) using pyrosequencing technology.
Conserv Genet Resour.
2012; 4(1): 75–79. Publisher Full Text
- Dick CW, Etchelecu G, Austerlitz F:
Pollen dispersal of tropical trees (Dinizia excelsa: Fabaceae) by native insects and African honeybees in pristine and fragmented Amazonian rainforest.
Mol Ecol.
2003; 12(3): 753–764. PubMed Abstract
| Publisher Full Text
- Dupont A:
L’exploitation du sel sur les étangs de Languedoc (IXe-XIIIe siècle).
Annales du Midi.
1958; 70(41): 7–25. Publisher Full Text
- Excoffier L, Foll M, Petit RJ:
Genetic Consequences of Range Expansions.
Annu Rev Ecol Evol Syst.
2009; 40(1): 481–501. Publisher Full Text
- Fahrig L:
Ecological responses to habitat fragmentation per se.
Annu Rev Ecol Evol Syst.
2017; 48: 1–23. Publisher Full Text
- Fahrig L, Arroyo-Rodríguez V, Bennett JR, et al.:
Is habitat fragmentation bad for biodiversity?
Biol Conserv.
2019; 230: 179–186. Publisher Full Text
- Fahrig L, Merriam G:
Conservation of Fragmented Populations.
Conserv Biol.
1994; 8(1): 50–59. Publisher Full Text
- Frankham R:
CONSERVATION GENETICS.
Annu Rev Genet.
1995; 29: 305–27. PubMed Abstract
| Publisher Full Text
- Galpern P, Manseau M, Hettinga P, et al.:
Allelematch: An R package for identifying unique multilocus genotypes where genotyping error and missing data may be present.
Mol Ecol Resour.
2012; 12(4): 771–778. PubMed Abstract
| Publisher Full Text
- Gervais L, Mouginot P, Gibert A, et al.:
Code and data for "Wild snapdragon plant pedigree sheds light on limited connectivity enhanced by higher migrant reproductive success in a fragmented landscape". [Data set].
Zenodo.
2021. http://www.doi.org/10.5281/zenodo.5682659
- Gittleman JL, Gosling ML, Woodroffe R, et al.:
Genetics, demography and viability of fragmented populations. Cambridge University Press. 2000.
- Goverde M, Schweizer K, Baur B, et al.:
Small-scale habitat fragmentation effects on pollinator behaviour: Experimental evidence from the bumblebee Bombus veteranus on calcareous grasslands.
Biol Conserv.
2002; 104(3): 293–299. Publisher Full Text
- Hartig F, Lohse L:
DHARMa: Residual Diagnostics for Hierarchical (Multi-Level / Mixed) Regression Models. (0.4.3) [Computer software]. 2021. Reference Source
- Hebel I, Aldinger E, Haas R, et al.:
Pollen dispersal and pollen contamination in an ash seed orchard (Fraxinus excelsior L.).
Allgemeine Forst Und Jagdzeitung.
2007; 178(2–3): 44–49. Reference Source
- Hijmans RJ, van EJ, Sumner M, et al.:
raster: Geographic Data Analysis and Modeling. (3.4-13) [Computer software]. 2021. Reference Source
- Huisman J:
Pedigree reconstruction from SNP data: Parentage assignment, sibship clustering and beyond.
Mol Ecol Resour.
2017; 17(5): 1009–1024. PubMed Abstract
| Publisher Full Text
| Free Full Text
- Kamm U, Gugerli F, Rotach P, et al.:
Open areas in a landscape enhance pollen-mediated gene flow of a tree species: Evidence from northern Switzerland.
Landsc Ecol.
2010; 25(6): 903–911. Publisher Full Text
- Khimoun A, Burrus M, Andalo C, et al.:
Locally asymmetric introgressions between subspecies suggest circular range expansion at the Antirrhinum majus global scale.
J Evol Biol.
2011; 24(7): 1433–1441. PubMed Abstract
| Publisher Full Text
- Khimoun A, Cornuault J, Burrus M, et al.:
Ecology predicts parapatric distributions in two closely related Antirrhinum majus subspecies.
Evol Ecol.
2013; 27(1): 51–64. Publisher Full Text
- Kunin WE:
Population Size and Density Effects in Pollination: Pollinator Foraging and Plant Reproductive Success in Experimental Arrays of Brassica Kaber.
J Ecol.
1997; 85(2): 225–234. Publisher Full Text
- Larguier G:
Chapitre VII. La mer, la terre, le sel une croissance narbonnaise au xvie s. In: Le drap et le grain en Languedoc: Narbonne et Narbonnais 1300-1789. Presses universitaires de Perpignan, 2014; 408–490. Reference Source
- Lowe WH, Allendorf FW:
What can genetics tell us about population connectivity?
Mol Ecol.
2010; 19(15): 3038–3051. PubMed Abstract
| Publisher Full Text
- Magnusson A, Skaug H, Nielsen A, et al.:
glmmTMB: Generalized Linear Mixed Models using Template Model Builder. (1.1.2) [Computer software]. 2021. Reference Source
- Meirmans PG, van Tienderen PH:
genotype and genodive: Two programs for the analysis of genetic diversity of asexual organisms.
Mol Ecol Notes.
2004; 4(4): 792–794. Publisher Full Text
- Mills LS, Allendorf FW:
The One-Migrant-per-Generation Rule in Conservation and Management.
Conserv Biol.
1996; 10(6): 1509–518. Publisher Full Text
- Moran EV, Clark JS:
Estimating seed and pollen movement in a monoecious plant: A hierarchical Bayesian approach integrating genetic and ecological data.
Mol Ecol.
2011; 20(6): 1248–1262. PubMed Abstract
| Publisher Full Text
- Morrissey MB, Wilson AJ:
pedantics: an r package for pedigree-based genetic simulation and pedigree manipulation, characterization and viewing. COMPUTER PROGRAM ARTICLE.
Mol Ecol Resour.
2010; 10(4): 711–719. PubMed Abstract
| Publisher Full Text
- Mueller T, Lenz J, Caprano T, et al.:
Large frugivorous birds facilitate functional connectivity of fragmented landscapes.
J Appl Ecol.
2014; 51(3): 684–692. Publisher Full Text
- Nason JD, Hamrick JL:
Reproductive and Genetic Consequences of Forest Fragmentation: Two Case Studies of Neotropical Canopy Trees.
J Hered.
1997; 88(4): 264–276. Publisher Full Text
- Pradel R:
Utilization of Capture-Mark-Recapture for the Study of Recruitment and Population Growth Rate.
Biometrics.
1996; 52(2): 703–709. Publisher Full Text
- Pujol B, Archambeau J, Bontemps A, et al.:
Mountain landscape connectivity and subspecies appurtenance shape genetic differentiation in natural plant populations of the snapdragon (Antirrhinum majus L.).
Bot Lett.
2017; 164(2): 111–119. Publisher Full Text
- R Core Team:
R: A Language and Environment for Statistical Computing. R Foundation for Statistical Computing. 2020. Reference Source
- Riester M, Stadler PF, Klemm K:
FRANz: Reconstruction of wild multi-generation pedigrees.
Bioinformatics.
2009; 25(16): 2134–2139. PubMed Abstract
| Publisher Full Text
| Free Full Text
- Riester M, Stadler PF, Klemm K:
Reconstruction of pedigrees in clonal plant populations.
Theor Popul Biol.
2010; 78(2): 109–117. PubMed Abstract
| Publisher Full Text
- Ringbauer H, Kolesnikov A, Field DL, et al.:
Estimating Barriers to Gene Flow from Distorted Isolation-by-Distance Patterns.
Genetics.
2018; 208(3): 1231–1245. PubMed Abstract
| Publisher Full Text
| Free Full Text
- Robertson EP, Fletcher RJ Jr, Austin JD:
The number of breeders explains genetic connectivity in an endangered bird.
Mol Ecol.
2019; 28(11): 2746–2756. PubMed Abstract
| Publisher Full Text
- Robertson EP, Fletcher RJ Jr, Cattau CE, et al.:
Isolating the roles of movement and reproduction on effective connectivity alters conservation priorities for an endangered bird.
Proc Natl Acad Sci U S A.
2018; 115(34): 8591–8596. PubMed Abstract
| Publisher Full Text
| Free Full Text
- Ronce O:
How Does It Feel to Be Like a Rolling Stone? Ten Questions About Dispersal Evolution.
Annu Rev Ecol Evol Syst.
2007; 38(1): 231–253. Publisher Full Text
- Schupp EW, Jordano P, Gómez JM:
Seed dispersal effectiveness revisited: A conceptual review.
New Phytol.
2010; 188(2): 333–353. PubMed Abstract
| Publisher Full Text
- Sebbenn AM, Carvalho ACM, Freitas MLM, et al.:
Low levels of realized seed and pollen gene flow and strong spatial genetic structure in a small, isolated and fragmented population of the tropical tree Copaifera langsdorffii Desf.
Heredity (Edinb).
2011; 106(1): 134–145. PubMed Abstract
| Publisher Full Text
| Free Full Text
- Sinnwell JP, Therneau TM, Schaid DJ:
The kinship2 R Package for Pedigree Data.
Hum Hered.
2014; 78(2): 91–93. PubMed Abstract
| Publisher Full Text
| Free Full Text
- Sork VL, Nason J, Campbell DR, et al.:
Landscape approaches to historical and contemporary gene flow in plants.
Trends Ecol Evol.
1999; 14(6): 219–224. PubMed Abstract
| Publisher Full Text
- Tastard E, Ferdy JB, Burrus M, et al.:
Patterns of floral colour neighbourhood and their effects on female reproductive success in an Antirrhinum hybrid zone.
J Evol Biol.
2012; 25(2): 388–399. PubMed Abstract
| Publisher Full Text
- Tischendorf L, Fahrig L:
On the usage and measurement of landscape connectivity.
Oikos.
2000; 90(1): 7–19. Publisher Full Text
- Uroy L, Ernoult A, Mony C:
Effect of landscape connectivity on plant communities: A review of response patterns.
Landsc Ecol.
2019; 34(2): 203–225. Publisher Full Text
- Vasudev D, Fletcher RJ Jr:
Mate choice interacts with movement limitations to influence effective dispersal.
Ecol Model.
2016; 327: 65–73. Publisher Full Text
- Vittoz P, Engler R:
Seed dispersal distances: A typology based on dispersal modes and plant traits.
Bot Helv.
2007; 117(2): 109–124. Publisher Full Text
- Vranckx G, Jacquemyn H, Muys B, et al.:
Meta-analysis of susceptibility of woody plants to loss of genetic diversity through habitat fragmentation.
Conserv Biol.
2012; 26(2): 228–237. PubMed Abstract
| Publisher Full Text
- Wade AA, Hand BK, Kovach RP, et al.:
Accounting for adaptive capacity and uncertainty in assessments of species’ climate-change vulnerability.
Conserv Biol.
2017; 31(1): 136–149. PubMed Abstract
| Publisher Full Text
- Walther-Hellwig K, Frankl R:
Foraging habitats and foraging distances of bumblebees, Bombus spp. (Hym., Apidae), in an agricultural landscape.
J Appl Entomol.
2000; 124(7–8): 299–306. Publisher Full Text
- Wang J:
Parentage and sibship exclusions: Higher statistical power with more family members.
Heredity (Edinb).
2007; 99(2): 205–217. PubMed Abstract
| Publisher Full Text
- Wang J, Kang M, Gao P, et al.:
Contemporary pollen flow and mating patterns of a subtropical canopy tree Eurycorymbus cavaleriei in a fragmented agricultural landscape.
For Ecol Manage.
2010; 260(12): 2180–2188. Publisher Full Text
- Whitlock MC, McCauley DE:
Indirect measures of gene flow and migration: FST not equal to 1/(4Nm + 1).
Heredity (Edinb).
1999; 82(pt 2): 2. PubMed Abstract
| Publisher Full Text
- Williams JL, Hufbauer RA, Miller TEX:
How Evolution Modifies the Variability of Range Expansion.
Trends Ecol Evol.
2019; 34(10): 903–913. PubMed Abstract
| Publisher Full Text
- Zurbuchen A, Landert L, Klaiber J, et al.:
Maximum foraging ranges in solitary bees: Only few individuals have the capability to cover long foraging distances.
Biol Conserv.
2010; 143(3): 669–676. Publisher Full Text