1. Introduction
Zero-trust architectures continuously re-evaluate whether to trust a user, device, or software agent, rather than granting standing access after a single login. Existing systems build that evidence almost entirely from behavioural and network telemetry: login patterns, device posture, request frequency. AI agents that act on an organization’s data introduce a different, largely unused source of evidence: the corrections human curators make while standardizing, cleaning, and validating the data those agents later rely on. Every accepted, rejected, or corrected mapping is a small, continuously generated signal about whether the contributor supervising that pipeline can be trusted, and by extension whether the agents acting under their delegated authority should keep their current privileges.
Using this signal naively is dangerous. A system that simply counts how often a contributor is corrected treats difficulty and dishonesty as the same thing. It rewards contributors who rubber-stamp easy, unambiguous data and punishes contributors who are assigned, or who volunteer for, the hardest, most unfamiliar material, even when their judgement is exactly as reliable. We show later in this article that this is not a theoretical risk: a naive correction-counting baseline scores substantially worse than chance at distinguishing malicious contributors from trustworthy ones, because it rewards contributors who accept bad data through without objection.
Continuous, risk-adaptive zero-trust authorization is itself a well-established research area. Broad surveys establish continuous authentication, micro-segmentation, and context-aware policy decisions as core zero-trust principles,1 and dedicated systems already move authorization away from a single login decision toward continuously re-evaluated rules2 and trust-aware continuous authorization for consumer IoT.3 Later systems operationalize dynamic trust with specific, non-network evidence classes: computed device and user security profiles,4 continuous device-behaviour perception combined with attribute-based encryption,5 attack-aware differentiated web policies,6 usage-control-integrated IoT architectures,7 continuously updated cloud-access trust and authorization rules,8 risk-based IoT access-control engines,9 and, closest in spirit to the present work, provenance-graph anomalies converted directly into zero-trust privilege changes.10 This literature establishes that dynamic trust scoring, continuous privilege adjustment, and non-network evidence in zero-trust decisions are all precedented; none of it, however, derives its trust signal from a contributor’s corrections during data standardization or ontology mapping, or separates contributor reliability from task difficulty, novelty, model uncertainty, and downstream consequence.
The statistical foundations for estimating contributor or annotator reliability are similarly mature. Dawid and Skene’s expectation-maximization estimator for observer error rates without an assumption of equal accuracy11 underlies later joint models of hidden labels and annotator characteristics,12 spammer elimination and annotator ranking,13 and trust inference without complete gold labels.14 A more directly relevant line separates worker ability from task difficulty: GLAD jointly estimates labeler expertise and item difficulty,15 later work extends the worker model beyond a single competence scalar,16 models reliability at the level of individual annotator-instance pairs,17 predicts annotation difficulty to route hard biomedical tasks to experts,18 and experimentally links task characteristics to annotation performance and time.19 Other work shows reliability can be inferred from indirect evidence such as behavioural traces,20 human factors in relevance judgment,21 and inter-annotator agreement,22 while broader surveys document wide variation in annotation-quality management practice23 and worker-task assignment methods.24 These works justify not equating raw correction count with unreliability, but their objective is almost always to recover a better label, ranking, or aggregated dataset, not to feed a runtime security-authorization decision.
Reliability estimation cannot assume that errors are independent or honest. Task design must be robust to deliberate cheating,25 and reputation-based worker filtering26 extends to identifying unreliable and adversarial workers under broad behaviour models.27 Stronger, security-oriented adversaries are studied directly: intelligent poisoning attacks that disguise malicious behaviour to avoid detection,28 formal poisoning-attack and defense formulations against aggregation,29 black-box poisoning via strategic instance and label selection,30 and collusion, in which coordinated workers undermine the independence assumptions ordinary aggregation relies on.31 This literature motivates the behavioural profiles evaluated in this study (overt manipulation, delayed compromise, low-rate “slow” attacks, trust gaming, and collusion) and explains why raw error frequency is an inadequate signal: an attacker who behaves correctly on most tasks and reserves manipulation for a small number of high-consequence decisions will not be caught by frequency alone, motivating consequence-weighted evidence.
Because the evidence in this study is produced specifically by ontology- and schema-mapping correction events, human-in-the-loop matching research is directly relevant. CrowdMap decomposes ontology-alignment correspondences into human-validated microtasks32; later work models schema-matching uncertainty and selects correspondences for crowd evaluation,33 subsequently accounting explicitly for worker accuracy rates.34 Pay-as-you-go feedback models allow incremental, multi-user mapping validation,35 later extended toward robustness under user error,36 while the broader interactive-matching literature evaluates feedback-seeking tools37 and the effect of user validation on alignment quality38,39 The uncertain-reference-alignment version of the OAEI Conference benchmark40 and long-running analysis of the OAEI Anatomy track41 directly motivate this study’s choice of the Conference and Anatomy datasets, and crowdsourced Linked Data quality assessment shows the same validation principle generalizes beyond ontology alignment.42 In all of these systems, human feedback is consumed to accept or reject a correspondence, improve precision and recall, or estimate worker accuracy for the matching task itself, not preserved as a security-relevant event stream that continuously adjusts an agent’s operational privileges.
Adjacent fields show that data and process history more generally can support trust judgment. Knowledge-based trust estimates source trustworthiness from the correctness of extracted facts rather than popularity or link structure43; secure-provenance research studies how creation and transformation histories support integrity, accountability, and forensic reasoning44,45 and provenance-based intrusion detection uses causal system histories to flag malicious activity,46 culminating in the provenance-anomaly-to-privilege system already noted above.10 Curation events differ from this evidence class: a curation event carries semantic information (proposed and corrected mapping, task difficulty, novelty, model uncertainty, error type, and consequence) rather than only the fact that a system event occurred. The deployment context for this evidence is the sovereign data space, where usage-control research already extends access control beyond initial disclosure to constrain downstream processing,47 infrastructure-level work addresses cross-organizational data and compute sovereignty48,49 and recent security analyses of European data-space architectures identify open challenges around identity, policy enforcement, and trust boundaries.50 Finally, a small but growing body of work recognizes that AI agents need narrower authority than the account that launches them: task-specific, deterministically enforced agent policies,51 cryptographically and semantically bound delegation of user intent,52 probabilistic least-privilege authorization for agentic workflows,53 and runtime mediation of tool calls using privilege-aware access-control state.54 None of this agent-authorization work derives its risk signal from the agent owner’s historical data-curation behaviour; it is complementary rather than overlapping, since delegation and task policy define what an agent is eligible to do, while a curation-derived risk signal can further restrict that eligible set.
Table 1 summarises the closest prior work along the five axes that matter for this study: what evidence a system uses, whether it separates ability from task difficulty, whether it is evaluated against strategic or adversarial behaviour, whether it adjusts runtime privileges, and whether its evidence comes from a semantic curation or mapping context.
Table 1. The closest prior work compared with CurateTrust-ZT along five axes.
“Difficulty-aware” means the work explicitly separates task difficulty from actor reliability; “Adversarial” means the work is evaluated against strategic or adversarial actors, not only honest error; “Runtime privilege” means the evidence is used to adjust live access, not only to clean a dataset offline.
| Work | Evidence source | Diff. aware | Adversarial | Runtime privilege | Curation context |
|---|
| GLAD15 | Labels, worker expertise | Yes | No | No | No |
| Learning from Crowds12 | Noisy labels, annotator params | Limited | No | No | No |
| Instance-level reliability17 | Annotator-instance behaviour | Yes | No | No | No |
| Adversarial worker filtering27 | Label patterns, reputation | Limited | Yes | No (filters workers) | No |
| Poisoning/collusion studies28,30,31 | Strategic labels, coordinated behaviour | Sometimes | Yes | No | No |
| CrowdMap/schema uncertainty32,33 | Human mapping validation | Uncertainty focused | Limited | No | Yes |
| Trust-aware continuous authorization3 | Identity, context, behaviour | No | Context attacks | Yes | No |
| Prov-Trust10 | Provenance-graph anomalies | No | APT-oriented
| Yes | No |
| Agent policy/runtime mediation51–54 | Intent, delegation, session/tool state | No | Agent/tool threats | Yes | No |
| CurateTrust-ZT (this work)
| Calibrated curation events | Yes
| Yes (incl. collusion)
| Yes
| Yes
|
Taken together, the reviewed literature supplies every individual building block this study needs (continuous zero-trust authorization, contributor- and difficulty-aware reliability estimation, adversarial worker models, human-validated ontology matching, provenance-based trust, data-space usage control, and least-privilege agent authorization), but, to the best of a structured review of the peer-reviewed journal and conference literature through 31 July 2026, no prior work connects calibrated human schema-mapping corrections to the runtime zero-trust authorization of AI-agent privileges. This is an intersection gap rather than evidence that any individual component is novel in isolation. Motivated by this gap, the present study asks whether difficulty-calibrated curation evidence can distinguish unreliable or malicious contributors from contributors correctly handling difficult or novel schemas (RQ1); whether adding this evidence to conventional zero-trust signals reduces unauthorized agent actions relative to behaviour-only zero trust (RQ2), and at what cost in false denial of legitimate contributors (RQ3); how robust the resulting trust model is against slow manipulation, strategic good behaviour, collusion, and trust-score gaming (RQ4); how trust should decay and recover as a contributor’s behaviour changes (RQ5); and what computational and decision latency the additional curation-risk analysis introduces in a live authorization path (RQ6).
This article makes four contributions. First, it introduces a difficulty-, uncertainty-, recency-, and consequence-calibrated Bayesian reliability model that turns raw curation corrections into a fair, per-contributor trust score, and fuses that score into a six-component contextual risk decision that continuously adjusts an AI agent’s operating privileges. Second, it evaluates that model against five naive baseline models, in addition to a curation-only ablation of the proposed approach, on two independent real ontology-matching benchmarks, across nine simulated contributor behaviour profiles including collusion, with independent seed replicates for every experiment and a full factorial hyperparameter sweep, rather than a single run on a single dataset. Third, it validates the mechanism end to end in a live Keycloak/OPA/Postgres/FastAPI zero-trust stack, reporting operational unauthorized-action, false-denial, and decision-latency outcomes under real request conditions, not only in-memory simulation. Fourth, it reports the model’s failure modes honestly: detection of slow, low-rate manipulation remains weak, and this weakness is shown to replicate on an independent dataset rather than being an artifact of one benchmark.
The remainder of this article is organised as follows. Section 2 describes the study design, datasets, system implementation, reliability and risk-fusion model, evaluation protocol, and statistical analysis. Section 3 reports the detection, fairness, robustness, cross-dataset, and live-deployment results. Section 4 discusses what these results mean, compares them with the related work reviewed above, and states the study’s limitations. Section 5 concludes.
2. Methods
2.1 Study design
This is a controlled simulation study with a live-deployment validation phase, conducted as a single continuous protocol (Phase 1) in 2026. The study has two stages. First, an offline multi-seed simulation stage generates synthetic contributor populations against two independent, real ontology-matching benchmarks and evaluates seven competing trust-scoring models across detection accuracy, fairness, robustness to adversarial behaviour, and cross-dataset generalization, using independent random-seed replicates rather than a single run. Second, a live-deployment validation stage replays the same event-generation logic through an operational zero-trust authorization stack (identity provider, policy decision point, relational state store, and API service) to measure the RQ2, RQ3, and RQ6 operational metrics (unauthorized-action rate, false-denial rate, and decision latency) under conditions that include real HTTP request/response overhead, database round-trips, and policy evaluation, rather than only in-memory simulation. No human participants were recruited at this stage; contributor behaviour is simulated according to nine pre-registered profiles (Section 2.2 above), and a human-validation study of the underlying difficulty score is identified as the highest-value remaining experiment and explicitly deferred to future work rather than substituted with simulation.
2.2 Data sources and eligibility criteria
Curation events are generated over real candidate correspondences from two Ontology Alignment Evaluation Initiative (OAEI) 2025 tracks, downloaded from the official OAEI distribution. The Conference track supplies seven ontologies (cmt, conference, confOf, edas, ekaw, iasted, sigkdd) and their pairwise OAEI reference alignments, used as the primary evaluation dataset. The Anatomy track supplies the mouse and human anatomy ontologies (each several thousand OWL classes) and its reference alignment, used exclusively as an independent, domain- and scale-unrelated held-out dataset to test whether this study’s core findings generalize beyond Conference rather than being an artifact of one small benchmark. Both tracks are included in full; no ontologies or reference correspondences were excluded. For each dataset, a three-matcher ensemble (lexical, structural, and sentence-embedding similarity; weights 0.3, 0.3, 0.4) proposes up to k = 5 candidate target entities per source entity. At Anatomy’s scale, an embedding-similarity pre-filter (blocking, k = 30 nearest neighbours per source entity) is applied before pairwise scoring, since exhaustive pairwise matching is intractable at several thousand entities per ontology; blocking recall (the fraction of true correspondences that survive the pre-filter) is reported alongside precision so that any blocking-induced ceiling on downstream precision is attributable to blocking, not to the matching ensemble. Contributor populations are entirely simulated (not human participants): 240 synthetic contributors are drawn from nine behavioural profiles (consistently reliable, novice-improving, careless, reliable-but-assigned-difficult, malicious manipulator, colluding pair, compromised-after-a-point, slow/low-rate attacker, and trust-gamer) in fixed proportions (35, 30, 35, 30, 18, 2, 30, 30, 30 respectively, summing to 240), each producing 400 sequential curation events (96,000 events total) plus 40 downstream agent-action requests per contributor in the live-deployment stage.
2.3 System, model, or intervention
The intervention under test is a curation-derived reliability signal fused into a live, continuously re-evaluated zero-trust authorization decision. The reference implementation is a Keycloak 26.7.0 identity provider (issuing per-contributor OAuth2 tokens), an Open Policy Agent 1.18.2 policy decision point, a PostgreSQL 16 relational store for events, trust history, and privilege state, and a FastAPI service exposing a/curation-events
endpoint (which recomputes the submitting contributor’s full trust trajectory from stored history on every event) and an/agent-actions
endpoint (which fuses current risk, applies hysteresis, and issues a live policy decision for one of five action types of increasing sensitivity: read, transform, invoke_tool, orchestrate, and external_call). Each source entity’s task difficulty is scored from three equally weighted components (matcher disagreement across the three-matcher ensemble, structural ambiguity, which is near-duplicate density within the ontology, and lexical novelty, an IDF-based measure of term rarity), and tasks are further categorised into easy/medium/difficult/novel/ambiguous by difficulty tercile, with novel and ambiguous assigned when lexical novelty or structural ambiguity, respectively, is in its own top quartile and dominates the other component (compared by within-dimension percentile rank, since the two components live on incomparable raw scales). The reliability model and risk-fusion and privilege-adjustment mechanisms that consume this evidence are specified formally below.
2.3.1 Difficulty- and consequence-calibrated reliability model
For each contributor, an online Beta(α, β) posterior over reliability is updated after every curation event i, using prior α0 = β0 = 2 and per-event recency decay γ = 0.995:
(1)
Let di ∈ [0, 1] be the event’s estimated mapping difficulty and ci ∈ [0, 10] its consequence-damage weight. If the contributor’s decision was correct, the update rewards more for harder tasks:
(2)
If the decision was wrong, the base penalty is reduced for harder tasks but floored at wmin = 0.15 so a wrong decision always costs something:
(3)
A false accept (a bad mapping let through) is scaled by consequence, since a targeted attacker who is mostly honest is only distinguishable from an honest, careless contributor by the handful of high-damage decisions each makes:
(4)
and
β ←
β +
pimi. After each update, the contributor’s trust score, posterior variance, and normalized uncertainty are
(5)
where 0.25 is the maximum variance of a Beta distribution (attained at
α =
β = 1), used to normalize
Runcertainty into [0, 1].
2.3.2 Contextual risk fusion
At authorization time, the fused risk for action a at time t follows the six-component decomposition specified for the system (identity, device, behaviour, curation, action sensitivity, and model uncertainty):
(6)
with weights (
wI,
wD,
wB,
wC,
wS,
wU) = (0.1, 0.1, 0.1, 0.4, 0.2, 0.2), chosen to make curation-derived evidence the dominant term while still letting behaviour, sensitivity, and uncertainty modulate the decision.
Rcuration and
Rbehaviour are not used as raw 1 – trust scores: because trust scores cluster too tightly for fixed thresholds to be meaningful, each is instead the contributor’s
population-relative percentile rank of 1 – trust among all contributors with trust history at time
t. Rsensitivity is a fixed lookup by action type (read = 0.1 through external_call = 0.9).
Ridentity and
Rdevice are documented Phase-1 stubs (constant 0.05, “valid token, nothing else known”): no device-posture or identity-assurance telemetry was built in this phase, so these two terms are reported as unevaluated rather than silently omitted.
2.3.3 Hysteresis-based privilege adjustment
Fused risk is mapped to one of six privilege bands P0 (most restrictive) through P5 (full access) and adjusted with asymmetric, streak-gated hysteresis so that single noisy risk readings cannot cause privilege oscillation, and a run of lucky low-risk readings cannot instantly restore a contributor with a genuinely bad history.
Algorithm 1 runs on every agent-action request; its output privilege level, together with the requested action type, is the input to a live OPA policy decision that produces the final allow/deny outcome.
2.3.4 Worked example
Consider a contributor with a well-behaved history who then accepts one high-consequence, incorrect mapping on a difficult task (di = 0.8, consequence weight ci = 7). Before this event, the posterior sits near the prior after decay, say α = 6.0, β = 3.0 (trust = 0.667). The decision is a wrong accept, so from
Equation (3) the base penalty is pi = max(0.15, 1–0.8) = 0.2, and from
Equation (4) the damage multiplier is mi = (0.2 + 0.8 × 0.7) × 1.5 = 1.14 (the 1.5× term applies because ci ≥ 6). The posterior update is β ← 3.0 + 0.2 × 1.14 = 3.228, giving a new trust score of 6.0/(6.0 + 3.228) = 0.650, a small but real drop despite the task being hard, because the consequence was large. If this contributor’s population-relative percentile rank of 1 – trust moves from, say, the 40th to the 65th percentile of all contributors, then Rcuration in
Equation (6) rises accordingly; combined with the fixed stub terms and an orchestrate action (Rsensitivity = 0.6), the fused risk could cross the restrict threshold τr = 0.45, at which point Algorithm 1 immediately moves the contributor to a more restrictive privilege band. Recovering that band back requires three consecutive authorization requests with fused risk below τc = 0.32, not simply one good decision, by design.
Algorithm 1. Hysteresis privilege update for one authorization request.
Require: fused risk R(a, t) from
Equation (6), uncertainty Runcertainty, current level L, recovery streak counter s, restrict threshold τr = 0.45, recover threshold τc = 0.32, recovery streak length K = 3, forced-escalation uncertainty τu = 0.15.
Ensure: updated privilege level L.
1:T ← raw band of R(a, t) from the six fixed thresholds (P0 at R ≥ 0.60 down to P5 at R < 0.20)
2:if Runcertainty ≥ τu then ▷ high uncertainty escalates to at least P1, not a punitive P0
3:T ← min(T, P1) ▷ “we don’t know” is treated differently from “we know this is bad”
4:end if
5:if R(a, t) > τr or Runcertainty ≥ τu then
6:L ← min(T, L) ▷ move immediately to the more restrictive of target and current level
7:s ← 0
8:else if R(a, t) < τc then
9:s ← s + 1
10:if s ≥ K then
11:ease L by exactly one band toward P5, only if T justifies at least that much easing
12:s ← 0
13:end if
14:else
15:s ← 0 ▷ risk in the dead zone [τc, τr]: hold current level, reset streak
16:end if
17:return L
2.3.5 Complexity
Submitting one curation event costs O(n), where n is the submitting contributor’s number of prior events, because the reference implementation recomputes that contributor’s full trust trajectory from stored history on every submission (a documented Phase-1 simplification; Section 2.3 above). Submitting all n events for one contributor therefore costs O(n2) in total, which is the dominant cost of the live-deployment stage at n = 400 events per contributor; a production deployment would instead persist and incrementally update the posterior in O(1) per event, since
Equation (1)–(5) only require the previous (α, β), not the full event history. Each agent-action request costs O(m), where m is the number of contributors with trust history, because the population-relative percentile rank in
Equation (6) is computed against every other contributor’s latest score; this is O(m log m) if implemented with a sort, or can be reduced to O (log m) amortised with a maintained order statistic if m becomes large. The hysteresis update in Algorithm 1 is O (1) per request. RQ6’s live decision-latency measurement (Section 3 below) reports the wall-clock consequence of these bounds under real database and policy-evaluation overhead, not only their asymptotic form.
2.4 Evaluation and outcome measures
The proposed model (B6, full multimodal fusion of the curation reliability model, B5, with the behaviour-only signal, B1) is compared against five baseline models spanning the range of evidence naive zero-trust systems typically use: B0, a constant-trust static RBAC/ABAC anchor that uses no curation evidence at all; B1, a content-agnostic rolling accept-rate behavioural proxy; B2, cumulative raw correction-count trust, the naive heuristic this study argues against; B3, a rolling correction-frequency-and-magnitude score; and B4, a difficulty-normalized heuristic (dividing the naive correction rate by task difficulty, without a calibrated probabilistic model). B5, the curation-only reliability model before behavioural fusion, is reported alongside these five baselines as an ablation of the proposed approach, not as an independent external baseline, since it is the component B6 is built from. B3 and B4 are numerically degenerate to the same computation on the data used in this study, and are reported as such rather than silently as two distinct results: correction_magnitude is currently binary in the simulated event model (Section 2.2), so B3’s magnitude weighting has no effect beyond the wrong/not-wrong indicator it multiplies; and because
estimated_mapping_difficulty
never exceeds 0.61 in this dataset, B4’s division by difficulty always pushes a wrong decision’s normalized strike above the 1.0 clip ceiling in its formula, so the intended normalization has no effect either. Both baselines therefore collapse to a plain rolling wrong-decision rate here; this is a property of the current Phase-1 event model’s value ranges, not a code defect in either baseline, and is reported to keep
Table 2 interpretable rather than presenting two apparently distinct heuristics that are not, in fact, distinct on this data. Primary outcome measures are: detection AUC of each model’s final-timestep risk score against a ground-truth bad-actor label, reported overall and separately for overt (malicious manipulator, compromised-after-point), stealthy/low-rate (slow attacker, trust-gamer), and colluding attack types, since pooling attack types into one AUC hides that they are very different detection problems; the fairness gap, the absolute difference in final trust score between two profiles with identical true reliability (consistently reliable versus reliable-but-assigned-difficult), where a small gap indicates the model is not conflating task difficulty with dishonesty; detection latency, the number of events between a delayed-onset attacker’s true compromise point and the first timestep its trust score drops below that model’s own adaptive threshold (the 10th percentile of never-malicious contributors’ trust scores under that model, used because the seven models are not on a common calibrated scale); and, from the live-deployment stage, the RQ2 risk-weighted unauthorized-action rate (the fraction of bad-actor action requests, weighted by the requested action’s sensitivity, that were granted near-full or full privilege), the RQ3 false-denial rate (the fraction of the fairness-critical reliable-but-assigned-difficult profile’s actions wrongly restricted), and RQ6 live decision latency (P50/P95/P99 wall-clock time of the fused authorization decision, including database and policy-evaluation overhead). A dedicated collusion-detection check, independent of every per-contributor reliability model, computes the pairwise Jaccard overlap of each contributor pair’s “suspicious mapping” sets (candidate mappings accepted despite being wrong and high-consequence) and reports the true colluding pair’s rank among all
contributor pairs, without ever exposing the ground-truth collusion label to the detector. Robustness is assessed via three independent axes: multi-seed replication (30 independent seed replicates on Conference, 30 on the independent Anatomy dataset, and 10 for the collusion-detection check, each experiment’s seed count stated on its own terms rather than combined into one aggregate figure), cross-dataset generalization (Conference versus Anatomy), and hyperparameter/attack-parameter sensitivity, both one-at-a-time and as a full 4 × 4 factorial grid over posterior decay rate ({0.98, 0.99, 0.995, 0.999}) and the slow attacker’s sabotage probability ({0.05, 0.15, 0.3, 0.5}, 5 seeds per cell), since one-at-a-time sweeps cannot reveal whether faster decay helps more or less when the attacker is also stealthier.
Table 2. Detection AUC (overall and by attack type) and fairness gap for all seven models, mean (95% t-distribution CI, df = 29) across 30 independent seed replicates on the Conference dataset.
B2–B4 are naive baselines; B5 is the curation-only reliability model; B6 is the proposed full model (B5 fused with the behavioural signal, B1). B3 and B4 are numerically identical on this dataset because both formulas degenerate to a plain rolling wrong-decision rate given this phase’s binary correction-magnitude values and sub-1.0 difficulty range (Section 2.4); this is disclosed, not a duplicated row.
| Model | AUC overall | AUC overt | AUC stealthy | AUC colluding | Fairness gap |
|---|
| B0 static RBAC | 0.500 | 0.500 | 0.500 | 0.500 | 0.000 |
| B1 behaviour-only
| 0.714 (0.701, 0.727) | 0.812 | 0.631 | 0.836 | 0.025 |
| B2 raw correction count | 0.129 (0.124, 0.135) | 0.028 | 0.215 | 0.000 | 0.018 |
| B3 frequency + magnitude | 0.286 (0.273, 0.299) | 0.188 | 0.369 | 0.164 | 0.025 |
| B4 difficulty-normalized
| 0.286 (0.273, 0.299) | 0.188 | 0.369 | 0.164 | 0.025 |
| B5 Bayesian reliability | 0.641 (0.636, 0.645) | 0.841 | 0.469 | 0.983 | 0.003
|
| B6 full multimodal (proposed) | 0.721 (0.711, 0.732) | 0.942
| 0.535 | 0.990
| 0.007 |
All seven compared models (B0 through B6) are evaluated under one shared framework, on the same simulated events, so that only the reliability logic differs between them. This is a deliberate methodological choice, not a substitute for external comparison: as established in Section 1 above, no prior peer-reviewed system performs curation-to-authorization fusion, so there is no directly comparable published method with public code to re-run as an external baseline. B0 through B4 instead serve that role by encoding the specific naive strategies a practitioner would reach for without this study’s contribution (no signal, behaviour-only, raw correction counting, frequency weighting, and a heuristic difficulty normalisation), so that the proposed model’s advantage is measured against realistic alternatives rather than only against an uninformed constant. This limitation is revisited in Section 4.
2.5 Statistical analysis
Each seed replicate is an independent simulation draw: contributor task assignment, oracle labelling noise, and attacker timing are all re-sampled from the seed, not bootstrap-resampled from one fixed dataset. The spread across replicates is a direct estimate of run-to-run variability rather than an artifact of a single draw. The main Conference and Anatomy comparisons use 30 seed replicates each; the factorial ablation grid and collusion-detection check use 5 and 10 seed replicates respectively, since they are separate, more computationally intensive experiments, and their seed counts are reported individually in Section 3 rather than combined into a single aggregate figure. For every metric, we report the mean, sample standard deviation, and a 95% confidence interval computed from the t-distribution
. This choice was made specifically over the empirical 2.5th/97.5th seed-replicate percentile range used in an earlier iteration of this analysis: with as few as 5 or 10 seeds, percentile-based intervals are poorly resolved, and treating them as a formal 95% CI overstates their precision; the t-based interval is the more defensible choice at the 30-seed sample size now used for the two main comparisons, and is reported throughout Section 3 and its tables, while figure error bars are labelled explicitly as the empirical percentile range they actually show. Detection AUC is computed with the standard Mann-Whitney-equivalent ROC-AUC estimator (scikit-learn
). No additional hypothesis tests (e.g. paired t-tests between models) are performed; comparisons between models and between datasets are read directly off non-overlapping or overlapping confidence intervals, and raw seed-level outcomes for every experiment are included in the archived software and data release referenced below so that alternative interval estimators can be computed directly. The implementation uses Python 3.12, pandas, scikit-learn
, rdflib, sentence-transformers
(all-MiniLM-L6-v2) for embedding-based matching and blocking, FastAPI/SQLAlchemy for the live service, and a Docker Compose stack of Keycloak 26.7.0, Open Policy Agent 1.18.2, and PostgreSQL 16 for the live-deployment validation stage.
2.6 Ethics and consent
This study involves no human participants, personal data, or identifiable individuals. All 240 contributor identities, curation decisions, and behavioural histories are synthetically generated according to the pre-registered profiles in Section 2.2, and their corresponding Keycloak accounts are provisioned programmatically for the sole purpose of exercising the live authorization stack under realistic request conditions. No approval from a human-subjects or institutional review body was required or sought for the work reported here. The human-validation study identified in Section 2.2 as the highest-value remaining experiment (recruiting participants to validate the computed task-difficulty score against real human correctness, response time, and confidence) would constitute human-subjects research and has not been conducted; it is explicitly out of scope for the results reported in this article and would require its own ethical approval before being undertaken.
3. Results
3.1 Naive correction-counting is backwards; difficulty calibration is fair (RQ1)
Table 2 and
Figure 1 report detection AUC and fairness gap for all seven models, averaged over 30 independent seed replicates on the Conference dataset. The naive raw correction-count baseline, B2, scored an overall detection AUC of 0.129 (95% CI [0.124, 0.135]), substantially below the chance level of 0.5, confirming quantitatively that counting corrections without regard to task difficulty or consequence actively rewards contributors who accept incorrect mappings rather than merely failing to catch them. B3 (frequency and magnitude) and B4 (difficulty-normalized heuristic) improved on B2 (AUC 0.286 each) but remained well below chance-level usefulness. The proposed full model, B6, reached an overall detection AUC of 0.721 (95% CI [0.711, 0.732]) and a fairness gap of 0.007 (s.d. 0.005) between equally reliable contributors on easy versus difficult tasks, more than two to three times smaller than every baseline’s fairness gap (B1: 0.025; B2: 0.018; B3/B4: 0.025). The curation-only component, B5, achieved an even smaller fairness gap on its own (0.003, s.d. 0.001), indicating that the difficulty calibration in
Equations (2)–(4) is the primary source of the fairness improvement, with the behavioural fusion in B6 contributing most of the additional detection power.
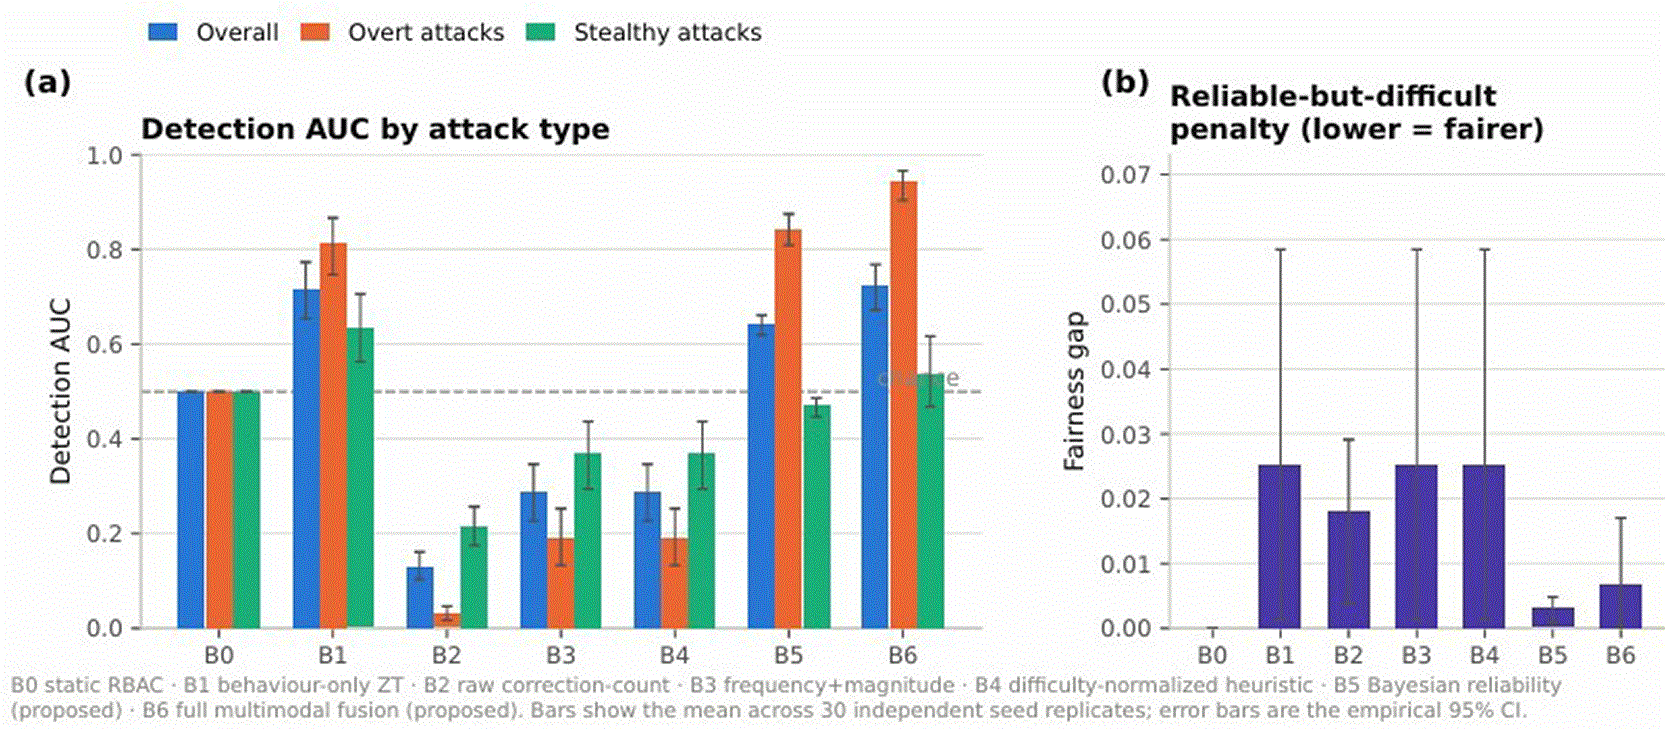
Figure 1. Detection AUC by attack type (a) and fairness gap (b) for all seven models, mean across 30 independent seed replicates on the Conference dataset; error bars show the empirical 2.5th–97.5th percentile range across seeds (
Table 2 reports the more conservative t-distribution 95% CI used for statistical comparisons).
B6, the proposed full model, combines the strongest overall detection with a fairness gap far below every naive baseline.
3.2 Detection is uneven across attack types (RQ4)
Breaking detection AUC down by attack type (
Table 2) shows the proposed model, B6, detects overt attackers (malicious manipulators and contributors compromised partway through, AUC 0.942, 95% CI [0.935, 0.949]) and colluding contributors (AUC 0.990, 95% CI [0.984, 0.996], from the per-contributor reliability score alone, before the dedicated collusion detector below) substantially better than stealthy, low-rate attackers (slow attacker and trust-gamer profiles, AUC 0.535, 95% CI [0.519, 0.552]), which sits close to chance. This gap is not an artefact of one dataset: on the independent Anatomy dataset (
Table 3, 30 seeds), B6’s overt-attack AUC (mean 0.840) remained substantially higher than its stealthy-attack AUC (mean 0.509), the same qualitative pattern observed on Conference, while B2 remained near or below chance on both attack types on both datasets. The fairness gap also stayed small on Anatomy (B6 mean 0.006, versus B2’s mean 0.017), replicating the Conference finding on a domain- and scale-unrelated benchmark.
Table 3. Cross-dataset generalization: mean detection AUC and fairness gap over 30 independent seed replicates on the independent Anatomy benchmark (mouse/human ontologies), for the naive baseline (B2) and proposed model (B6).
The same qualitative pattern observed on Conference (B2 near or below chance, B6 stronger on overt than stealthy attacks, small fairness gap) replicates on a domain- and scale-unrelated dataset.
| Model | AUC overall | AUC overt | AUC stealthy | Fairness gap |
|---|
| B2 raw correction count | 0.174 | 0.087 | 0.249 | 0.017 |
| B6 full multimodal (proposed) | 0.661 | 0.840 | 0.509 | 0.006 |
3.3 Collusion is separable from individual reliability
The per-contributor reliability model alone already assigns high risk to colluding contributors (B6 colluding-attack AUC 0.990, above), but colluding behaviour is, by construction, a pairwise phenomenon that a per-contributor score is not designed to exploit directly. The dedicated pairwise-overlap collusion detector, which computes Jaccard overlap of each contributor pair’s suspicious-mapping sets without ever seeing the ground-truth collusion label, ranked the true colluding pair among the 5 most suspicious of all 1,225 possible contributor pairs in every one of 10 tested seeds (true-pair Jaccard overlap 0.55–0.81 across seeds), and as the single most suspicious pair in 4 of those 10 seeds (40%). This supports treating cross-contributor and per-contributor evidence as complementary detection mechanisms rather than substitutes.
3.4 Decay rate and attacker stealth do not interact strongly
The full 4 × 4 factorial grid over posterior decay ({0.98, 0.99, 0.995, 0.999}) and the slow attacker’s sabotage probability ({0.05, 0.15, 0.3, 0.5}, 5 seeds per cell;
Table 4) shows two consistent, non-crossing effects. Increasing sabotage probability from 0.05 to 0.50 raised mean stealthy-attack AUC from about 0.45–0.52 to about 0.63–0.70 depending on decay, the dominant effect, since a more active attacker is intrinsically easier to detect. Faster decay (0.98) consistently outperformed slower decay (0.999) by roughly 0.05–0.06 AUC at every sabotage-probability level, a smaller but consistent secondary effect. Because the ordering of decay values did not change across sabotage-probability rows, the grid shows no strong interaction: faster decay helps stealthy-attack detection by a similar margin regardless of how stealthy the attacker actually is, which one-at-a-time sweeps over either parameter alone could not have established. Overt-attack AUC stayed high and comparatively stable across the whole grid (0.792–0.965), and fairness gap stayed low throughout (0.001–0.023).
Table 4. Full factorial ablation: mean stealthy-attack detection AUC (B6) over a 4 × 4 grid of posterior decay rate and slow-attacker sabotage probability, 5 seeds per cell.
The two effects are consistent (non-crossing) across every row and column, indicating no strong interaction between them.
| Sabotage probability | Decay 0.980 | Decay 0.990 | Decay 0.995 | Decay 0.999 |
|---|
| 0.05 | 0.517 | 0.494 | 0.469 | 0.452 |
| 0.15 | 0.542 | 0.520 | 0.499 | 0.478 |
| 0.30 | 0.624 | 0.601 | 0.576 | 0.560 |
| 0.50 | 0.695 | 0.673 | 0.652 | 0.633 |
3.5 Live-deployment validation (RQ2, RQ3, RQ6)
All 240 contributors and 96,000 curation events were replayed through the live Keycloak/OPA/Postgres/FastAPI stack, followed by 9,600 agent-action requests (40 per contributor).
Table 5 shows each profile’s final privilege band. The two clearest results are at the extremes: every one of the 30 reliable-but-assigned-difficult contributors, and all 35 consistently reliable contributors, ended at the least restrictive band, P5, for a false-denial rate (RQ3) of exactly 0.0 for both profiles across 1,200 and 1,400 live agent-action requests respectively, so the difficulty calibration validated offline in Section 3.1 did not cost a single legitimate, difficulty-burdened contributor a wrongly restricted action once real request timing and hysteresis were involved. At the other extreme, both colluding contributors and 13 of 18 malicious manipulators (with the remaining 5 at the next band, P1) were moved to the most restrictive band, P0.
Figure 2 shows the same distribution graphically across all nine profiles.
Table 5. Final live privilege band by true contributor profile after the live 240-contributor deployment run (crosstab; cell values are contributor counts).
Every reliable-but-assigned-difficult and consistently-reliable contributor ended at P5 (zero false denial); colluding contributors and most malicious manipulators ended at P0; the two stealthy profiles (slow attacker, trust-gamer) were largely undetected.
| Profile | P0 | P1 |
P5 |
|---|
| careless | 8 | 13 | 14 |
| colluding contributor | 2 | 0 | 0 |
| compromised after point | 0 | 13 | 17 |
| consistently reliable | 0 | 0 | 35 |
| malicious manipulator | 13 | 5 | 0 |
| novice improves | 0 | 4 | 26 |
| reliable, assigned difficult | 0 | 0 | 30 |
| slow attacker | 0 | 1 | 29 |
| trust-gamer
| 0 | 9 | 21 |
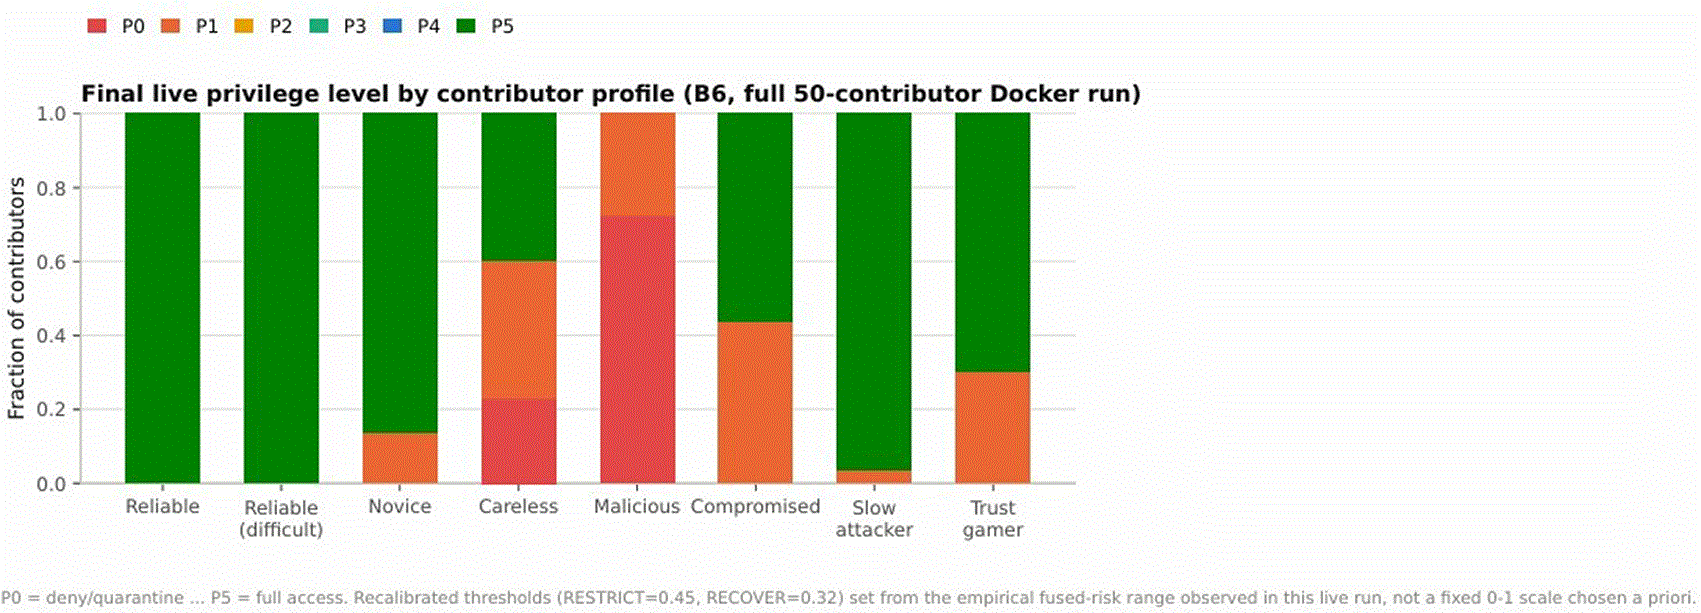
Figure 2. Final live-deployment privilege band by true contributor profile, from the 240-contributor, 96,000-event, 9,600-agent-action live Keycloak/OPA/Postgres/FastAPI run.
P0 is most restrictive, P5 is full access.
Consistent with the stealthy-detection weakness reported in Sections 3.2 and 3.4, the two low-rate attack profiles fared differently: 29 of 30 slow attackers and 21 of 30 trust-gamers ended at full access, P5, and RQ2’s risk-weighted unauthorized-action rate confirms this quantitatively at the level of individual actions rather than final privilege band alone: 97.1% of slow attackers’ risk-weighted action opportunities and 70.4% of trust-gamers’ were granted near-full or full access, against 0.0% for both malicious manipulators and colluding contributors. Compromised-after-a-point contributors, who behave well for the first half of their timeline before flipping, sat in between (58.1% granted; 17 of 30 still at P5, 13 at P1, 0 at P0), consistent with the same delayed-onset detection lag reflected in the offline detection-latency metric (Section 3.1). Averaged across all 4,400 bad-actor live actions, the overall risk-weighted unauthorized-action rate was 61.4%, a headline number driven almost entirely by the two stealthy profiles rather than spread evenly across attack types. Mean privilege rank (0 = P0 through 5 = P5) was 3.30 for all bad-actor profiles pooled together versus 5.00 for reliable-but-assigned-difficult contributors, a direct, deployment-level restatement of the fairness result in Section 3.1.
RQ6 decision latency was measured over 200 live POST/agent-actions
requests, each performing the full risk-fusion computation, hysteresis update, a real OPA policy evaluation, and the associated Postgres reads and writes: mean 57.9 ms, median 57.0 ms, P95 59.3 ms, P99 91.7 ms. This is well within the range needed for an authorization check that gates an individual AI-agent action rather than a bulk operation, and confirms that the additional curation-risk analysis does not introduce a prohibitive latency cost on top of a conventional zero-trust decision path.
4. Discussion
The naive correction-counting baseline (B2) scoring worse than chance (detection AUC 0.129) is the clearest evidence for the concern raised in Section 1: a system that treats every correction as equally suspicious will, in practice, reward the exact behaviour it should flag, because a contributor who quietly accepts bad mappings without objection never triggers a correction at all. This is not a tuning failure of B2; it is a structural property of counting corrections without any measure of task difficulty or decision consequence, and it directly answers RQ1 by demonstrating that difficulty-blind evidence is actively misleading, not merely noisy. The proposed model’s near-zero fairness gap between equally reliable contributors on easy versus difficult tasks shows that difficulty calibration is not just theoretically motivated by the annotator-reliability literature reviewed in Section 1 (in particular the difficulty-aware line of work following GLAD15), but transfers into a security context where the cost of getting it wrong is a wrongly restricted, legitimate contributor rather than a mislabelled training example.
The detection results are, however, uneven across attack types, and this is reported deliberately rather than smoothed over. Overt and compromised-after-a-point attackers are detected well, but slow, low-rate manipulation remains a harder problem, and the same weakness reappears on the independent Anatomy dataset rather than being an artefact of the Conference benchmark. This is consistent with the adversarial-crowdsourcing literature reviewed in Section 1: camouflaged, low-frequency poisoning28 is specifically designed to stay statistically close to honest behaviour, and a reliability model built from decayed Bayesian updates on individual events is, by construction, better suited to catching a pattern of bad decisions than a small number of well-timed ones. The dedicated collusion detector’s strong performance (the true colluding pair ranked among the five most suspicious of 1,225 candidate pairs in every tested seed) suggests that cross-contributor signals can catch coordinated behaviour that a purely per-contributor reliability score misses, and points toward combining both mechanisms rather than relying on either alone.
The full factorial ablation over decay rate and attacker sabotage probability found no strong interaction effect: faster decay did not disproportionately help or hurt detection as the attacker became stealthier, meaning the two hyperparameters can be reasoned about and tuned largely independently, which is operationally convenient but also indicates that decay alone is not the lever that would close the stealthy-detection gap. Taken together, these results support a bounded claim: under the controlled, simulated-contributor conditions evaluated here, difficulty-calibrated curation evidence is a technically feasible and promising candidate signal for the attack types it was evaluated against, and it should be considered as one component of a broader authorization decision rather than as a sole defence against a fully adaptive adversary.
4.1 Limitations
This study has four categories of limitation. Methodologically, the offline reliability updates use the OAEI reference alignment as the ground-truth correctness signal; a production deployment has no such oracle available at inference time and would need a downstream validation signal such as audit sampling, expert adjudication, or observed failure, a gap that is documented in the implementation but not yet built or evaluated. Data-wise, all 240 contributors and their behaviour are simulated according to nine pre-registered profiles, not real human curators, and task difficulty is estimated algorithmically from matcher disagreement, structural ambiguity, and lexical novelty rather than validated against human judgement. As a direct consequence, the fairness result in Section 3.1 demonstrates that the model is fair relative to its own computed difficulty score, not that this score matches the difficulty experienced by real human curators; these are not necessarily the same claim. Section 1 identifies human validation of the underlying difficulty score, using real participants across the same difficulty strata, as the highest-value remaining experiment, and it has not been conducted. Generalisability is currently bounded to two ontology-matching benchmarks in one domain (schema and ontology alignment); the core fairness and detection findings replicate across Conference and Anatomy, which is evidence against a single-dataset artefact, but does not establish generalisation to curation tasks outside ontology matching, such as free-text data cleaning or record linkage. Implementation-wise, the identity and device-risk terms in the risk-fusion equation are constant, documented Phase-1 stubs rather than measured telemetry, so the live-deployment results should be read as validating the curation-to-privilege mechanism, not a complete six-signal zero-trust system; the O(n2)-per-contributor recompute strategy used for simplicity in this phase would need the incremental O (1) update described in Section 2.3 before deployment at a scale larger than the hundreds of contributors and tens of thousands of events tested here.
5. Conclusions
Curation events generated during routine data standardisation are a real, previously unused source of zero-trust evidence, but only if task difficulty, decision consequence, and recency are explicitly modelled rather than folded into a raw correction count. Naive correction-counting was found to be actively backwards at distinguishing malicious from trustworthy contributors, while the proposed difficulty- and consequence-calibrated Bayesian model reduced the fairness gap between equally reliable contributors on easy and difficult tasks to near zero and detected overt manipulation, compromise, and collusion reliably, with these findings replicating on an independent dataset and validated end to end in a live authorization stack. Detecting slow, deliberately low-rate manipulation remains an open problem and is reported as such rather than minimised. The practical implication is that curation-derived reliability is a technically feasible and promising candidate input to a broader zero-trust decision alongside identity, device, and behavioural evidence, not as a replacement for them, though deployment readiness beyond the simulated-contributor conditions evaluated here has not been established; the main research direction this work points toward is validating the underlying difficulty score against real human curators, the human-validation study identified but deliberately deferred in Section 1.
Author contributions
Ailabouni F: Conceptualization, Methodology, Software, Investigation, Data Curation, Formal Analysis, Visualization, Supervision, Validation, Writing – Original Draft Preparation, Writing – Review & Editing.
Román-Gallego J-Á: Methodology, Validation, Formal Analysis, Writing – Review & Editing.







