Introduction
The increasing traffic demand at major airports has driven the widespread adoption of structured RNAV arrival procedures to improve safety, predictability, and operational efficiency while maintaining controller workload within acceptable levels. Among these solutions, the Point Merge System (PMS)1 has become a well-established arrival sequencing concept, enabling controllers to manage inbound traffic with reduced reliance on tactical radar vectoring.
The ORCI project aims to develop an AI-based decision support tool to assist Air Traffic Controllers (ATCOs) in managing high-complexity Terminal Maneuvering Area (TMA) operations. Following the successful application of the ORCI framework to the Barcelona (LEBL) transition procedures,2 this work extends the methodology to the Lisbon (LPPT) use case, where arrival sequencing is based on a PMS. Unlike vectoring operations, the Point Merge procedure provides a structured arrival path while still requiring controllers to continuously manage aircraft sequencing and spacing under varying traffic conditions.
The Point Merge concept offers operational flexibility by allowing aircraft to remain on predefined sequencing legs before receiving a direct clearance to the merge point. Previous studies have shown that the PMS improves the predictability and standardization of arrival operations while reducing the need for tactical radar vectoring, thereby facilitating more efficient traffic management in terminal airspace.3,4 Despite these advantages, controllers must still determine the appropriate moment to issue direct-to clearances in order to achieve the desired spacing on final approach.
To address this challenge, the ORCI framework employs historical radar surveillance data to train explainable Machine Learning models capable of predicting the spacing between consecutive arrivals at a key operational reference point. In the Lisbon use case, the prediction is performed while the follower aircraft is still flying the Point Merge arcs, estimating the spacing that will exist when the preceding aircraft reaches the PESEX merge point – if the Direct To instruction is issued at this time. By providing this information in real time, the proposed decision support tool aims to enhance controller situational awareness without modifying existing operational procedures.
This paper presents the adaptation of the ORCI methodology to the Lisbon operational environment. Section 2 introduces the LPPT arrival procedures and the PMS. Section 3 describes the data processing methodology and the development of the machine learning models. Section 4 presents the obtained results and discusses the predictive performance of the proposed approach.
Operational overview of the point merge system at LPPT
Lisbon Humberto Delgado Airport (LPPT) represents a particularly challenging and relevant application of this concept, as the PMS is employed to manage arrivals to runway RWY02 and RWY 20 under a single-runway mixed-mode configuration, where arrivals and departures are allocated on the same runway. This study focuses exclusively on operations to RWY 02, which is the airport’s primary operating configuration.
The geometrical layout of the PMS consists of a single merge point, PESEX, connected to a pair of predefined arrival legs located at an approximately constant distance from this point. For RWY 02 operations, inbound aircraft are routed along two symmetric, eastbound and westbound RNAV sequencing legs, which can be described as concentric arcs with radii of approximately 15 NM and 16 NM from the merge point. The merge point PESEX is located at approximately 11 NM from the runway threshold of RWY 02, from where aircraft join the final approach towards the ILS (See
Figure 1).
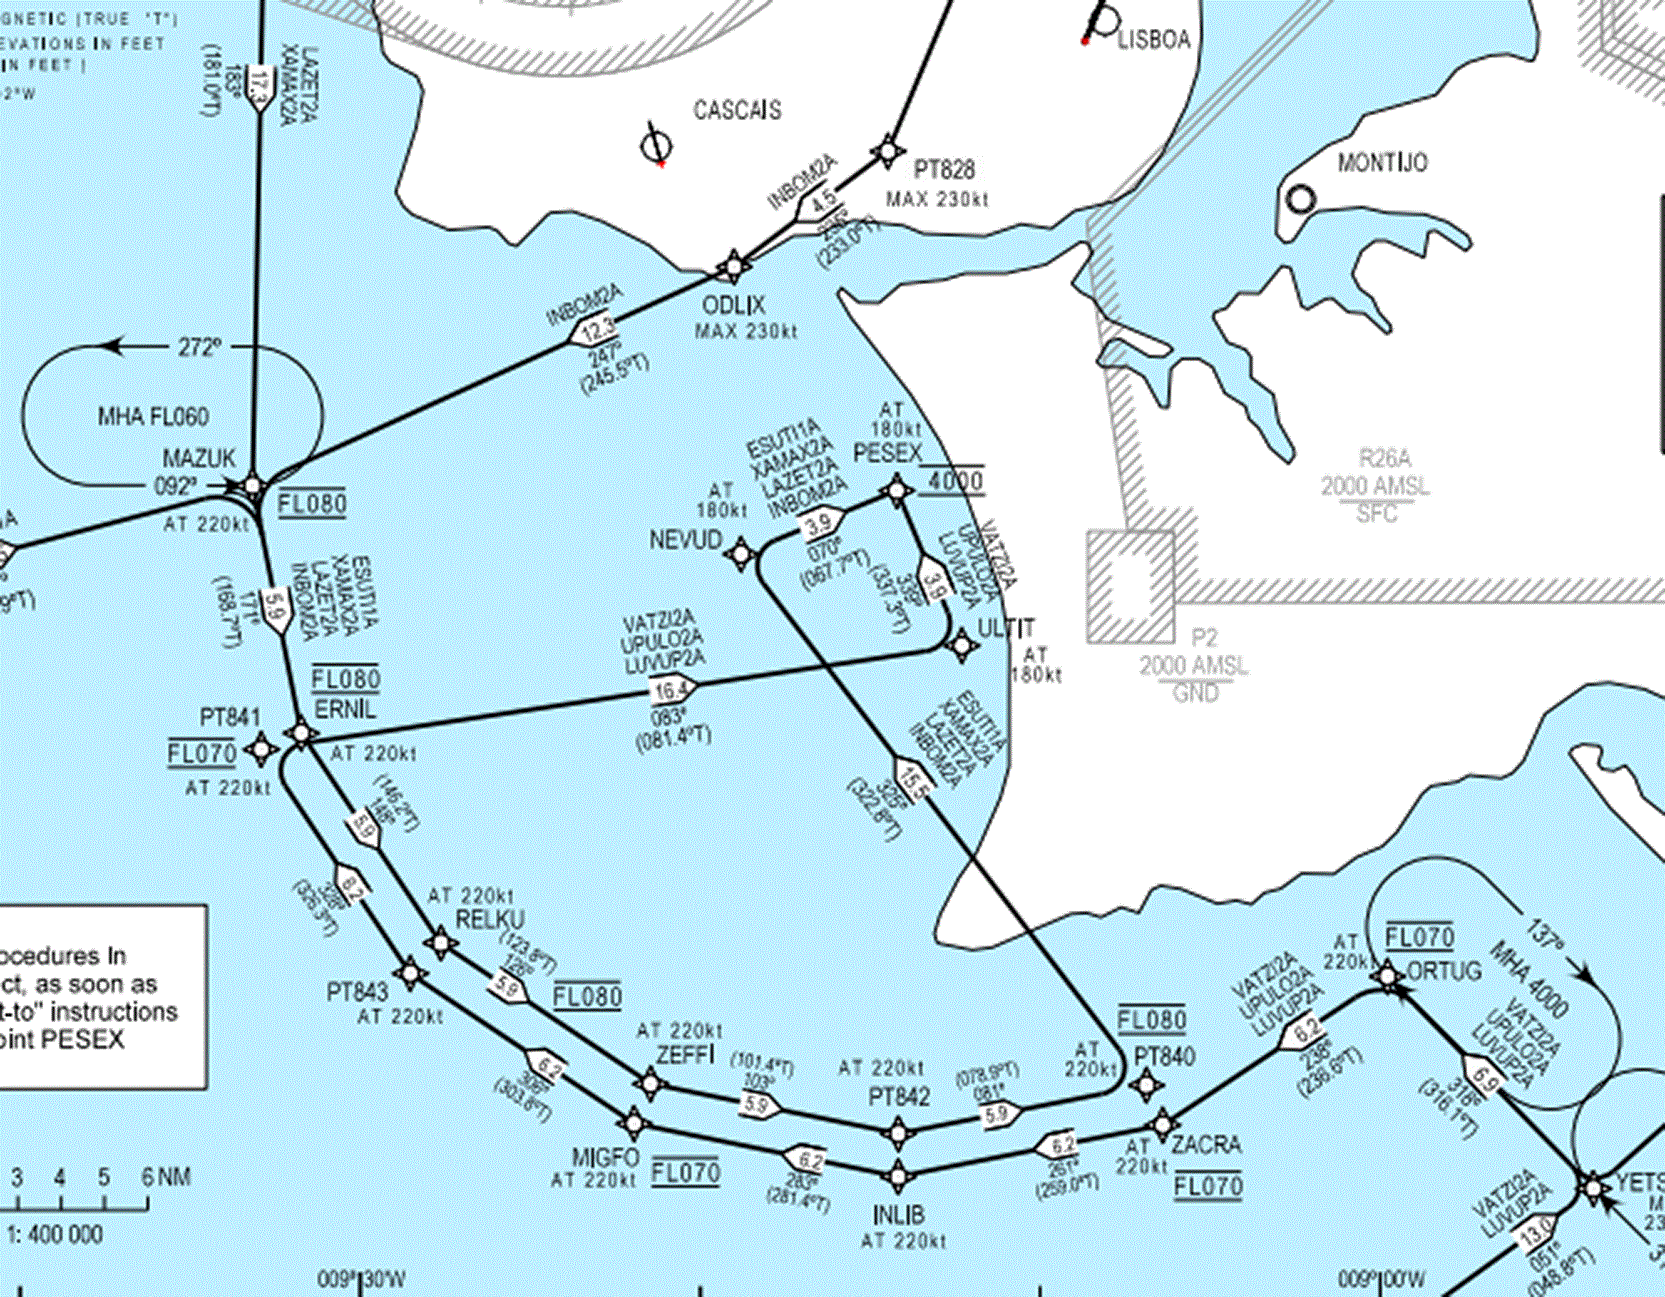
Figure 1. Standard Arrival Chart – Instrument (STAR) RWY 02 to Lisbon Airport.5
These sequencing legs act as linear holding paths: as traffic demand increases, aircraft are instructed to fly longer segments to provide elasticity through its legs. During low-traffic periods, arrivals are cleared directly to PESEX. Once the turn instruction towards the merge point is issued, the relative spacing with respect to the preceding aircraft can no longer be significantly modified, with only limited fine-tuning achievable through speed adjustments of both aircraft. For this reason, the timing of the vectoring instruction towards the merge point becomes a critical decision in the control of arrival spacing within the Point Merge System.
To support the ATCO in this task, ORCI is introduced as a Decision Support Tool (DST) designed to assist them in determining the optimal moment to issue the turn instruction, by providing a prediction of the inter-distance when the preceding aircraft fly over PESEX.
Methodology
Data processing
The data used in this study consist of radar surveillance records provided in JSON format, covering arrival operations in the Lisbon TMA during the summer period of 2024. The sampling period spans from 15 June to 15 September 2024, which typically concentrate high-demand traffic conditions. For each aircraft, the dataset includes four-dimensional trajectory information (timestamp, latitude, longitude, and flight level), together with additional flight variables such as ground speed and heading, sampled at a temporal resolution of approximately 5-sec. In addition to trajectory data, the dataset is enriched with several fixed attributes, including aircraft model, wake turbulence category, origin and destination airport.
As a first filtering step, departure and overflying flights were removed, retaining only arrival operations within the Lisbon TMA. For each remaining flight, the landing runway (RWY 02 or RWY 20) was determined in order to correctly characterise the arrival operation within the ORCI use case.
Given that RWY 02 is the predominantly used configuration during the analysed period and is the operational focus of this study, only arrivals assigned to RWY 02 were retained for further analysis.
To ensure that only airborne trajectory segments relevant to approach operations were considered, ground movement after landing was removed.
Figure 2 presents the approach procedures for RWY 02 at LPPT.
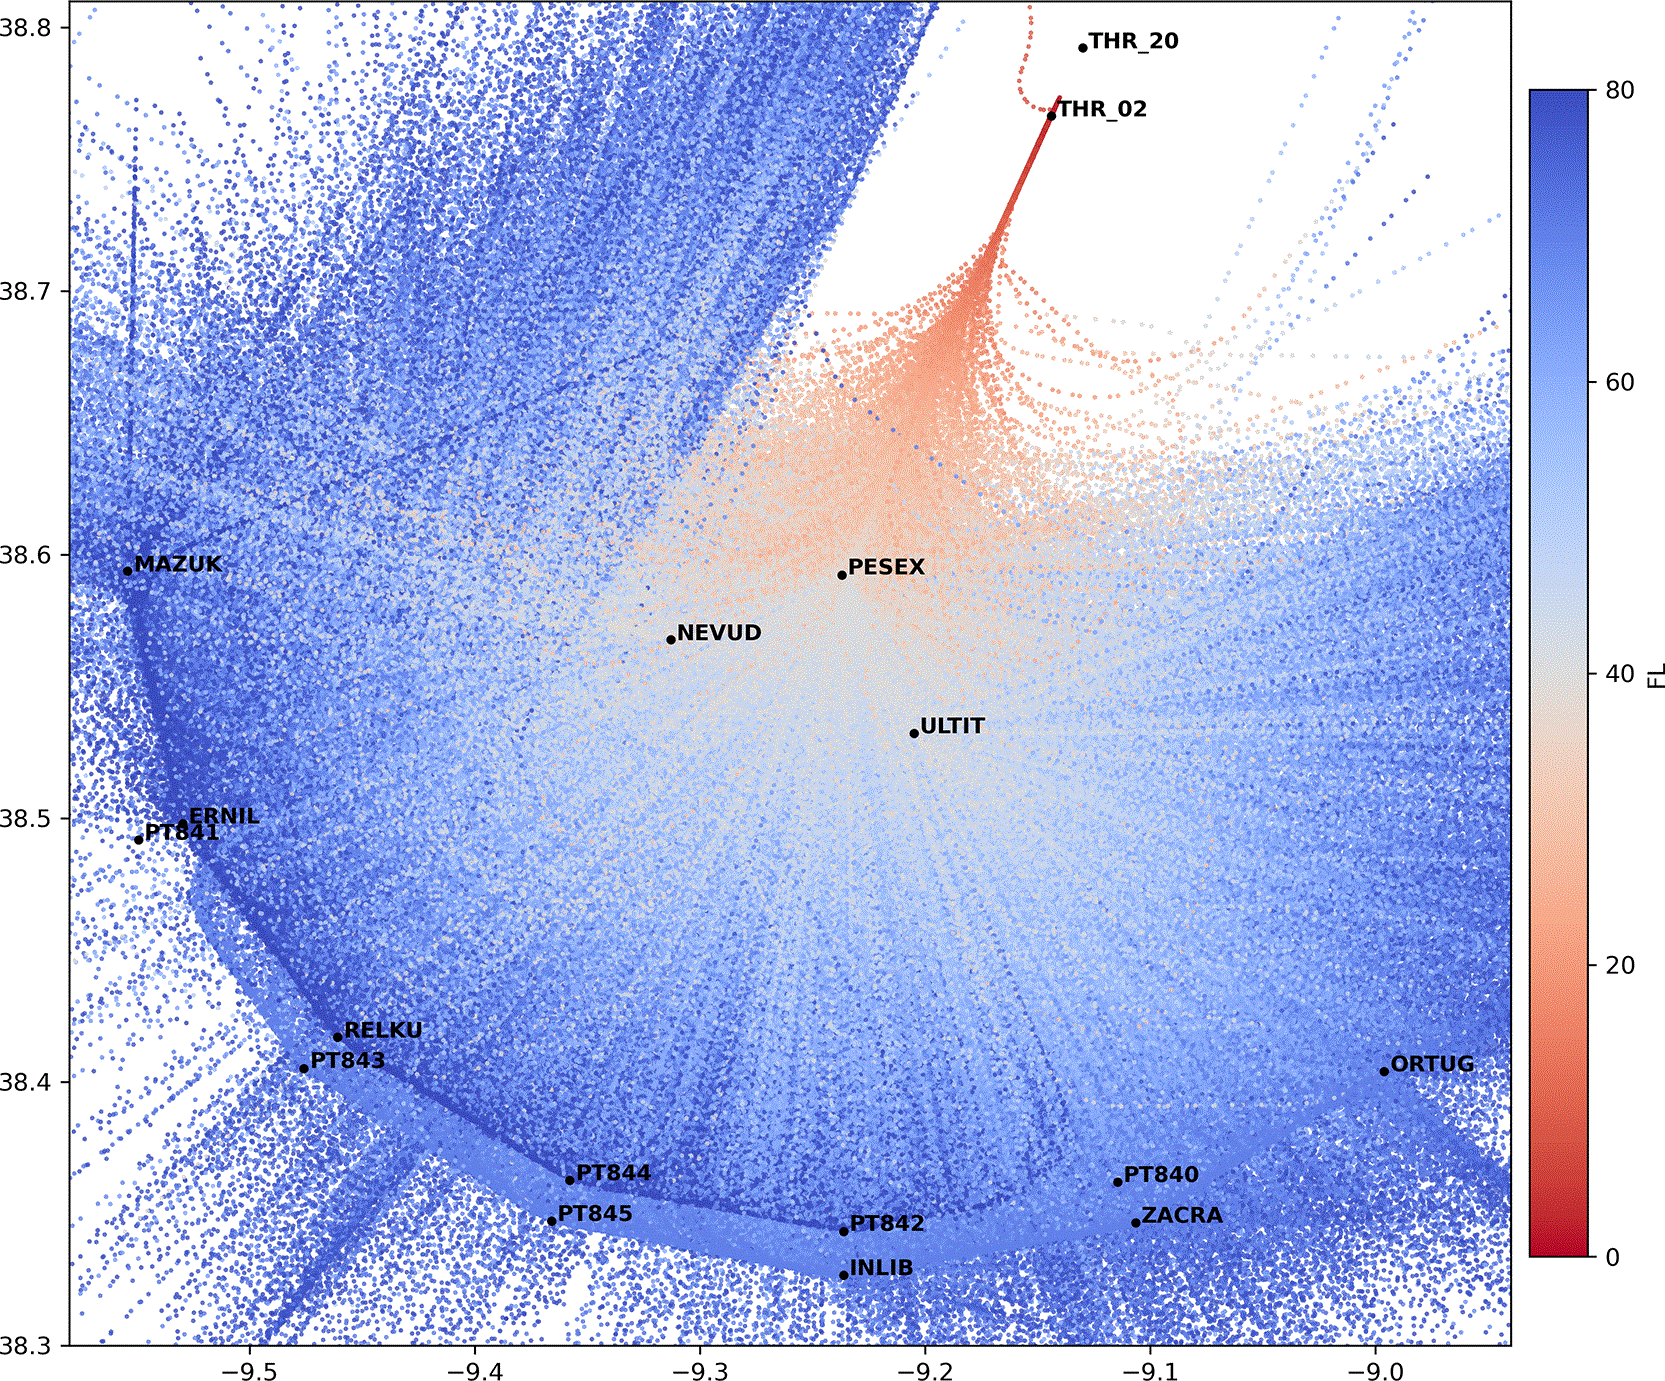
Figure 2. Approach operations to RWY 02 at Lisbon Humberto Delgado Airport.
PMS trajectory characterization and validation
To construct a reliable dataset for model training, only arrival flights closely following the published Point Merge System procedure for RWY 02 were retained (See
Figure 3b). Under low-demand conditions,or as a result of tactical Air Traffic Control interventions, not all arrivals fly the PMS as published. For this reason, a dedicated trajectory validation process was applied to identify flights representative of nominal PMS operations. Flights that were clearly vectored directly to PESEX (See
Figure 3a), as well as trajectories inconsistent with the published PMS geometry, were excluded from further analysis.
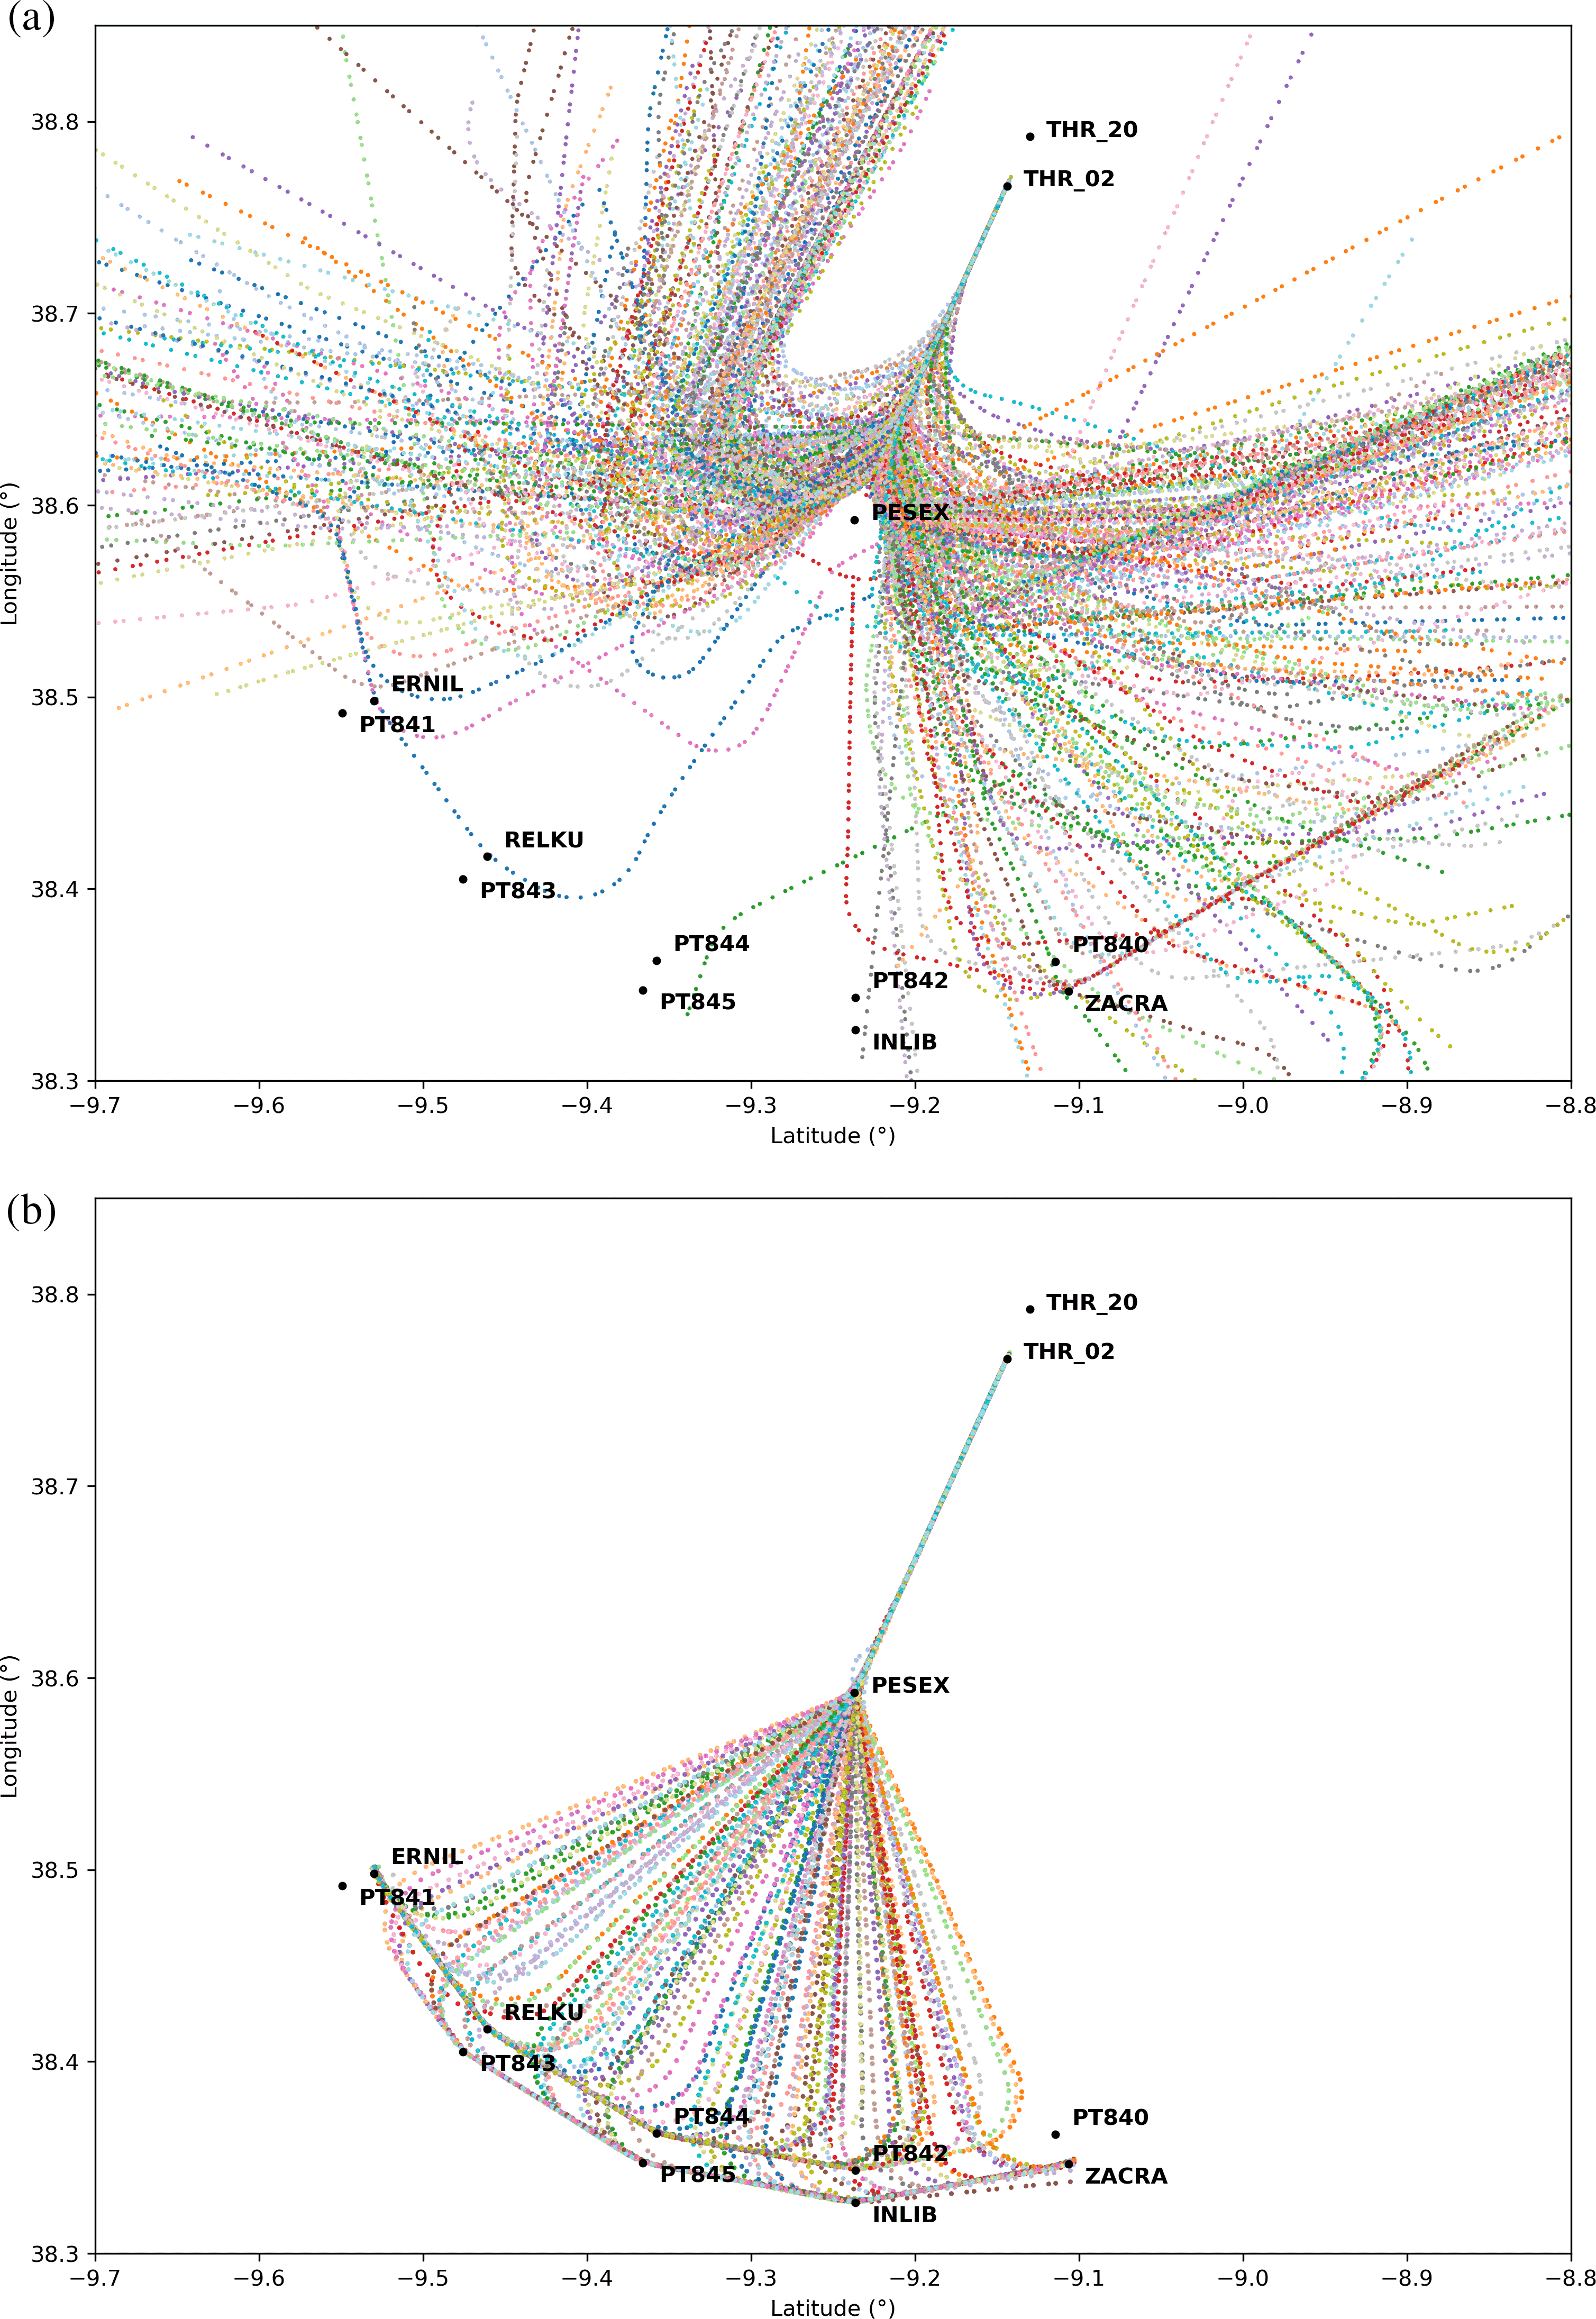
Figure 3. Detail of approach operations to RWY 02.
(a) Operations where the Point Merge System was not used, showing radar vectoring procedures. (b) Operations where the PMS was used, following the published procedure. The trajectories shown correspond to a representative sample of the complete traffic dataset.
The trajectory characterization and selection process consisted of the following checks:
The first step to assess whether a flight is PMS-compliant consists of verifying that the trajectory effectively enters the Point Merge arcs. This is done by checking whether the aircraft passes within a predefined distance tolerance of the published PMS entry points: ZACRA, corresponding to arrivals entering from the eastern side, or ERNIL, corresponding to arrivals entering from the western side. At the moment of closest approach to either entry point, the aircraft heading is compared with the expected orientation of the corresponding PMS entry point. Flights satisfying both the distance and heading criteria are considered to have entered the PMS and are retained for further analysis.
Flights were required to fly sufficiently close to PESEX to be considered valid. In addition, trajectories that deviated significantly from the PMS geometry were discarded. This includes flights that exited the procedure to the south, that left and re-entered the PMS while skipping one or more sequencing segments, or that entered the PMS but flew only a very limited portion of the initial sequencing leg before being vectored off the procedure.
Heading stability was assessed by analysing the deviation of the aircraft heading while established towards PESEX. Flights presenting large heading deviations, inconsistent with a straight flight towards the merge point, were excluded.
Finally, flights that performed abnormal manoeuvres after PESEX, such as unusual turns, non-standard loops, or go-around events after the merge point, were also removed, as these situations are not representative of nominal spacing control and could bias the training dataset.
Hence, only those flights satisfying all the above criteria were retained to form the final dataset used for model training and evaluation.
Turn initiation timestamp identification
A key element in the dataset construction is the accurate identification of the turn initiation timestamp for each arrival. Given the temporal resolution of the surveillance data and the high aircraft speeds during this phase of flight, selecting one timestamp or another separated by a single data sample can lead to significant differences in the input data and consequently, affect the accuracy of the spacing predictions.
Once the sequencing leg flown by each aircraft had been identified, a reference heading was assigned based on the corresponding PMS segment. This reference heading was obtained from the geometric alignment of the RNAV waypoints defining the segment. The observed aircraft heading was then continuously compared with this reference value in order to detect the moment at which the aircraft started deviating from the nominal PMS path.
The aircraft was assumed to be nominally following the assigned sequencing leg while its observed heading remained within a predefined angular tolerance relative to the theoretical segment heading. The start of the turn was detected when the observed heading deviated beyond this tolerance (±6°) depending on the turn direction. Once this condition was met, the aircraft was considered to have initiated the turn, and the corresponding time was labelled as the Turn Timestamp.
Machine learning dataset construction
Once the turn initiation timestamp has been identified for each arrival, and the merge point crossing timestamp at PESEX has been determined during the PMS characterization phase, two key temporal reference points are available for each flight, illustrated in
Figure 4a and
Figure 4b. These instants represent, respectively, the moment at which the spacing prediction is issued and the moment at which the predicted spacing can be compared against the observed outcome, thereby defining the “before” and “after” states of the arrival process.
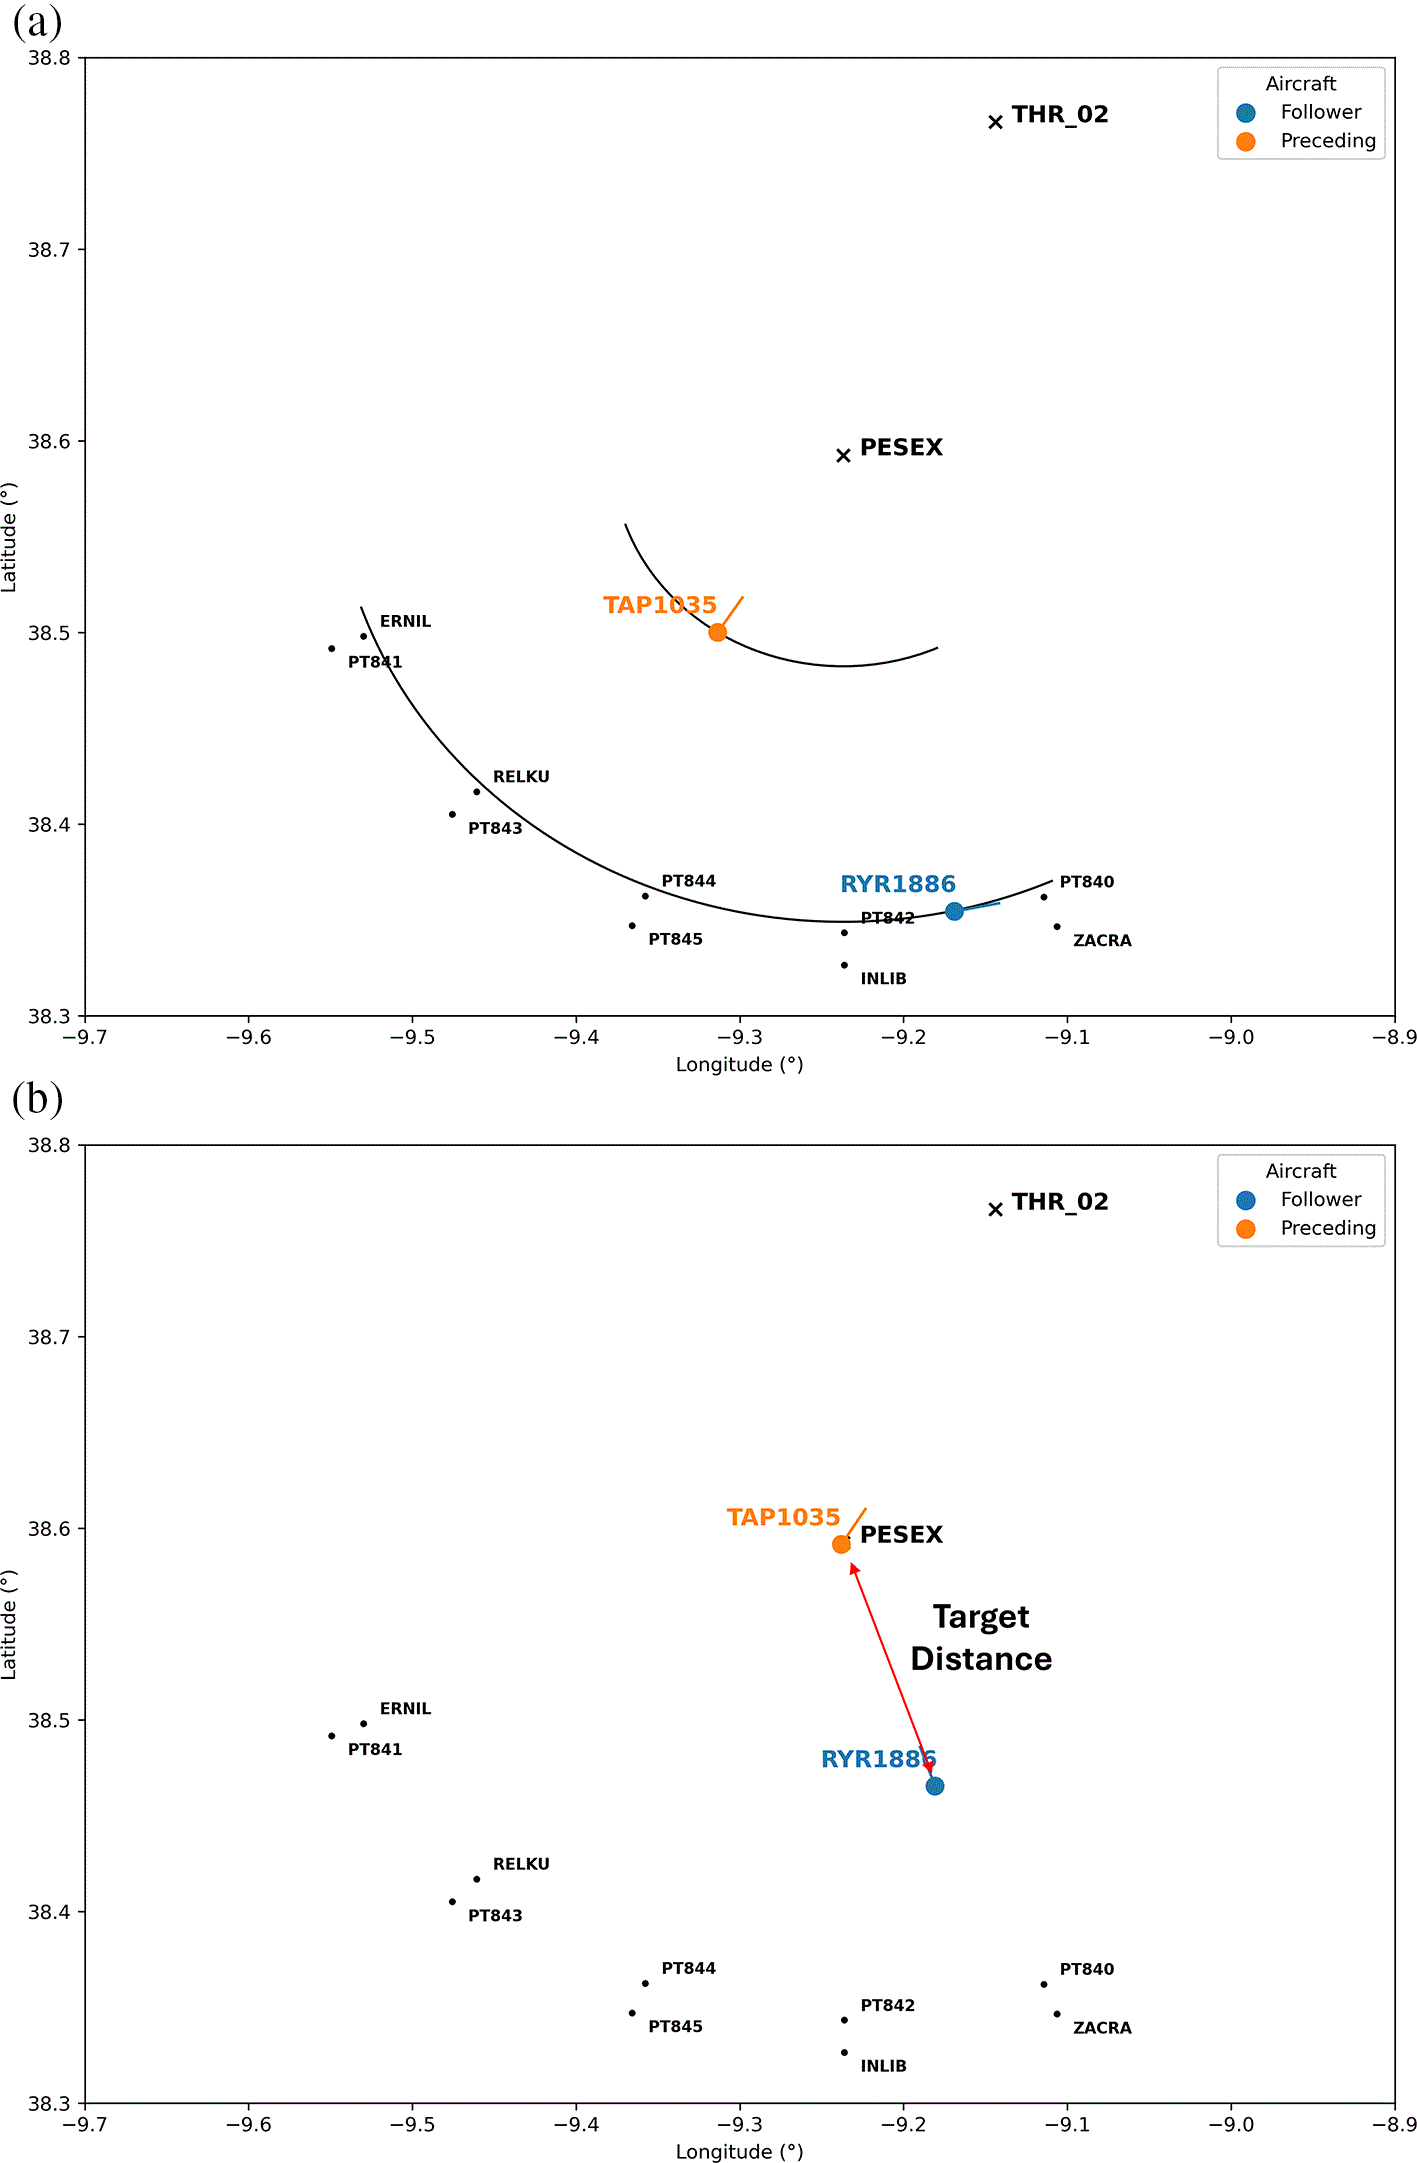
Figure 4. (a) Instant at which the prediction is performed.
(b) Target instant at which the predicted spacing is evaluated.
The next step consists in transforming the original radar-based dataset, in which each record corresponds to an individual surveillance track point, into a dataset suitable for Machine Learning. This is achieved by constructing a new representation where each sample corresponds to a pair of consecutive arrival flights (preceding–follower), described by a set of features extracted before the turn initiation timestamp and associated with a target variable (See
Table 1). The target variable is defined as the inter-aircraft distance at the merge point PESEX when the preceding aircraft flies over it. This paired-flight dataset constitutes the input for training and evaluating the machine learning models.
Table 1. Variables and features of the dataset prepared to train the ML models.
| Raw Flight variables | Calculated variables | Prediction Field |
|---|
| Geographical coordinates (latitude and longitude) for both aircraft | Heading deviation towards PESEX: angle between the aircraft heading and the direct bearing from the aircraft position to PESEX. | Inter-distance when the preceding aircraft fly over PESEX |
| GS for both aircraft | Radii difference with respect to PESEX between aircraft at turn instruction | |
| FL for both aircraft | Preceding distance to PESEX | |
| Wake turbulence follower | Median-centered GS for both aircraft | |
| Median-centered FL for both aircraft | |
Creating synthetic flight pairs
Relying exclusively on 4D (x, y, z and time) real operational trajectories would lead to machine learning models covering a relatively narrow range of spacing conditions, typically limited to inter-separations at PESEX between approximately 8 and 12 NM, which correspond to situations encountered during routine daily operations. Under these constraints, the predictive capability of the tool would be restricted to scenarios closely resembling historical observations, thereby reducing its robustness when applied to non-nominal or less frequent spacing conditions.
To overcome this limitation and to generate a more complete dataset, a synthetic data generation process was applied: For each valid preceding–follower flight pair, the timestamp sequence of the preceding aircraft i.e. time dimension, was artificially advanced or delayed in 10s intervals, while the follower trajectory was kept frozen and the original three-dimensional flight paths were preserved. This approach enables the creation of multiple synthetic samples from a single real flight pair without altering the underlying trajectory geometry.
Through this temporal shifting process, a broad spectrum of spacing scenarios is generated, including nominal operational situations, excessive separation cases and extreme scenarios in which the follower aircraft virtually “overtakes” or “collides” the preceding one, resulting in near-zero and negative inter-distances at the merge point.
Figure 5 illustrates the distribution of the target variable—inter-aircraft distance at PESEX—before and after synthetic data generation. The comparison shows not only an increase of one order of magnitude in the number of available samples, but also a substantial widening of the separation range covered by the dataset. This extended range is essential to improve their generalization capability and operational robustness.
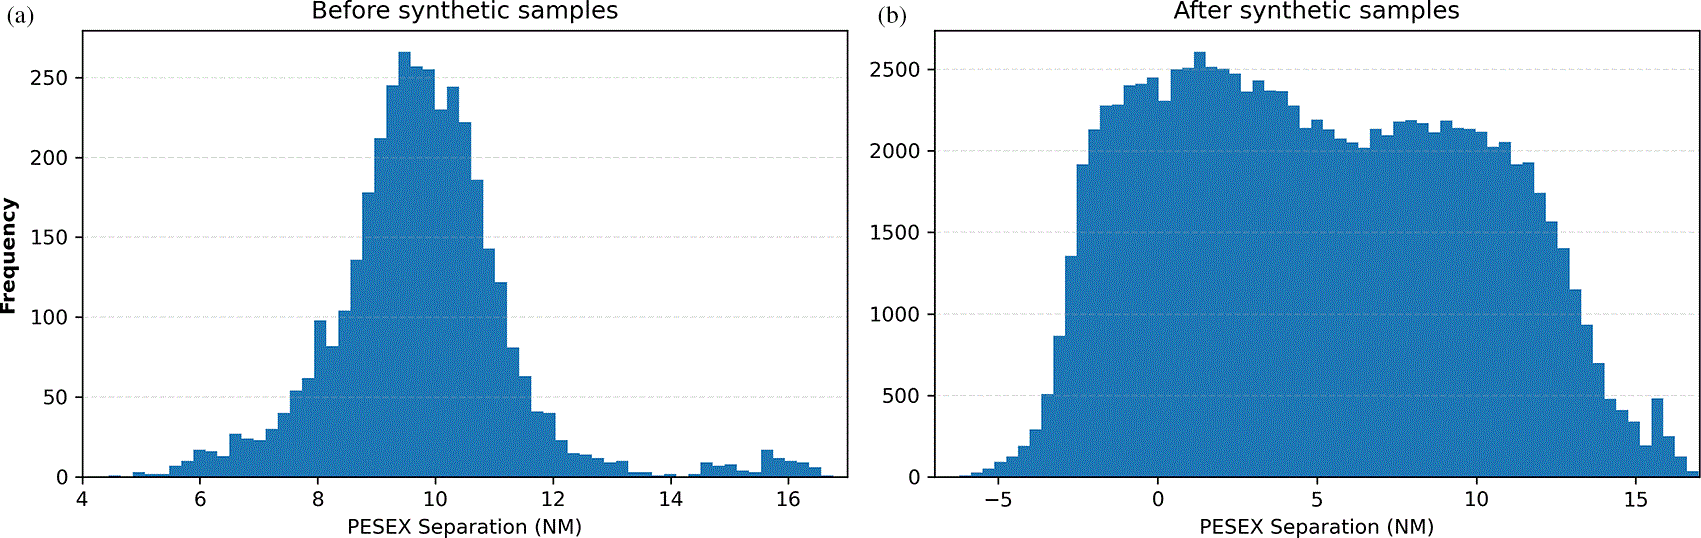
Figure 5. Spacing at PESEX between the two aircraft in real operative (a) and after (b) the generation of the synthetic data.
Machine learning models training
The training and test sets were split by allocating three weeks from each month to the test dataset and the remaining week of that month to the training set,
resulting in an approximate training and test ratio of 75–25%. This temporal separation was chosen to prevent synthetic samples derived from the same flight from appearing in both datasets.
Two machine learning models were trained separately depending on the Point Merge sequencing leg on which the follower aircraft was. This separation is motivated by the geometric characteristics of the PMS structure: the eastern and western sequencing legs are located on concentric arcs with different radii with respect to the merge point PESEX, resulting in a radial offset of approximately 1 NM between them.
Consequently, for otherwise identical operational conditions—such as aircraft speeds, wake turbulence or altitudes - the follower aircraft may be located at significantly different distance from the merge point depending on whether it is flying the eastern or western leg. This offset introduces distinct spacing dynamics that cannot be fully captured by a single linear relationship. Modelling both legs with a single model would implicitly require the regression to learn a conditional, discontinuous dependency given by the leg geometry, which is outside the expressive capability of a linear model.
Moreover, the use of simple, leg-specific linear models ensures full traceability and auditability of the predictions, allowing the influence of each input variable on the predicted spacing to be clearly understood and reviewed. This provides an additional level of confidence and reassurance when the tool is used in an operational context.
Results
In this section, the results of the model training and evaluation are presented. Initially, a standard linear regression model was trained. However, from an operational standpoint, not all types of prediction errors have the same implications. The prediction error is defined as the difference between the predicted and the observed inter-aircraft spacing (error = d_predicted – d_real). Under this formulation, positive errors correspond to situations in which the model predicts a larger spacing than the one achieved, meaning that aircraft end up closer than anticipated. From an operational point, these cases represent the undesirable side of the error distribution, as they may lead to overly optimistic spacing estimates. This aspect is particularly relevant in mixed-mode runway operations, where sufficient spacing is required not only for wake turbulence considerations but also to accommodate a departure between consecutive arrivals.
When trained without additional constraints, standard linear regression models tend to produce error distributions that are centred around zero, optimizing global accuracy but implicitly treating positive and negative errors symmetrically. However, from an operational perspective, errors are not symmetric: overestimating the achieved spacing is more critical than underestimating it.
To address this asymmetry, a second training iteration was performed using a weighted regression approach. An additional weight was assigned to each training sample based on the prediction error obtained in the initial model iteration. This approach allows the learning process to penalise non-conservative cases, assigning higher importance to situations with positive errors, while reducing the influence of less critical samples. In practical terms, this approach is equivalent to virtually increasing the number of occurrences of undesirable cases in the training dataset, forcing the model to learn more accurately from them. As a direct consequence, the resulting error distribution is intentionally shifted towards negative values, with the mean error displaced to approximately −0.5 NM, reflecting overall a more conservative behaviour. Furthermore, this weighting strategy leads to a substantial reduction in the number of cases with large positive errors, particularly those exceeding +0.5 NM (See
Figure 6).
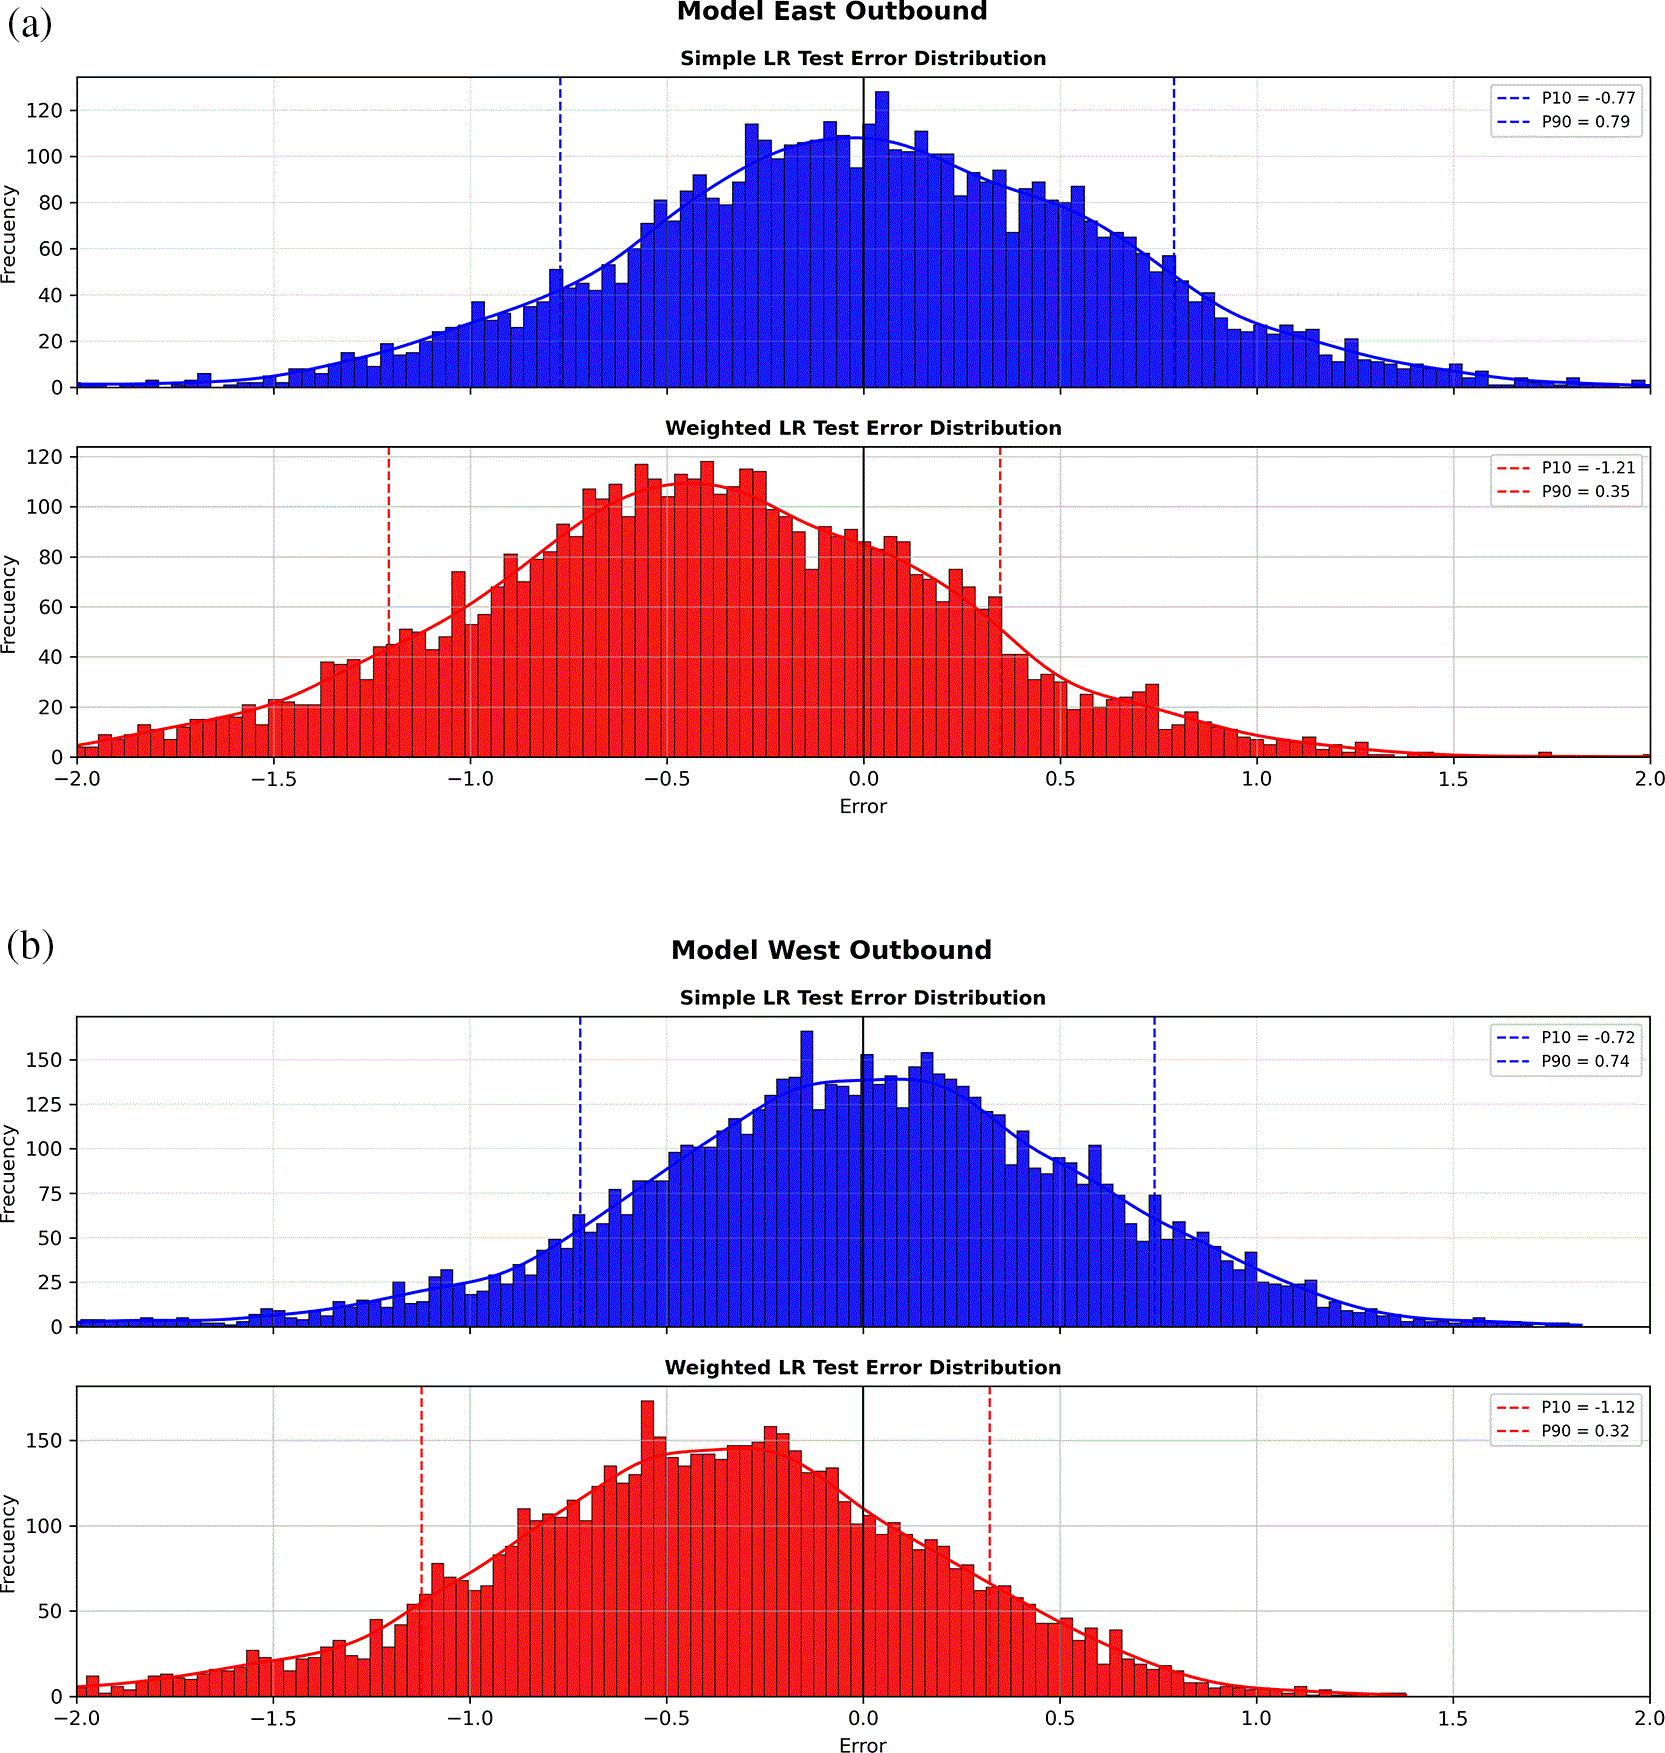
Figure 6. (a) Test error histogram for Model East using standard linear regression and weighted linear regression.
(b) Test error histogram for Model West using standard linear regression and weighted linear regression.
By prioritizing these non-conservative situations during training, the weighted models aim to reduce positive errors and provide more conservative and operationally reliable spacing predictions, while maintaining an overall level of predictive performance.
The training and test metrics (See
Table 2) are consistent across all models, indicating stable generalization performance in unseen data and confirming that neither overfitting nor underfitting is present. No significant degradation in predictive performance is observed for the East outbound model when compared with the West outbound model. This outcome is noteworthy, as the prediction point for the East configuration is located approximately 1 NM farther from PESEX, which could be expected to introduce additional uncertainty and operational variability into the prediction task. Despite this longer prediction horizon, both outbound configurations achieve comparable accuracy levels.
Table 2. Comparation of the different evaluation metrics for each LR and weighted LR model.
| Model/Metric | MAE | MSE | R2 | p10 | p50 | p90 |
|---|
| Conventional LR | Model East | Train | 0,501 | 0,404 | 0,962 | −0,809 | 0,013 | 0,776 |
| Test | 0,498 | 0,399 | 0,963 | −0,773 | 0,017 | 0,794 |
| Model West | Train | 0,514 | 0,423 | 0,961 | −0,766 | 0,008 | 0,756 |
| Test | 0,484 | 0,376 | 0,966 | −0,715 | 0,018 | 0,741 |
| Weighted LR | Model East | Train | 0,603 | 0,583 | 0,948 | −1,250 | −0,400 | 0,350 |
| Test | 0,596 | 0,559 | 0,950 | −1,210 | −0,410 | 0,350 |
| Model West | Train | 0,576 | 0,529 | 0,953 | −1,180 | −0,390 | 0,340 |
| Test | 0,561 | 0,514 | 0,955 | −1,120 | −0,380 | 0,320 |
The weighted regression models exhibit higher MAE and MSE values than their conventional counterparts. However, this increase in global error metrics should not be interpreted as a deterioration in operational performance. The weighting strategy was deliberately designed to prioritize the reduction of large positive errors that are more critical from an operational perspective in mixed-mode runway operations. As a result, the upper tail of the error distribution is significantly reduced, with the p90 decreasing from approximately 0.75–0.80 NM in the conventional models to around 0.32–0.35 NM in the weighted models.
This reduction is particularly relevant in the LPPT operational context, where mixed-mode operations require sufficient spacing to accommodate departing aircraft between consecutive arrivals. Consequently, reducing large spacing overestimations is more valuable than minimizing the average prediction error alone. The proposed weighting strategy therefore reflects a deliberate trade-off between overall statistical accuracy and operational perspective, aligning model behaviour with the airport’s mixed mode requirements rather than focusing exclusively on global error minimization metrics.
Conclusions
The results obtained so far are promising and support the potential of the ORCI concept as an operational DST. ORCI provides controllers with real-time predictions of the spacing that would result from issuing a turn instruction at a given moment, allowing them to better anticipate the effects of their tactical decisions. Importantly, the tool remains purely advisory: the final decision remains with the ATCO, ensuring that ORCI enhances controller performance and decision-making capabilities rather than replacing the human operator.
Following the same validation approach previously applied in the LEBL study,2 future work will include additional Human-in-the-Loop simulations with currently active ATCOs. These exercises will further assess the operational performance of the tool under realistic traffic conditions, while also evaluating aspects of Human Performance, such as workload, situational awareness, trust, usability and overall Human-Machine Teaming effectiveness.
Ethics and consent
Ethical approval and consent were not required.
Data and software availability
The data presented in this study are not publicly available because they consist of sensitive radar surveillance data from real flight operations provided by NAV Portugal. Their use is subject to a Non-Disclosure Agreement (NDA) between the data provider and the authors’ institution, which prohibits public dissemination. No Institutional Review Board (IRB) approval was required, as the study does not involve human participants. Researchers wishing to access the data should contact the corresponding author (rita.banon@ineco.com) in the first instance. Any request will be forwarded to NAV Portugal and will be subject to the provider’s approval and any applicable confidentiality agreements.
Acknowledgements
The authors would like to thank Nav PT for providing access to the radar data used in this study, as well as for the valuable operational knowledge contributed by its ATCOs. The authors also acknowledge ISA Software for their support in the validation activities and for their technical expertise. Additionally, the authors acknowledge the use of LLMs (Chat GPT 5.5) as an aid for text revision and refinement during the preparation of this manuscript.
References
- 1.
Eurocontrol. Point Merge: Improving and Harmonising Arrival Operations.
(accessed on July 13, 2026).
Reference Source
- 2.
Bañón R, Mateo-Vendrell A, Rísquez JM:
ORCI: An Exploratory Data-Driven and Machine Learning Framework to Predict Aircraft Spacing on Final Approach—Case Study in Barcelona (LEBL).
Engineering Proceedings.
2026; 133(1): 41. Publisher Full Text
- 3.
Sahin Meric Ö, Usanmaz O:
A new standard instrument arrival: the point merge system.
Aircraft Engineering and Aerospace Technology: An International Journal.
2013; 85(2): 136–143. Publisher Full Text
- 4.
Cecen RK:
Multi-objective TMA management optimization using the point merge system.
Aircraft Engineering and Aerospace Technology: An International Journal.
2021; 93(1): 15–24. Publisher Full Text
- 5.
NAV Portugal AIS. Standard Arrival Chart – Instrument (STAR) – ICAO (RNAV RWY 02 ESUTI1A, INBOM2A, LAZET2A, LUVUP2A, UPULO2A, VATZI2A, XAMAX2A).
(accessed on July 13, 2026).
Reference Source







