1. Introduction
Wood is increasingly recognised as a key element for the decarbonisation of the built environment, due to its lower embodied energy compared to functionally equivalent construction materials such as steel and concrete, and its capacity to store carbon over its service life.1–3 The use of wood in long-lived products, such as buildings, can prolong carbon storage. Despite these and other advantages, such as wood being a renewable material with a high specific strength, timber construction remains a niche segment within the European construction sector, accounting for a relatively small share, less than 3% by mass and 13% by volume in 2018, of total building materials consumption.4,5
Current timber construction in Europe relies on a narrow range of softwood species, mainly spruce from Central and Northern Europe, even though European forests are diverse in both species’ composition and geographical distribution. Supply imbalances in European timber markets have been identified by Bozzolan et al.,6 highlighting the need to assess the availability and harvesting potential of forest resources across Europe. Utilisation rate is a common index for assessing whether tree species or forest regions are harvested below their annual growth potential and therefore could contribute to an additional sustainable wood supply.7
The rising demand for wood products, driven by policy frameworks in bioeconomy, sustainability, resource efficiency, carbon removals, and carbon storage, and the design of the built environment according to the values of the New European Bauhaus,8–11 among others, increases pressure on forest resources. Efficient utilisation of harvested wood is therefore essential. Material losses occur throughout the whole value chain, from forest harvesting to the production of sawnwood, the manufacturing of engineered wood products (EWP), building design, and end-of-life.12,13 As structural EWP account for a high proportion of the total wood volume in buildings,14,15 strength grading of timber to enhance the yield and properties of sawnwood allocated to structural applications is crucial for optimising the resource efficiency of harvested wood.
The performance of a construction product needs to be declared by the suppliers in the CE marking following harmonised European technical specifications, as required by the Construction Products Regulation.9 Timber strength grading constitutes the first step towards its use in structural applications within the construction sector, both as solid sawnwood for timber framing systems or as lamellas or other structural components in EWPs, such as glued laminated timber (GLT) or cross-laminated timber (CLT). Timber strength grading in Europe is carried out using two main methods: visual grading and machine grading. Both methods aim to assign timber to strength classes defined in EN 33816 based on physical and mechanical properties determined through experimental testing according to EN 408,17 typically including bending or tensile strength, modulus of elasticity in bending or in tension, and density. These strength classes provide a harmonised classification system for structural timber across Europe and worldwide, independent of wood species, origin, national strength grading standard, or grading method, and define the characteristic properties used for structural design according to building design codes, such as Eurocode 5.
As summarised in
Figure 1, visual grading consists of establishing relationships between experimentally determined mechanical properties and visual features measured on sawn timber members, such as knot size, fissures, and grain deviation. Machine grading establishes relationships between the experimentally determined mechanical properties and the indicating properties (IP), such as dynamic modulus of elasticity or density. IPs are measured through non-destructive testing using the homologated grading machines listed in Ridley-Ellis et al.18 Visual strength grading is regulated through standards, such as DIN 4074 in Germany, UNE 56544 and UNE 56546 in Spain, or IS 127 in Ireland, whereas machine strength grading is regulated at the European level under harmonised standard EN 14081–2,19 applicable across all EU Member States. Both methods result in the assignment of strength classes. Visual grades assigned to timber species at the national level are related to strength classes in EN 1912.20 Strength classes assigned from machine grading are published in the Approved Grading Reports (AGR) of CEN/TC124/WG2/TG1 [1]. The AGRs are confidential documents, accessed by the Committee and the company that commissioned the machine grading.
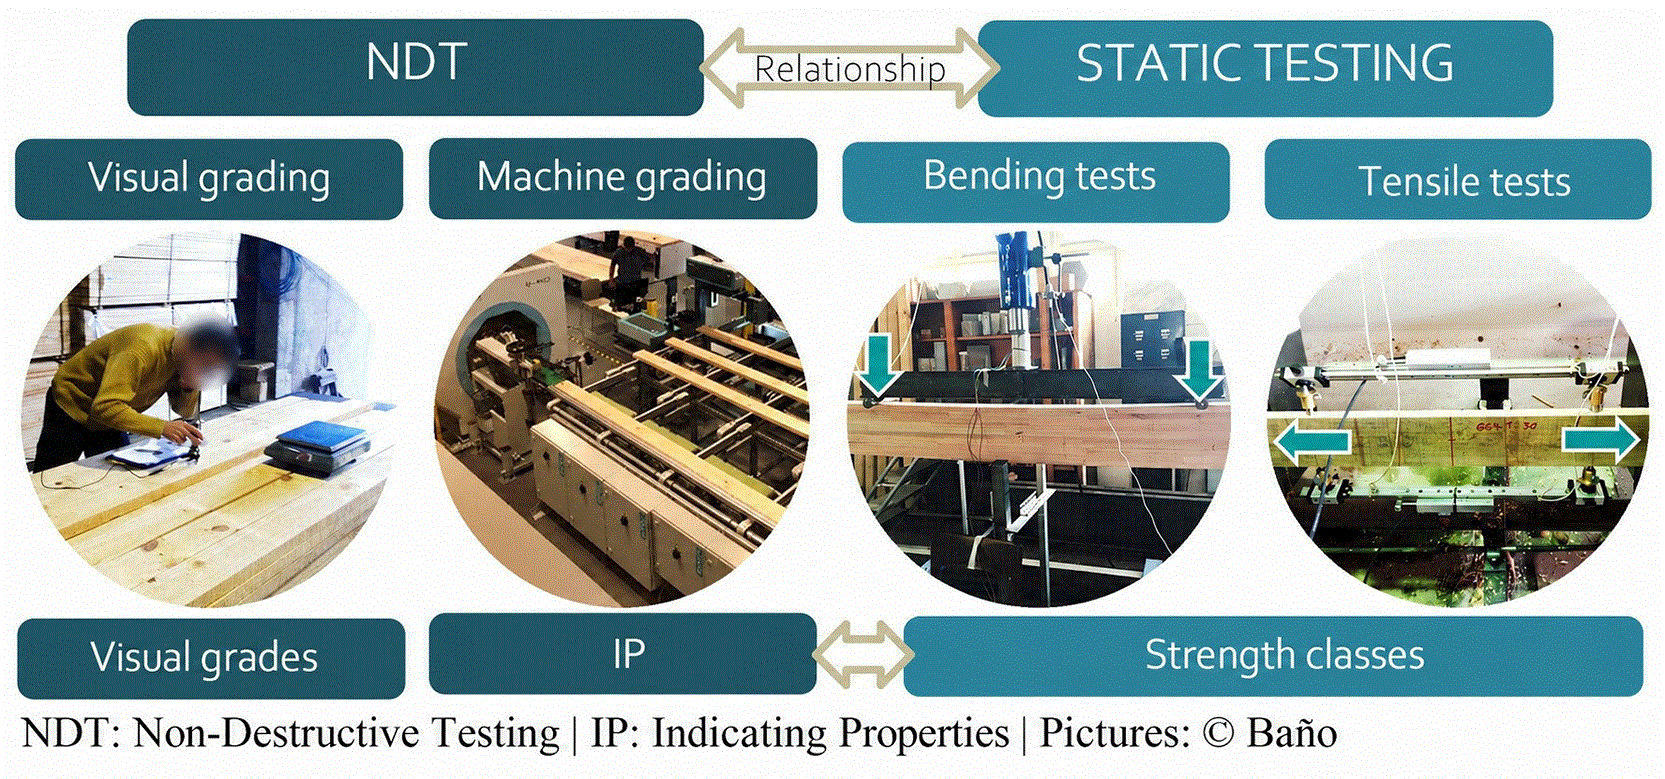
Figure 1. Graphic representation of the timber strength grading process.
While visual grading remains widely used, machine grading is increasing and is the main method used in large sawmills and by EWP manufacturers because it offers improved accuracy, higher yields, and better optimisation of resource use.21,22 However, the implementation of grading systems in Europe is not uniform. Many wood species present in European forests are not strength-graded or are underrepresented in standards. In addition, strength grading in some countries is not updated to account for changes in forest resources or technological capabilities.
The present paper addresses this gap by providing an analysis of European strength-graded wood species and grading systems in relation to the geographical distribution of forest resources. The objective is to identify trends, gaps in technical standards, and opportunities for a more efficient use of available wood resources in structural applications. A more detailed analysis is conducted through the case studies of Ireland and Spain. The specific objectives are to: i) conduct a literature-based analysis of the availability, production and use of forest resources in construction by wood species and country; ii) analyse the current state and trends of visual and machine strength grading for European timber species; iii) analyse recent developments in strength grading in Ireland and Spain in relation to their forest resources and utilisation; and iv) identify the key research and standardisation needs to support the increased and efficient use of wood in structural applications in buildings and civil works.
2. Methodology
2.1 Literature-based analysis of European forest resources, wood production, and use in construction
A literature-based analysis of European forests was conducted, based on species composition, growing stock, removals, annual increment, and end-use allocation as key indicators. Quantitative data on wood production (m3) in Europe were obtained from the FAOSTAT database. The relative relevance of the sawmilling sector within the overall wood supply chain was evaluated for both softwoods and hardwoods, as shown in
Equation 1. Sawlogs refer to wood used by the sawmill industry, as opposed to other uses such as energy or pulp production, and do not include wood used for the manufacturing of wood-based panels, as defined in Ref. 23.
(1)
The forest resource base was analysed from the national forest inventories and global forest resource reports. Wood mobilisation intensity, or utilisation rate (%), was estimated by comparing annual harvest or removal volume (m3) with net annual increment (NAI), as shown in Eq. 2. NAI refers to the annual volume increment of all trees minus natural losses. The resulting utilisation rate was used to identify when wood was harvested substantially below its annual growth potential. Species-level analysis was made when data were available. Species were considered potentially underutilised in terms of mobilisation when annual removals were below 80% of annual increment. This threshold was used as a conservative benchmark, recognising that harvesting close to or above annual increment may not be sustainable over the long term. Species with utilisation rates above this threshold were not classified as underutilised in terms of extraction but were further assessed for their end-use allocation. Where available, end-use allocation data were used to distinguish between wood directed to energy, pulpwood, and longer-lived material applications. In this study, underutilisation is therefore understood as either low mobilisation relative to increment or allocation to short-lived and lower value uses despite potential for long-lived material applications.
(2)
2.2 Geographical distribution of wood species in European forests
The wood species considered for the European context of this study were identified from the standard EN 1912,20 which includes nine coniferous and ten broadleaved European species, as shown in
Table 1. Throughout this document, coniferous species will be referred to as softwoods, and broadleaved species as hardwoods, following the terminology commonly used in the wood industry. Both common and scientific wood species names, as well as the corresponding codes defined in EN 13226, were used consistently throughout the study.
Table 1.
European timber species analysed.
| Acronym1 | Scientific name |
Common name |
|---|
| Softwoods | PCAB | Picea abies
| Norway spruce |
| ABAL | Abies alba
| Silver fir |
| PNSY | Pinus sylvestris
| Scots pine |
| LADC | Larix decidua
| European larch |
| PSMN | Pseudotsuga menziessii
| Douglas fir |
| PCST | Picea sitchensis
| Sitka spruce |
| PNPN | Pinus pinaster
| Maritime pine |
| PNNN2 | Pinus nigra
| Black pine |
| PNRD | Pinus radiata
| Radiata pine |
| Hardwoods | FASY | Fagus sylvatica
| Beech |
| QCRB | Quercus robur
| Pedunculate oak |
| QCXE | Quercus petraea
| Sessile oak |
| CTST | Castanea sativa
| Sweet chestnut |
| PONG | Populus nigra
| Black poplar |
| POER | Populus x euramericana
| Hybrid poplar |
| ACPS | Acer pseudoplatanus
| Maple |
| FXEX | Fraxinus excelsior
| Ash |
| EUGL | Eucalyptus globulus
| Southern blue gum |
| EUNT | Eucalyptus nitens
| Shining gum |
The geographical distribution of these species was determined using the European atlas of forest tree species,24 which provides data on the relative probability of species presence. The atlas provides a visual representation of the species found at a specific location, as shown in
Figure 2.
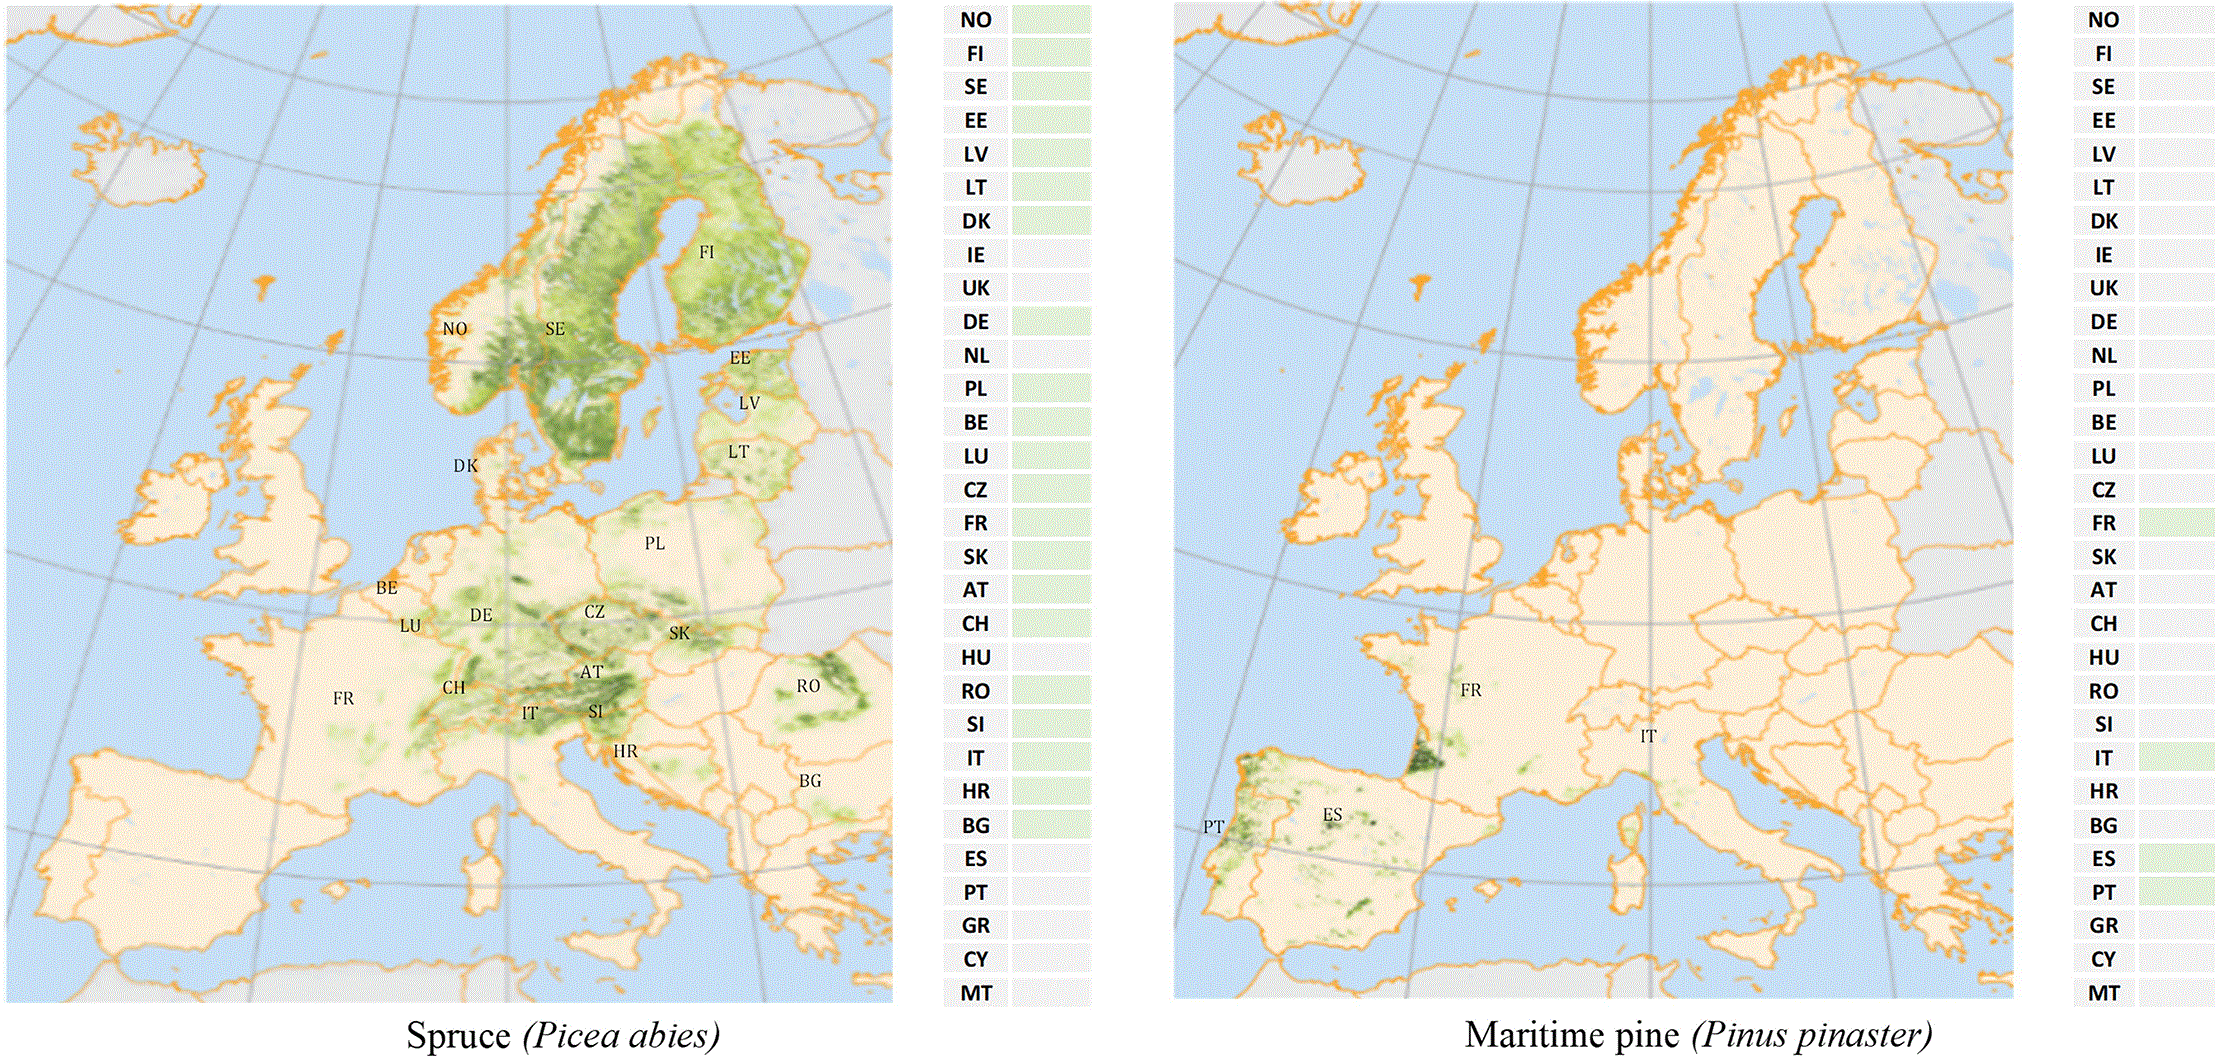
Figure 2. Identification of the geographical distribution of Norway spruce and maritime pine (map adapted from Ref. 24).
The analysis covered the EU-27 countries, plus the United Kingdom (UK), Norway (NO), and Switzerland (CH). Country names were standardised using ISO 3166-1 alpha-2 codes [2]. Countries were classified according to the presence of the 19 species identified in
Table 1.
Figure 2 shows an example of forest distribution for Norway spruce and maritime pine.
Some assumptions based on supplementary sources were made for species not included in the European atlas of forest tree species. The distribution of radiata pine was identified based on Ref. 25. The distribution of hybrid poplar was considered the same as that of black poplar. In addition, its presence was also identified in the Iberian Peninsula26 and in Germany.26 The distribution of shining gum is mainly concentrated in North-West Spain and Portugal, as an alternative species to Southern blue gum.27,28 Therefore, the same geographical distribution was considered for both Eucalyptus species.
2.3 Development of a matrix of wood species and geographical distribution
A matrix of wood species and their geographical distribution by European country was developed. Countries were displayed in rows, sorted from North to South, and wood species, grouped into softwoods and hardwoods, in columns.
Each cell in the matrix represents the presence or absence of a given species in a specific country. Cells were shaded to indicate species availability. Green colour was used for softwoods and yellow for hardwoods, while absence was represented by uncoloured cells, as shown in the example for spruce and maritime pine in Figure 2. This matrix structure makes it easy to analyse the geographical distribution of the studied wood species. However, since the presence of a tree species in the forests does not imply its availability for wood supply, a specific analysis was made for the case studies of Ireland and Spain.
2.4 Identification of strength-graded timber species
Strength-graded timber species were identified based on information from European standards, technical reports of the European Committees for Standardisation, and scientific publications. Data sources for the European analysis included EN 1912 and EN 14081–4 for visually and machine-graded timber, respectively.20,29 Additional information for the two case studies was obtained from the technical reports approved by CEN/TC124/WG2/TG1 and relevant scientific publications. Machine-graded species in Ireland were collected by Ridley-Ellis et al.18,30 Specific databases for machine strength-graded species in Spain were developed within this research in collaboration with the two main machine suppliers and their representatives in the country. The resulting databases are available in the open-access repository Zenodo.31,32
The identified strength-graded species were mapped into the previously developed matrices, one for visual grading and another for machine grading. For each species-country combination, the strength class type was indicated by assigning letters C, D, or T, which indicate whether the strength classes were determined from bending (commonly C for coniferous/softwoods and D for deciduous/hardwoods) or tensile tests (T). Other letters can be used for strength-grading assignments at the national level. This approach allows direct comparison between species availability in forests, strength-graded species, and grading systems. A specific analysis of strength-graded wood species, properties, and the relation with the wood supply was made for the two case studies. Strength classes derived from visual grading were identified from EN 1912,20 which assigns visual grades to European strength classes based on wood species, origins, and national grading standards. In this context, origin refers to the geographical source of timber, which may correspond to individual countries or broader regions.
The same approach was used for machine grading. Strength classes defined from machine strength grading before 2008 were compiled from EN 14081–4.29 This standard included the strength classes assigned to wood species by country and by the homologated grading machine used. As information regarding machine-graded timber after 2008 remains confidential for CEN committees, the post-2008 analysis focused on the two case studies.
3. Results and discussion
3.1 Overview of European forest resources, wood production, and use in construction
European forests constitute a significant and expanding resource base for the wood industry, with a growing stock of approximately 38.3 billion m3.33 79% of the growing stock is in forests available for wood supply (FAWS).34 Although softwoods and hardwoods are balanced at the European scale, their distribution and industrial utilisation show regional variations. Softwoods dominate Northern Europe, where they represent 68% of the growing stock, while hardwoods are more prevalent in Central and Southern regions. Despite the diversity of wood species in European forests (34 genera), only six genera account for more than 80% of the total growing stock: pine (26.3%), spruce (20.3%), beech (13.3%), oak (10.8%), birch (5.3%), and fir (5.4%).
Harvesting pressure is currently higher on softwood species, whilst the hardwood growing stock has increased at a faster rate (2–4% per year) than the softwood stock (1–2% per year) (Forest Europe, 2026), reflecting a comparatively lower level of industrial utilisation. Annual felling accounts for 81% of the NAI, which remains within the threshold generally considered sustainable in forestry, where utilisation below 100% of the NAI is acceptable.35 However, this utilisation is not evenly distributed across European regions and wood species. In 2020, the highest utilisation rates (>80%) were in North, Central, and Central-East Europe, while potentially underutilised wood, according to what was defined in 2.1, was observed in South-East Europe (67.0%) and South-West Europe (38.4%). In some countries, such as the Czech Republic, Germany, and Norway, an undersupply of softwoods was identified, while an oversupply of hardwoods was identified in Germany.6 However, the lack of information on NAI by wood species does not allow to analyse the utilisation rates by species at the European level, and should be analysed at the national scale from the national forest inventories.
Regarding uses, calculations using Eq. 1 from the FAOSTAT database show that only 37% of harvested roundwood in 2024 in EU-27 + UK + NO+CH was directed to the sawmilling industry, with marked differences between softwoods (32%) and hardwoods (5%), and between countries. Data are shown in
Table 2. However, the production of sawlogs for the sawmill does not imply that they are necessarily used for construction products or destined for domestic markets. According to recently published data,36 around 54 Mm3 SWE in EU-27 in 2021 was sawnwood used by the construction sector, representing 9% of the total harvested roundwood.
Table 2. Production according to data from FAOSTAT in 2024 (Mm
3).
| EU-27 + NO+CH + UK | Ireland |
Spain |
|---|
| Roundwood | 538 | 3.89 | 18.8 |
| Sawlogs and veneer logs, coniferous | 189 | 2.52 | 5.41 |
| Sawlogs and veneer logs, non-coniferous
| 25 | 0 | 0.52 |
An annual growth rate of 1.8% in sawn softwood production until 2030 was projected by Leskinen et al.,37 exceeding the approximately 1% annual increase observed by Kies et al.38 between 1995 and 2023. The current production capacity of EWP in Europe, mostly GLT and CLT, is estimated at 7.4 billion m3, reinforcing the expectation of increasing wood demand for structural applications. Approximately 90% of EWP manufacturers are concentrated in Central Europe, mostly focused on softwoods.5 Considering that the construction sector relies on a few softwood species, particularly spruce,39 a larger imbalance between wood supply and demand will likely be observed in the near future, reinforcing the need to diversify the forest resource base used for structural applications. As the first step for using wood in structural applications is strength grading, the following sections address a detailed analysis of strength graded timber species across Europe and identify some research needs for standards updating.
3.2 Strength-graded timber species in Europe
Data collected on strength-graded timber species in Europe, together with their geographical distribution, were compiled into matrices for both visual and machine grading (
Figure 3) with the aim of enabling comparison across timber species, countries, and grading methods. Other tree species found in European forests, but which are not available in EN 1912 or strength-graded according to EN 14081–2 and approved by CEN, are not represented in Figure 3.
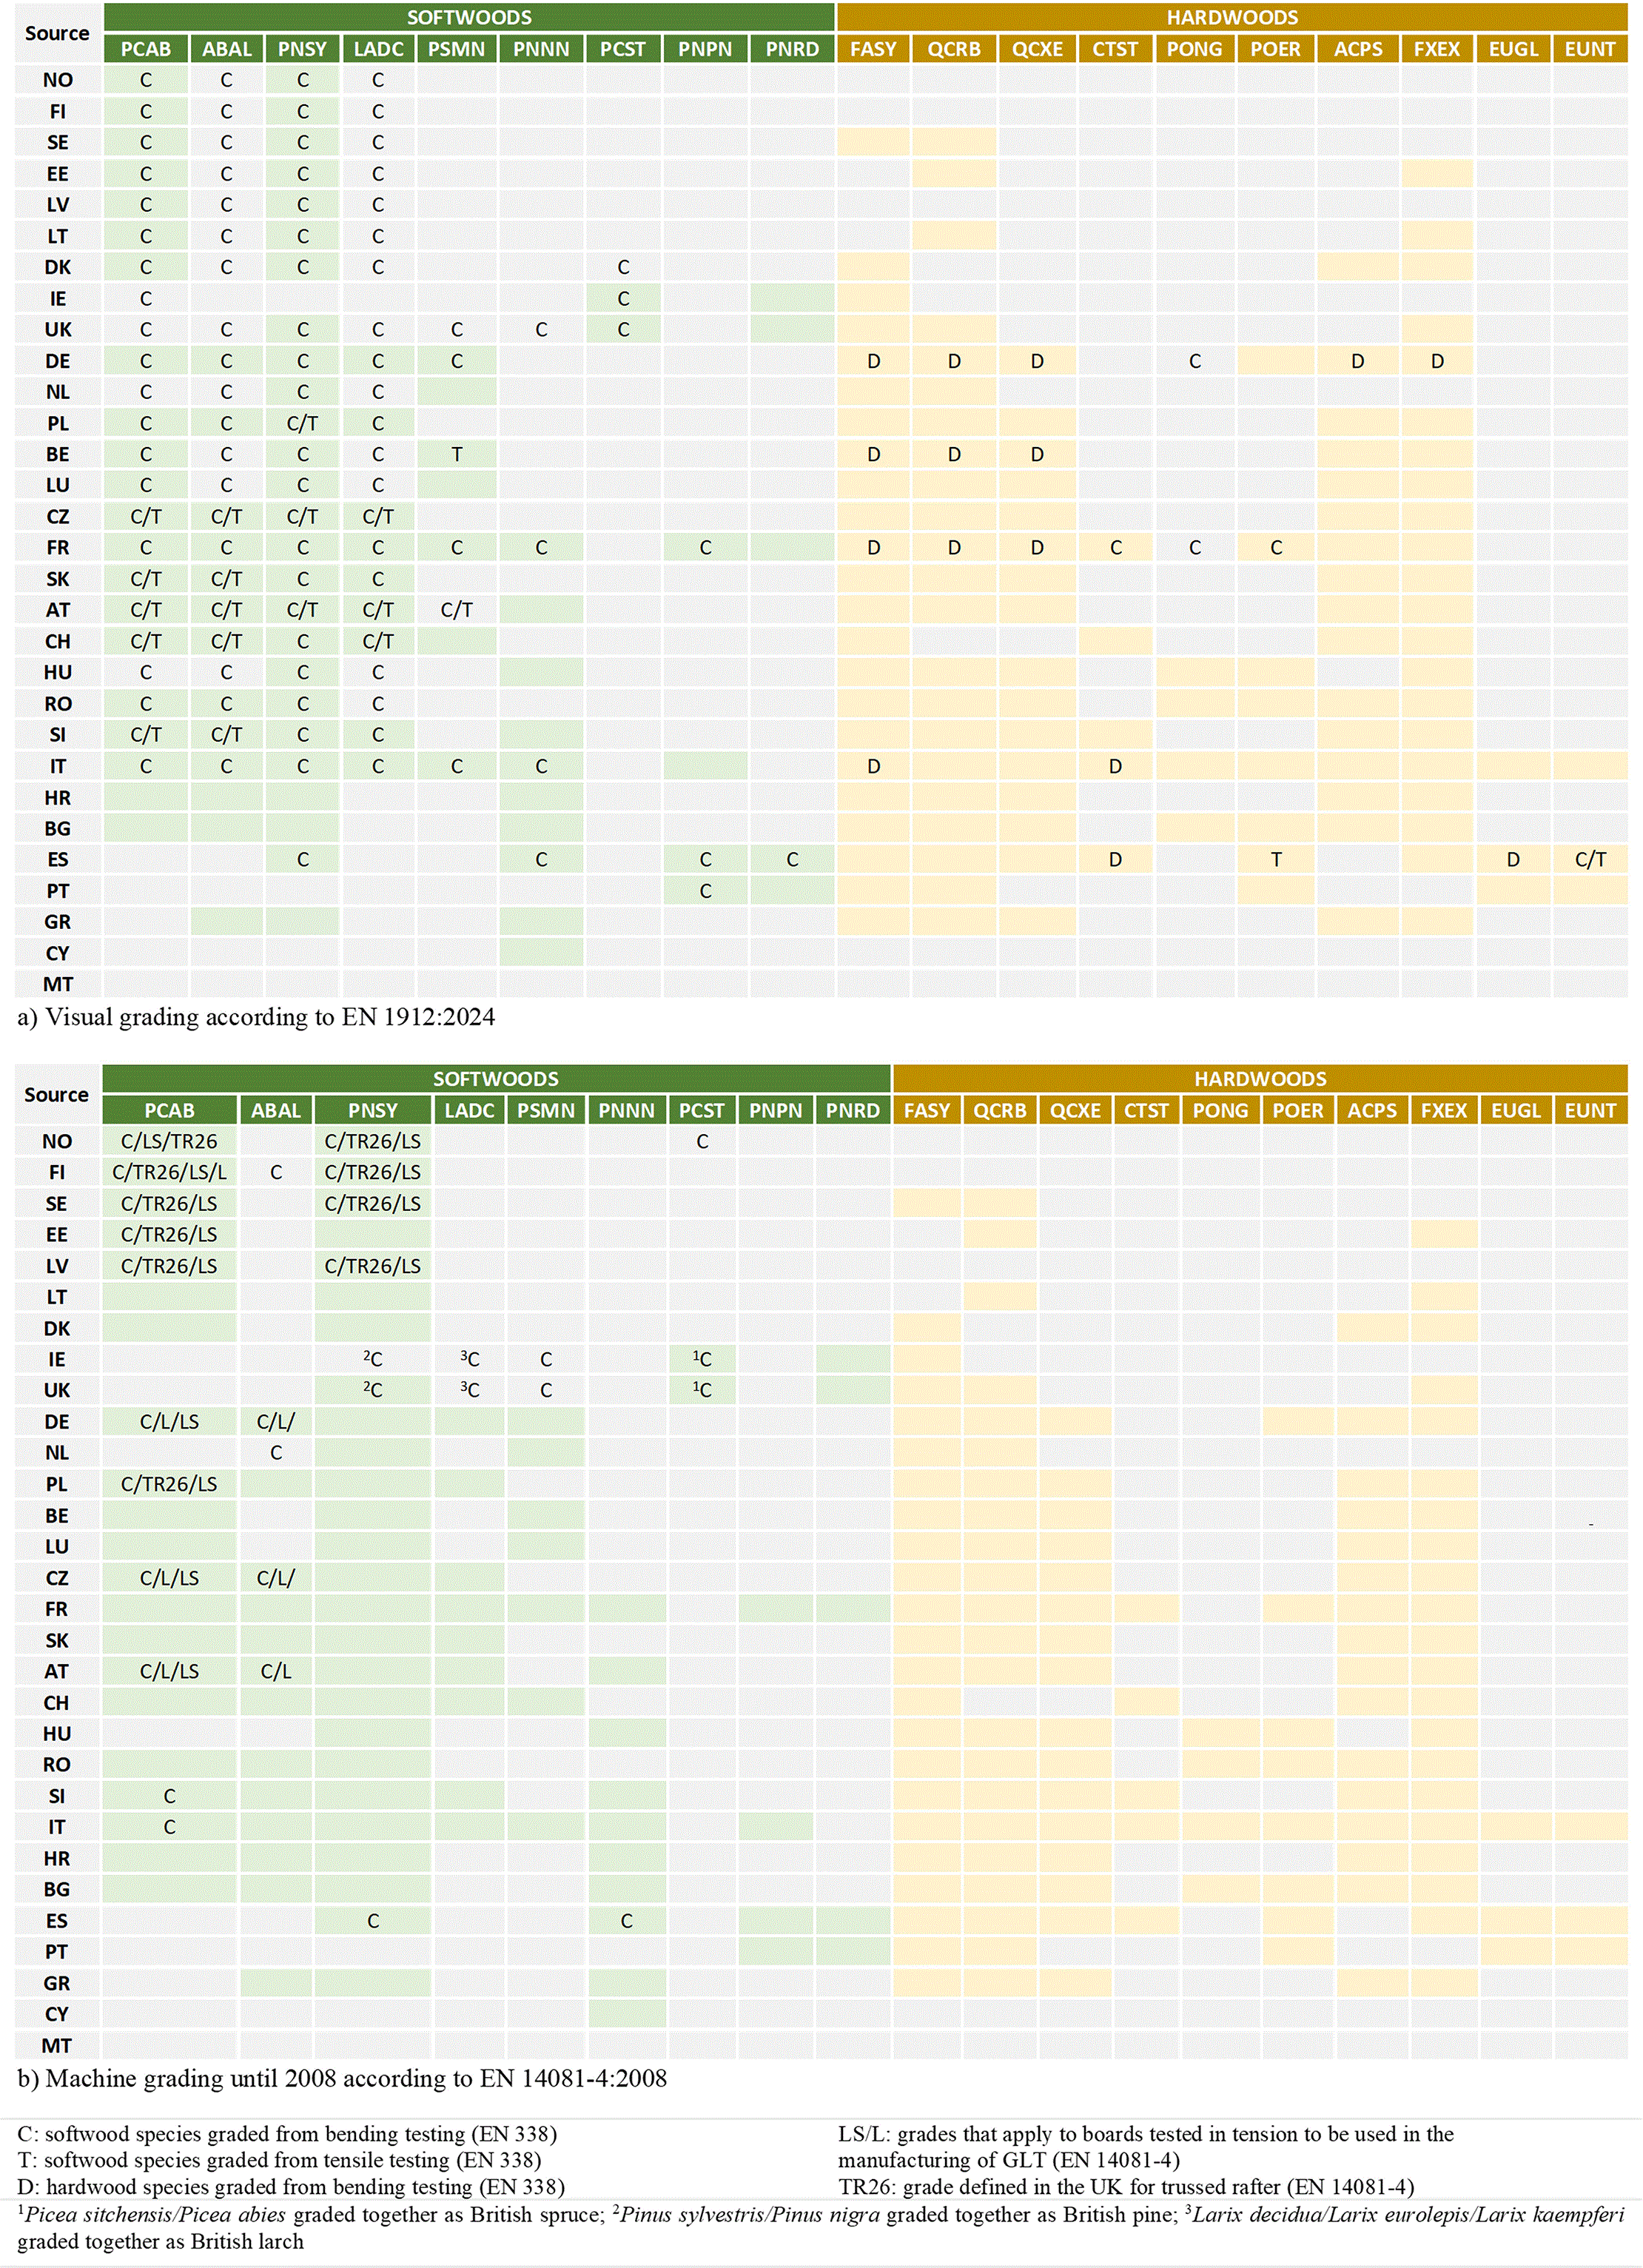
Figure 3. Strength-graded timber species by forest distribution in European countries.
3.2.1 Visually graded timber species in relation to their forest distribution
Figure 3a shows the matrix of visually graded timber species included in the standard EN 191220 in relation to their forest distribution. Shaded cells show the tree species available by country, and letters show those that are strength graded.
Strength-graded timber species are limited to only a small fraction of European tree species, comprising five out of nine coniferous genera and seven out of twenty-nine broadleaf genera. Four softwood species (spruce, silver fir, Scots pine, and European larch) dominate strength-graded timber in most European countries. Only a few countries, mainly in Southern Europe, contain forest species that are not currently strength-graded (green cells without a letter).
Most softwood species are assigned to strength classes C, ranging from C14 to C35, depending on the species and origin. In addition, several countries, particularly in Central Europe, have developed strength classes based on tension testing (T strength classes) to establish more efficient grading systems for the manufacturing of EWP, such as glulam or I-joists. Although bending- and tensile-based strength classes are similar, they differ in the property of bending strength. T-strength classes provide enhanced grading yield and performance in EWPs where tensile capacity governs the ultimate failure.40 The greater use of tensile-based grading in Central Europe confirms the implementation of more advanced timber grading systems in this region.
Hardwood species are only strength-graded in a few European countries despite the presence of beech, oak spp., maple, and ash in most of them. Even though birch represents 5.3% of growing stock in European forests (Forest Europe, 2026), and some researchers have started the pre-standardisation work or have identified the grading indicators relevant to future strength grading procedures in some countries,41,42 it is not yet included in national or European standards. This shows a mismatch between the geographical distribution of tree species and their strength grading. Regarding the strength classes, most hardwoods are strength-graded in D classes. However, some of them are graded as C classes, which are typical for softwoods, such as the case of Populus ssp. in France and Germany, or sweet chestnut in France. The low density of these hardwood species implies a higher yield when assigning a strength class C.
It can also be observed that some species have a strength class assigned in the matrix despite not being naturally present in the forests of certain countries, as is the case for silver fir or European larch. This occurs because wood species are usually grouped to establish common strength classes among countries with similar forest growing conditions and forest management practices, thereby improving the efficiency of the strength grading system in terms of both time and cost. For example, spruce and silver fir are graded together in CNE; therefore, their strength classes could be used in all countries for that region. Grouping species with similar geographical origins and comparable physical and mechanical properties is a common strategy to simplify timber grading, as previously identified by Ridley-Ellis et al.43
3.2.2 Machine-graded timber species until 2008 in relation to their forest distribution
Following the same methodology as for visual grading, the matrix of machine strength-graded timber species until 2008 in relation to their forest distribution is shown in Figure 3b. Data were collected from the standard EN 14081–4.29
Until that date, machine-graded timber was limited to a small number of softwood species from a few countries. No hardwood species had been graded yet at that time. The strength classes defined were mainly C classes, from C16 to C40, depending on the species and origin. However, some Northern and Central European countries had already defined specific strength classes for timber tested in tension. L and LS classes were assigned to sawnwood used for glulam production, at a moment when T strength classes had not yet been defined in EN 338.16
Since 2008, machine timber grading in Europe has advanced rapidly, with the continuous introduction of new machines, updates of standards, and the regular addition of new strength classes.18 However, information on species and strength classes remains private for CEN/TC124/WG2/TG1. Ireland and Spain were analysed as case studies of the evolution of machine grading within the EU.
3.3 Analysis of trends in visual strength grading
The evolution of visual strength grading across European countries was reconstructed in a timeline based on data extracted from EN 1912. It is presented in
Figure 4 to facilitate the analysis of historical developments and standardisation trends. Two main periods are identified. The first period corresponds to the “old” grading system as defined in EN 1912,20 and extends until 1987. No grading reports were collected within European standardisation committees during this period, limiting the traceability of the technical basis supporting grade assignments. The second period, from 1987 onwards, is characterised by the systematic compilation, review, and approval of national grading reports within CEN/TC124/WG2/TG1, supporting a consistent validation of timber strength-grading across Europe.
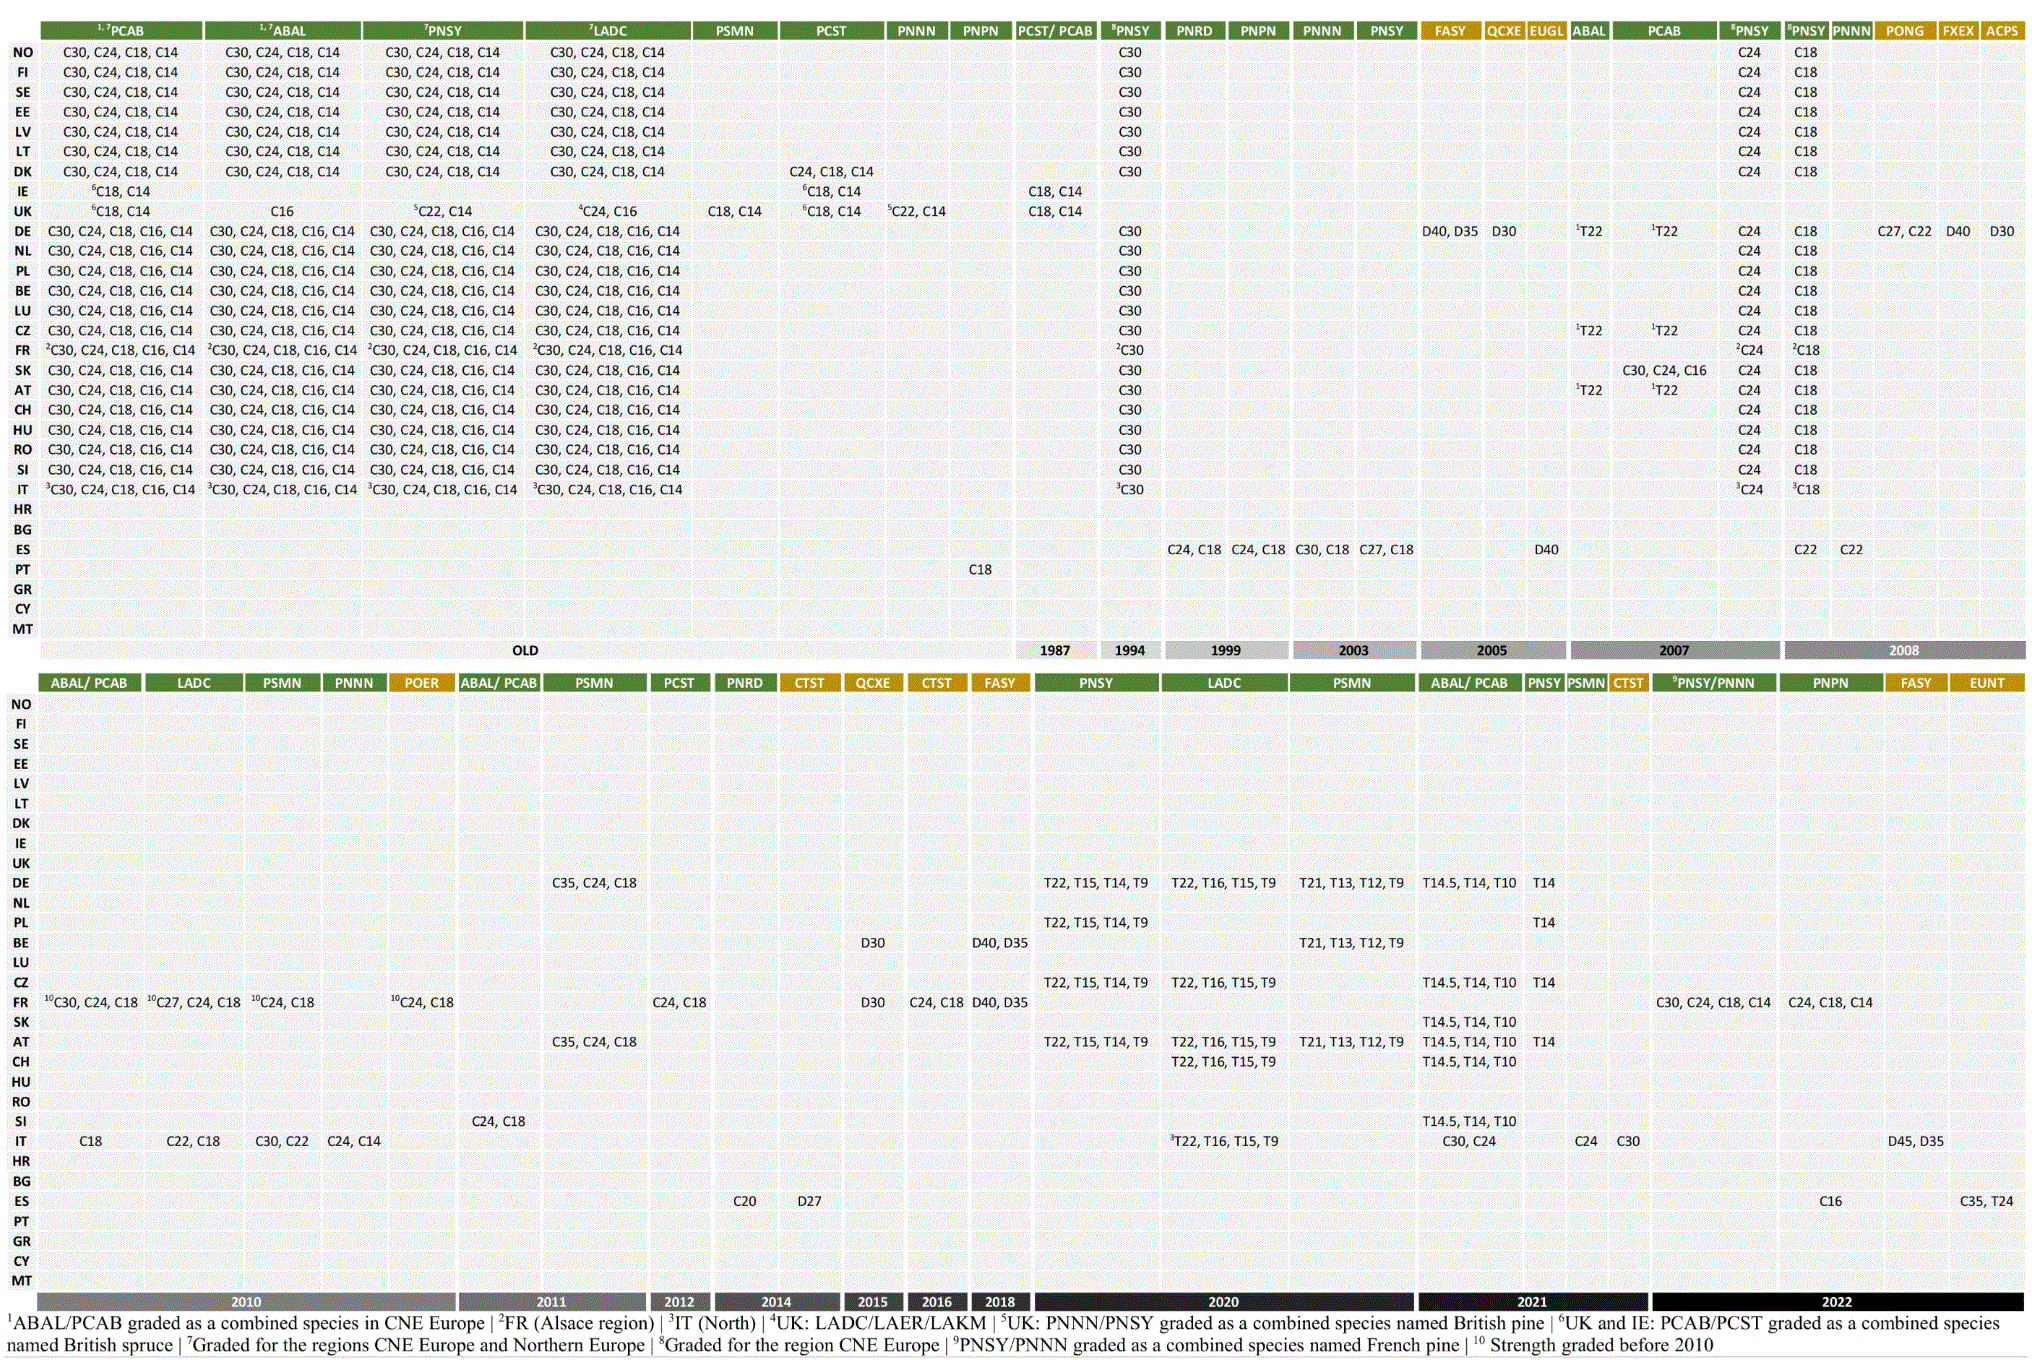
Figure 4. Trends in the assignment of strength classes from visual grading in Europe.
The timeline shows that the four dominant softwood species in Central and Northern Europe (Norway spruce, silver fir, Scots pine, and European larch) were already strength-graded under the old system before 1987. Furthermore, several wood species graded under the old system have not been revised or updated since then. Given the potential for changes in both forest management practices and climatic conditions affecting tree growth since then, it is feasible that the mechanical properties of these timber resources may also have changed. Consequently, current visual grades and assigned strength classes may not fully represent the properties of current forest resources.
Two major milestones were reached in 2005 and 2007 with the first strength grading of hardwood species and the first assignment of T strength classes, respectively. However, the predominant grading into T classes is still very recent. Five timber species from ten countries graded in T classes have been added to EN 1912 since 2020. Although T classes were defined in 2007, they were not incorporated into the standard that provides the physical and mechanical properties for the strength classes (EN 338) until 2016.16 This delay in updating and publishing technical standards limits the timely accessibility of relevant information to structural timber designers.
3.4 Analysis of trends in strength grading in relation to forest resources and wood production in Ireland and Spain
3.4.1 Case study of Ireland
In 2020, forest cover in Ireland was 11.4%, substantially lower than the EU-27 average of 38.3%, making Ireland one of the least forested countries in Europe. Nevertheless, Ireland has had the highest rate of forest expansion of the EU member states since 1990. Its forest estate is dominated by conifer species, which represent 69.4% of the stocked forest area, while broadleaved species account for 30.6%.44 Despite this predominance of conifers, the share of broadleaved species in the national forest estate increased by 5.9% between 2006 and 2022, indicating a gradual diversification of the forest resource.
The growing stock remains highly concentrated in a small number of commercial coniferous species. Sitka spruce, an introduced species, accounted for 60.2% of the total growing stock volume in 2022, followed by lodgepole pine (Pinus contorta) at 7.91%, Norway spruce at 4.22%, Japanese larch (Larix kaempferi) at 3.67%, and European ash at 3.10%. The remaining growing stock is distributed across other species, primarily hardwoods, each contributing between 0.3% and 2% of the total volume. Total roundwood removals in 2024 amounted to almost 4 Mm3. According to data published in the FAOSTAT database,45 65% of domestic roundwood in Ireland was sawlogs for the sawmill industry, 100% softwoods. Sitka spruce accounted for 78.6% of the share of the mean annual felling volume, followed by other pines at 6.8%, and Norway spruce comprising 5.3%,44 confirming the dependence of the wood sector on a few softwood species.
The predominance of Sitka spruce is also reflected in the development of timber strength grading in Ireland. Sitka and Norway spruce had already been visually graded according to the old grading system (Figure 4), which highlights the relevance of these species in the construction sector. In 1987, visual grades SS and GS were defined for these species according to the visual grading standard IS 127,46 which were assigned to the strength classes C18 and C14 in EN 1912, respectively. However, no further updates in the visual strength grading for these species have been incorporated into EN 1912 since then.
Ireland was also an early adopter of machine strength grading, benefiting from long-standing collaboration with the United Kingdom. The two countries have traditionally been treated as a common grading region because their timber resources develop under comparable growing and silvicultural conditions and because of the close integration of their timber markets. The first grading system implemented in commercial timber dates to 2001, when bending test-type machines were the predominant machine-grading technology used in Europe. Wood species, grading machines, and strength classes in Ireland are highlighted in orange colour in
Figure 5, which was developed from data compiled by Ridley-Ellis et al.18,30 from reports approved by CEN/TC124/WG2/TG1. Confidential data regarding the settings to be implemented in the grading machines are not shown in the figure.
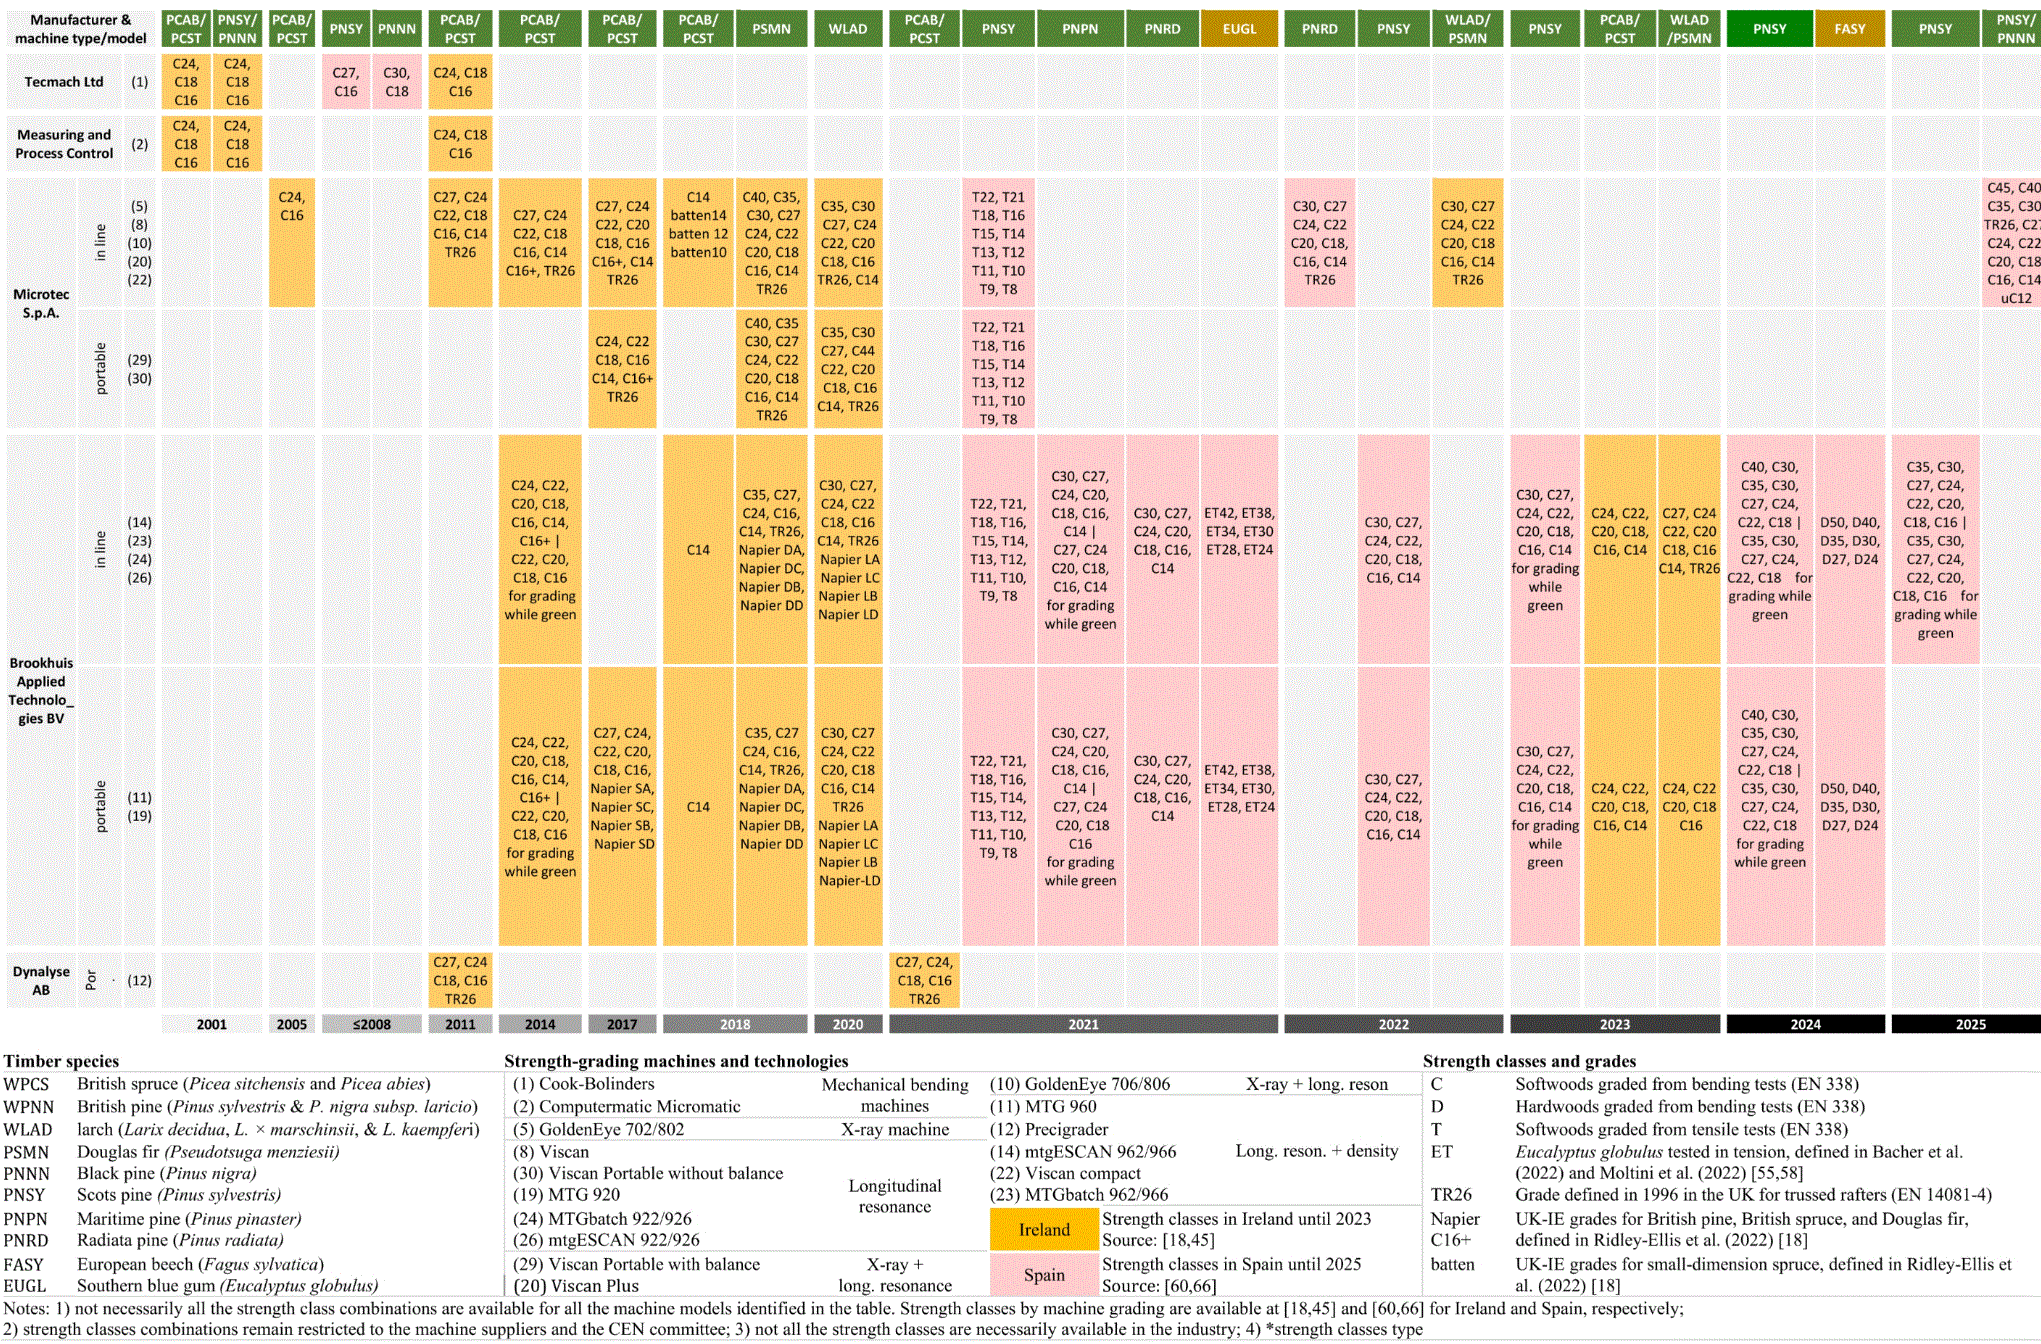
Figure 5. Trends in the assignment of strength classes from machine grading in Ireland and Spain by grading machine and timber species.
Although these bending machines are still used for strength grading, they have largely been replaced in industrial practice by more advanced systems that offer faster processing speed and improved grading yields. 2005 marked a new era in the use of more advanced grading machines in Ireland, which has continuously updated its timber strength grading framework by introducing new strength classes, additional softwood species, such as Douglas fir and Larix spp., and new grading machines, as shown in Figure 5. Nowadays, three of the five main commercial species in the country are strength graded for structural applications.
To be more efficient in strength grading, Ireland and the UK defined proper strength classes, such as Napier and batten classes, reducing dependence on the fixed strength classes defined in EN 338.16 For example, the UK grade Napier SA (fm,k = 25 N/mm2, E0,m = 11000 N/mm2; ρk = 375 kg/m3) provides slightly higher properties than the strength class C24 (fm,k = 24 N/mm2, E0,m = 11000 N/mm2; ρk = 350 kg/m3), which is the most common strength class used for timber structures in Europe. This enables engineers to design structures more efficiently in accordance with the accurate properties of the timber species. In parallel, they maintained the traditional TR26 grade, which was used by the trussed rafter industry and provided the values for designing timber structures according to the old design codes.
Despite the high industrial dependence on a few wood species, a comparison of harvest volumes with net annual increment indicates that most Irish tree species are harvested well below their annual increment. Since national inventories provide the gross annual increment by wood species, NAI was estimated as the normalised net annual increment per hectare multiplied by that species’ representative area. Douglas fir is the only species approaching a high utilisation rate, with a utilisation rate of 88%. By contrast, the dominant species, Sitka spruce, is harvested at 46% of annual increment, while Norway spruce and other pine species (excluding Scots pine) show similar utilisation rates of 46% and 44%, respectively. Sitka spruce is therefore not fully mobilised relative to annual increment. Utilisation rate is even lower for larch, Scots pine and broadleaved species, many of which are harvested at less than one-fifth of their annual increment. Oak, ash, sycamore, birch and alder show particularly low utilisation rates, ranging from 7% to 16%. Therefore, underutilisation occurs across the Irish forest estate, particularly for hardwoods that remain outside the structural grading system.
3.4.2 Case study of Spain
In 2023, forests covered 56% of Spain’s total land area, exceeding the EU-27 average.47 Broadleaved species accounted for 54% of the stocked forest area, coniferous species for 36%, and the remainder consisted of mixed forests. In comparison with Ireland, Spanish forests are more diverse in terms of tree species. Scots pine and maritime pine accounted for 15% and 14%, respectively, of the total growing stock volume in 2023, followed by Aleppo pine (Pinus halepensis) and black pine, holly oak (Quercus ilex), beech and Southern blue gum at 7%, Pyrenean oak (Quercus pyrenaica) and radiata pine at 57%, pedunculate and sessile oak at 4%, sweet chestnut at 3%, Mediterranean stone pine (Pinus pinea) at 2% and others at 16%. The Spanish total NAI in 2024 was 47.5 Mm3/year, but information on NAI by species is not available.48
Total roundwood removals in 2023 amounted to around 17 Mm3, of which 54% were softwoods and 46% hardwoods. Most of the total removals were Eucalyptus ssp. (40%) mainly used for pulp production, followed by radiata pine (19%), maritime pine (17%), Scots pine (9%), black pine (3%), Aleppo pine (2%), Populus spp.,
(2%), and the rest corresponded to other species.47 According to data from the FAOSTAT database,45 31% of the roundwood harvested in Spain in 2024 was sawlogs for the sawmill industry. The production of sawn softwoods in 2023 was 2.5 Mm3, while sawn hardwoods were only 0.3 Mm3.47
The historical development of timber strength grading in Spain reflects the predominance of four coniferous species in national roundwood production. As shown in Figure 4, the first species incorporated into EN 1912 were radiata and maritime pines in 1999, followed by black and Scots pines in 2003. These pines were visually graded according to UNE 5654449 into the visual grades ME-1 and ME-2, which were assigned to the corresponding strength classes shown in Figure 5. The first hardwood species included in EN 1912 was Southern blue gum in 2005. This species was visually graded as MEF according to the national standard UNE 56546,50 and assigned to the strength class D40, highlighting its high mechanical performance and the relevant potential for structural applications. Since then, new softwood and hardwood species have been visually graded, and some updates concerning the visual strength grading of Spanish softwoods have been incorporated into EN 1912 since then. The main goal was to determine the structural properties of large-cross-section timber elements used in traditional Spanish construction.
In contrast to Ireland, Spain was not an early adopter of modern machine strength grading technologies. Although Scots and black pine had previously been strength-graded using the bending-type machine, implementation of the new generation of machine grading systems for Spanish species started in 2021. Strength classes derived from machine grading in Spain are defined for Scots pine, maritime pine, radiata pine, Southern blue gum, and beech. Wood species, grading machines, and strength classes are highlighted in pink in Figure 5. This is the first study compiling machine-graded timber species in Spain. Data were obtained from the technical reports approved by CEN and collected in the datasets,31,32 maintaining the confidentiality of commercially sensitive information related to settings to be implemented into the grading machines.
Despite the recent implementation of machine grading, Spain and Portugal became the first countries to achieve approval by CEN/TC124/WG2/TG1 of strength classes for hardwood species based on tensile testing. Relevant research works have focused on developing strength grading systems derived from tensile testing for hardwood species,51–53 as strength classes are not yet included in EN 338.16 These studies have highlighted the complexity of establishing a unified grading system for hardwoods, as in the case of softwoods, mainly due to their heterogeneity in physical and mechanical properties. Furthermore, the equations for deriving secondary mechanical and physical properties from the main characteristic ones are not yet defined and, therefore, they are not available in EN 384.54 The approval in 2022 of the ET strength classes for Southern blue gum from Spain and Portugal was the first CEN approval of tensile-based machine grading for a hardwood species. The ET strength class combinations are shown in Figure 5, while the associated physical and mechanical properties for every strength class are available in Martins et al. (2022).55 However, only the three main characteristic properties (f
t,0,k,
E
t,0, and ρk) were formally defined. Consequently, further research is still required to determine or derive the remaining mechanical properties.
The development of machine strength grading in Spain was initially driven by research institutions rather than by industry. Several research projects aimed at improving grading methodologies and facilitating their transfer to industrial practice were developed to promote resource-efficient timber construction using local wood species.22,55 The successful outcomes of these projects led to the implementation of machine grading systems in the Spanish industry, both in large companies operating in-line grading machines in the production facilities, and in small and medium-sized enterprises using portable grading devices.
A comparison between harvest volumes and annual increment indicates that the Spanish forest resource is harvested below its annual growth. However, utilisation rates differ among wood species, but the current national statistics do not provide annual increment by species. Harvesting is strongly concentrated on radiata and maritime pine among softwoods and on Eucalyptus spp. among hardwoods. Underutilisation of the Spanish forest resource is therefore mainly associated with species that currently have a limited role in industrial applications, particularly hardwoods other than Eucalyptus
spp.
3.5 Identification of research needs in timber strength grading and standardisation
The EUFORE Strategic Research and Innovation Agenda (SRIA)56,57 identifies several priorities relevant to timber grading, including improved characterisation of timber quality, further development of standards and characterisation methods, new products incorporating both commercial and underutilised timber species, and a better understanding of how changes in European wood supply and management interact with climate change and global markets.
Ridley-Ellis et al.21 identified several limitations in the European grading framework, particularly its geographical and species coverage, its ability to reflect the current properties and intended uses of timber resources, and its capacity to accommodate emerging grading technologies. Almost a decade later, the present analysis shows that progress has been made in several of these areas. Some grading standards have been updated, new species graded, and new countries have assigned strength classes to their wood species, as shown in the previous sections of this paper. Despite this progress, the analysis presented in this paper identifies several remaining limitations in the current grading framework and research needs.
1) Expanding and updating European strength grading standards. Several timber species currently included in EN 1912 were graded decades ago, and their assigned strength classes may no longer fully reflect the effect of climate change, different silvicultural practices, and forest resource characteristics.
2) Further research is required to develop tensile-based grading systems for both softwoods and hardwoods, particularly focused on the manufacturing of EWP. The inclusion of tensile strength classes for hardwood species in EN 338 and the equations for deriving secondary mechanical properties in EN 384 remain important pending tasks.
3) Research for diversifying the range of wood species available for structural applications. Underutilised hardwoods and fast-growing species represent a potential additional resource for timber construction, but their incorporation into structural markets requires extensive testing campaigns, industrial validation, and certification procedures, which require technical expertise, testing capacity, and financial investment.
To contextualise the research efforts in terms of time and costs, the number of tests can offer a first approach. Although around 200 tested specimens may be enough for research-based estimations of timber properties, commercial implementation of timber strength grading requires large datasets, usually between 500 and 1500 specimens tested, from more than four origin sites, and a range of sizes that is representative of actual production. Less common wood species generally require more data.
Machine grading has changed since EN 14081–4 was withdrawn. However, the corresponding information on machine-graded timber species and assigned strength classes is no longer publicly available in EN standards, but it remains confidential within CEN/TC124/WG2/TG1 and the suppliers of grading machines. Establishing a regularly updated European source for this information would help researchers identify existing timber grading efforts and avoid duplicating previous work, as well as assist designers of timber structures in efficient use of the resources. The digitalisation of the information contained in the Approved Grading Reports (AGR) would be essential to ensure continuous updating and accessibility of grading data, while maintaining the confidentiality of the settings to be implemented in the grading machines.
4. Conclusions
This study shows a discrepancy between the diversity of European forest resources and the limited range of timber species currently strength-graded for use in construction, which are mainly concentrated on a few softwood species from Central and Northern Europe.
Regarding grading systems, visual methodologies remain valid and implemented across European industries. However, machine grading has become increasingly important, particularly in large sawmills and EWP manufacturers, due to its higher grading accuracy and improved yield. Portable equipment developed by some manufacturers provides a more economical alternative to in-line machine grading systems, making machine grading more accessible to SMEs.
The case studies of Ireland and Spain show the continued development of machine strength grading while highlighting the lack of publicly available information on current graded species and their properties following the withdrawal of EN 14081–4, as well as the continued focus on softwood species. Despite differences in forest resources and grading development, both case studies identify opportunities for the structural use of underutilised wood species. Grading approaches adapted to local resources, including the grouping of species and countries, wood strength grading while green, and the development of strength classes outside those defined in EN 338, are some of the strategies applied in these countries to improve the use of available timber resources and increase grading efficiency.
The identified research and standardisation needs include updating existing grading assignments where the characteristics of forest resources may have changed, extending strength grading to currently underutilised wood species according to their geographical distribution and availability, developing strength grading systems for reused timber, and providing access to information on machine-graded timber species and grading systems already approved by the European Committee for Standardisation, as the case for visual grading. Addressing these needs could contribute to resource efficiency and a better alignment between available forest resources, timber production, strength grading and structural design practices.
Ethics and consent
Ethical approval and consent were not required.
Use of AI
ChatGPT (OpenAI, GPT-5.5) was used exclusively to support language editing and improve the clarity and readability of the manuscript. The tool was not used to generate, analyse, or interpret data, nor to create figures, tables, results, or scientific conclusions. All scientific content, analyses, and final decisions remain the responsibility of the authors.







