Sandspit long-term transformation
Evidence of changes in the shape of the case study sandspit is documented through historical cartography. Records dating back to 1634 were collected from a variety of sources. However, only those produced from 1789 onwards can be rigorously compared, as they share the same projection system. Prior to 1855, relatively few records are available, with only ten maps covering a period of 66 years. Digital archives were consulted at the Municipal Historical Archive of Porto, the National Library of Portugal, the online catalogues of the National Library of France, the Austrian National Library, the Cartographic and Geological Institute of Catalonia, and the General Digital Library of the University of Coimbra (specifically the Nabais Conde Collection). In addition to the archive of the Hydrographic Institute of the Navy in Porto, the largest collection of unpublished material was obtained from the local port authority (APDL – Administração dos Portos do Douro, Leixões e Viana do Castelo, S.A.).
A total of 75 documents were identified and arranged chronologically (Martins, 2026a). These sources range from the earliest graphic representations of the port to city maps, topographic and bathymetric surveys, and photogrammetric and satellite imagery (Martins, 2026b). Each document was standardised to the same scale, orientation, and framing, creating a consistent basis for comparison despite the heterogeneous nature of the original sources. From these documents, 165 distinct sandspit contour positions were extracted, with each contour recorded on a separate layer identifying its original source. A contour line was then traced to approximate the boundary between sand and water. This process was carried out digitally using AutoCAD, a vector-based drawing software widely used in architectural practice.
Because the collected sources employed different map projections and representation methods, they were originally produced for a variety of purposes, ranging from navigation charts and technical surveys to political or institutional representations. Consequently, their accuracy and level of detail vary considerably. In many cases, it is not possible to determine whether a given drawing represents high or low tide. However, because the objective of this study was to reconstruct the long-term transformation of the sandspit, these limitations in the historical representations were considered acceptable.
The documents also made distinct contributions to the drawing series according to their origin and level of detail. Some, particularly those produced to support harbour engineering works, contained multiple superimposed shoreline outlines. In such cases, it was possible to distinguish successive shoreline configurations within a single source, while variations in line type and graphic conventions provided additional detail for interpreting the drawings.
The resulting dataset makes it possible to visualise the dynamics of the sandspit either as an animated sequence (Martins, 2026c) or as a chronological series arranged sequentially, similar to a comic strip (
Figure 1).
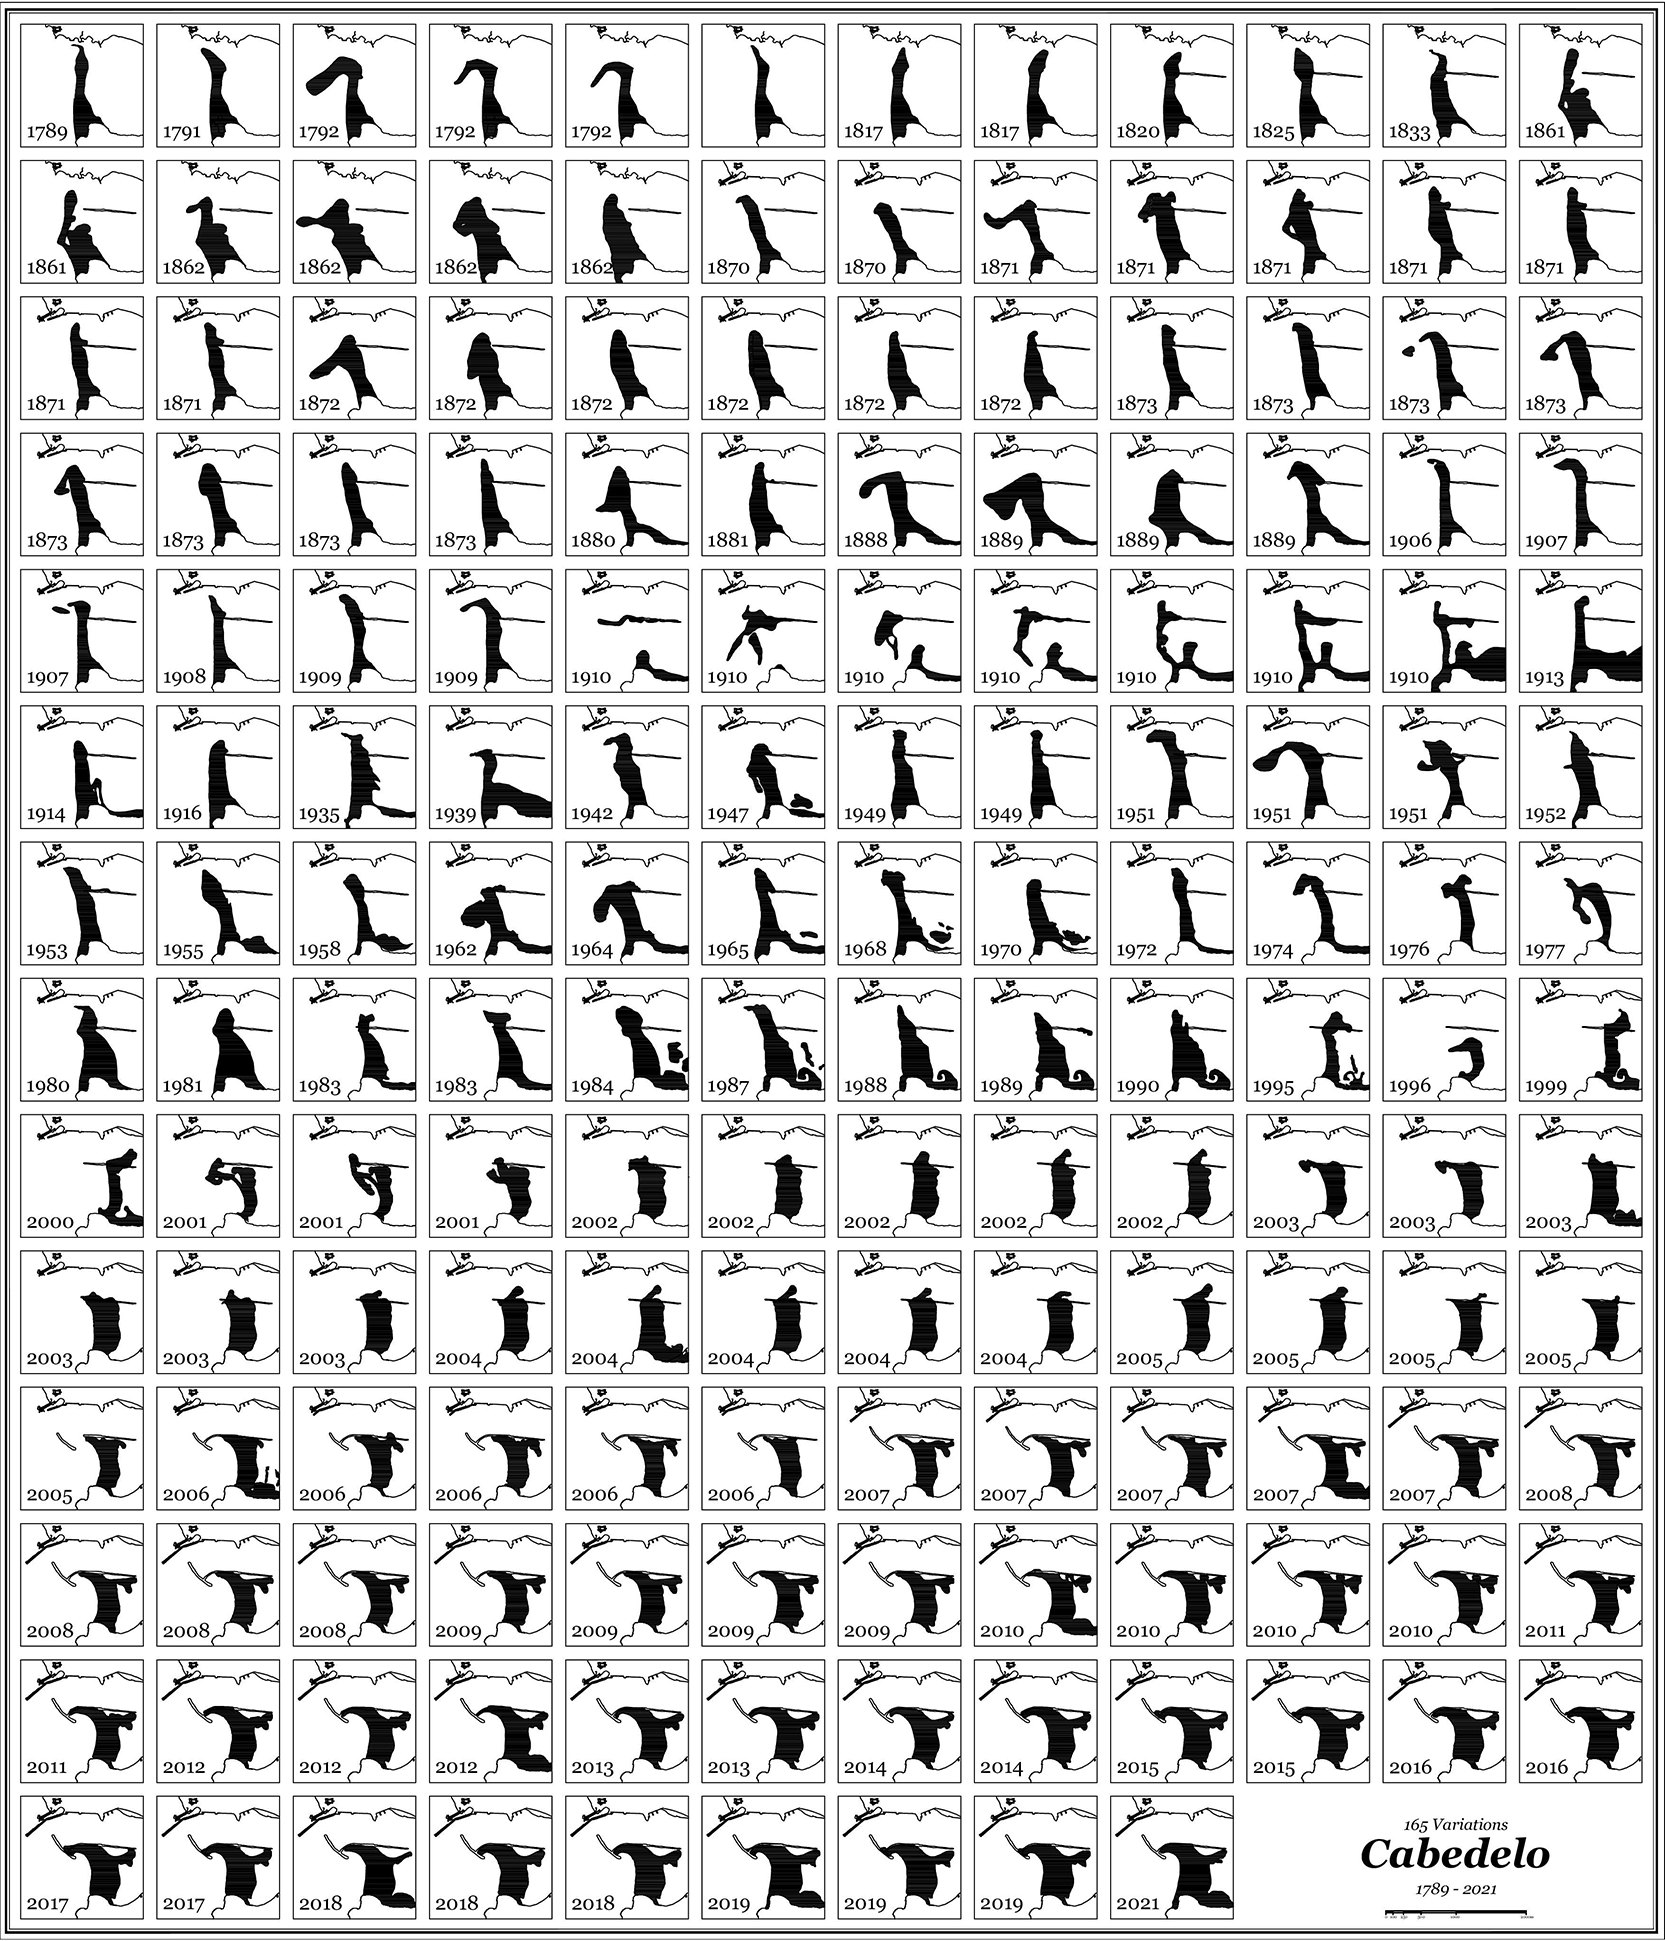
Figure 1. Chronological grid of 165 graphically standardised cartographic surveys of the Cabedelo (1789–2021), by Ivo Poças Martins, 2026.
Wave shape before 2004
As no archival documentation describes the shape of the waves, this information was gathered directly from surfers representing different generations of users of the site. Oral accounts, including filmed and transcribed interviews with three key participants, as well as informal conversations with other surfers and third-party accounts, provided an important source of information for reconstructing the site’s hydrodynamic characteristics. These testimonies included qualitative observations, such as the large quantities of material transported by the river (in the most extreme and anecdotal cases, including reports of cars, trees, and even a cow), changes in water colour (from green to muddy), the sound of sand being carried by the current, and changes in buoyancy when moving from saltwater to fresh or brackish water.
Beyond the anecdotal nature of oral histories, these accounts proved valuable in describing the routes surfers used to reach the waves, whether by paddling or with the assistance of motorised boats, and the ways in which river currents either facilitated or hindered movement. These descriptions were consistently corroborated across the different sources.
It is important to note that surfing was only introduced to Porto in the early 1980s. Before then, direct experience of these waves was largely confined to fisherfolk and sailors, whose relationship with the water differed fundamentally from the embodied experience associated with surfing.
The interviewees were selected on the basis of their shared experience of Cabedelo do Douro and their complementary expertise in surfing. One participant had surfed at Cabedelo since the early 1980s and had an outstanding competitive record, allowing the study to place local wave conditions within a broader historical context and to compare them with other internationally recognised surf breaks. A second participant was a surf photographer who had extensively documented the Cabedelo waves on film. The third was a surfer with formal training in architecture, whose expertise proved instrumental in representing wave dynamics and surfing phenomena through rigorous cartographic conventions.
The interviewees also provided access to a broader archive of personal, previously unpublished photographs and videos (
Figure 2). These visual materials offered a retrospective record of the wave forms and, through detailed analysis, provided sufficient references to represent moving water as a stable architectural element. The scale of a surfer riding a wave offers a tangible reference for estimating wave dimensions, while moving images reveal the characteristic patterns of wave breaking.
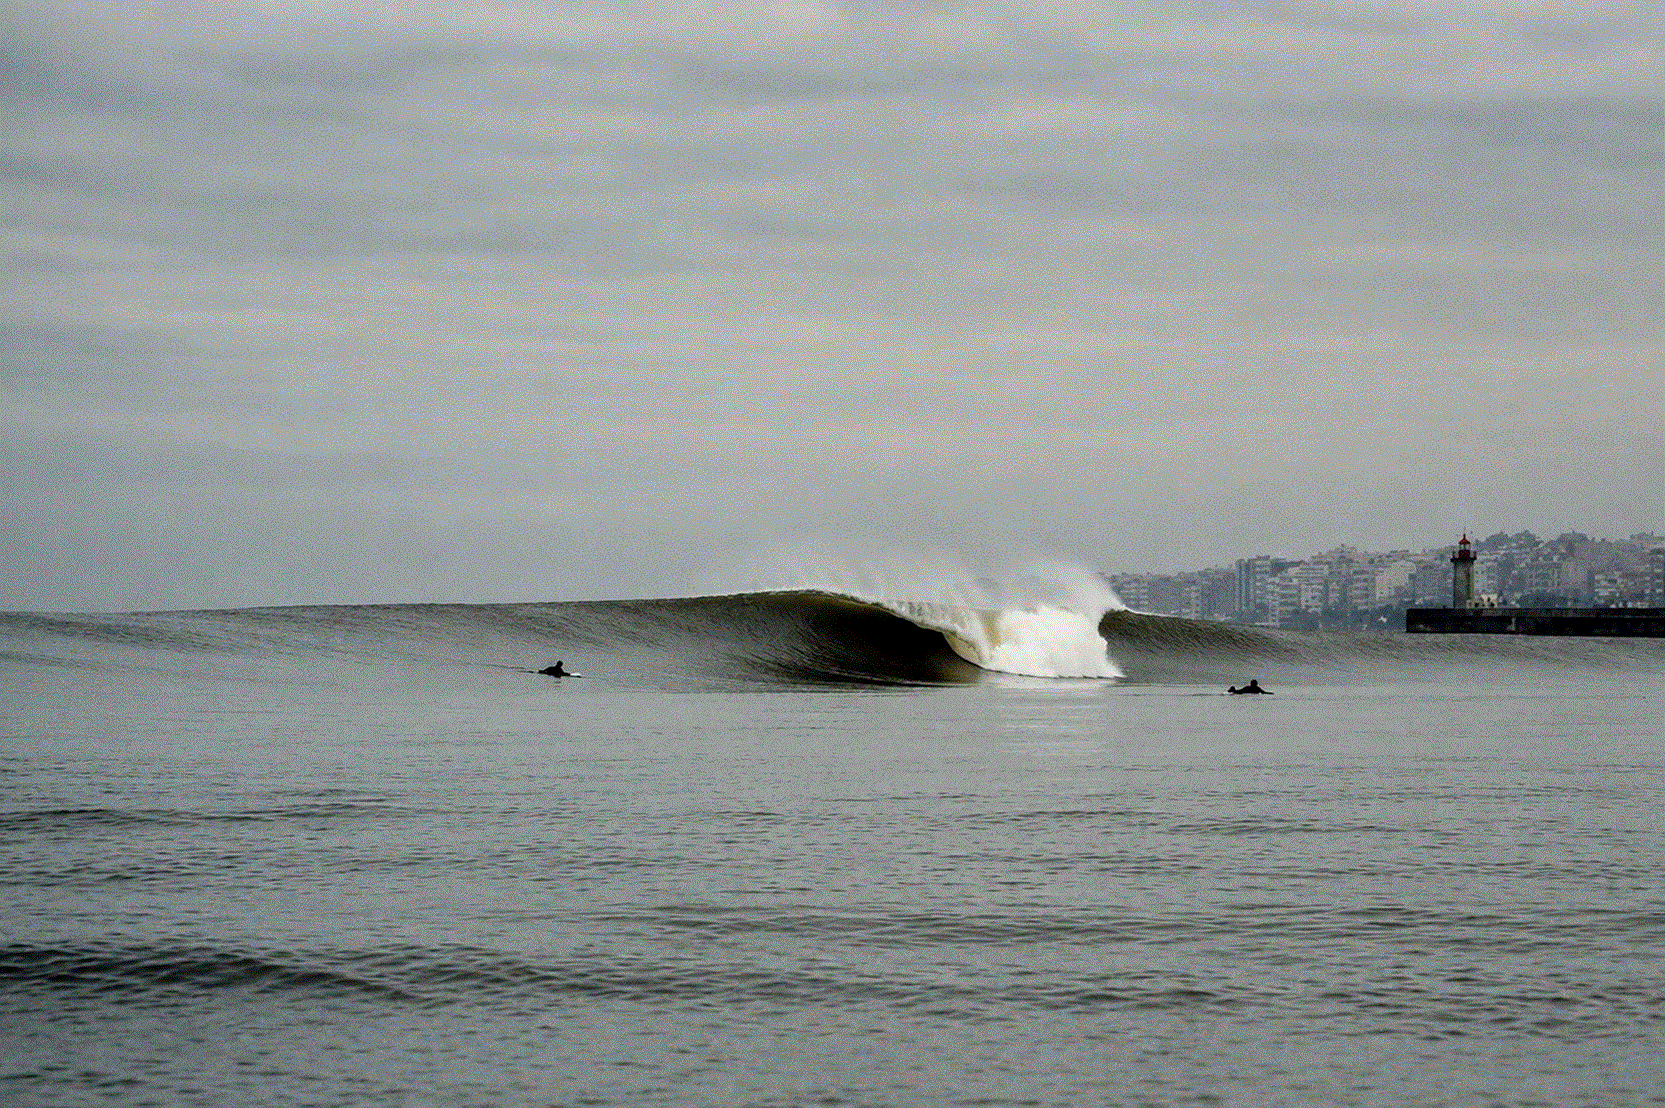
Figure 2. A-frame wave breaking offshore at the mouth of the Douro River, Porto, Portugal.
Photograph by Miguel Dolce, 1997.
The combination of oral histories and visual documentation made it possible to reconstruct the wave forms that existed during the late twentieth century, prior to the construction of the breakwaters. Together, these sources provided insights into the morphology of the waves and their evolution over time.
Designing the waves
The reconstruction of the vanished world-class surfing wave provided valuable insights into the dynamic transformation of the sandspit. Because the profile of the underwater sandbars has a significant influence on the shape of the surf break, the visual representation of the waves, combined with surfers’ situated knowledge, made it possible to reconstruct short-term changes in the morphology of the sandspit. These processes were cyclical, occurring each year during the flood season. Floods and coastal storms were the principal drivers of these transformations, which can be summarised as a five-stage sequence:
Before the Flood – Under normal conditions, the river displayed a stable configuration, with substantial sand accumulation within the navigation channel and a consistent surf break.
The Flood – Flood events were characterised by rising water levels, darkening river waters, and increasingly powerful currents. As water levels rose, the exposed sandspit became submerged while the river transported large quantities of sediment and other debris at high velocity.
Receding Waters – As water levels gradually receded, river currents remained strong and the former sandspit became a shallow submerged platform, with small sand islands and shoals occasionally emerging offshore. At this stage, tall barrelling waves began to form at the river mouth, breaking to the left (northwards). It was common for a wave to begin breaking offshore and continue into the river channel before dissipating.
A-Frame Wave – As river discharge decreased, the waves continued to break to the left but also began breaking to the right, forming what surfers describe as an “A-frame,” or triangular peak. This configuration is particularly valued because it allows rides in either direction.
After the Flood – As river discharge returned to normal, the newly formed underwater sandbar typically produced a right-breaking wave (southwards). These waves often retained their barrelling shape and considerable length, allowing for longer rides and, at times, enabling more than one surfer to ride the same wave simultaneously.
The five-stage sequence informed the production of four maps, each corresponding to a distinct wave configuration: Before the Flood, Left, A-Frame, and Right (
Figures 3–6). The maps were produced in AutoCAD following a protocol inspired by historical cartographic materials, including military fortification maps, and were prepared at a printed scale of 1:2,500. They were based on surveys from three different dates, June 2001, December 2002, and March 2003, all produced by M. Eduarda Jesus (Martins, 2026a, Sequence no. 65). Although these source materials were not originally intended to represent wave dynamics, they provided a consistent cartographic framework for visualising the information derived from the interviews and surfers’ personal archives.
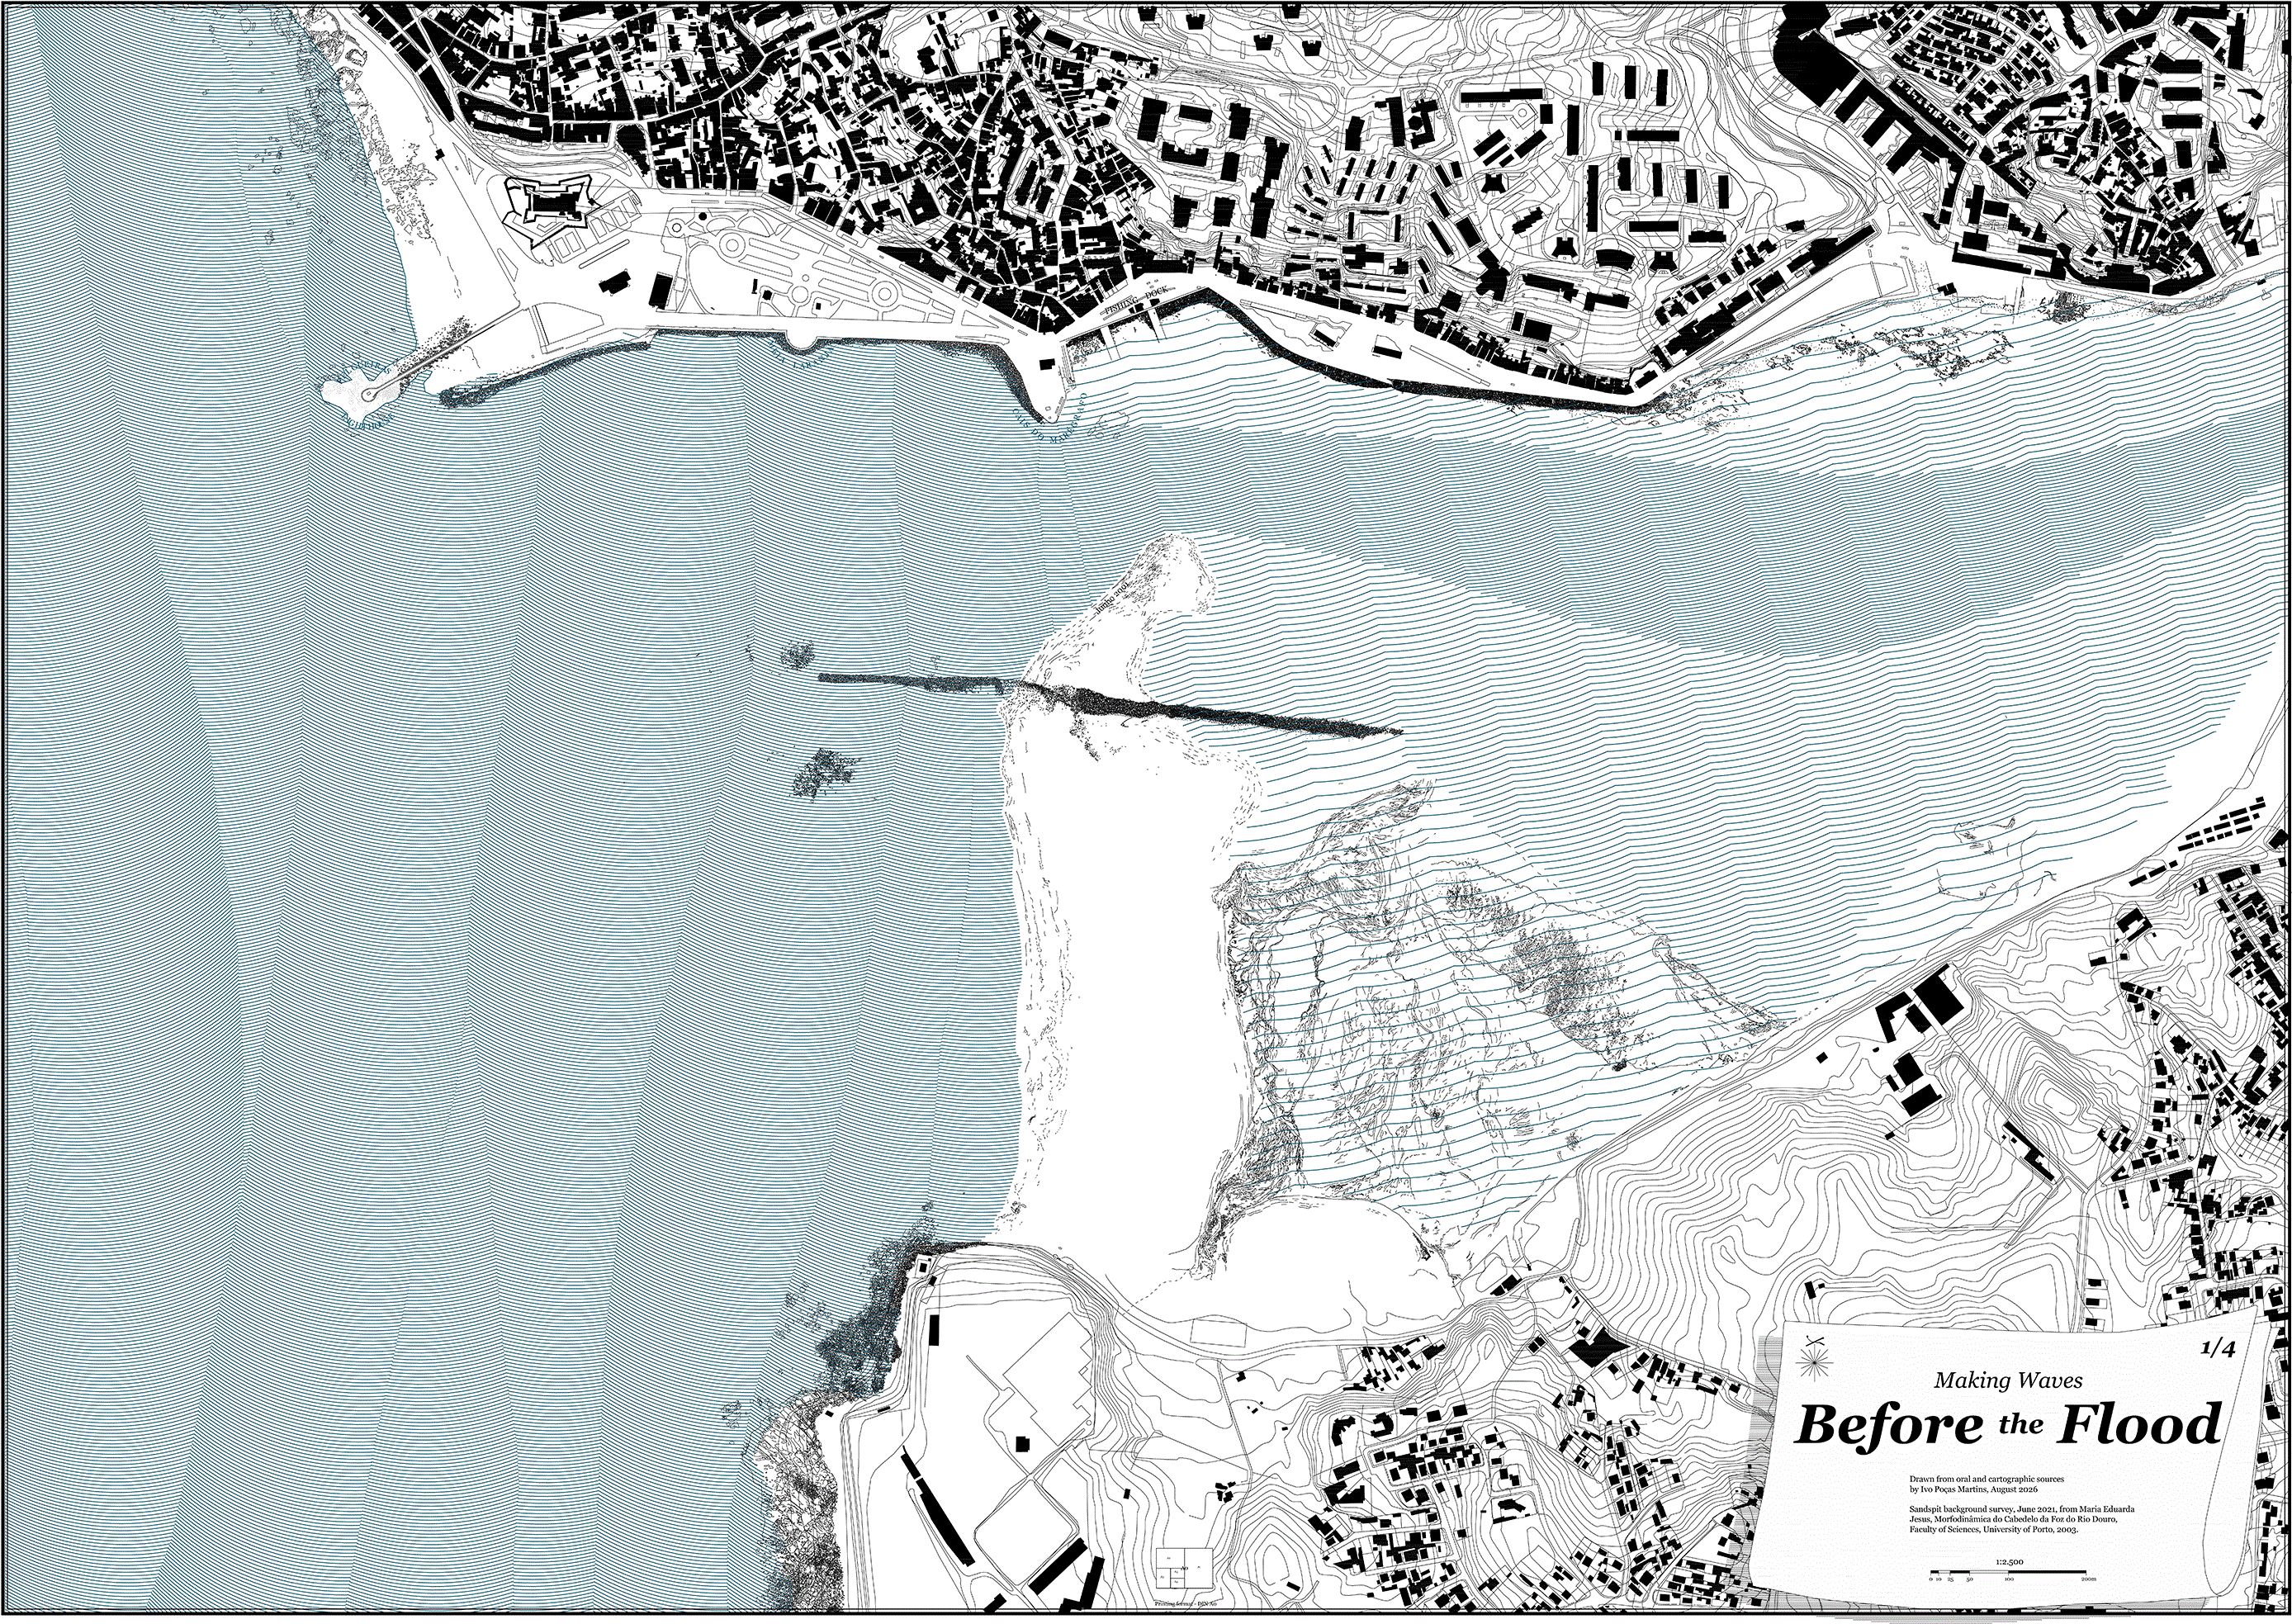
Figure 3. “Before the Flood” map, based on the June 2001 cartographic survey of the Douro sandspit (Cabedelo), by Ivo Poças Martins, 2026.
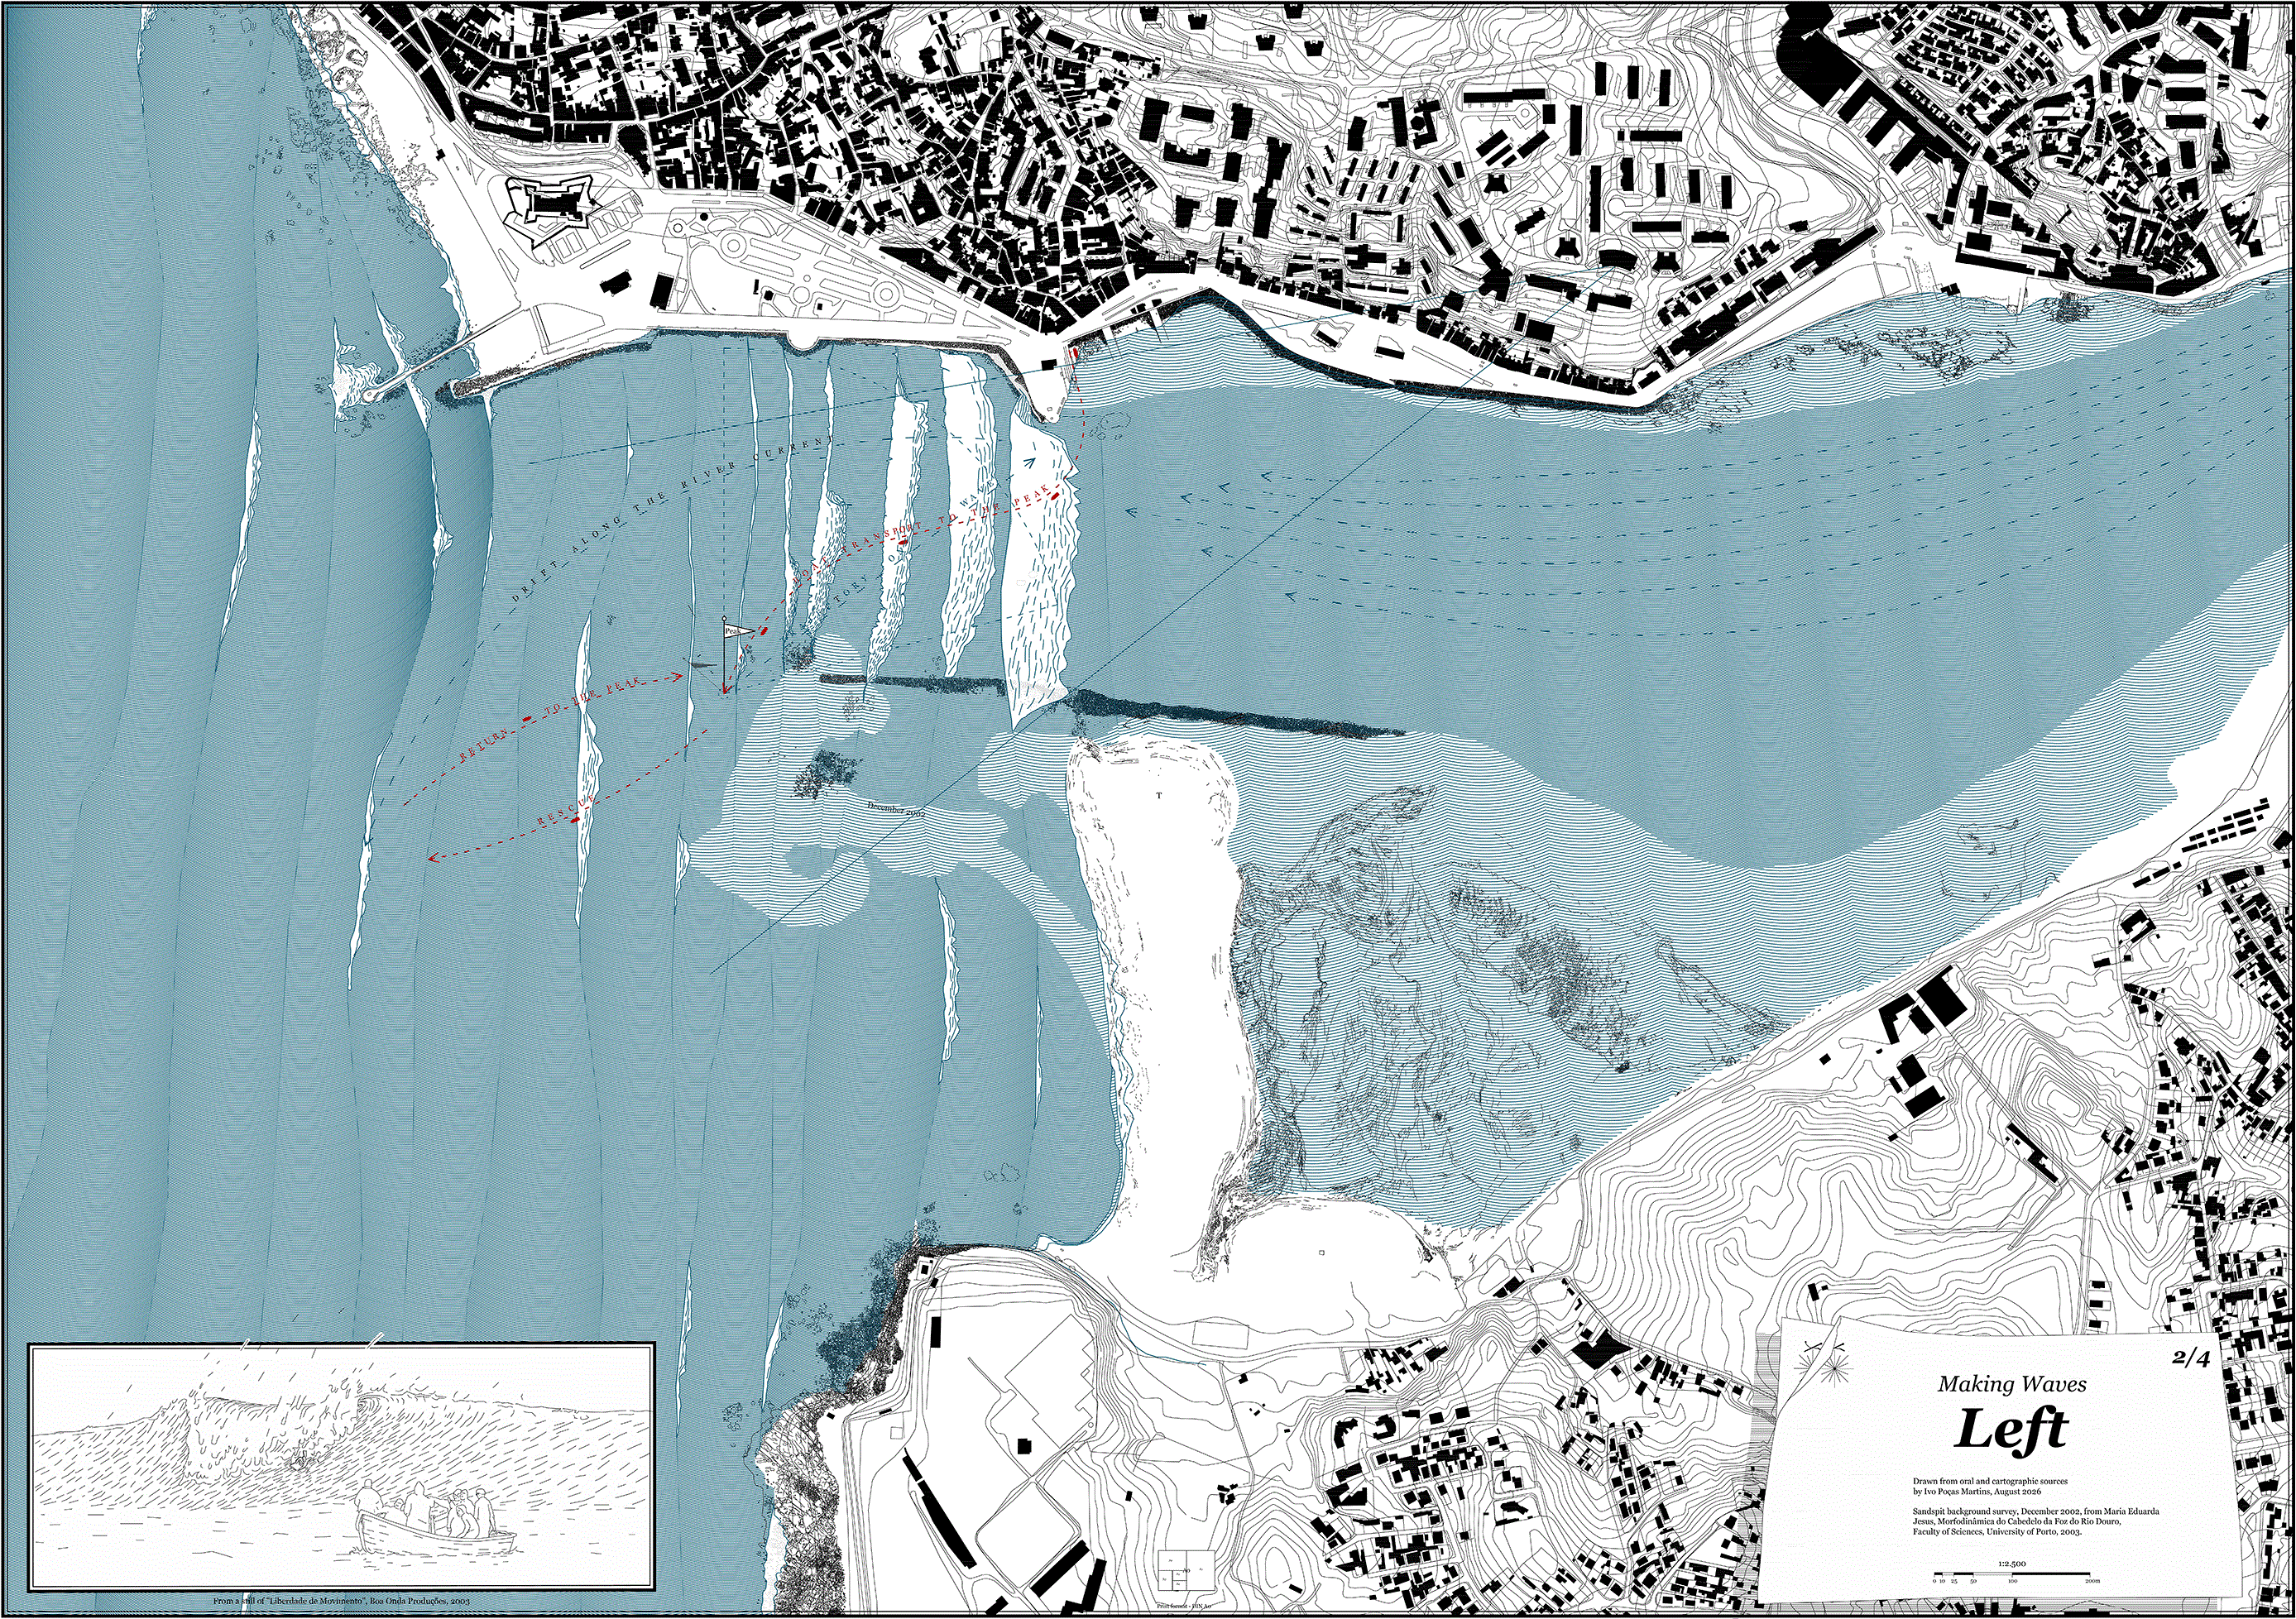
Figure 4. “Left” map, based on the December 2002 cartographic survey of the Douro sandspit (Cabedelo), by Ivo Poças Martins, 2026.
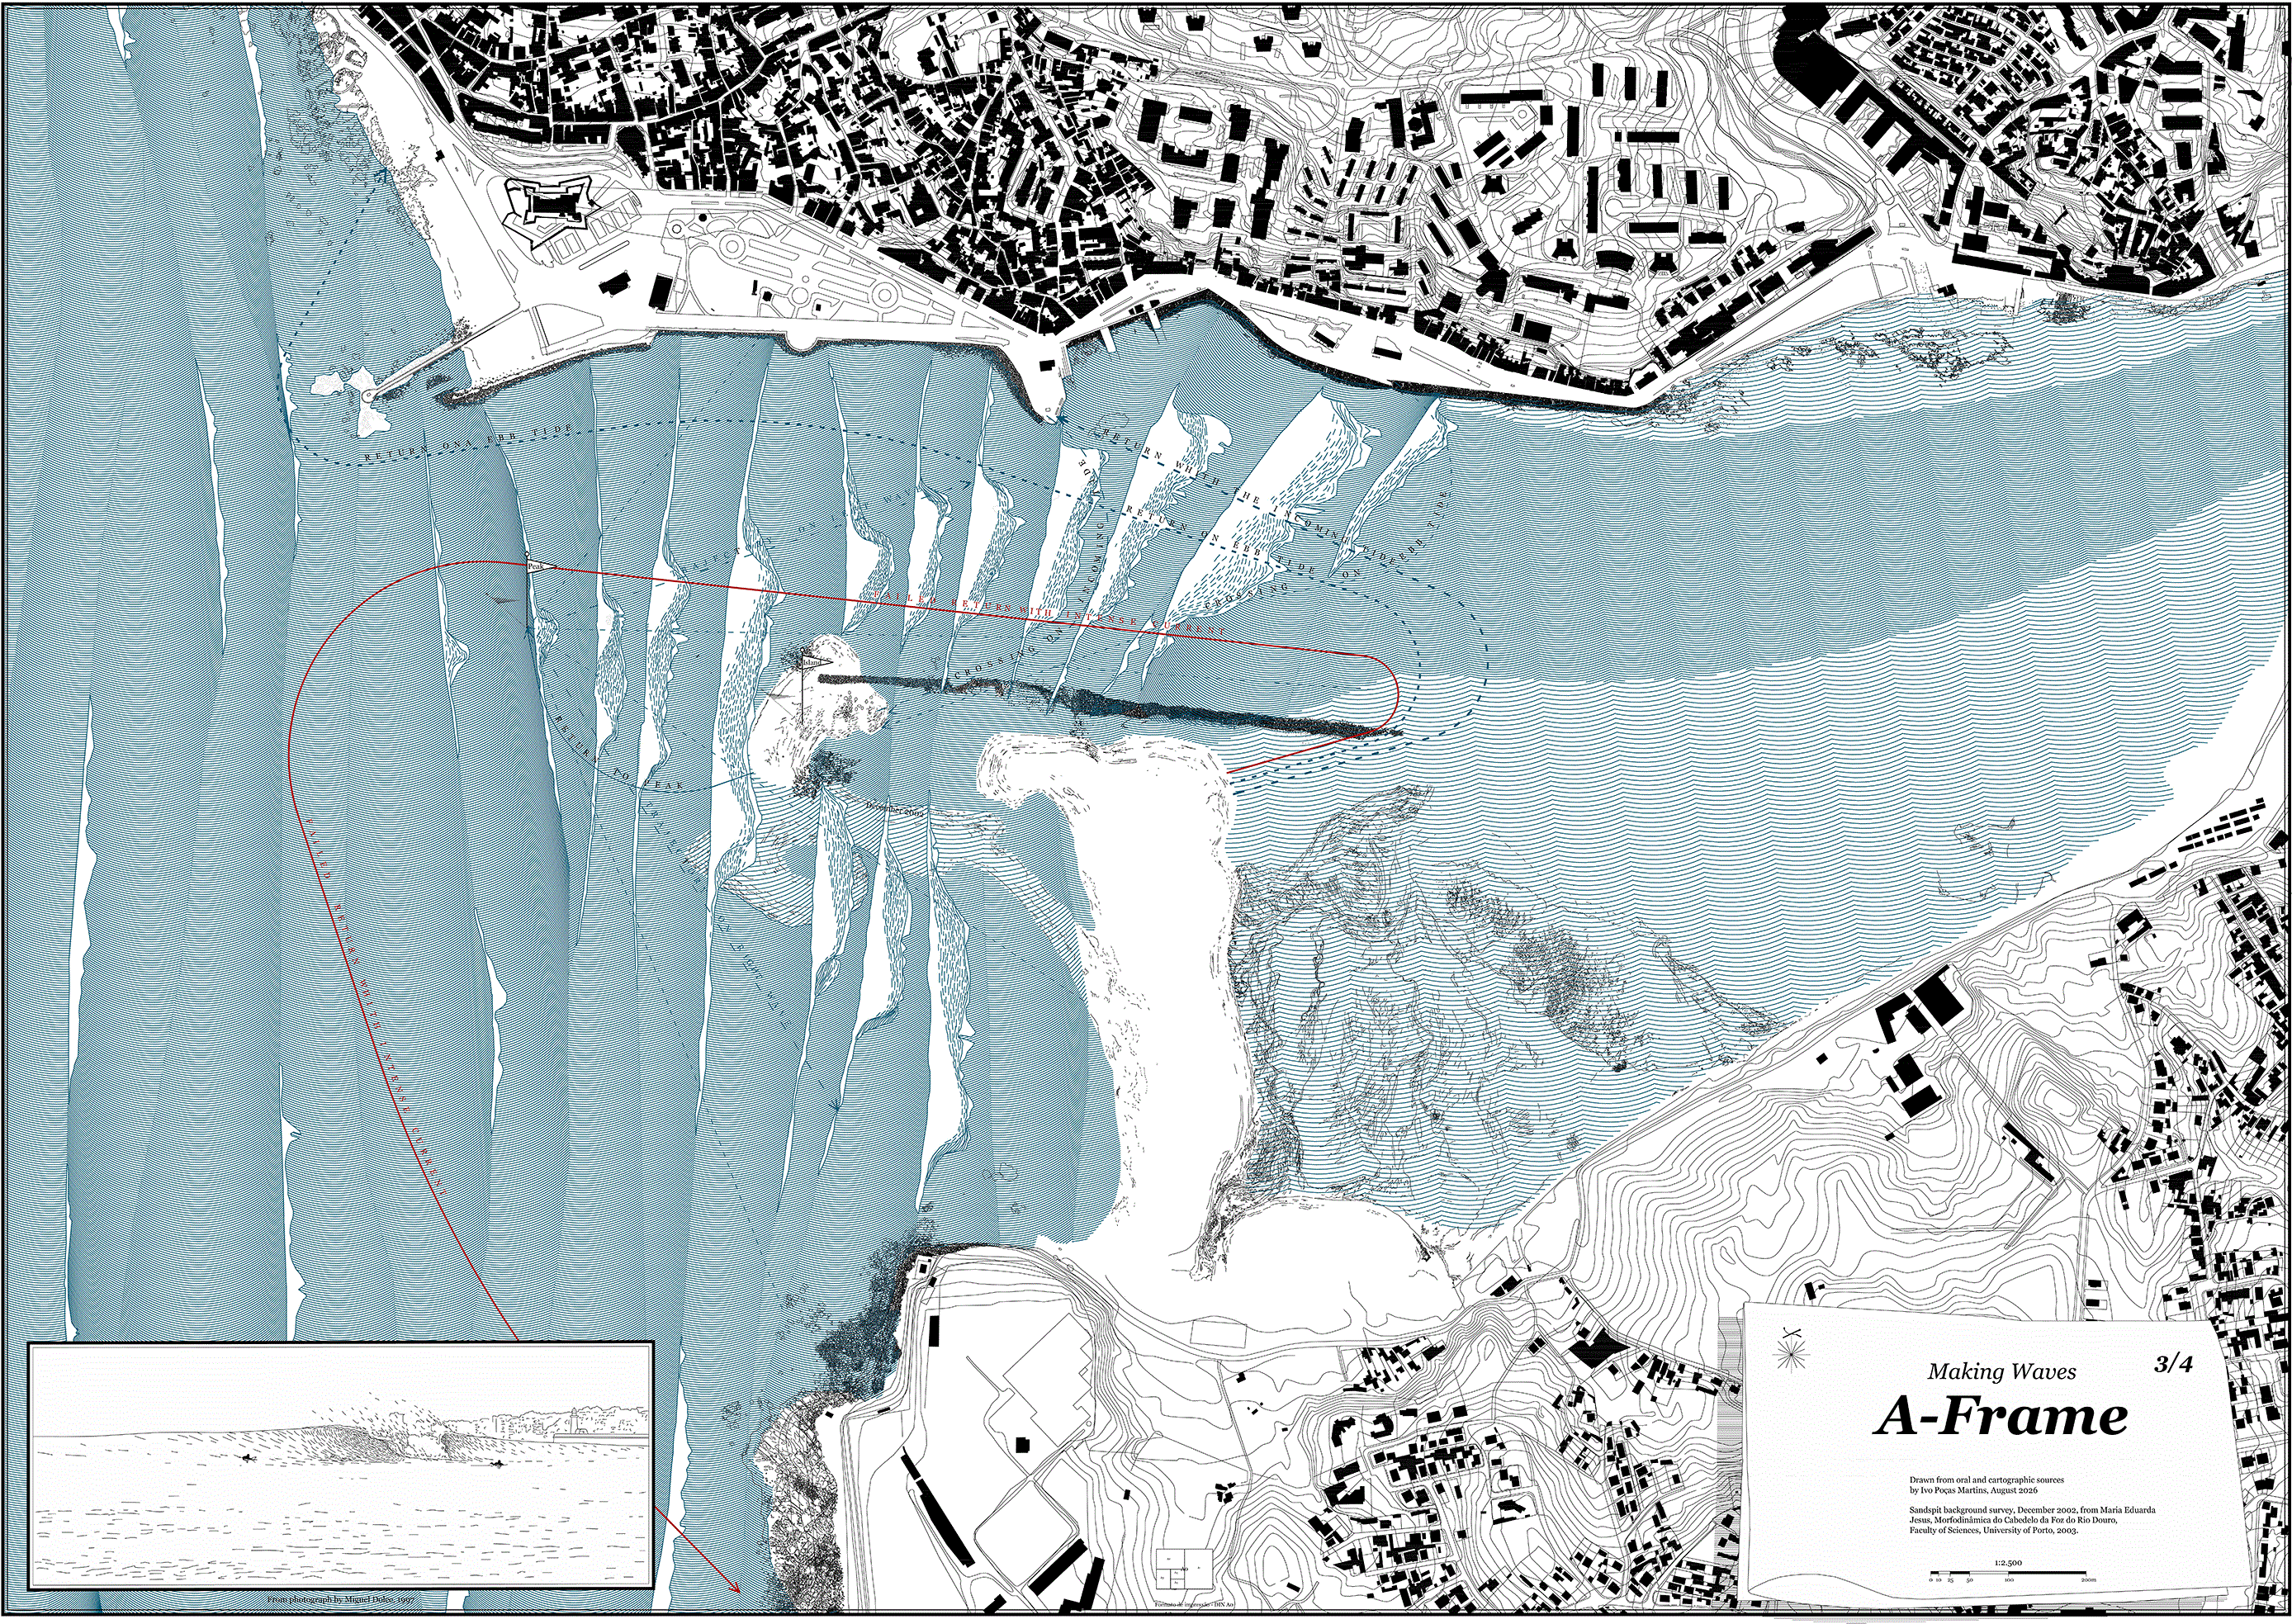
Figure 5. “A-Frame” map, based on the December 2002 cartographic survey of the Douro sandspit (Cabedelo), by Ivo Poças Martins, 2026.
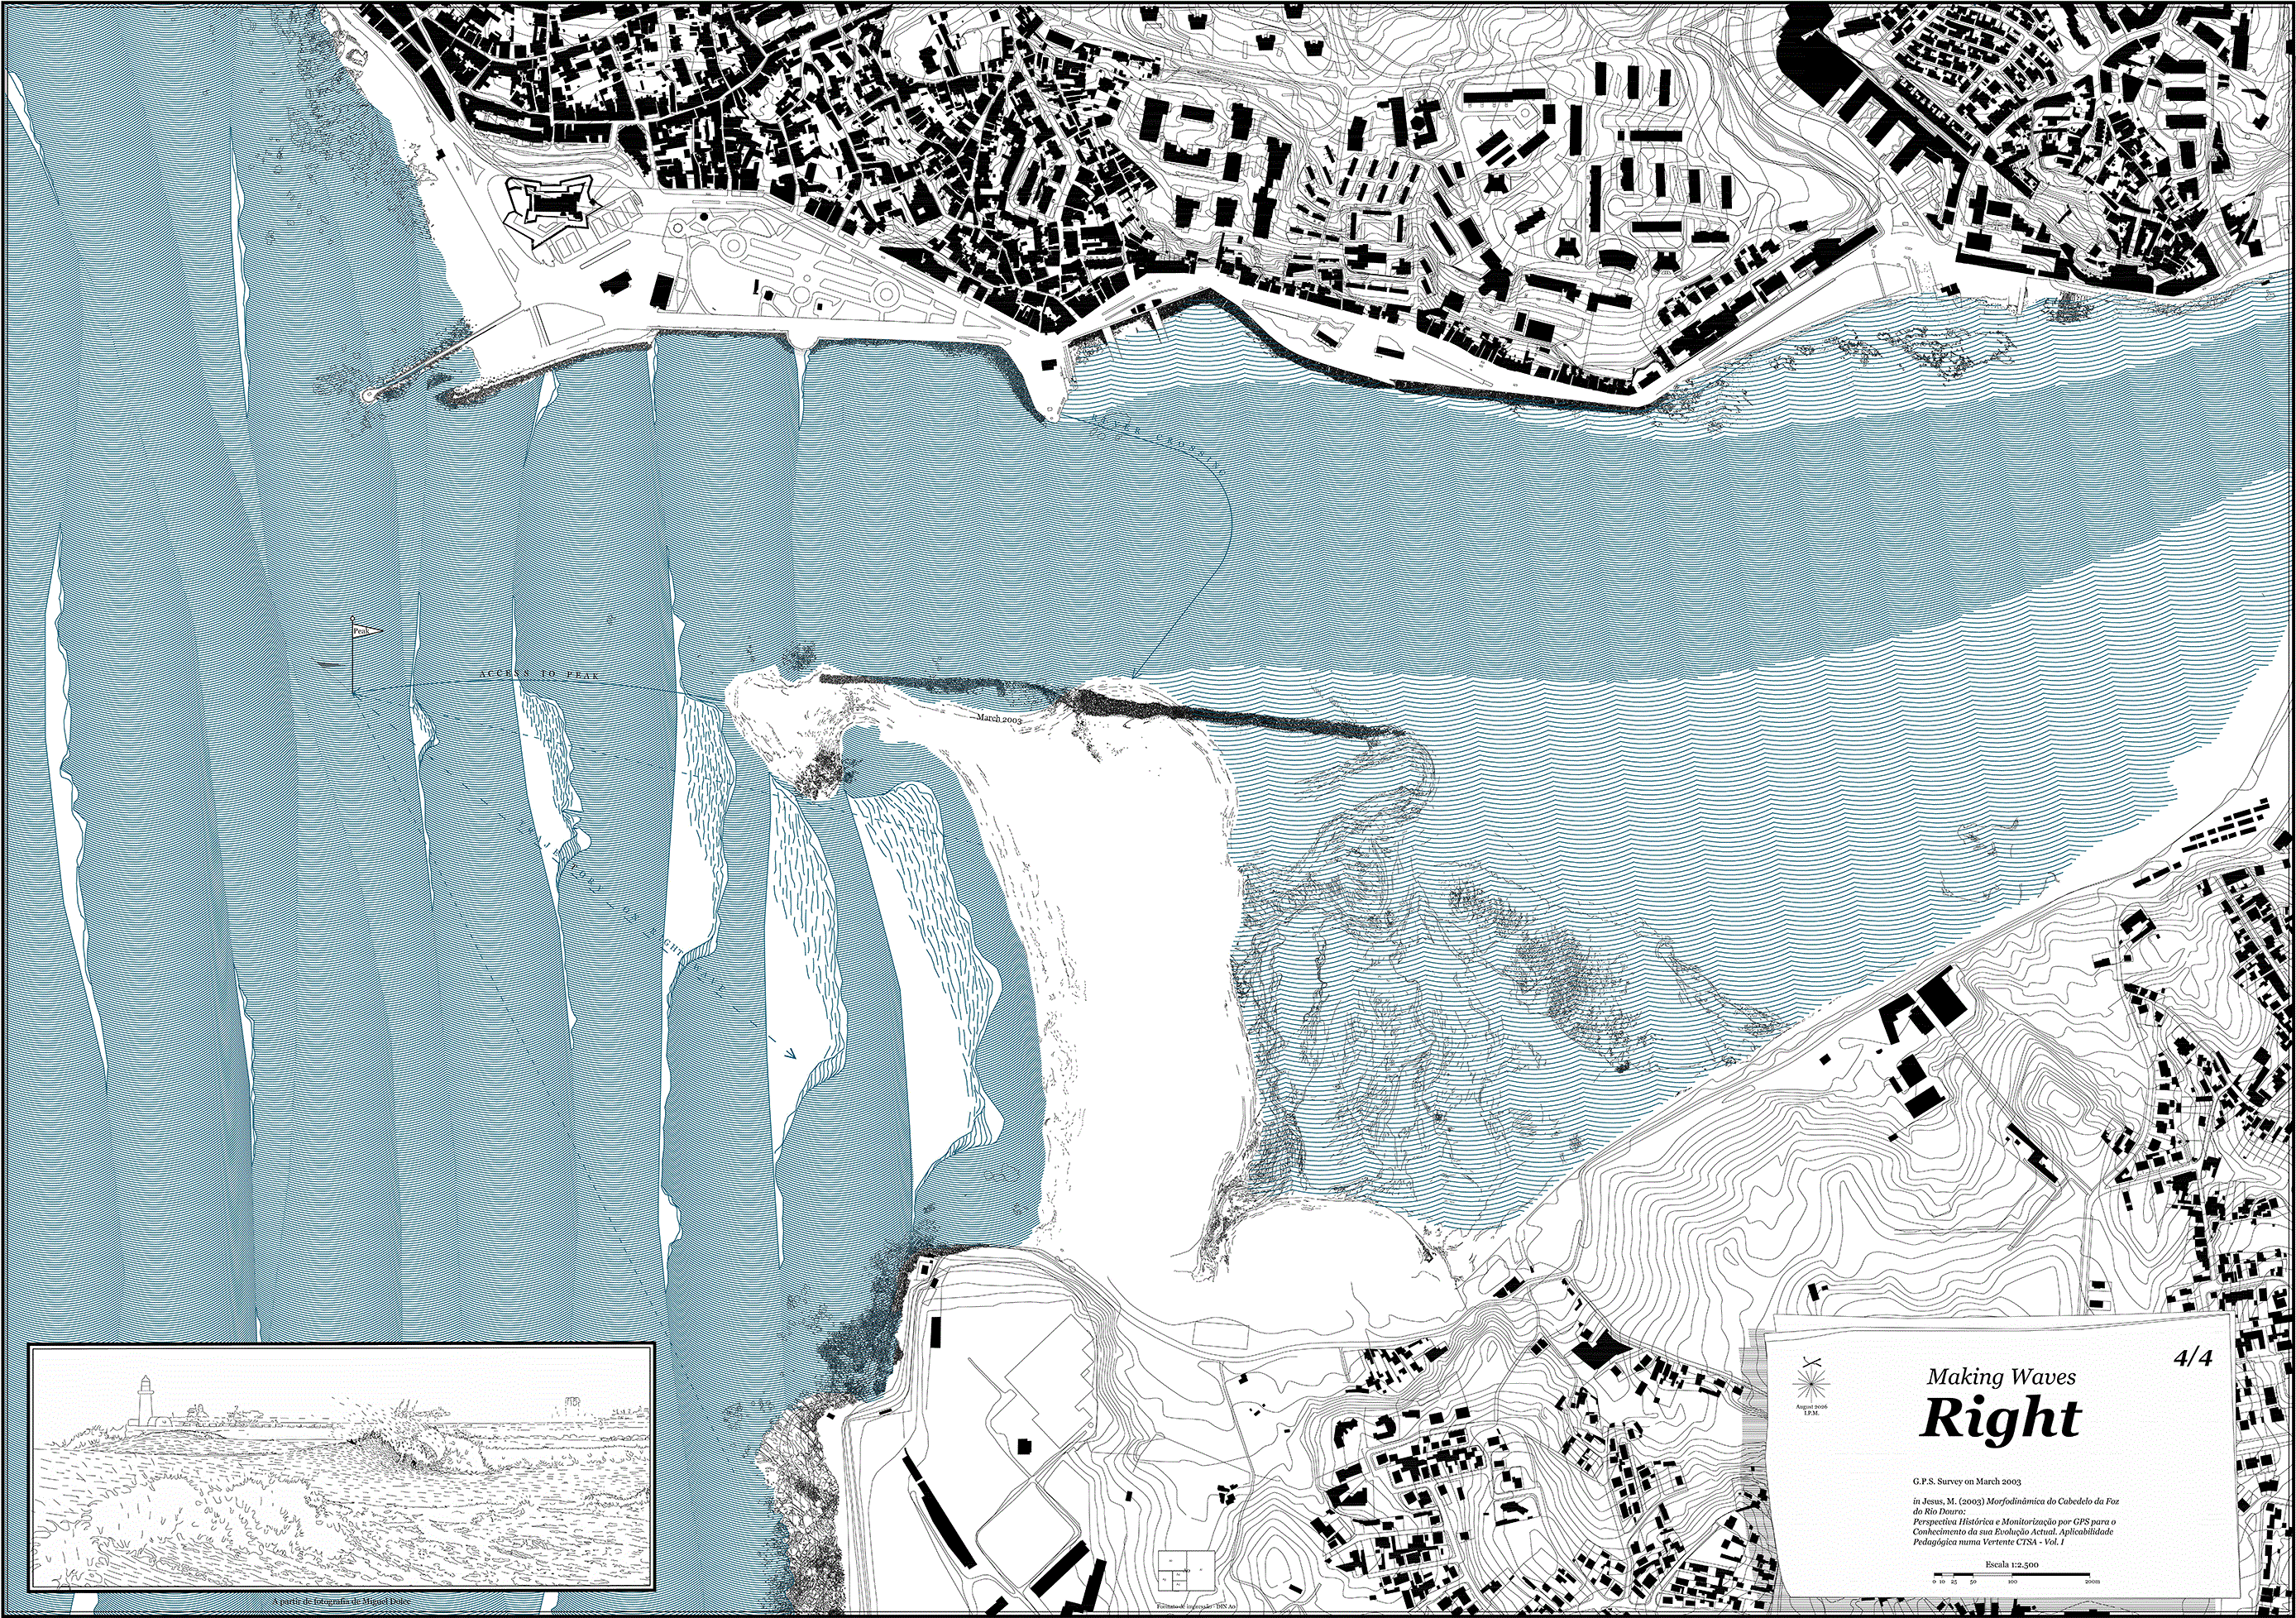
Figure 6. “Right” map, based on the March 2003 cartographic survey of the Douro sandspit (Cabedelo), by Ivo Poças Martins, 2026.
The large map scale made it possible to develop a rich set of graphic conventions, including detailed symbols, legends, and annotations. Maintaining a consistent geographic frame made temporal changes readily apparent, while the graphic treatment of water highlighted the dynamic processes under investigation. Variations in linework were used to distinguish different swell conditions, wave intensity, river currents, and surf-break configurations. In addition, the maps incorporated the principal routes and movement patterns described by the surfers.
A deliberately restricted colour palette was used throughout: blue for bodies of water, black for all other elements, and, where necessary, red for annotations. This approach emphasised the development of graphic conventions, including linework, negative space, form, directionality, and hatching density, rather than colour. Variations were explored primarily through changes in line density. To reinforce the blurred boundary between land and water, this transition was intentionally not represented by a single, sharply defined line.
The first map, Before the Flood (
Figure 3), is based on a survey conducted in June 2001 (Martins, 2026a, Sequence no. 65). This period is typically characterised by low rainfall and low river discharge. Accordingly, the water is rendered in a light, relatively uniform tone. In the northern part of the Cabedelo, a dense black mass represents the artificial mole constructed in the 1820s. The navigation channel is clearly defined, although substantially constrained by the distal head of the sandspit. On the seaward side, hatching is used to evoke the effect of a gentle swell with a long wave period, while additional hatching creates a subtle sense of relief. The river side is represented with a similar tonal intensity but a more regular wave pattern, suggesting a calmer water surface. The colour intensity gradually decreases towards the riverbanks to indicate the deeper navigation channel. On the southern side, the water hatching becomes more dispersed and is superimposed over a series of black lines representing a sandbar exposed at low tide. This pattern depicts both the texture of the sand and the delicate network of drainage channels revealed as the tide recedes.
The second map, Left (
Figure 4), is based on a survey of the Cabedelo conducted in December 2002 (Martins, 2026a, Sequence no. 65), capturing the navigation channel following a flood, when it had been cleared of accumulated sand and was fully exposed to the surf break. On the seaward side, south of the old mole, an accumulation of sediment is visible. The sea is represented with a darker shade of blue, reflecting higher-energy conditions, shorter wave periods, and a rougher surface texture. In places, the wave crests are emphasised through unfilled areas representing breaking foam. This graphic convention is most evident within the navigation channel, highlighting the left-breaking waves that interfered with navigation.
A focal point, marked by a flag symbol, is located at the western end of the 1820s mole, where river-borne sediments tended to accumulate. This was the point at which the waves consistently peaked, making it the ideal location for surfers to catch the wave.
These conditions were characterised by exceptionally strong currents, and surfers often relied on small motorised boats, particularly those moored in a small harbour on the northern bank, to reach the take-off zone. These routes are represented by red lines, while a dotted blue line indicates the drift of surfers carried downstream by the current after completing a ride. When assisted by boats, surfers and boat operators followed a continuous shuttle route between the take-off zone, the breaking wave, and the offshore drift.
The plan makes the sequence of successive waves visible. As a wave set begins to break, the foam crest accentuates the face of the following wave, while the successive peaks advance towards the shore. A subtle arch suggests the barrel, and the area of breaking foam progressively increases until the final wave of the set, where it extends across the full width of the wave.
A vignette in the lower-left corner complements the plan with a low-angle perspective based on a film still. The image depicts a bodyboarder descending the wave after take-off and preparing to execute a bottom turn. Fine lines suggest spray rising from the wave crest, indicating a light offshore breeze. Although the prevailing local wind direction is from north to south, the deep river valley shelters the Cabedelo, creating the light offshore conditions illustrated in the drawing.
The third map, A-Frame (
Figure 5), is based on the December 2002 survey of the Cabedelo (Martins, 2026a, Sequence no. 65). It follows the same graphic conventions established in the preceding maps. At this stage, surfers consistently described a small island to the west of the old mole, surrounded by shallow waters. These sand formations are represented by superimposing a water pattern over the earlier outline of the sandspit’s distal head. As the waters gradually calmed, surfers no longer required the assistance of motorboats. Two flag symbols mark the wave peak, which had shifted westwards, and the sand island. The shallow waters enabled surfers to reach the take-off zone after a short walk across the sandspit followed by a brief paddle. Both the plan and the vignette depict the distinctive moment when the surf break formed an A-frame, allowing waves to break simultaneously to the left and the right.
The dashed lines indicate the most common access and return routes used by surfers from the northern bank, illustrating the broader movement patterns adopted in response to the river currents. An exceptional incident, in which a surfer failed to return and was carried several miles southwards by the coastal current, is highlighted in red.
The fourth and final map, Right (
Figure 6), represents the remainder of the season, during which the sandspit maintained a relatively stable configuration. It is based on the March 2003 survey (Martins, 2026a, Sequence no. 65). The navigation channel is shown to be entirely clear, with sand accumulation extending south of the old mole and projecting slightly westwards. The resulting surf break formed long, barrelling right-hand waves. The blue tonal variations suggest a gentler transition between sea and river, with a more regular ocean swell forming a repetitive pattern as it progresses into the freshwater environment.
These four maps provide a situated visualisation of the relationship between the sandspit and the waves. Together, they depict the evolution of the intertidal zone, from an extreme hydrological event to its subsequent seasonal reconfiguration. The surf break evolves from a left-breaking wave to an A-Frame peak and, ultimately, to the expected right-breaking wave. Because the morphology of the surf break is directly linked to that of the sandspit, this sequence illustrates situated knowledge of water dynamics as a complement to conventional terrestrial representations. Through the experimental use of colour gradation, line density, hatching, perspective vignettes, graphic symbols, and annotations, the maps challenge the conventions of static cartography while capturing the complexity of hydrodynamic processes and human interactions within a conventionally static representational medium.









