Introduction
Despite decades of investigations, the 25–40 km thick crust and extensive magmatism at the Greenland–Iceland–Faroe Ridge remain controversial. These have been notoriously explained by the presence of a mantle plume rising from the core–mantle boundary to the base of the lithosphere (e.g., Morgan, 1971; Schilling, 1973; White & McKenzie, 1995). This is believed to have resulted in intense, dominantly mafic magmatism and an anomalously thick oceanic crust.
Tomographic studies suggest the presence of a low-velocity zone in the upper mantle under Iceland (e.g., Zhang et al., 2024). However, the geometry, shape, and extent of this zone are highly debated (e.g., Bransðóttir & Menke, 2008; Foulger, 2025 and references therein). An emerging competing hypothesis (plate model) involves large remnants of continental crust and partial melting of the upper mantle due to decompression during exhumation (Anderson, 2000; Foulger, 2021; Foulger et al., 2020; Foulger et al., 2021; Hole & Natland, 2020).
In addition, various inconsistencies around the plume hypothesis have cast doubt on the nature of the crust and whether a dominantly mafic crust in the Greenland–Iceland–Faroe Ridge and other areas with anomalously thick crust offshore (e.g., Walvis, Rio Grande, Mozambique, Madagascar, Chagos–Laccadive, Gunnerus, and Astrid ridges; Koehl & Foulger, 2025) is sustainable. In Iceland, important inconsistencies include, e.g., a relatively cold crust under Iceland (Foulger et al., 2003; Menke & Levin, 1994; Menke et al., 1995), a much larger distance between the oldest rocks Icelandic rift zones (c. 500 km instead of 290 km) than what is predicted by the full-plate spreading rate in the northeastern Atlantic (Foulger, 2006), and non-linear, disrupted magnetic anomalies, which are atypical in oceanic crust (e.g., Foulger et al., 2020).
It does not help that the substratum to the several km thick basaltic upper crust in Iceland still eludes scientists. The deepest wells onshore Iceland (IDDP and Reyðarfjörður wellbores; Friðleifsson, 1982; Friðleifsson et al., 2017; Robinson et al., 1982) and the Faroe Islands (Lopra wellbore; Waagstein et al., 1982) all terminated in Cenozoic lavas (
Figure 1a–b), which have been suggested to be up to 10 km thick in places (e.g., Jolley et al., 2021; Layfield et al., 2023; Richardson et al., 1998; Williamson & Ziska, 2018).
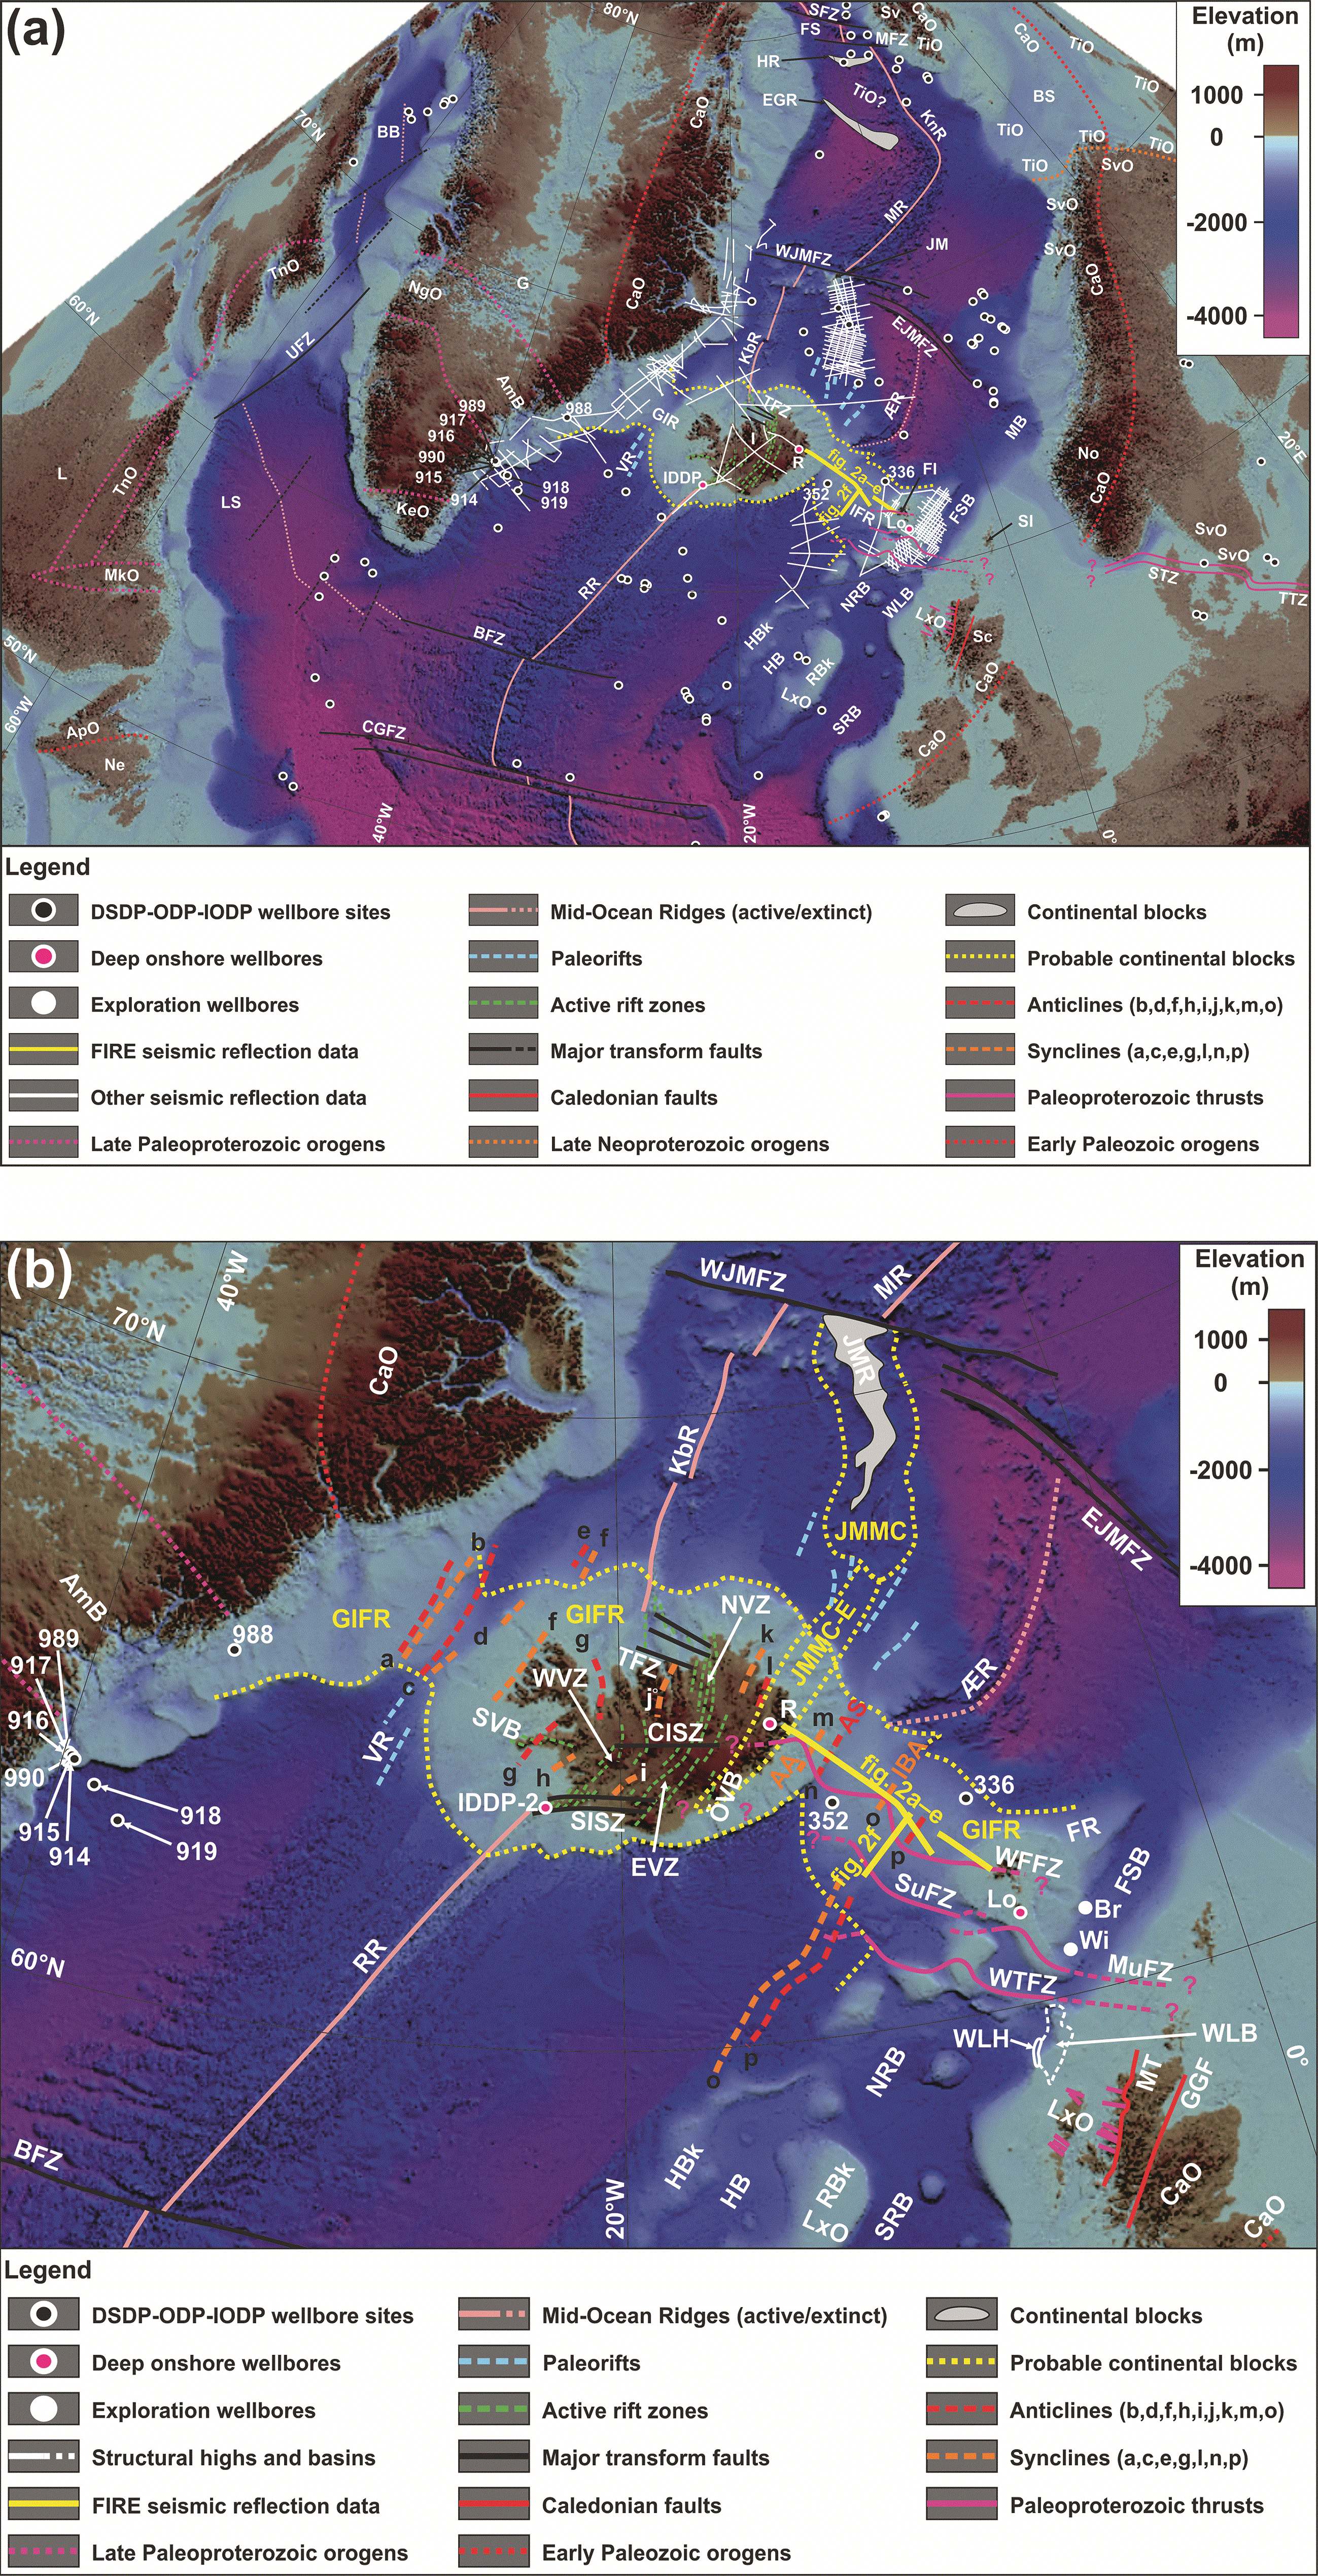
Figure 1. (a) Bathymetric map of the North Atlantic region showing the main orogens, mid-ocean ridges, structural elements, and related faults.
Notice the alignment of the Teisseyre–Tornquist Zone (TTZ) and Sorgenfrei–Tornquist Zone (STZ) with the late Paleoproterozoic thrust systems around the Faroe Islands and onshore northern Scotland (fuchsia lines). The basemap is from GEBCO Compilation Group (2023; displayed in projection UTM27). Abbreviations: AmB: Ammassalik Belt; ApO: Appalachian Orogen; BB: Baffin Bay; BFZ: Bight fault zone; BS: Barents Sea; CaO: Caledonian Orogen; CGFZ: Charlie Gibbs fault zone; DS: Davis Strait; EGR: East Greenland Ridge; EJMFZ: East Jan Mayen fault zone; FI: Faroe Islands; FS: Fram Strait; FSB: Faroe–Shetland Basin; G: Greenland; GIR: Greenland–Iceland Ridge; HB: Hatton Basin; HBk: Hatton Bank; HR: Hovgård Ridge; I: Iceland; IDDP-2: Iceland Deep Drilling Project wellbore 2; IFR: Iceland–Faroe Ridge; JM: Jan Mayen; KbR: Kolbeinsey Ridge; KeO: Ketilidian Orogen; KnR: Knipovich Ridge; L: Labrador; Lo: Lopra wellbore; LS: Labrador Sea; LxO: Laxfordian Orogen; MB: Møre Basin; MFZ: Molloy fault zone; MkO: Makkovikian Orogen; MR: Mohns Ridge; Ne: Newfoundland; NgO: Nagssugtoqiian Orogen; No: Norway; NRB: Northern Rockall Basin; R: Reyðarfjörður wellbore; RBk: Rockall Bank; RR: Reykjanes Ridge; Sc: Scotland; SFZ: Spitsbergen fault zone; SI: Shetland Islands; SRB: Southern Rockall Basin; STZ: Sorgenfrei–Tornquist Zone; Sv: Svalbard; SvO: Svecofennian Orogen; TFZ: Tjörnes fault zone; TiO: Timanian Orogen; TnO: Torngat Orogen; TTZ: Teisseyre–Tornquist Zone; UFZ: Ungava Fault Zone; WJMFZ: West Jan Mayen fault zone; ÆR: Ægir Ridge. (b) Zoom in the Greenland–Iceland–Faroe Ridge and nearby areas showing the continuation of potential (Neoarchean?–) late Paleoproterozoic thrust systems from northern Scotland and around the Faroe Islands to Iceland (e.g., West Faroe and Suðurøy fault zones; WFFZ and SuFZ). Notice the alignment of these thrust systems with the Southern Iceland Seismic Zone (SISZ) and Central Iceland Shear Zone (CISZ). The basemap is from GEBCO Compilation Group (2023; displayed in projection UTM27). Notice the extended Jan Mayen Microcontinent suggested by Torsvik et al. (2015) in eastern Iceland. Anticlines and synclines in the Greenland–Iceland–Faroe Ridge (a–p) are from Hjartarson et al. (2017) and the present study. Anticlines “m” and “o” and syncline “n” were named Austurbrún Anticline (AA), Iceland Basin Anticline (IBA), and Austurbrún Syncline (AS) respectively by Hjartarson et al. (2017). Abbreviations: AA: Austurbrún Anticline; AmB: Ammassalik Belt; AS: Austurbrún Syncline; BFZ: Bight fault zone; Br: Brugdan wellbore; EJMFZ: East Jan Mayen fault zone; EVZ: East Volcanic Zone; FR: Fugløy Ridge; FSB: Faroe–Shetland Basin; GGF: Great Glen Fault; IBA: Iceland Basin Anticline; IDDP-2: Iceland Deep Drilling Project wellbore 2; JMMC: Jan Mayen Microcontinent; JMMC-E: Jan Mayen Microcontinent extended; JMR: Jan Mayen Ridge; KbR: Kolbeinsey Ridge; Lo: Lopra wellbore; LxO: Laxfordian Orogen; MR: Mohns Ridge; MT: Moine Thrust; MuFZ: Munkagrunnur fault zone; NVZ: North Volcanic Zone; ÖVB: Öræfi Volcanic Belt; R: Reyðarfjörður wellbore; SVB: Snæfellsnes Volcanic Belt; SuFZ: Suðurøy fault zone; TFZ: Tjörnes fault zone; VR: Versturdjupet Rift; WFFZ: West Faroe fault zone; Wi: William wellbore; WJMFZ: West Jan Mayen fault zone; WLB: West Lewis Basin; WLH: West Lewis High; WTFZ: Wyville–Thomson fault zone; WVZ: West Volcanic Zone; ÆR: Ægir Ridge.
Furthermore, seaward-dipping reflectors are typically accepted as the continent–ocean boundary. However, recent seismic reflection mapping around the Faroe Islands have showed the existence of a network of WNW–ESE-striking brittle–ductile thrust systems (Koehl et al., 2024a;
Figure 1a–b). These were reworked mildly into NE–SW-striking folds and, in places, localized the formation of relatively shallow Caledonian thrusts (Koehl et al., 2024a their Figure 2a, e, h, and i). These thrust systems strike parallel to the Greenland–Iceland–Faroe Ridge and were traced below seaward-dipping reflectors northwest of the Faroe Islands. The present work investigates potential tectonic structures in the Iceland–Faroe Ridge, their possible connection to structures around the Faroe Islands and onshore northern Scotland, and their impact on potential paleo rift centers (e.g., c).
Geological setting
Southeastern greenland
In southeastern Greenland, Archean–Paleoproterozoic basement rocks were deformed in the late Paleoproterozoic and form the WNW–ESE-striking Ammassalik Belt (Bridgewater & Myers, 1979; Chadwick & Vasudev, 1989; Chadwick et al., 1989; Kalsbeek et al., 1993a). Deformation in the Ammassalik Belt is strongly partitioned, with abrupt boundaries between zones of intensely deformed and near undeformed rocks (Bridgewater & Myers, 1979). This orogen is dominated by SSW-verging folds and thrusts crosscutting sinistral shear zones deformed under granulite-facies metamorphism and retrogressed to greenschist–amphibolite facies (Bridgewater & Myers, 1979; Chadwick et al., 1989; Chadwick & Vasudev, 1989; Dawes et al., 1989). Thrust systems in the Ammassalik Belt show mylonitic fabrics and sheared mafic intrusions, while fold structures are asymmetric (up to isoclinal) and are typically hundreds of meters wide (Chadwick & Vasudev, 1989). There is no evidence of Caledonian reworking in the Ammassalik Belt (Kalsbeek et al., 1993a). Caledonian deformation was restricted to eastern and northeastern Greenland, where it reworked late Paleoproterozoic basement rocks and structures (Kalsbeek et al., 1993b; Kalsbeek et al., 2008), which partly retained their initial geometries (e.g., Thrane, 2004).
Archean–Mesoproterozoic basement and late Paleozoic–Mesozoic sedimentary rocks in southeastern Greenland are intruded by Cenozoic igneous rocks of the North Atlantic Igneous Province, most of which yielded mid Paleogene to mid Eocene geochronological ages (62.15–43.77 Ma; e.g., Brooks, 2011; Larsen et al., 2014; Storey et al., 2007; Tegner & Duncan, 1999; Tegner et al., 2008; Wilkinson et al., 2016). Onshore Cenozoic igneous rocks include basaltic dykes, syenite–gabbro intrusions, tuffs, volcaniclastics, pyroclastic flows, and seaward-dipping lava flows (e.g., Geoffroy, 2005; Guarnieri, 2011; Larsen et al., 1999). The thickest Cenozoic lava flows are up to 3.5 km, but total volcanic thickness estimates are in the range of 6–7 km (Larsen et al., 1989; Larsen et al., 1999; Nilsen & Brooks, 1981).
Offshore, seismic reflection studies have shown that Cenozoic igneous rocks include both intrusives (dykes and sills) and subaerial and subaqueous basaltic flows (Hovikoski et al., 2021). Seaward-dipping reflectors are believed to be widespread at the Greenland–Iceland Ridge and possibly extend to Iceland (e.g., Dahl-Jensen et al., 1997; Geoffroy et al., 2021; Hopper et al., 1998; Larsen & Jakobsðottir, 1988; Parson et al., 1988). Basaltic seaward-dipping reflectors were drilled during ODP 152 and 163 (wellbores 915, 917, 918, 989, and 990;
Figure 1a–b) and included dacite, which are absent onshore (Brooks, 2011; Tegner & Duncan, 1999). The thickest Cenozoic volcanic unit was penetrated by wellbore 915, which drilled through 779 m of basalt before terminating in pre-rift, likely lower Paleogene sedimentary rocks (Brooks, 2011).
Iceland
Outcrops onshore Iceland are dominated by Cenozoic–Quaternary lavas and igneous rocks intercalated with sparse contemporaneous sediments (e.g., Johannesson, 2014; Sæmundson, 1979). The oldest lavas onshore Iceland are c. 17 Ma and occur in the west and northwest (Harðarson et al., 1997; McDougall et al., 1984; Moorbath et al., 1968). Lavas in northeastern Iceland are somewhat younger with ages up to 14.7 ± 0.4 Ma (Berg, 2016; Burchardt et al., 2022; Jancin et al., 1985; Martin et al., 2011). Anorthosite inclusions were found locally in Cenozoic dolerite in western Iceland (Snæfellsnes; Griffin et al., 1974; Kristmannsdóttir, 1971).
Icelandic lavas dip both inward and outward (with regards to the center of the island), which results in overall NE–SW- to NNE–SSW-striking synclinal and anticlinal geometries (e.g., Bourgeois et al., 2005; Jancin et al., 1985; Johannesson, 1980; Sæmundsson, 1979). Some of these structures were interpreted as potential fault-related rollover folds with syn-folding lava flows thinning away from syncline hinge zones and felsic intrusions in the footwall of related normal faults (e.g., Bourgeois et al., 2005). Similarly, Icelandic lavas have been interpreted as (extensional-detachment-bounded) seaward-dipping reflectors (e.g., Geoffroy, 2005; Larsen & Jakobsðottir, 1988). At some anticlines, older lavas are separated from overlying younger lavas by (tilted) unconformities (e.g., Garcia et al., 2003; Garcia et al., 2008; Hjartarson, 2003; Johannesson, 1980; Johannesson, 2014; Sæmundsson, 1979). Adjacent synclines are thus typically interpreted as paleo rift centers (e.g., Boðvarsson & Walker, 1964; Harðarson et al., 1997; Hjartarson, 2003; Hjartarson et al., 2017).
Structural trends onshore Iceland include rift-parallel, NE–SW- to NNE–SSW-striking normal faults and rift-orthogonal, WNW–ESE- to E–W-striking normal and strike-slip faults. While the former dominate in active volcanic zones along the rift axis, the latter are well developed in northern to southern central Iceland (e.g., Tjörnes fault zone, Central Iceland Shear Zone, and Southern Iceland Seismic Zone) and in western Iceland at Snæfellsnes (Snæfellsnes Volcanic Zone; Bergerat & Angelier, 2008; Khodayar, 2018; Khodayar & Einarsson, 2002; Khodayar et al., 2020; Liotta et al., 2021; Tryggvason, 1973; Villemin et al., 1994; Young et al., 1985;
Figure 1b).
Seismic studies suggest that the Icelandic crust is 25–40 km thick (e.g., Darbyshire et al., 1998; Du & Foulger, 2001; Foulger et al., 2003). It is typically thought to comprise a few kilometers thick upper crustal layer consisting primarily of basaltic lavas (e.g., Tryggvason & Båth, 1961), which were drilled down to a depth of 4.5 km by the Iceland Deep Drilling Project wellbore in southwestern Iceland (Friðleifsson et al., 2017) and c. 3.5 km in eastern Iceland (Friðleifsson, 1982; Robinson et al., 1982).
The nature of the lower is, however, disputed and two main hypotheses are generally favored by geochemical studies. The first is a magma-inflated mafic lower crust related to a potential mantle plume below Iceland (e.g., Morgan, 1971; Schilling, 1973; White & McKenzie, 1995). The second is a (partly?) continental lower crust (e.g., Day, 2016; Jonasson, 2007; Natland, 2007; Torsvik et al., 2015). The latter is supported by the relatively large proportion of silicic (i.e., felsic to intermediate) magmatism in Iceland (up to 21%; e.g., Jonasson, 2007; Natland, 2007; Thordarson & Larsen, 2007; Walker, 1964), which contrasts with mid-ocean ridge magmatism (c. 6% at the East Pacific Rise; Natland, 2007). This is further supported by evidence of extensive crustal contamination of lavas in southeastern Iceland (East Volcanic Zone;
Figure 1b), which is the most productive magmatic zone in Iceland (80% of total erupted volume in the past 1130 years; Thordarson & Larsen, 2007) and displays a similar contamination crustal trend as lavas in the Jan Mayen Microcontinent Complex (Torsvik et al., 2015).
Magnetotelluric studies have long shown evidence of a deep conductive layer at a depth of 5–20 km under Iceland (e.g., Arnason et al., 2025). This layer domes up under central volcanoes and geothermal fields. Although it is compatible with the presence of melt below active volcanoes in Iceland, it is not elsewhere, thus suggesting solid-state conduction. Arnason et al. (2025) thus suggested the presence of iron- and titanium-rich and/or hydrated minerals in the deep conductive layer.
Greenland–Iceland–Faroe Ridge
Seismic studies have shown that the Greenland–Iceland–Faroe Ridge is 23–40 km thick (Bohnhoff & Makris, 2004; Darbyshire et al., 1998; Foulger et al., 2003; Funck et al., 2014). This anomalously thick crust in presumed oceanic crustal domain is typically attributed to intense magmatism due to a putative mantle plume under Iceland, thus resulting in a magma-inflated mafic crust (Morgan, 1971; White & McKenzie, 1995). Recent studies have however pointed at probable occurrences of continental crust in parts of the Greenland–Iceland–Faroe Ridge (e.g., Bohnhoff & Makris, 2004; Foulger et al., 2020; Torsvik et al., 2015).
Regardless, the upper crustal layer in the Greenland–Iceland–Faroe Ridge consists of several km thick Cenozoic lavas arranged in seaward-dipping reflectors (e.g., Geoffroy et al., 2021; Hjartarson et al., 2017). Near the center of the Iceland–Faroe Ridge, seismic data suggest that the crust is thinnest (c. 23 km) and that Cenozoic lavas are up to 3 km thick (Bohnhoff & Makris, 2004). Two DSDP 38 wellbores were drilled in the Iceland–Faroe Ridge and terminated in Cenozoic sediments and basalts (wellbores 336 and 352 in
Figure 1a–b; Talwani et al., 1976). Noteworthy, the 3 km estimate for Cenozoic volcanics is a maximum and includes the <1 km thick, low-velocity layer below the high-velocity basaltic unit penetrated in wellbore 336 (Bohnhoff & Makris, 2004). The low-velocity layer may represent a volcaniclastic endmember of the Cenozoic volcanics (e.g., hyaloclastites). This is suggested by results from the Brugdan and William wells in the Faroe–Shetland Basin (location in
Figure 1b), which penetrated a similar low-velocity, 300–400 m thick layer of hyaloclastites below high-velocity basaltic lavas (Ólavsdóttir et al., 2021; Schuler et al., 2013). Wellbore 336 showed evidence of paleosols above basaltic flows dated to 43 ± 3.3 Ma (Talwani et al., 1976), thus indicating that the Iceland–Faroe Ridge was exposed above sea level in the mid–late Eocene (Nilsen & Kerr, 1978).
Recently, the seismic reflection study by Hjartarson et al. (2017) has suggested that large, hundreds km wide, NE–SW- to NNE–SSW-striking folds occur below the Cenozoic lavas in the Greenland–Iceland and Iceland–Faroe ridges. Like onshore Iceland, these were interpreted as abandoned rift centers, e.g., Vesturdjupet Rift (
Figure 1a–b; Hjartarson et al., 2017).
Faroe Islands
Most Cenozoic igneous rocks onshore the Faroe Islands intruded the continental margin at ca. 60.8–50.5 Ma (i.e., mid Paleogene–early Eocene; e.g., Hansen & Ganerød, 2023; Storey et al., 2007; Wilkinson et al., 2016). They are generally believed to be c. 6.6 km thick (Passey & Jolley, 2008; Waagstein et al., 1982), but seismic interpretation in the Faroe–Shetland Basin suggests that they could be >10 km thick, e.g., at the Brugdan wellbore and the Fugløy Ridge (Jolley et al., 2021 their Figure 9; Layfield et al., 2023 their Figure 2; Richardson et al., 1998; Williamson & Ziska, 2018 their Figures 6–10).
Offshore, Cenozoic volcanics occur as thick successions of lava flows (including lava deltas), hyaloclastites, and volcaniclastics (e.g., Ellefsen et al., 2009; Jolley et al., 2021; Schuler et al., 2013; Williamson & Ziska, 2018). Intrusions include dykes and (saucer-shaped) sills (e.g., Ellefsen et al., 2009; Hansen et al., 2004; Koehl et al., 2024a; Layfield et al., 2023). Seaward-dipping reflectors occur to the north and west of the Faroe Islands (e.g., Davison et al., 2010; Koehl et al., 2024a; Parson et al., 1988; Smythe, 1983).
The nature of the substratum below the Cenozoic volcanics in the Faroe region is uncertain. The deepest well onshore the Faroe Islands (Lopra wellbore) terminated into pre-breakup basalts at a depth of 2178 m (Waagstein et al., 1982), whereas offshore drilling in the Faroe–Shetland Basin terminated into sub-basalt hyaloclastites (e.g., Brugdan well) and basalt (e.g., William well; Jolley et al., 2021; Schuler et al., 2013; Williamson & Ziska, 2018). Nevertheless, recent seismic interpretation around the Faroe Islands suggests the occurrence of deep-seated, several to tens of km thick, WNW–ESE-striking thrust systems, which were reworked into hundreds km wide, NNE–SSW- to NE–SW-striking folds possibly during Caledonian and early Cenozoic contraction and, in places, localized the formation of Caledonian thrusts (Koehl et al., 2024a). These were tentatively correlated with the WNW–ESE-striking, late Paleoproterozoic shear zones in northern Scotland and were traced below and beyond the seaward-dipping reflectors northwest of the Faroe Islands (Koehl et al., 2024a).
Rockall
The Rockall region north of Ireland and west of Scotland consists of various Phanerozoic sedimentary basins and Precambrian basement highs with respective crustal thicknesses of 10–15 km and > 15–25 km, except in the Southern Rockall Basin where the crust may be as thin as 5–6 km in places (Funck et al., 2014 their
Figure 6.6; Kimbell et al., 2016 their
Figures 3–4). The entire region is believed to be underpinned by (hyper-) extended continental crust (Funck et al., 2014 their Figure 6.6; Kimbell et al., 2016 their
Figures 3–4). Crustal thinning in the Rockall region is believed to be the result of successive periods of extension, including late–post-Caledonian collapse, and Permian–Triassic, Jurassic–Early Cretaceous, and Cenozoic rifting, as suggested by related sedimentary basins and tens of km wide Cenozoic igneous centers appearing as dominantly negative circular magnetic anomalies (e.g., Bird et al., 2016; Coward et al., 1989; Jolley et al., 2021; Kimbell et al., 2005; Musgrove & Mitchener, 1996; Waddams & Cordingley, 1999).
The NNE–SSW-striking Rockall Bank and West Lewis High are cored by Precambrian metamorphic rocks, which crop out on the seafloor where Cenozoic lavas are absent (
Figure 1a–b). These are rocks recorded late Paleoproterozoic Laxfordian metamorphism and are comparable to rocks of the Lewisian Complex in Scotland (Dickin, 1992; Hitchen, 2004; Morton & Taylor, 1991; Roberts et al., 1973; Waddams & Cordingley, 1999). Hatton Bank is characterized by a mild positive gravimetric anomaly, which is less intense than the high positive anomaly of upper Archean–Paleoproterozoic rocks at Rockall High (Hitchen, 2004). This structural high is separated from the Hatton Basin (
Figure 1a–b) in the southeast by four igneous centers and is generally covered by Cenozoic lavas, except in a few places where mid Cretaceous sedimentary rocks were penetrated by exploration wells (Hitchen, 2004; Johnson et al., 2005). There, the Mesozoic sedimentary succession is deformed into several km wide, dome- and trough-shaped folds warping around the Cenozoic igneous centers, thus suggesting that deformation is related to Cenozoic magmatism (Hitchen, 2004; Johnson et al., 2005).
The Southern Rockall Basin (previously known as Rockall Trough and Rockall Basin) is an up to 6 km thick, late Paleozoic–Mesozoic sedimentary basin with an asymmetric, dominantly down–southeast, half-graben geometry (Kimbell et al., 2016; Musgrove & Mitchener, 1996; Shannon et al., 1999; Shannon et al., 2020). Cenozoic lavas are generally thin or absent. Instead, the center of the basin was intruded by Cenozoic sills (Edwards, 2002; Musgrove & Mitchener, 1996). In contrast, the Northern Rockall, West Lewis, and possibly Hatton basins are covered by a few km thick succession of Cenozoic lava flows (Hitchen & Stoker, 1993; Hitchen et al., 1997; Kimbell et al., 2016; Musgrove & Mitchener, 1996; Waddams & Cordingley, 1999). These basins consist of up to several km thick upper Paleozoic–Mesozoic sedimentary rocks partly penetrated by exploration wells below the Cenozoic lavas. The Northern Rockall Basin defines a left step (i.e., to the northwest) with the main branch of the Permian–Triassic to Mesozoic rift system in the south, the Southern Rockall Basin (
Figure 1a–b; Davison et al., 2010; Hitchen, 2004; Waddams & Cordingley, 1999).
Northern Scotland
The bedrock in northern Scotland consists dominantly of Archean–Paleoproterozoic rocks of the Lewisian Complex such as gneiss, anorthosite, granulite, charnockite, and amphibolite (e.g., Evans, 1965; Evans & Lambert, 1974; Frazer, 1977; Sutton & Watson, 1950; Tarney & Weaver, 1987; Weaver & Tarney, 1980). These were first affected by granulite-facies metamorphism during the Badcallian event at ca. 2.8–2.7 Ga (Corfu et al., 1994; Park, 1970; Zirkler et al., 2012). They were partly retrogressed to amphibolite facies during the Inverian event at ca. 2.6–2.4 Ga (e.g., Attfield, 1987; Barooah & Bowes, 2009; Corfu et al., 1994; Coward & Park, 1987; Evans & Lambert, 1974; Park, 1970; Storey et al., 2010), which might be part of the Badcallian event, reflecting cooling to amphibolite-facies conditions (e.g., Love et al., 2004; Zirkler et al., 2012). Badcallian–Inverian contraction initiated the formation of major, WNW–ESE-striking, ductile fabrics, including tens of km-wide thrusts (Attfield, 1974; Corfu et al., 1994; Evans & Lambert, 1974; Love et al., 2004; Sutton & Watson, 1950). These were later reactivated into subvertical strike-slip shear zones during the late Paleoproterozoic during the Laxfordian Orogeny (e.g., Attfield, 1987; Coward & Park, 1987; Zirkler et al., 2012). Further tectonic reworking and overprinting, including mylonitization, occurred in the (late) Neoproterozoic (Storey et al., 2004). During the Caledonian Orogeny, preexisting structures and rocks of the Lewisian Complex were partly reactivated, truncated, and/or reworked by NE–SW- to NNE–SSW-striking folds and thrusts (e.g., Bird et al., 2016; Brewer & Smythe, 1984; Coward, 1980; Coward, 1990; Coward et al., 1980). Further folding occurred in the Cenozoic around igneous centers (e.g., Friend et al., 1963; Longman & Coward, 1979).
Methods
The present study uses 2D seismic reflection data from TGS (e.g., Koehl et al., 2024a) and the British Geological Survey (e.g., Smallwood et al., 1998; Staples et al., 1997), and magnetic data from the NAG-TEC consortium (Gaina et al., 2017; Hopper et al., 2014; Nasuti & Olesen, 2014a; Nasuti & Olesen, 2014b). Seismic reflection data were interpreted using Petrel (version 2021.3). An open-source alternative is OpendTect. Magnetic data were interpreted using GlobalMapper (version 13.0). The figures were designed with CorelDraw (version 2017). QGIS and GIMP are open-source alternative software.
The seismic and magnetic facies of the interpreted tectonic structures are described in previous studies, in which they were tied to structural trends onshore and to offshore exploration wellbores (Koehl, 2021; Koehl, 2025; Koehl et al., 2019; Koehl et al., 2022; Koehl et al., 2023a; Koehl et al., 2023b; Koehl et al., 2024a; Koehl & Stokmo, 2024). The reader is referred to these studies for more detailed descriptions of the interpreted structures.
Sub-basalt units in Iceland and the Greenland–Iceland–Faroe Ridge are yet to be penetrated by drilling. The deepest wells onshore Iceland terminated in Cenozoic basaltic lavas (IDDP and Reyðarfjörður wellbores in
Figure 1a–b; Friðleifsson, 1982; Friðleifsson et al., 2017; Robinson et al., 1982). Offshore, two DSDP 38 wellbores were drilled in the Iceland–Faroe Ridge and terminated in Cenozoic sediments and basalts (wellbores 336 and 352 in
Figure 1a–b; Talwani et al., 1976). Correlations in the study area are thus based on the geology of adjacent onshore areas (e.g., northern Scotland, southeastern Greenland, Iceland, and the Faroe Islands) and previous offshore studies (e.g., Koehl et al., 2024a). Our interpretation is based on the previous detailed description of the internal geometry of thrust systems (Koehl et al., 2022; Koehl et al., 2023a; Koehl, 2025; Koehl and Stokmo, 2024) and mylonitic thrusts in metamorphosed basement rocks in seismic reflection data (Christensen, 1965; Fazlikhani et al., 2017; Fountain et al., 1984; Hedin et al., 2016; Hurich et al., 1985; Koehl et al., 2018; Phillips et al., 2016). The structural orientations refer to present-day coordinates. High-resolution versions of the seismic transects (
Figure 2a–f) are available on Zenodo (https://doi.org/10.5281/zenodo.20606344; Koehl, 2025) and of the data around the Faroe Islands on DataverseNO (https://doi.org/10.18710/780M9P; Koehl, 2024).
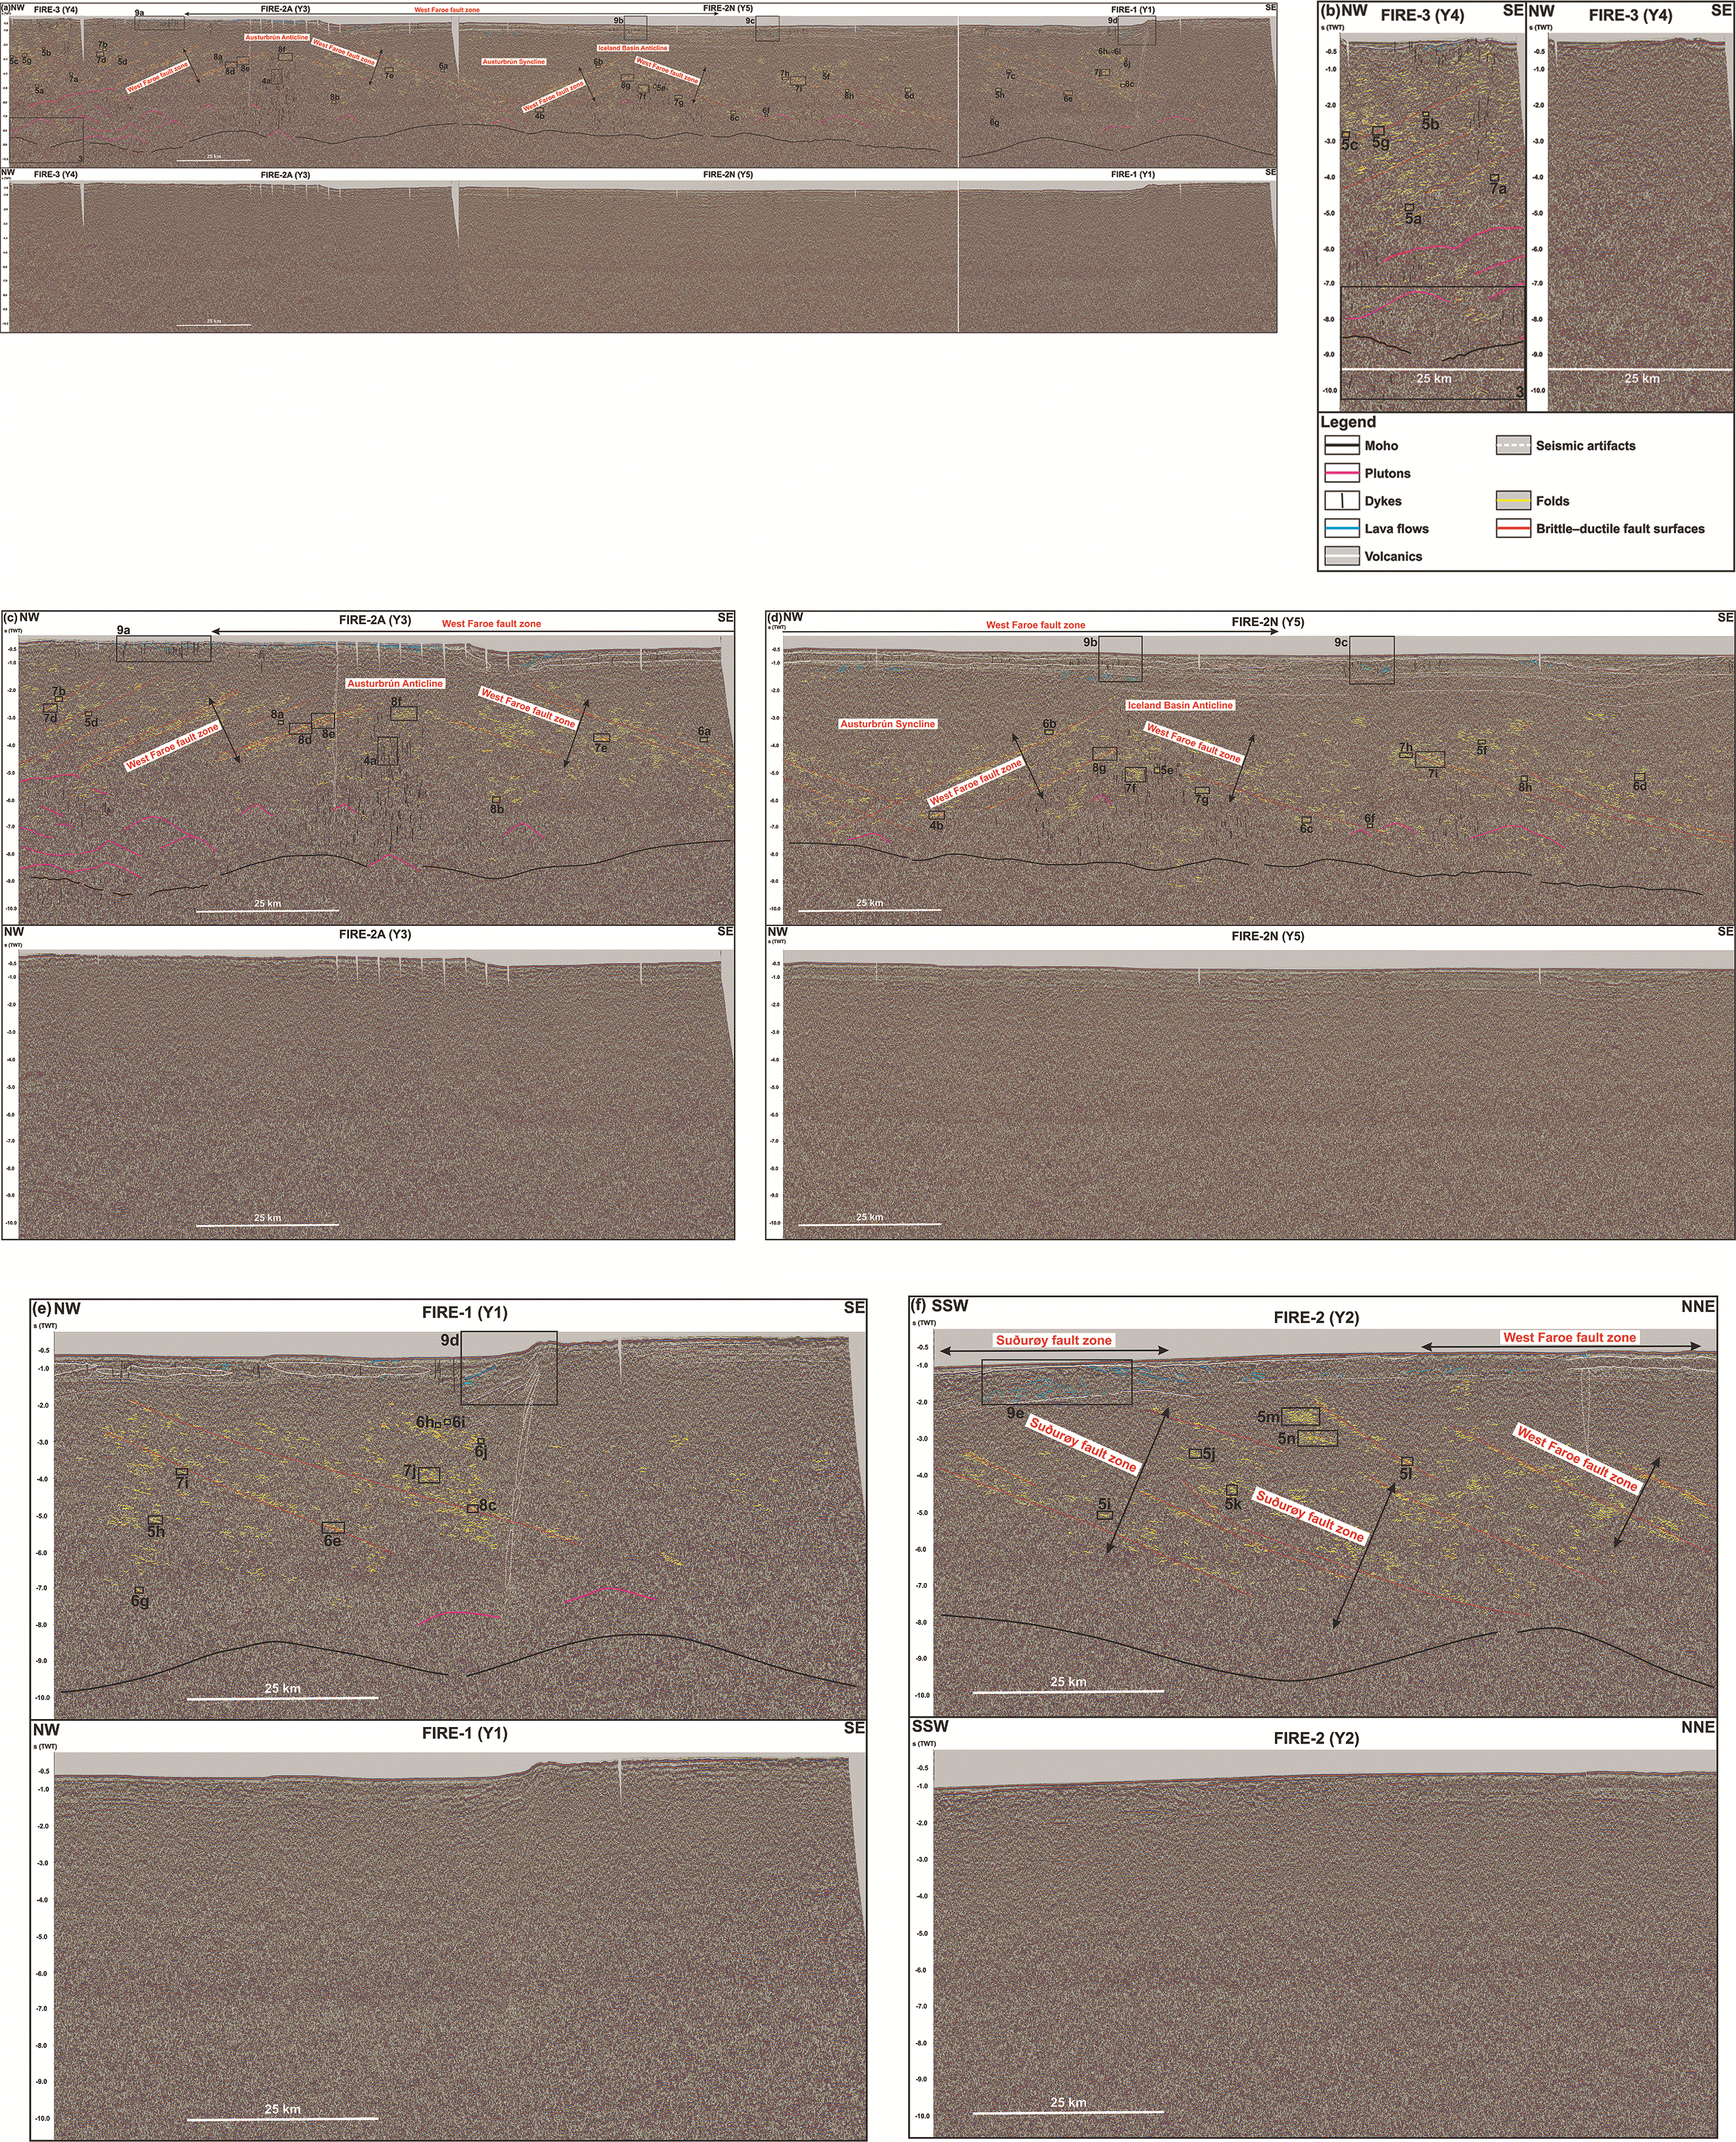
Figure 2. (a) NW–SE-striking FIRE seismic reflection transect along the Iceland–Faroe Ridge (lines FIRE-3 – Y4, FIRE-2A – Y3, FIRE-2 N –Y5, and FIRE-1 – Y1 from northwest to southeast).
Legend is shown in (b) and location in
Figure 1a–b. (b) Zoom in line FIRE-3 – Y4. (c) Zoom in line FIRE-2A – Y3. Legend is shown in (b). (d) Zoom in line FIRE-2 N – Y5. Legend is shown in (b). (e) Zoom in line FIRE-1 – Y1. Legend is shown in (b). (f
) NNE–SSW-striking FIRE seismic reflection transect across the Iceland–Faroe Ridge (line FIRE-2 –Y2). Legend is shown in (b) and location in
Figure 1a–b.
The frequency of the FIRE (Faroe–Iceland Reflection Experiment) 2D seismic reflection data from the BIRPS (British Institutes Reflection Profiling Syndicate; now at the British Geological Survey) at a depth of 10 km is 30 Hz (Western Geco, 1996) and seismic velocity within Paleoproterozoic metamorphic rock units overall 6300–6500 m.s−1 (i.e., c. 6400 m.s−1; Bamford, 1979; Luckett & Baptie, 2015; Watson & Dunning, 1979) and up to 6300–6800 m.s−1 in mylonites (Kästner et al., 2020 their table 2; Siegesmund et al., 1991). These indicate that the vertical resolution of the seismic data (1/4 of the wavelength) is c. 53.3 m (6400/30/4). In places, the vertical resolution of seismic data may be as good as 1/32 of the wavelength (Kallweit & Wood, 1982; Li & Zhu, 2000), i.e., up to c. 6.7 m in the present case (6400/30/32). The horizontal resolution of the data at a depth of 5000 m is c. 730 m ((5000 × (6400/30/2))1/2; Geldart & Sheriff, 2004). The studied structures (e.g., asymmetric folds in major shear zones and thrusts) are >500 meters wide and > 150 meters thick. They are thus well within the vertical and horizontal resolution of the dataset even at depth > 5000 m. The vertical and horizontal resolution of 2D seismic survey OF95RE11 (TGS) are respectively c. 39 m (up to c. 5 m) and c. 627 m (Koehl et al., 2024a; Nicholson, 2012).
The NAG-TEC magnetic dataset is compiled from surveys acquired with different line spacing (from 200 m to 50 km) and flying altitude (from near sea level to 4100 m above sea level (Nasuti & Olesen, 2014a). More details about the data are included in Hopper et al. (2014).
Results
Seismic reflection data
Description
Moho
In the northwesternmost part of the Iceland–Faroe Ridge, a set of 10 km wide, bright, high-amplitude, undulating reflections occurs at a depth of 8.5–9.5 seconds (TWT; fuchsia lines in
Figure 2a–e and
Figure 3). This equates to a depth of c. 25.5–33.3 km assuming an average seismic velocity of 6–7 km.s−1 for the entire crust at the Iceland–Faroe Ridge; Bohnhoff & Makris, 2004). These reflections are abundant up to 50–55 km southeast of Iceland but are sparse farther southeast (
Figure 2a–e).
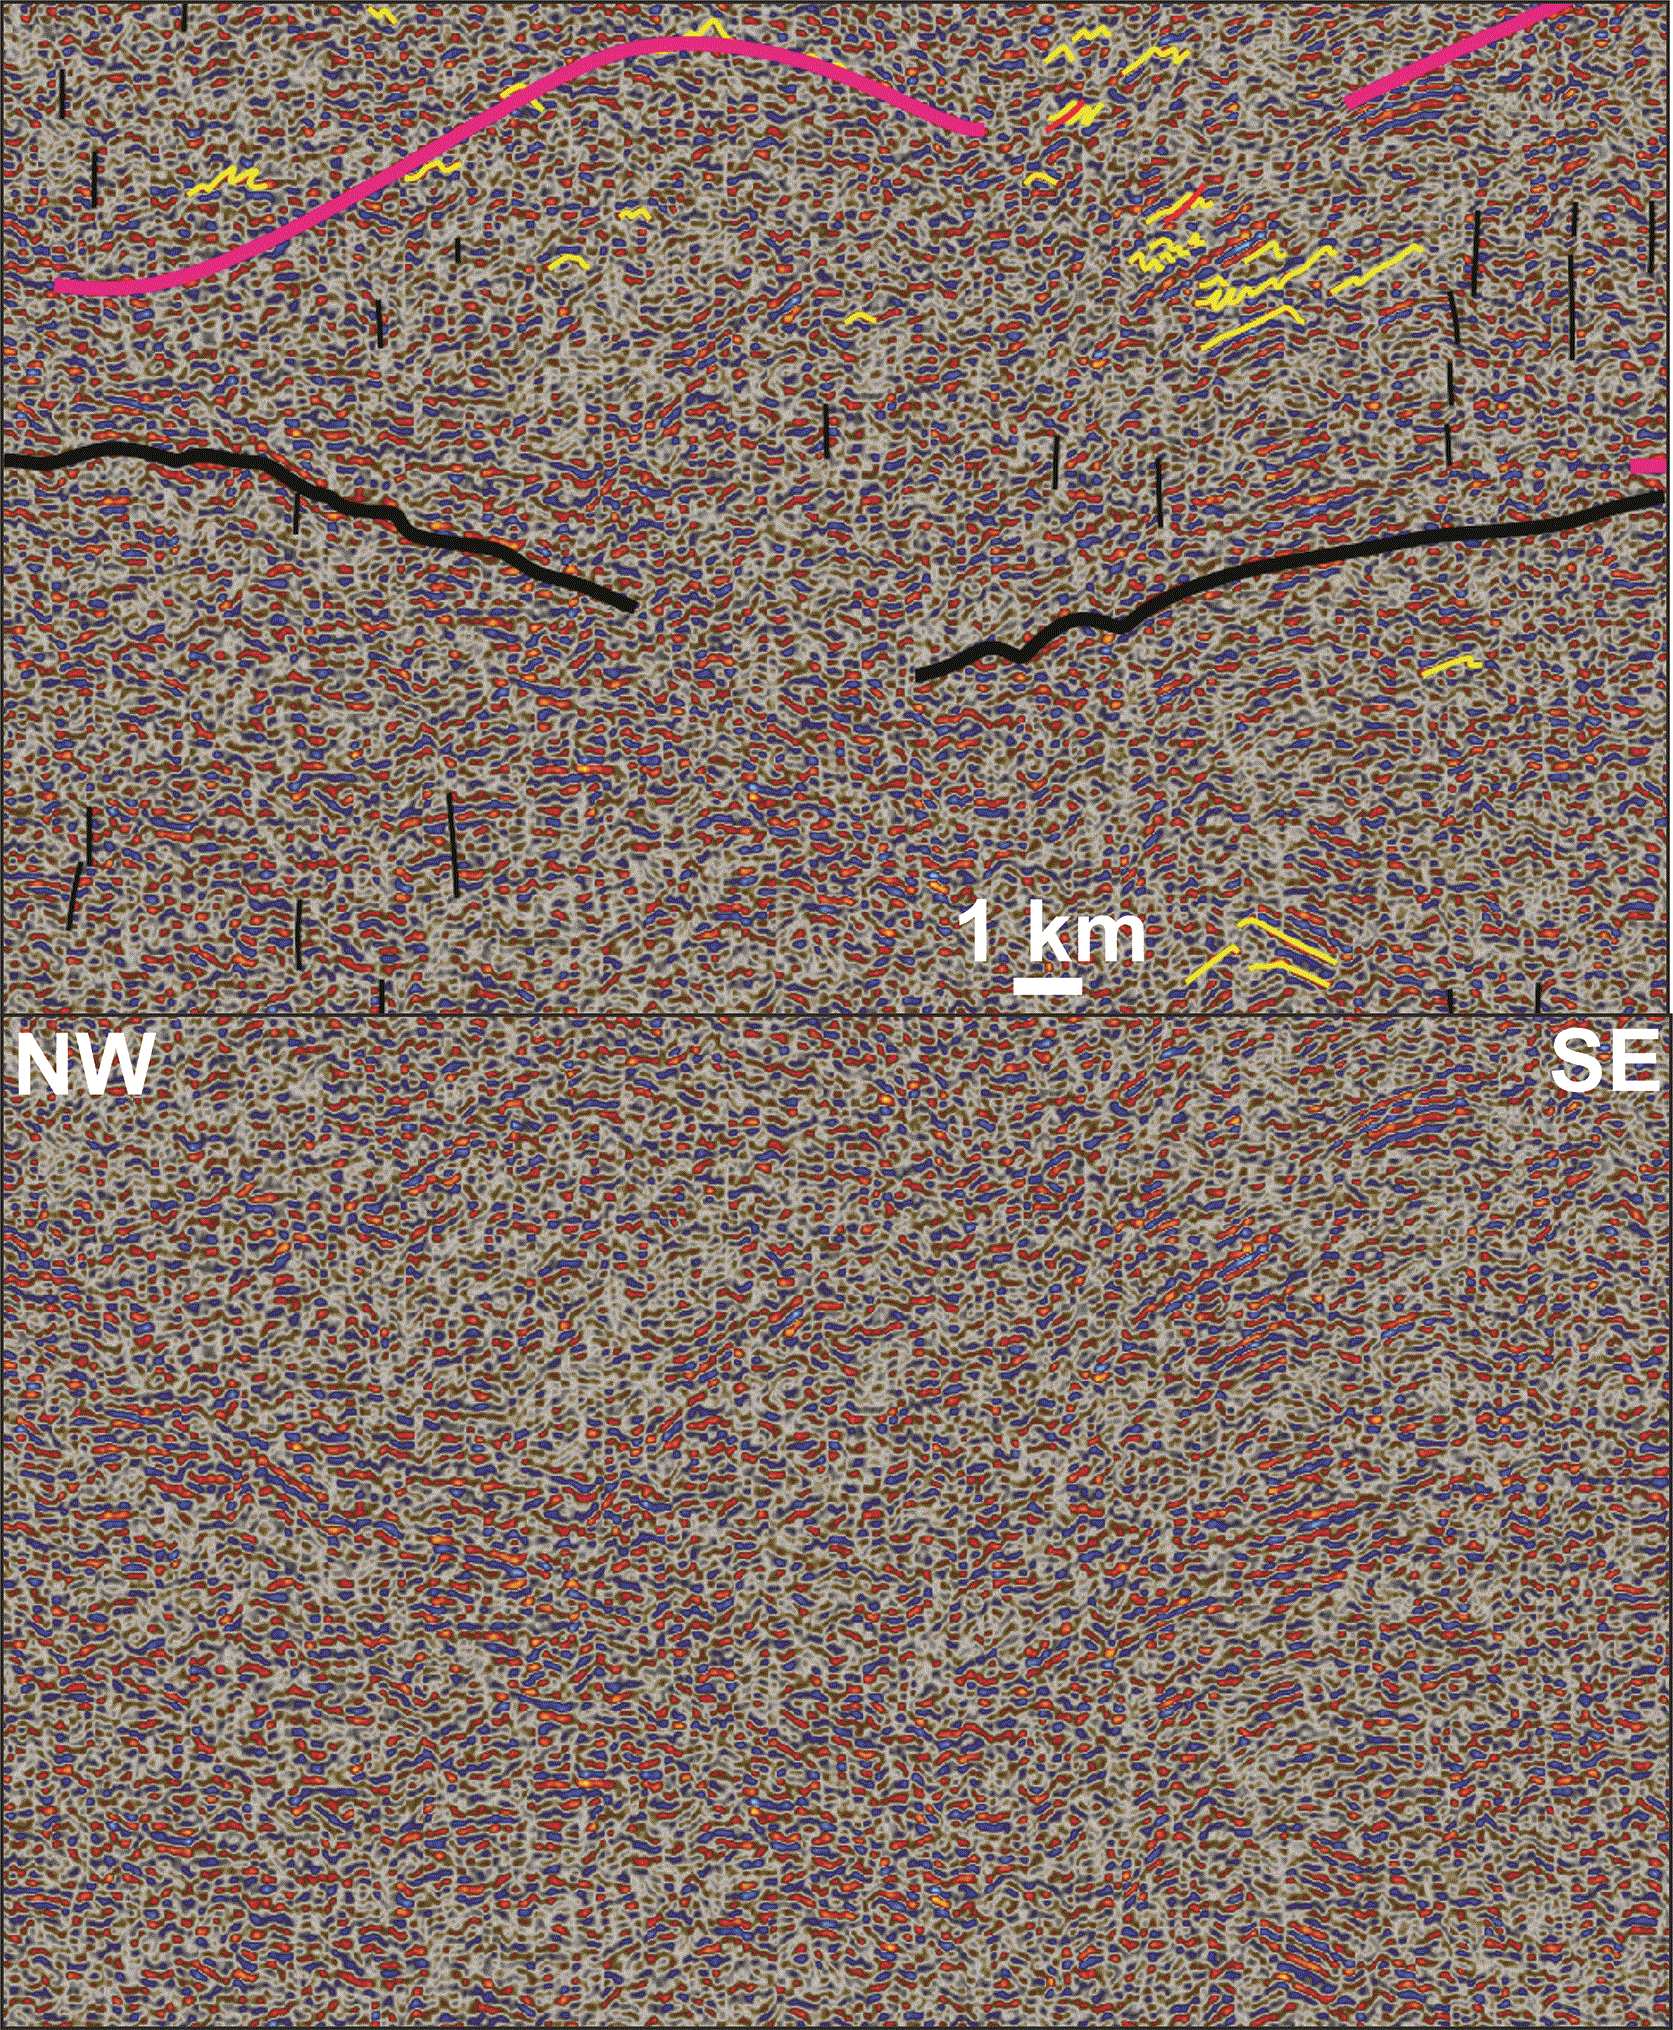
Figure 3. Interpreted (up) and uninterpreted (down) zoom in the northwestern end of the NW–SE-striking FIRE seismic transect showing a relatively reflective Moho near Iceland and lensoidal, upward-curving packages interpreted as possible plutons.
The transect also shows potential folding of the mantle rocks (yellow lines below the Moho). Location is shown in
Figure 2a–b.
Mid–lower crust
Directly above the high-amplitude undulating reflections at 8.5–9.5 seconds (TWT) depth southeast of Iceland, seismic reflection data show 5–10 km wide, c. 1.0 second (TWT) thick, dome-like, lensoidal packages of slightly increased reflectivity at depths of 5.0 to 8.5–9.5 seconds (TWT;
Figure 2a–e). In the northwest, these lensoidal packages are stacked onto one another but become more difficult to track farther southeast due to decreasing reflectivity (
Figure 2a–e).
Above the 8.5–9.5 second-deep, high-amplitude, undulating reflections and dominantly at depths of 8.0 seconds up to 3.0–4.0 seconds (TWT), the crust consists dominantly of moderate- to high-amplitude reflections showing asymmetric (subsidiary symmetric), curving-up or Z- to S-shaped geometries (yellow lines in
Figure 2a–f). Such reflections are also found in places below the 8.5–9.5 second-deep, high-amplitude, undulating reflections (
Figure 2a–f). These reflections display a wide range of geometrical variations, ranging from open symmetric (
Figure 3 and
Figure 4a–b) to tight recumbent isoclinal (
Figure 4a–b,
Figure 5a–n,
Figure 6a–j,
Figure 7a–j, and
Figure 8a–h), including double-vergence geometry (
Figure 5e). In the northwest, some curving-up reflections are observed at a depth of 0.5 second (TWT; i.e., c. 1.5 km assuming an average seismic velocity of 6 km.s−1 for lava-dominated upper crust at the Iceland–Faroe Ridge – Bohnhoff & Makris, 2004;
Figure 2a–e), where the seabed reflection displays a rugose to undulating geometry (
Figure 9a).
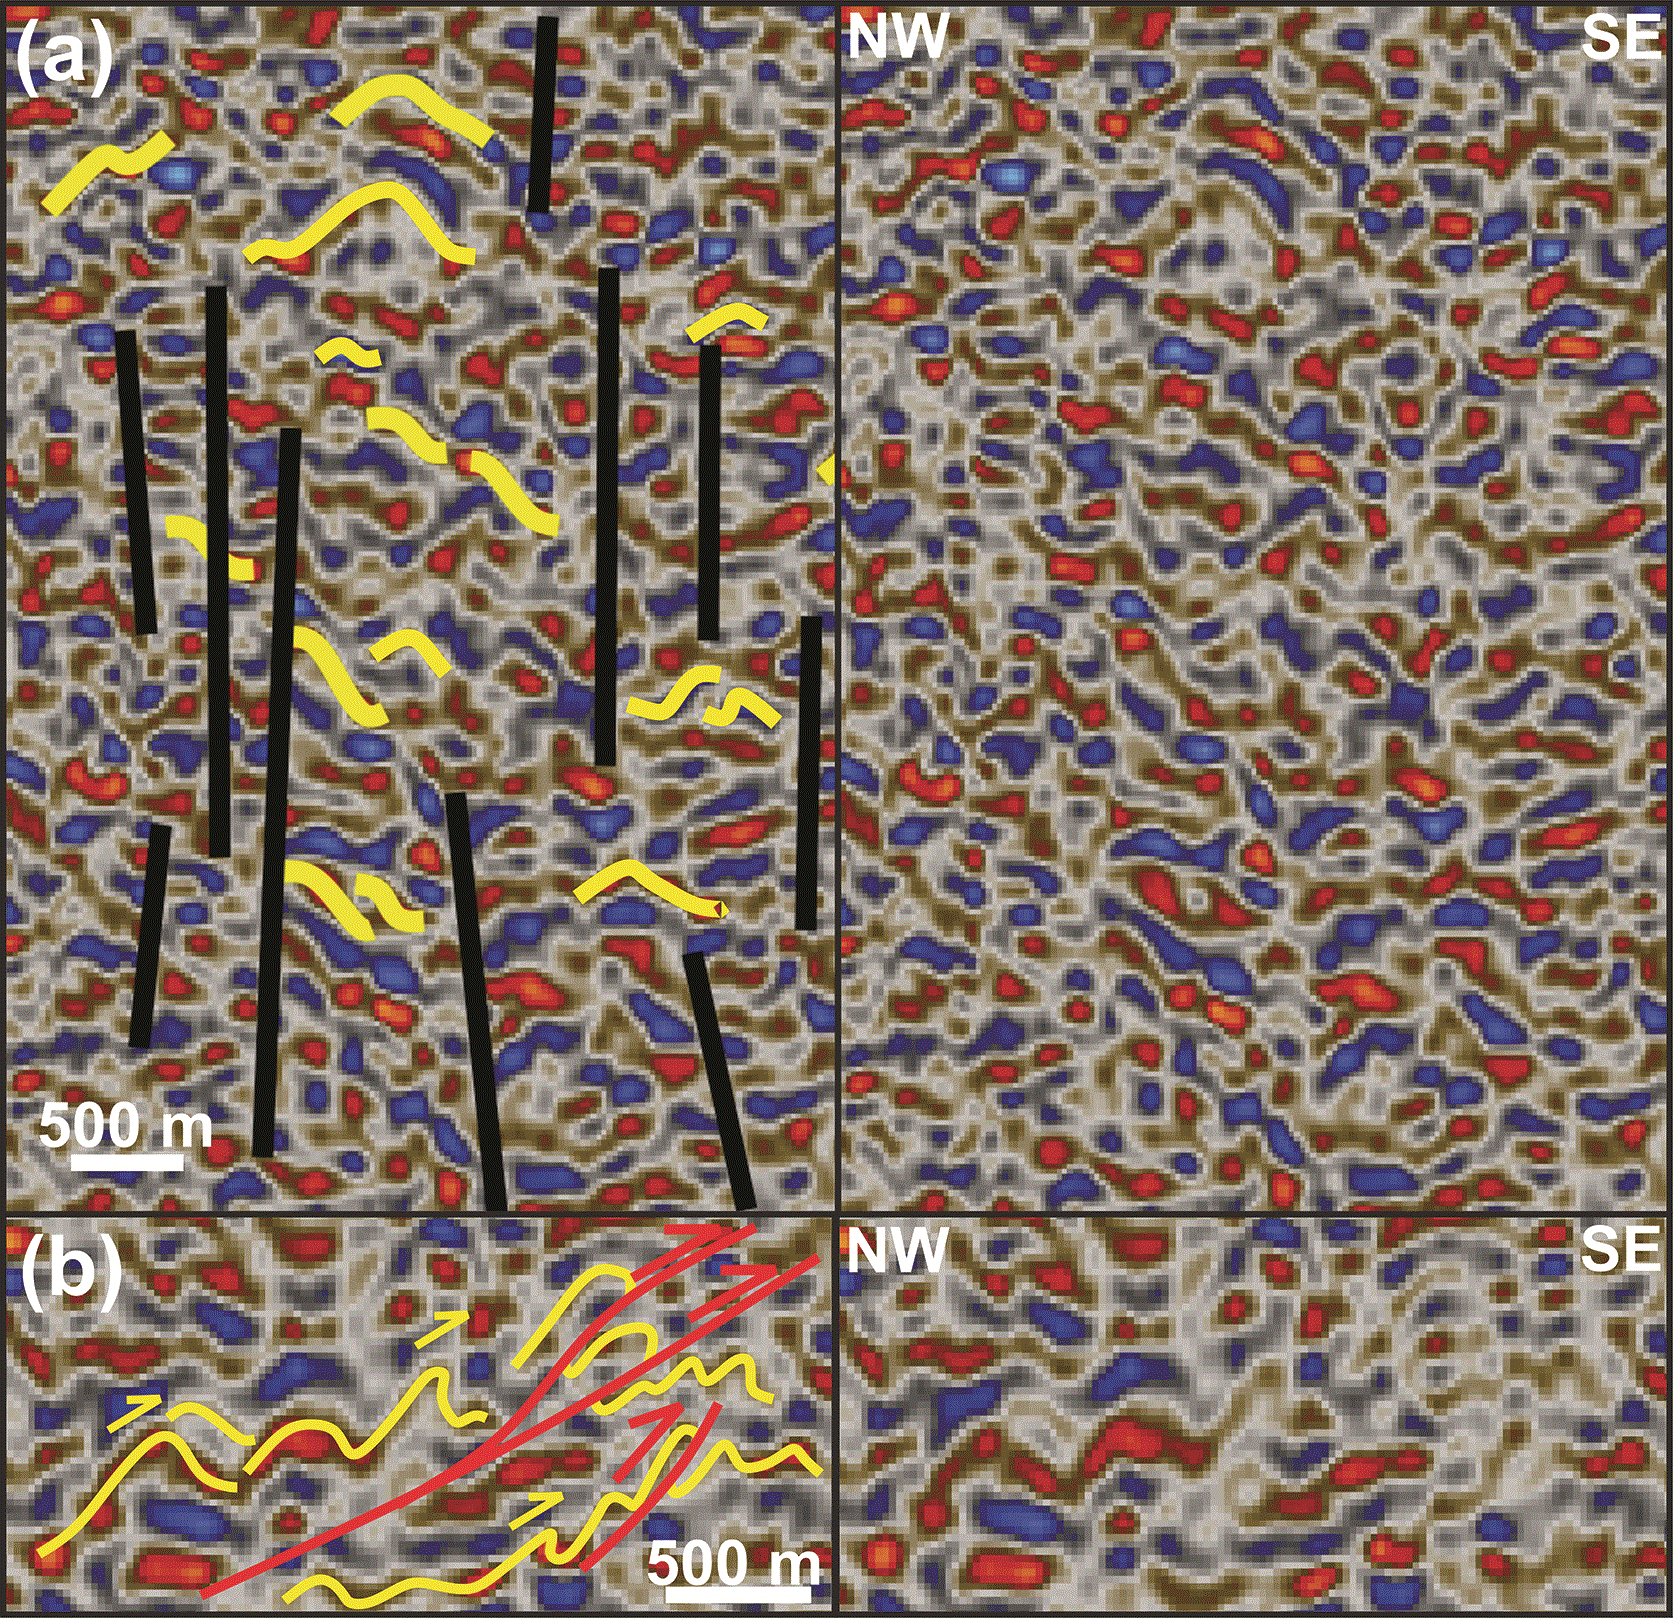
Figure 4. Interpreted (left hand side) and uninterpreted (right hand side) zoom in (a) symmetric folds truncated by subvertical disruptions interpreted as dykes in the hinge of the Austurbrún Anticline (anticline “m” in
Figure 1b), and (b) symmetric folds (lower right corner) transitioning to top-southeast asymmetric folds offset by minor top-southeast brittle thrusts, including a floor décollement and a ramp thrust (McClay, 1992).
Locations are shown in
Figure 2a and c–d.
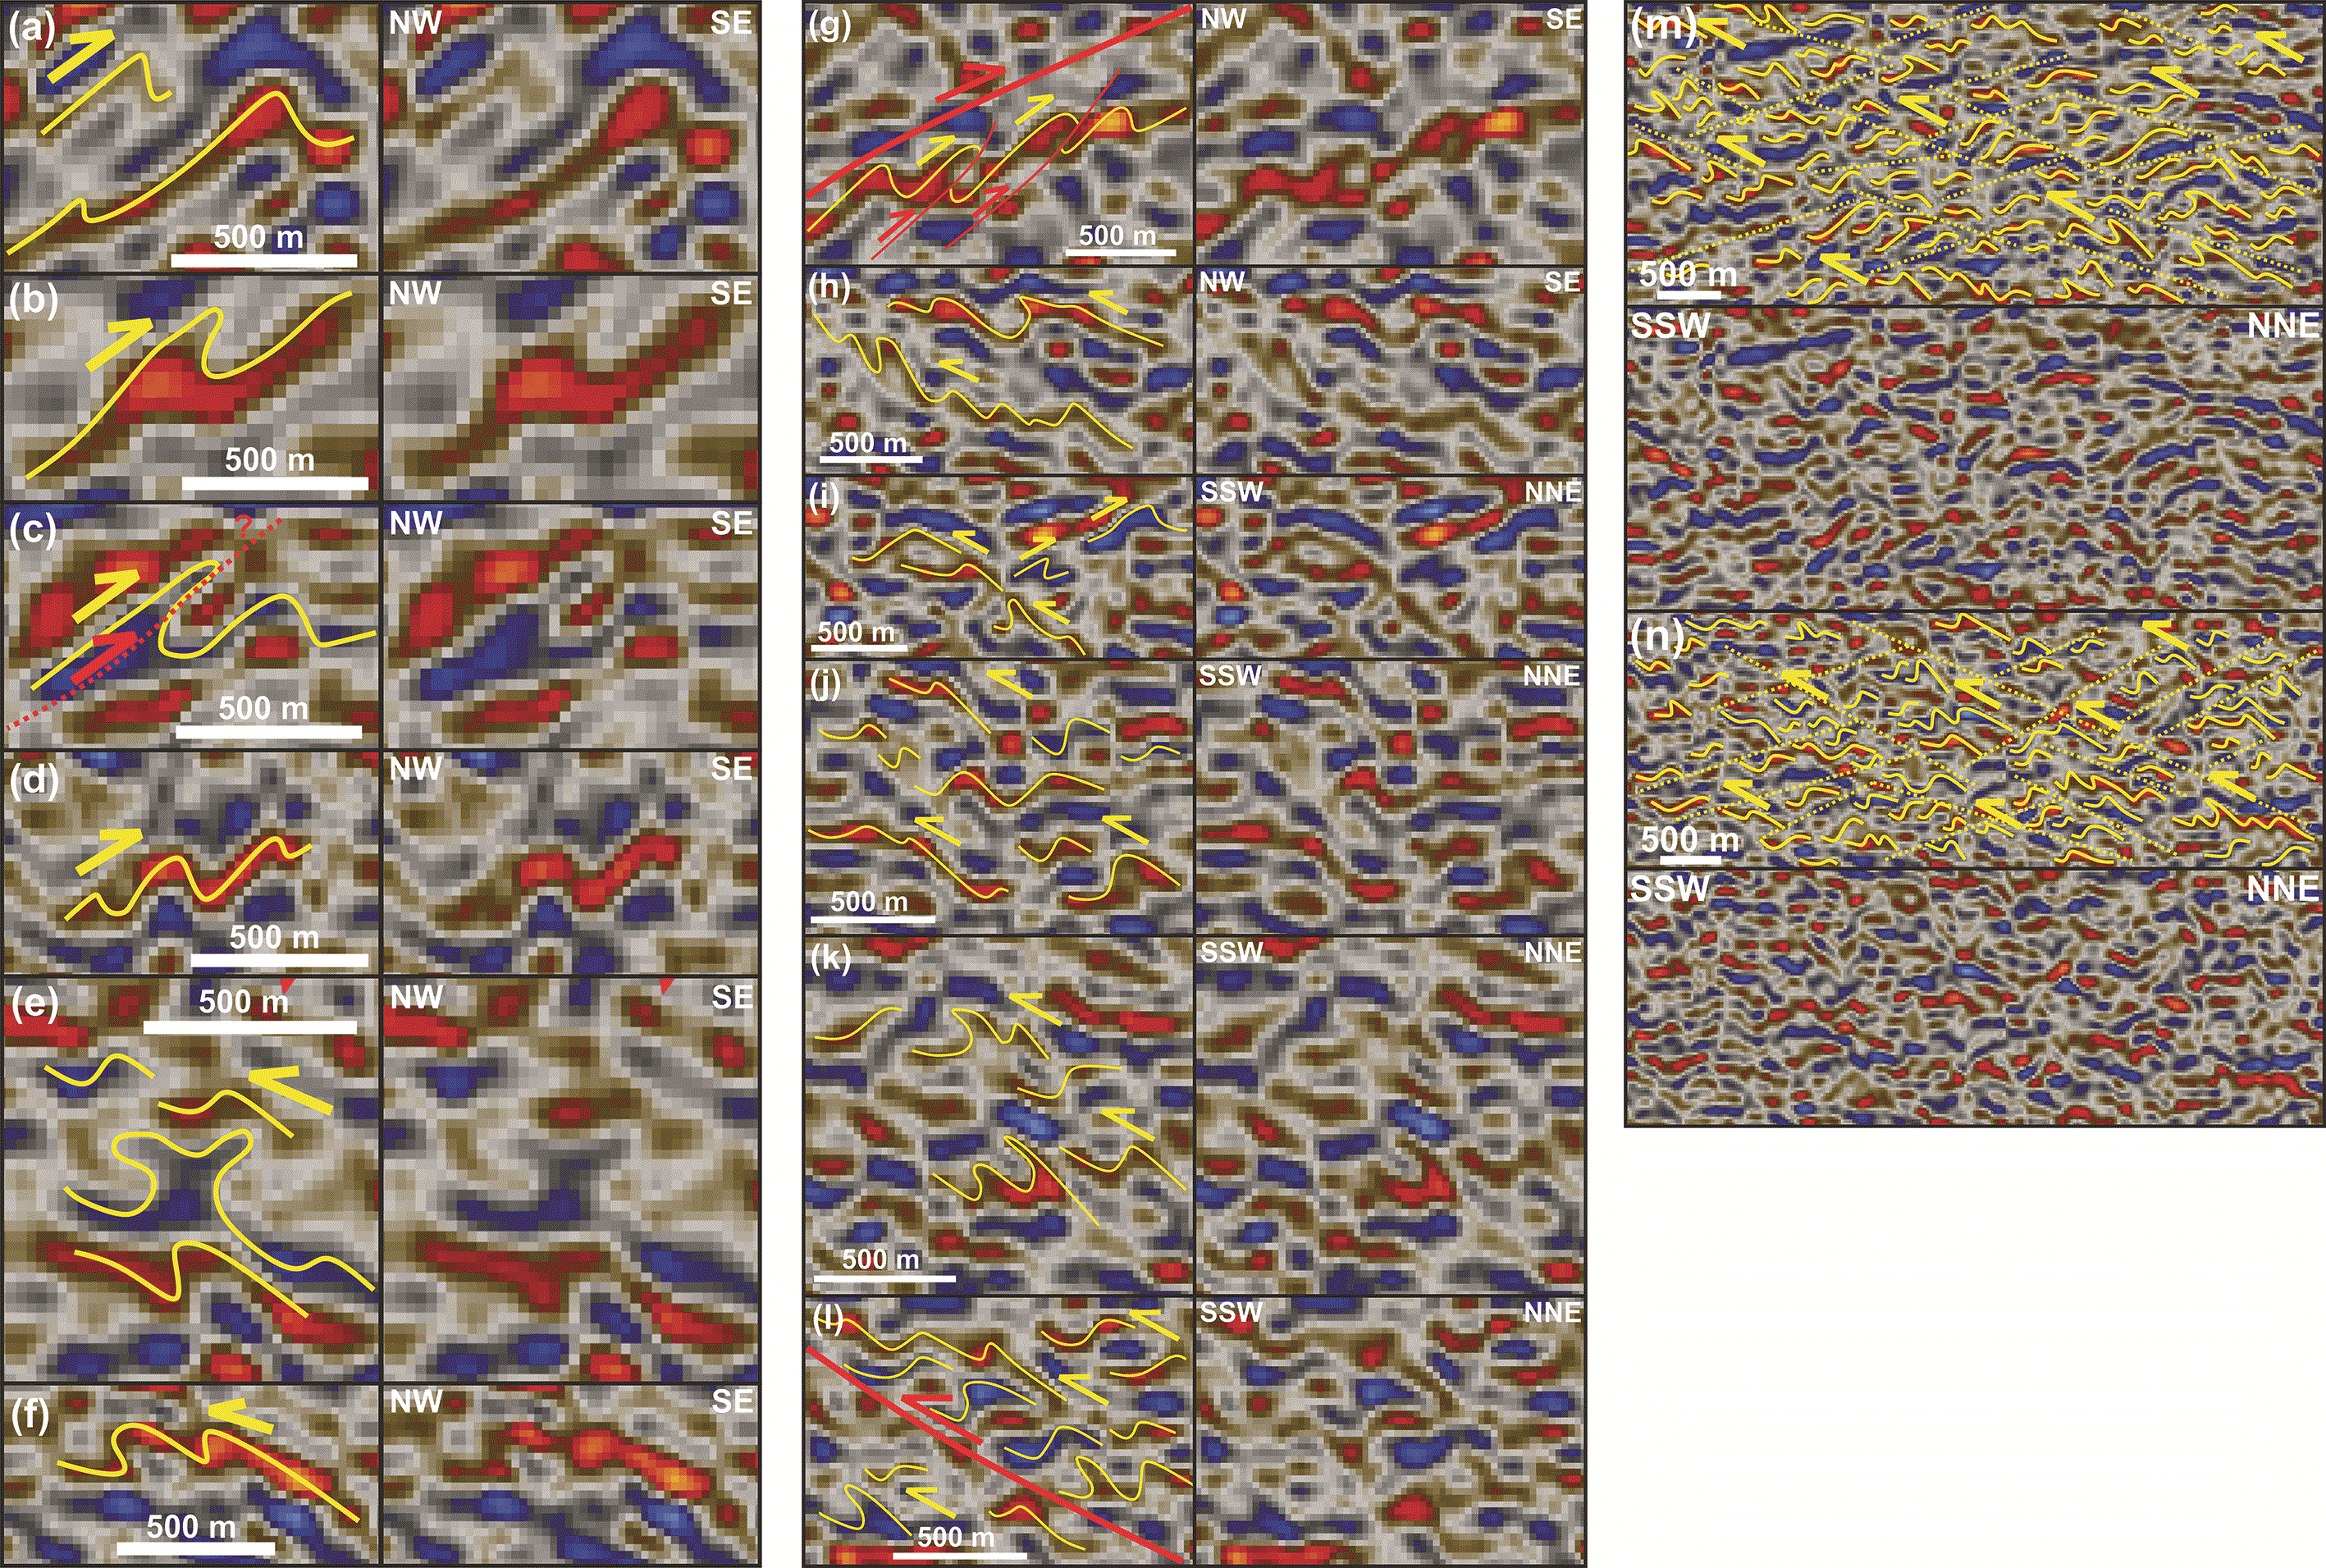
Figure 5. Interpreted (left hand side in a–l and up in m–n) and uninterpreted (right hand side in a–l and down in m–n) zoom in seismic reflection data showing various asymmetric fold geometries.
Dominant fold vergence is towards the southeast on the northwestern limb of major anticlines like the Austurbrún and Iceland Basin anticlines (a–d and g) and towards the northwest on the southeastern limb (e–f
), and towards the south-southwest in NNE–SSW-trending cross section (i–n). Notice the possible onset of brittle thrusting in the hinge of the fold in (c) (dotted red line), the double-vergence fold geometry in (e), potential top-southeast offsets along brittle thrusts below a major, northwest-dipping (mylonitic?) thrust surface in (g), arrangement of asymmetric folds into top-SSW, forward-dipping duplexes in (i–j and l–m; Boyer & Elliott, 1982; Koehl, 2021; McClay & Insley, 1986) including above a major, NNE-dipping (mylonitic?) thrust surface in (l), the transition from asymmetric to isoclinal overturned folds towards the south-southwest in (k), and the S–C fabrics created by duplexes’ NNE-dipping top- and floor-décollements and the SSW-dipping, long flanks of the duplex horses (dotted yellow lines) in (m–n). Locations are shown in
Figure 2a–f.
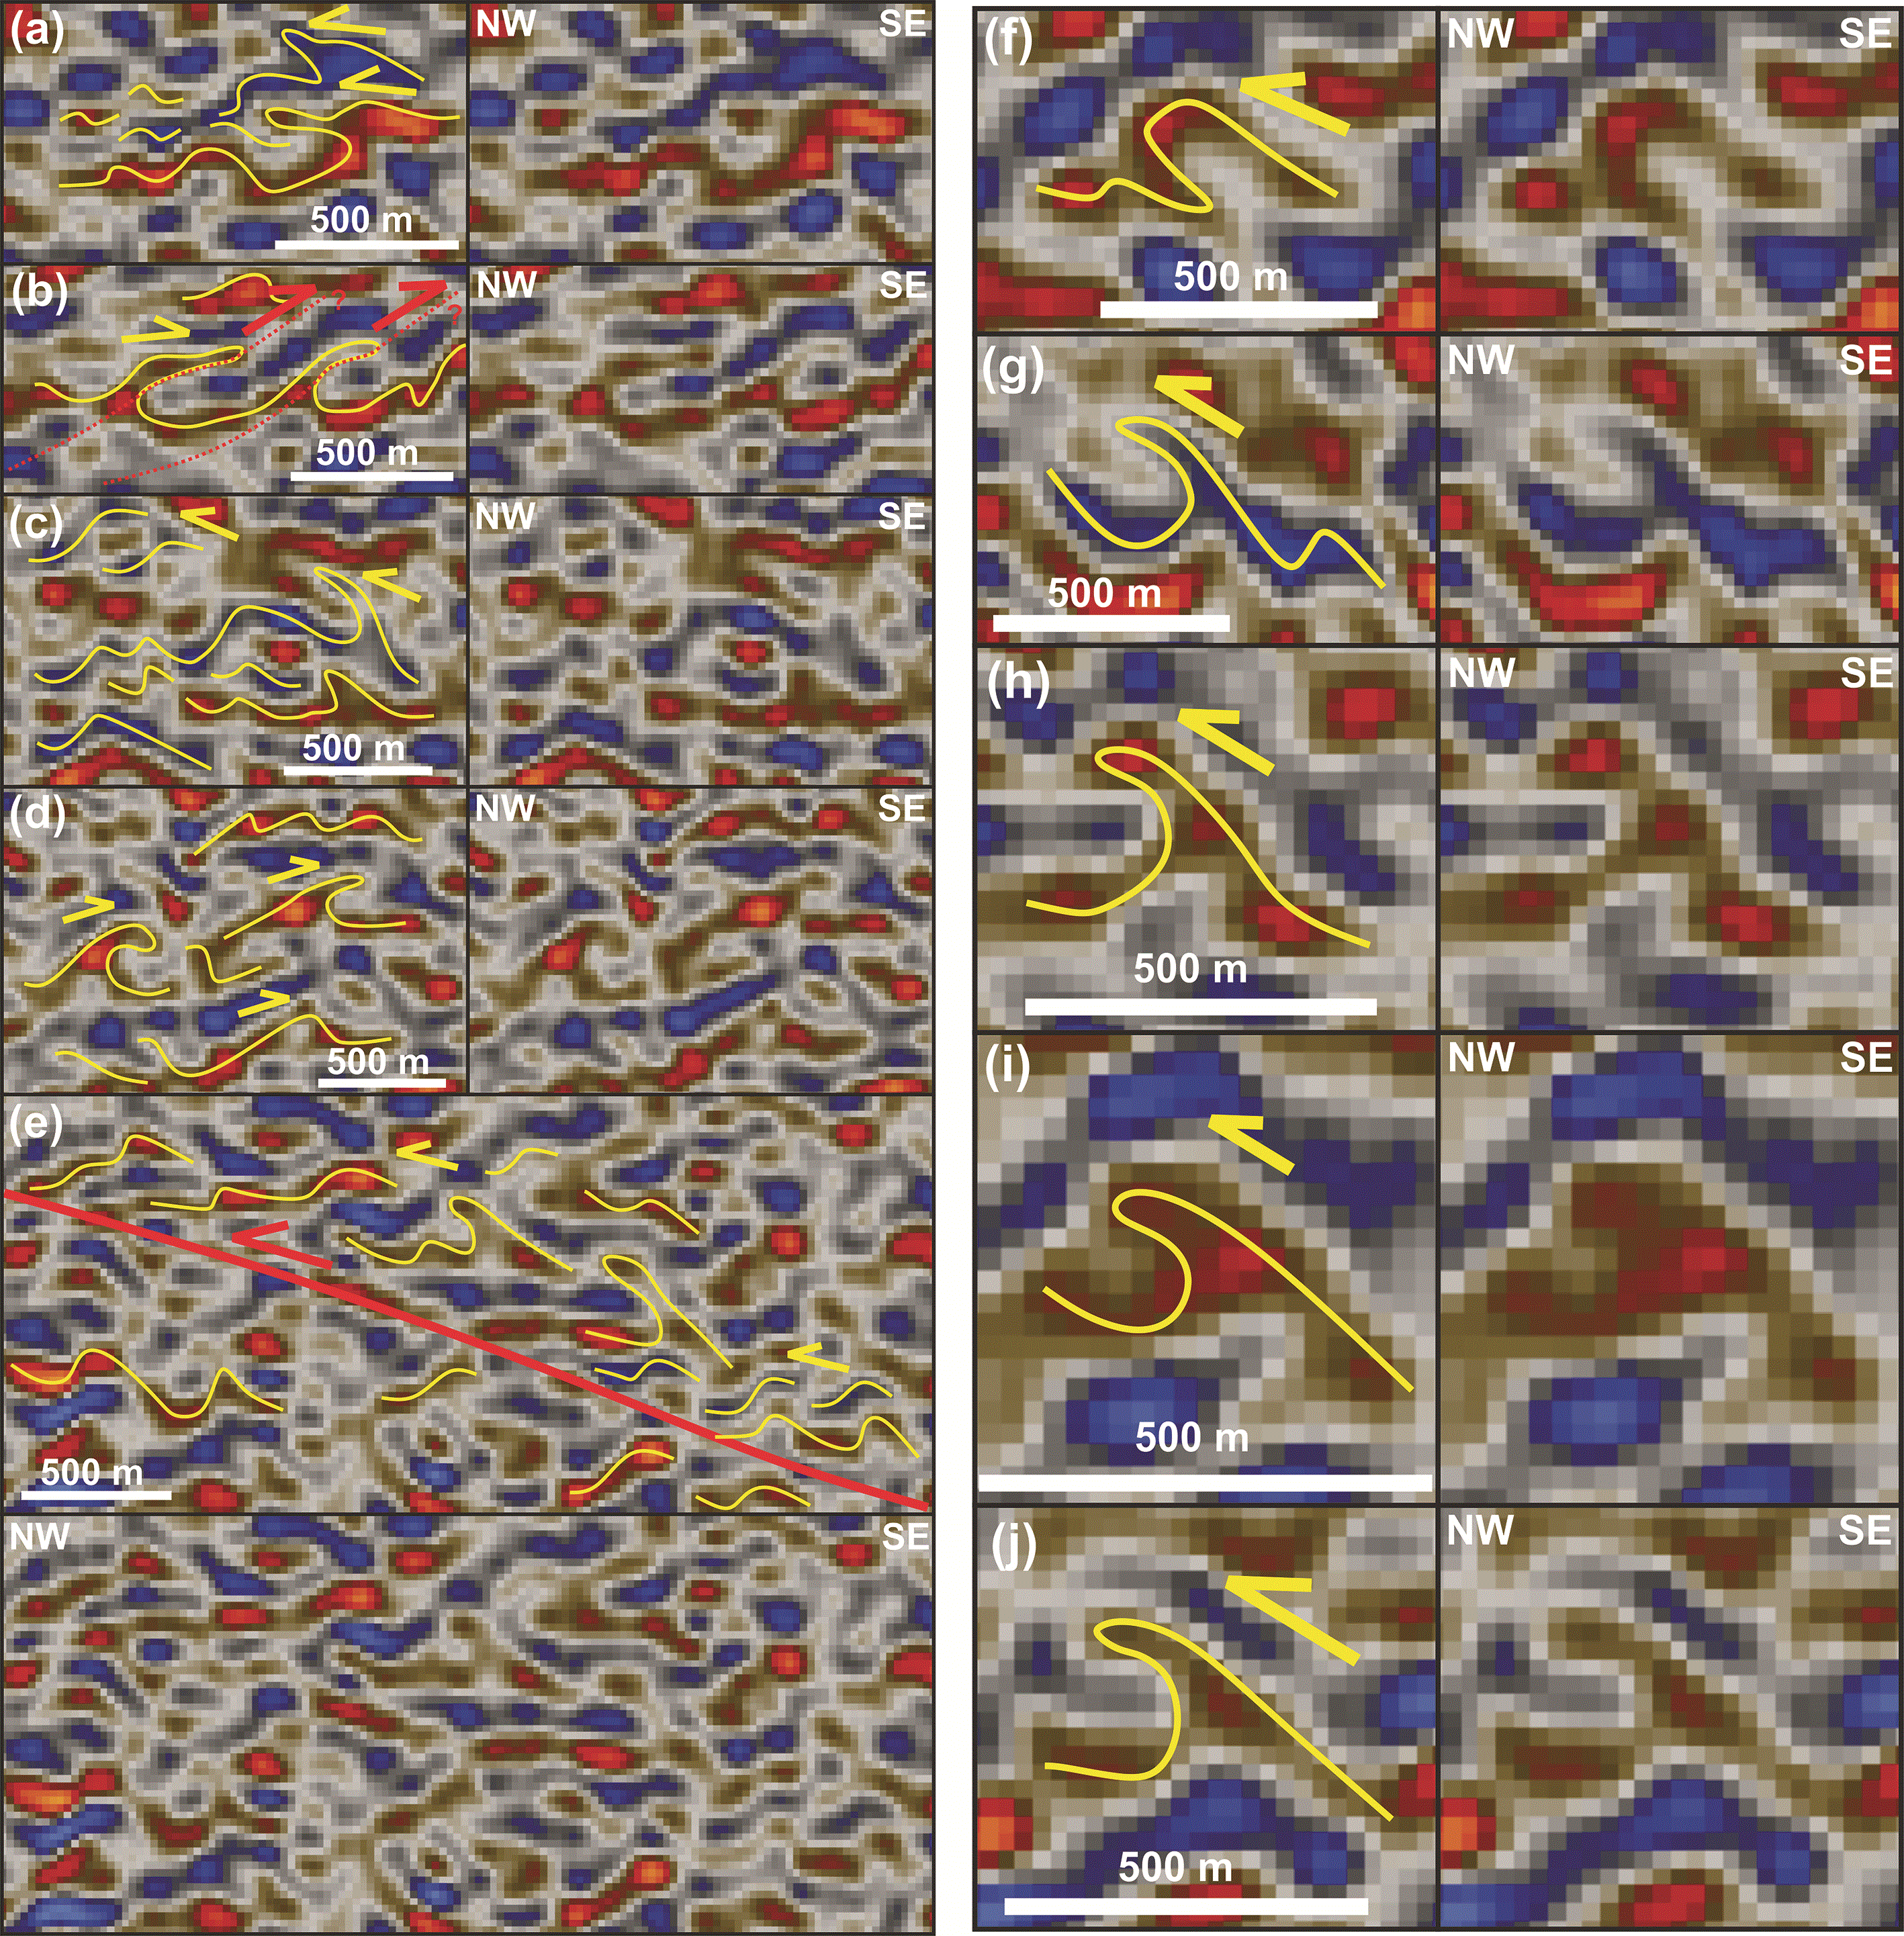
Figure 6. Interpreted (left hand side in a–d and f–j up in e) and uninterpreted (right hand side in a–d and f–j and down in e) zoom in seismic reflection data showing southeast- (b and d) and northwest-verging tight fold geometries (a, c, and e–j) respectively in the northwestern and southeastern limbs of the hundreds of km wide anticlines (e.g., Austurbrún and Iceland Basin anticlines).
Geometries range from overturned to isoclinal recumbent. Notice the near separation of the fold hinges from the base of the two overturned anticlines in the southeast in (a), the possible initiation of top-southeast thrusting in (b), the occurrence of recumbent isoclinal folds in conjunction with a major, southeast-dipping (mylonitic?) thrust surface and related contractional, forward-dipping duplexes in (e), and the classic λ (lambda) shape of the isoclinal, overturned to recumbent folds in (g–j). Locations are shown in
Figure 2a–e.
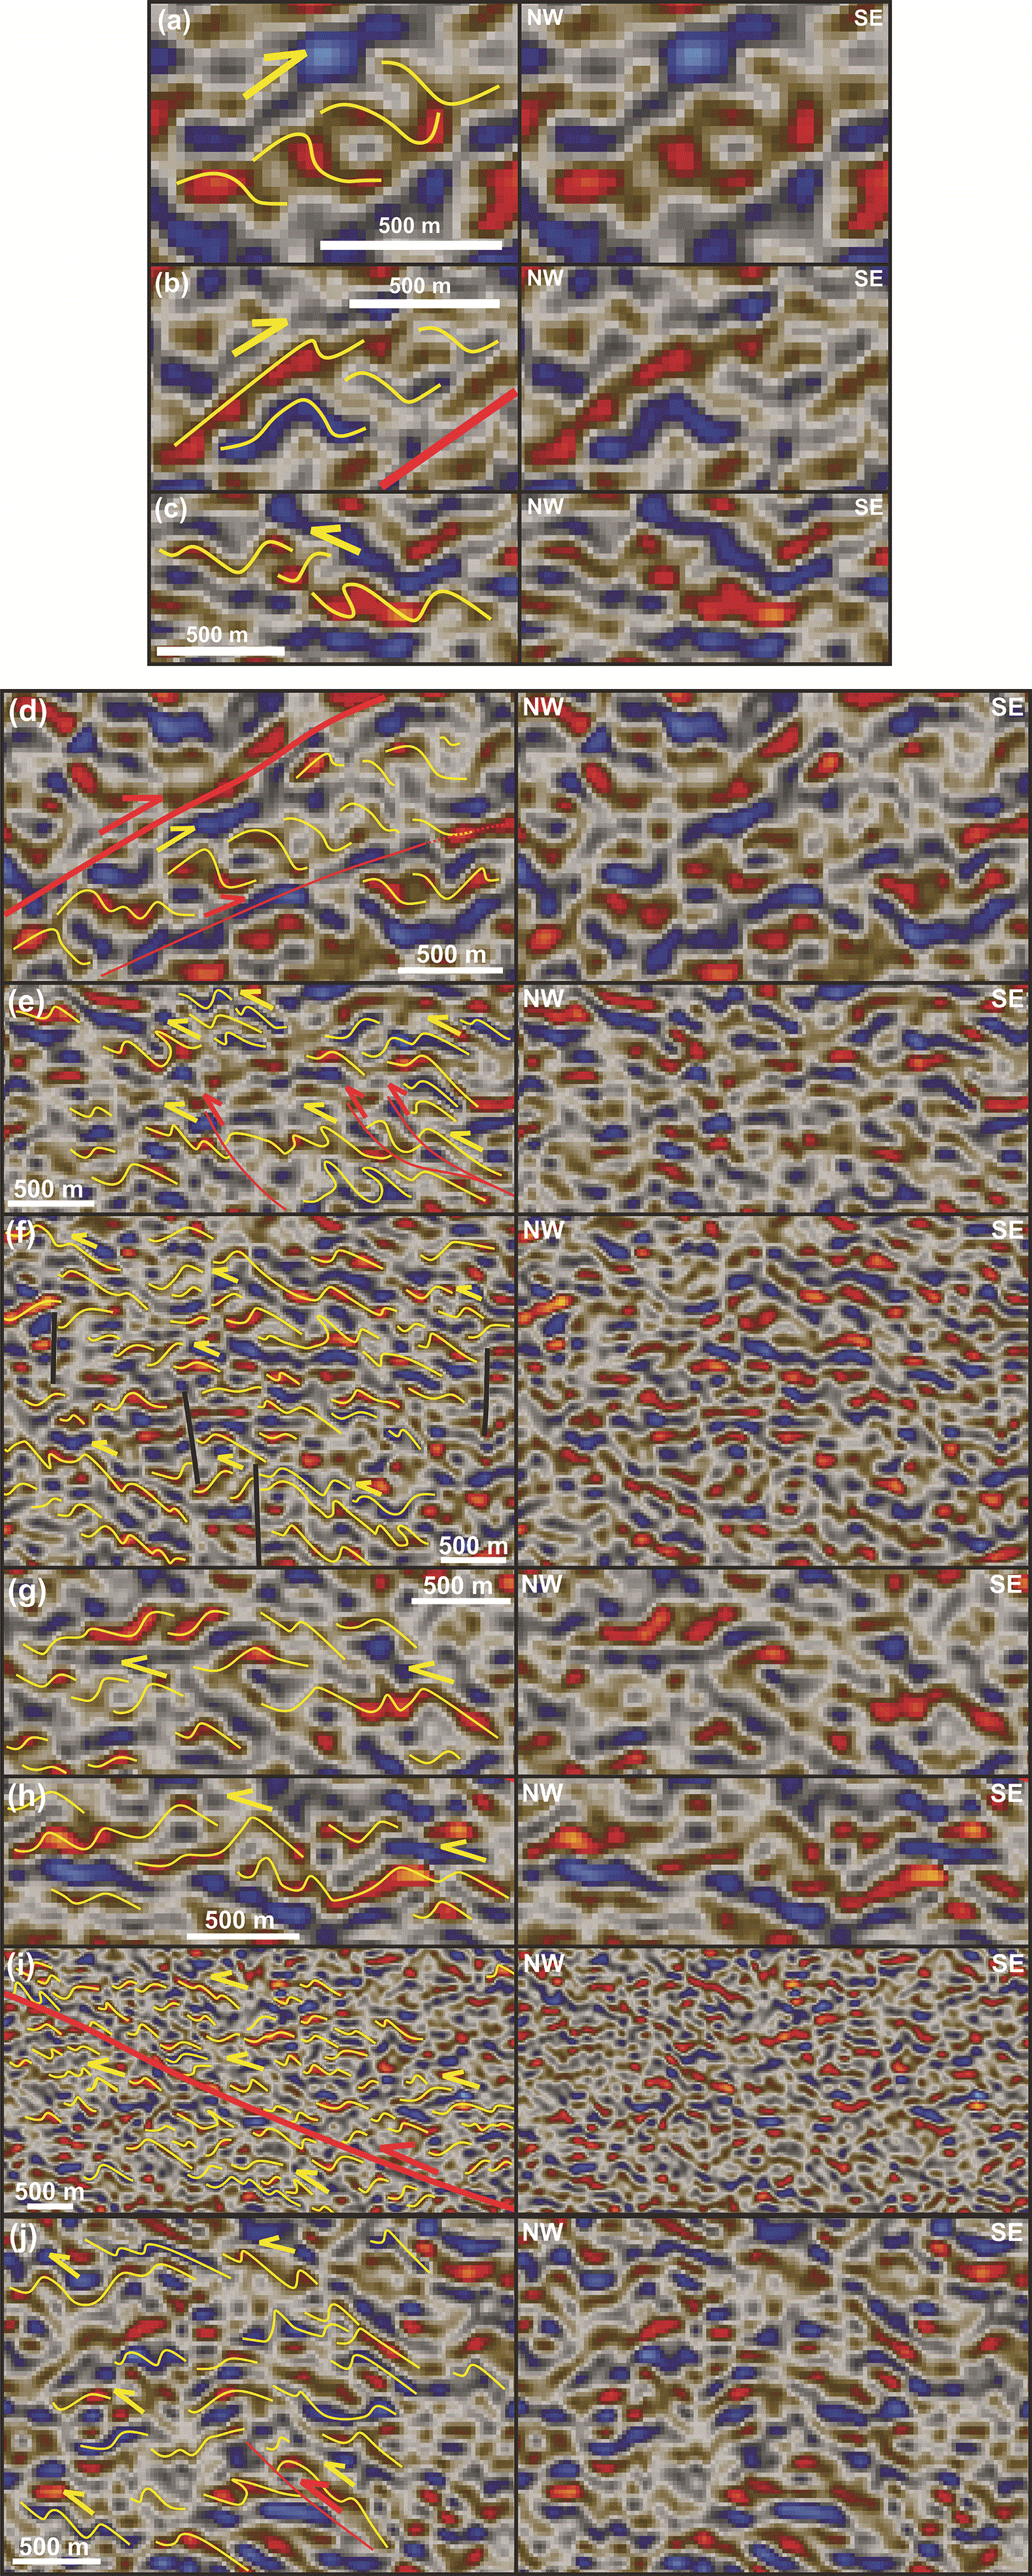
Figure 7. Interpreted (left hand side) and uninterpreted (right hand side) zoom in seismic reflection data showing contractional, dominantly forward-dipping duplexes (Boyer & Elliott, 1982; Koehl, 2021; McClay & Insley, 1986) indicating top-northwest (c and e–j) and top-southeast (a–b and d) kinematics respectively on the southeastern and northwestern limbs of the major, hundreds of km wide, open anticlines (e.g., Austurbrún and Iceland Basin anticlines).
Notice the characteristic S- and Z-like geometries of the duplex horses respectively in top-southeast (a–b and d) and top-northwest duplexes (c and e–j), the northwestwards transition from asymmetric folds to overturned folds and to duplexes in (c), the occurrence of top-southeast and top-northwest contractional duplexes in conjunction with respectively northwest- and southeast-dipping (mylonitic?) thrust surfaces in (d) and (i), the occurrence of potential top-northwest, possibly imbricate brittle thrusts in (e) and (j), and the truncation of folds and related structures by subvertical disruption interpreted as potential dykes in (f
). Locations are shown in
Figure 2a–e.
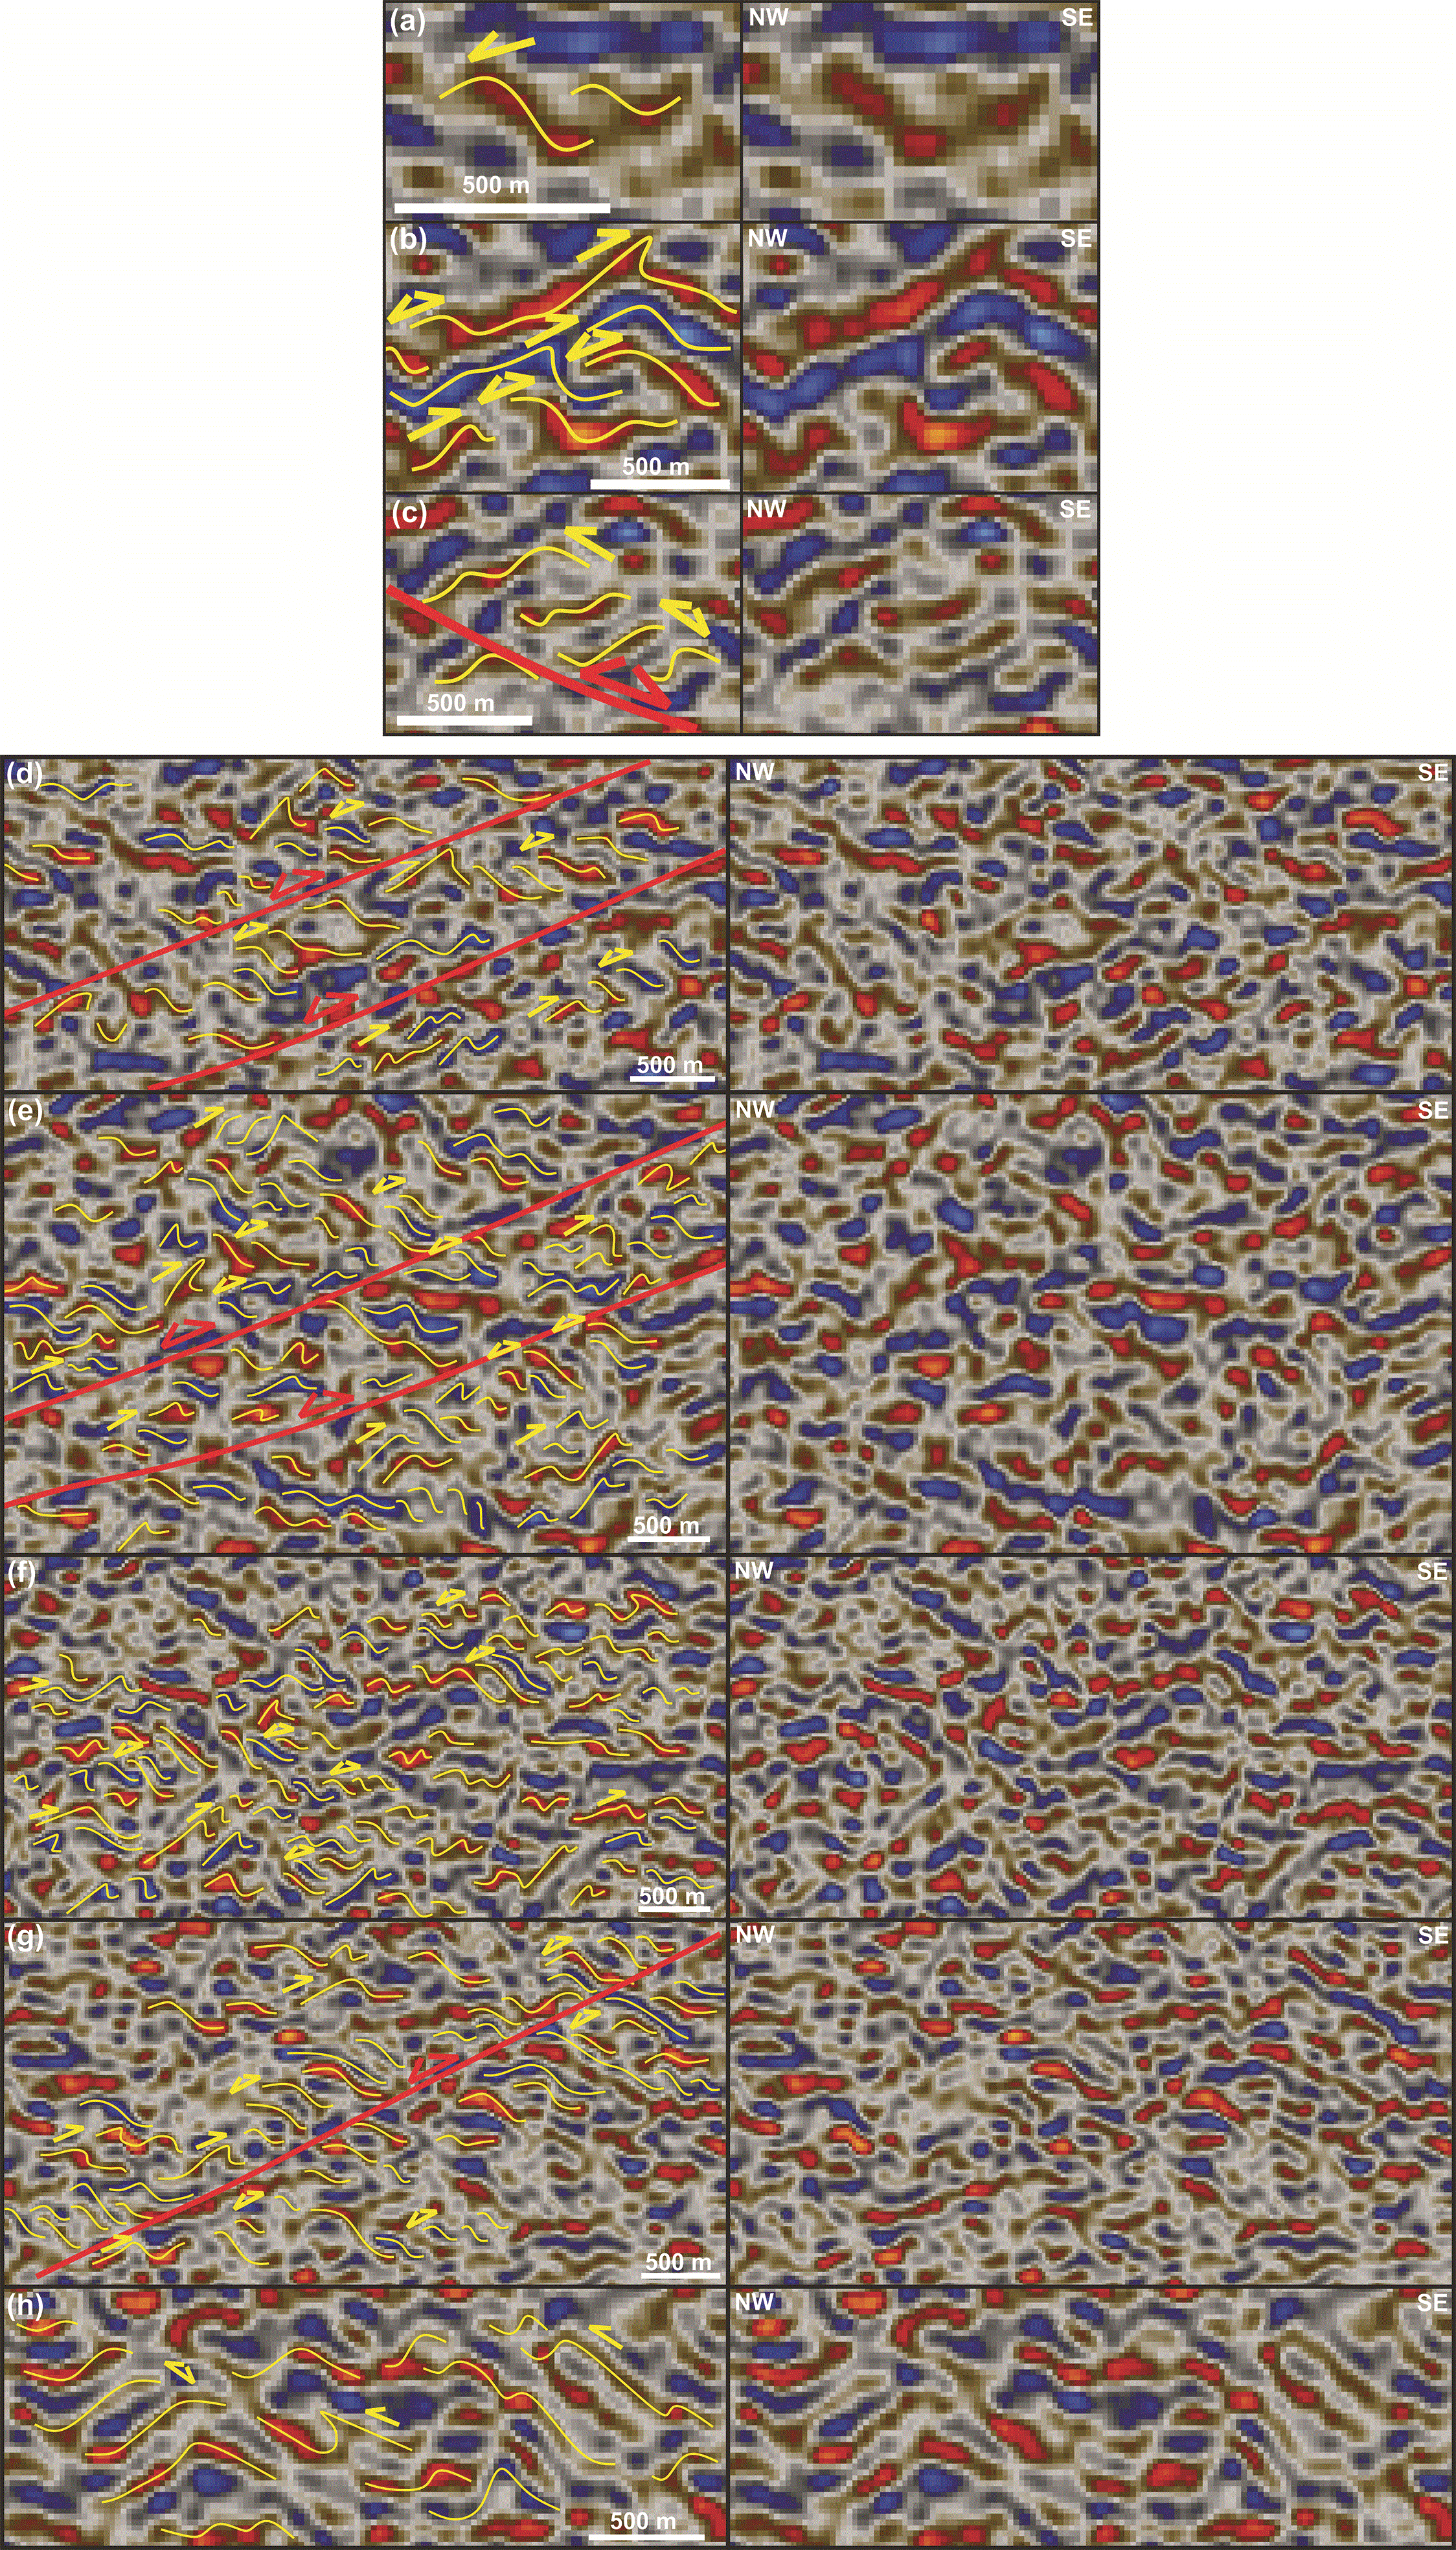
Figure 8. Interpreted (left hand side) and uninterpreted (right hand side) zoom in seismic reflection data showing potentially inverted (double yellow half arrows) contractional duplexes.
Notice that the preservation of the initial top-southeast vergence of the fold in the lower left corner in (b) and the initial top-northwest vergence of the fold in the lower right corner in (c), and the occurrence of potentially inverted (double red half arrows) contractional duplexes adjacent and in between major (myltonitic?) thrust fault surfaces in (c), (d), (e), and (g). Traces of initial contraction are preserved in places as asymmetric to overturned folds in (d–h). Locations are shown in
Figure 2a–e.
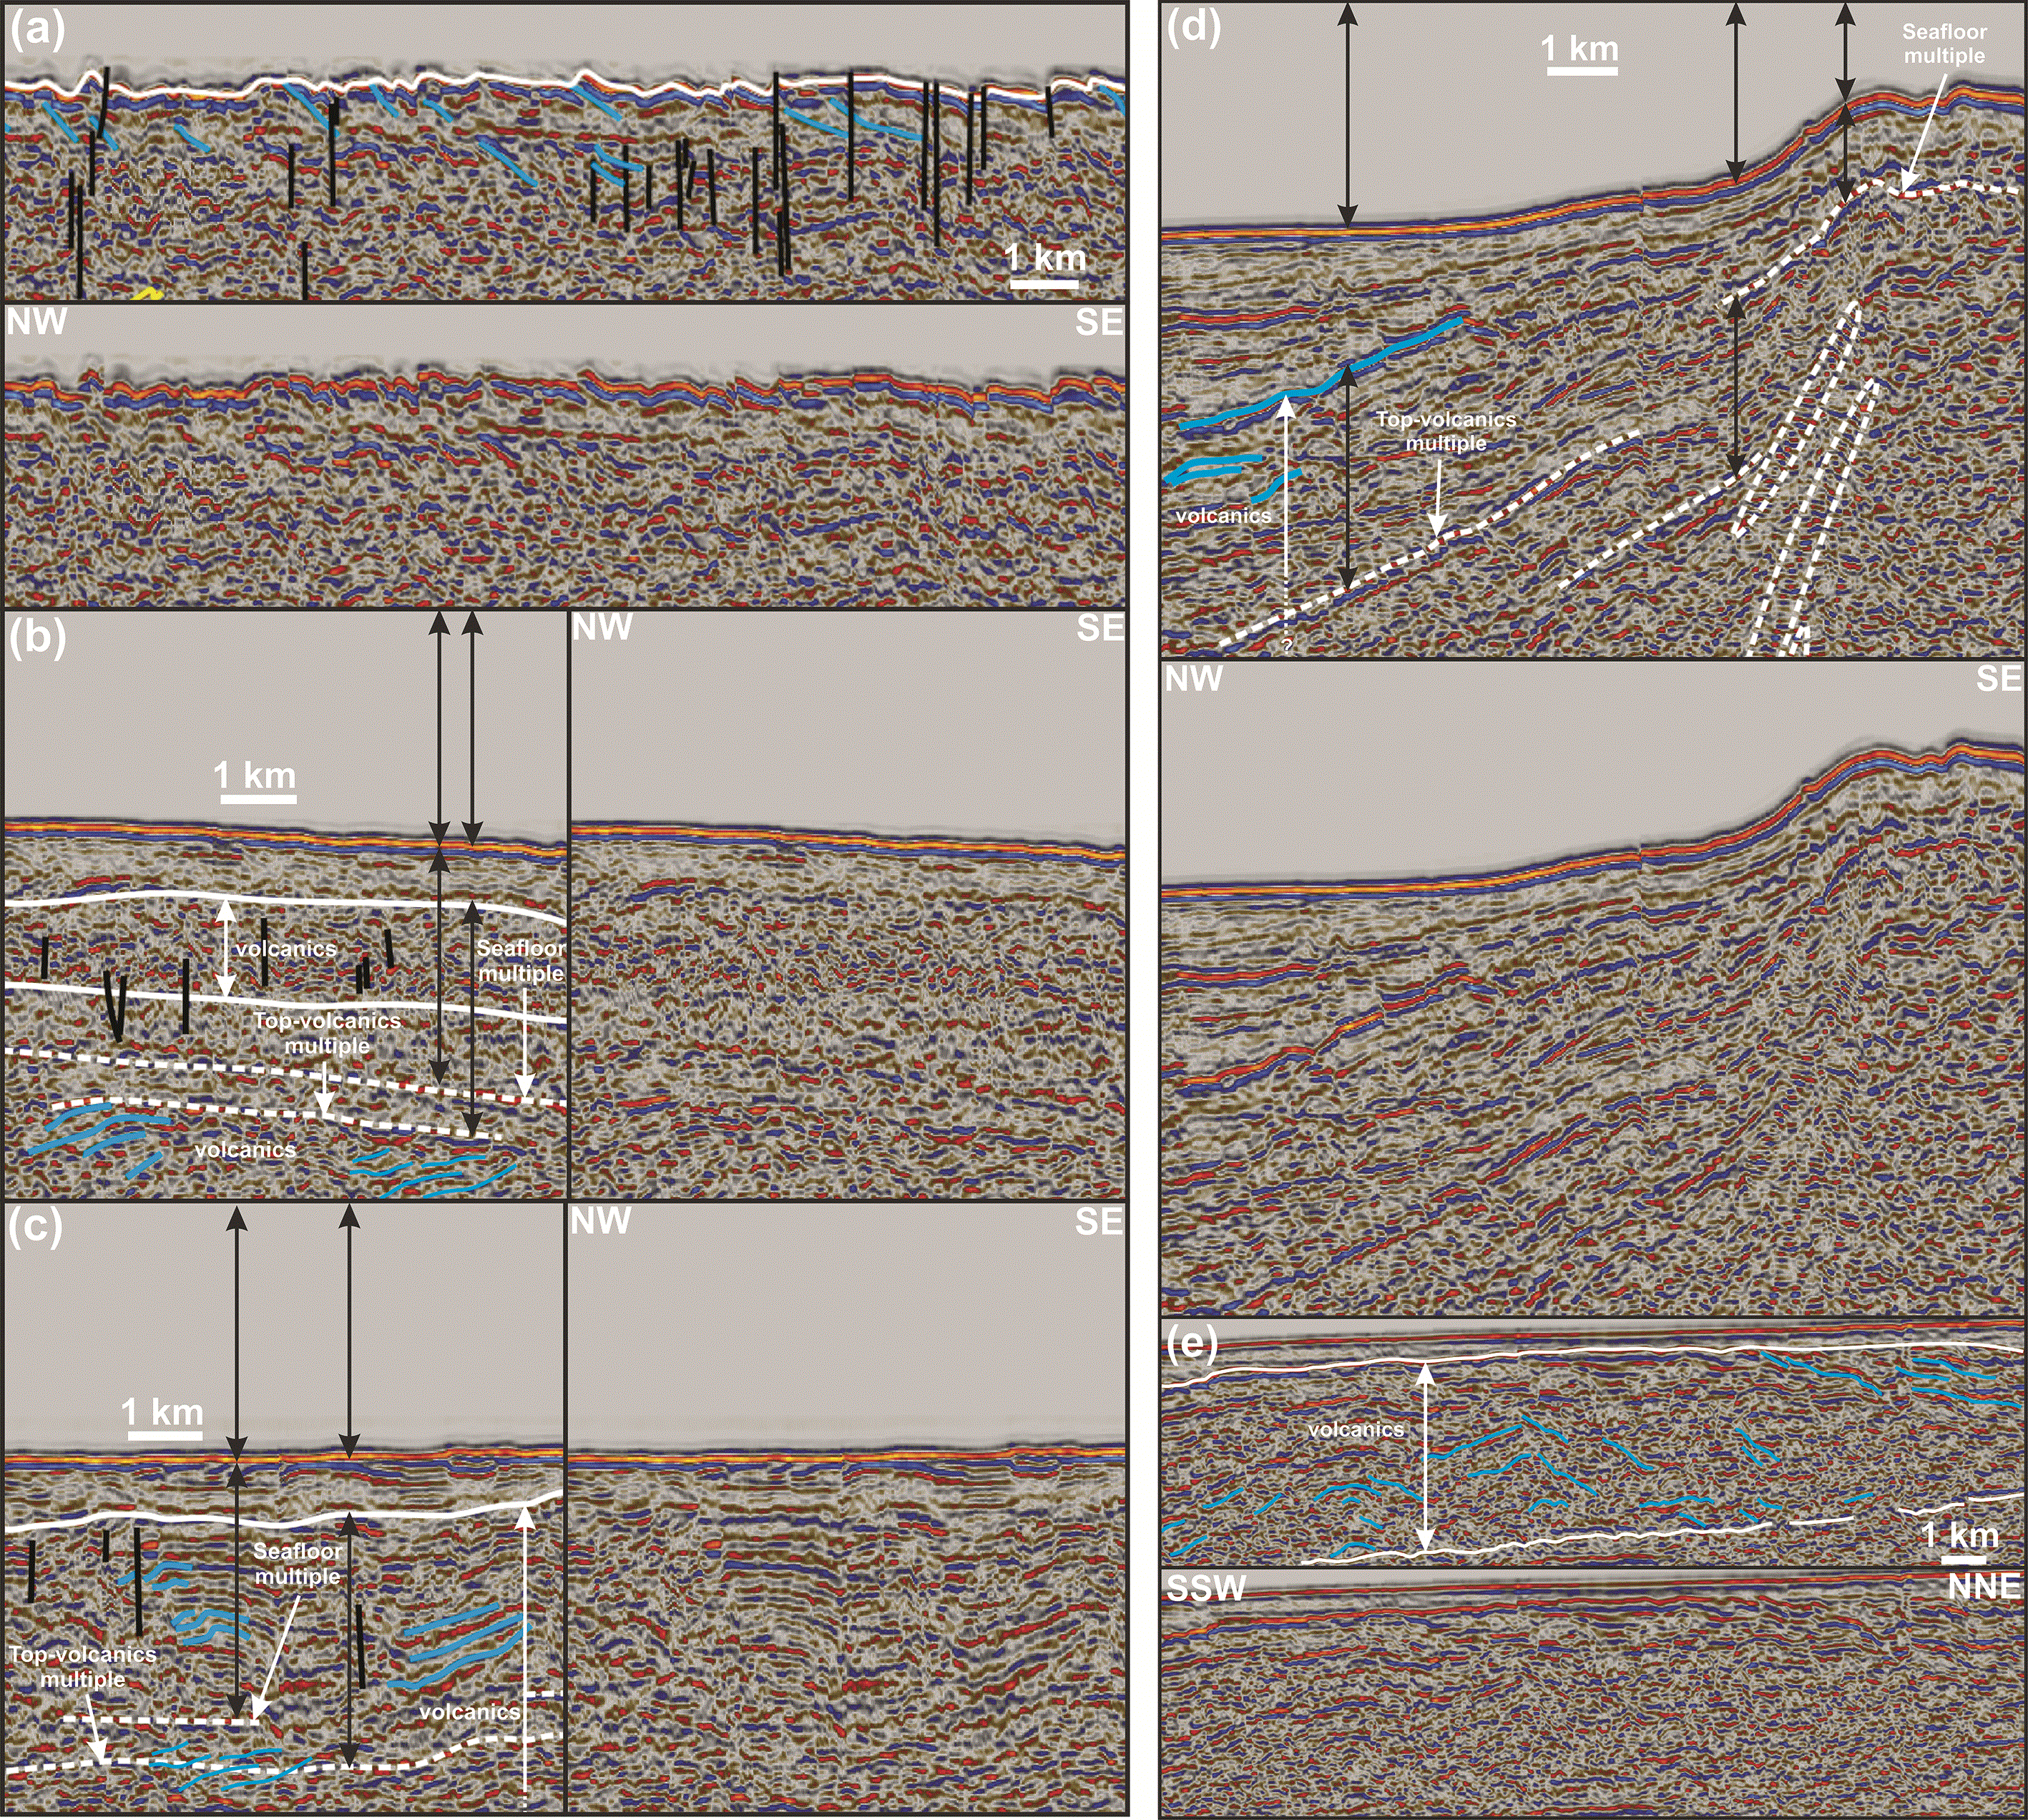
Figure 9. Interpreted (up in a and d–e and left hand side in b–c) and uninterpreted (down in a and d–e and right hand side in b–c) zoom in seismic reflection data showing (a) the rugose geometry of the seafloor on the strandflat southeast of Iceland possibly generated by eroded, seaward-dipping, Cenozoic lava flows, (b–d) km-thick subhorizontal layers consisting in places of chaotic (b) and prograding reflections (b–d) interpreted respectively as Cenozoic lava flows and lava deltas, and (e) oppositely-dipping reflections within the shallow Cenozoic volcanic succession.
Notice the occurrence of widespread (seafloor and Top-volcanic) multiples in (b–d) and potential (diffraction-related?) artifacts below the shelf break in (d) (dashed white ovals), of subvertical disruptions possibly reflecting (late?) Cenozoic intrusions in (a–c), and the dome-like shape created by oppositely lava flows potentially suggesting an eruptive center (central volcano?) in (e). Locations are shown in
Figure 2a and c–f.
In places, these reflections are disrupted by tens of km wide, gently southeast-, northwest-, and NNE-dipping surfaces, which occur at depths of 1.5 to 8.0 seconds (TWT; red lines in
Figure 2a–f and
Figure 5g and l,
Figure 6e,
Figure 7d and i, and
Figure 8c–e and g). In NW–SE-striking seismic cross section, these oppositely-dipping surfaces define hundred-km wide domes and troughs (
Figure 2a–e). A-few-km- to tens-of-km-wide packages of hundreds of meters to km-scale S-
and Z-shaped reflections are typically found adjacent to the tens-of-km-wide disruption surfaces (
Figure 2a–f,
Figure 5g, i–j, and l–n,
Figure 6c and e,
Figure 7a–j, and
Figure 8a–h). S-shaped reflections occur both along NNE- and southeast-dipping disruption surfaces, whereas Z-shaped reflections are found near northwest-dipping disruption surfaces (
Figure 2a–f,
Figure 5g, i–j, and l–n,
Figure 6c and e,
Figure 7a–j, and
Figure 8a–h).
In NE–SW-trending seismic cross section, the asymmetry of the hundred-meter- to km-scale, curving-up reflections typically consists of a long, more gently dipping, northeastern edge and a narrow, steeply dipping southwestern edge, thus conferring them a dominantly southwest-leaning geometry (
Figure 2f). In contrast, their asymmetry in NW–SE-trending cross section alternates from southeast-leaning in the northwestern flank of the hundred-km-wide domes to northwest-leaning in the southeastern flank (
Figure 2a–e). In the core of the hundred-km-wide domes, curving-up reflections become increasingly symmetric (
Figure 2a–e,
Figure 3, and
Figure 4a–b). Curving-up reflections are also locally truncated by small (km wide), ≤0.2 second (TWT) thick disruptions (
Figure 4b,
Figure 5c, g, and l,
Figure 6b, and
Figure 7e and j). Offset along these disruptions are reverse (i.e., upper side up).
Typically <1.0 second thick, subvertical, in place merging/anastomosing disruptions and shadow areas are found ubiquitously in the seismic reflection data (i.e., areas in which seismic reflection amplitudes decrease significantly;
Figure 4a,
Figure 7f, and
Figure 9a–c). These subvertical features truncate all reflections, though with no apparent offset (
Figure 2a–f). Their frequency increases in the central part of the two domes defined by the gently southeast- and northwest-dipping disruption surfaces (
Figure 2a–e and
Figure 4a).
Upper crust
The upper 1.5–3.0 seconds (TWT) of the data show a large number of seismic artifacts, including several multiples and potential diffraction rays (e.g.,
Figure 9b–d), especially near the Faroe Islands in the southeast where the seafloor is shallowest (
Figure 2a and e and
Figure 9d). Nonetheless, in the upper 0.5–1.0 second (TWT), the seismic data typically show gently to moderately southeast- or northwest-dipping reflections, which can be traced for a few hundred meters to a few km (
Figure 2a–e and
Figure 9a–d). In places, some of these are stacked and arranged into packages of prograding reflections (
Figure 9b–d). The uppermost 1.5 second (TWT) also displays 0.2–1.0 second-thick, up to hundred km wide layers of more chaotic reflections, which pinch out laterally (
Figure 9b–c and e). The relatively chaotic character of these layers is associated with large numbers of disruption of apparently flat to moderately-dipping internal reflections (
Figure 9b–c and e). Near southeastern Iceland, the seabed reflection shows a rugose geometry, which coincides with the occurrence of southeast-dipping, moderate- to high-amplitude reflections at and just below (<0.5 second TWT) the seafloor (
Figure 9a).
Recent mid–upper Cenozoic sediments appear as thin (< 0.5 second TWT) layers of generally flat-lying to gently-dipping, moderate-amplitude reflections. These are not relevant to the present study and are thus not further discussed.
Interpretation
Moho
Given the c. 28–30 km thickness of the crust in easternmost Iceland (e.g., Foulger et al., 2003), the 8.5–9.5 second-deep, high-amplitude, undulating reflections are tentatively interpreted as lower-crustal intrusions above the Moho (
Figure 2a–f and
Figure 3). This estimate is in agreement with the 23 km thickness of the crust farther southeast along the Iceland–Faroe Ridge (Bohnhoff & Makris, 2004). The negative-amplitude character of the Moho reflection suggests the occurrence of relatively weak rocks at the interface between the crust and mantle. Potential candidates include partially melted peridotite and related intrusions and serpentinite (density c. 2.6; Birch, 1960; Birch, 1961; Hyndman & Drury, 1977;
Table 1). Given the high amounts of recent magmatism in Iceland and the difficulty in channeling water to hydrate mantle peridotite at great depth (c. 28–30 km), it is more probable that the negative amplitude of these reflections reflects the presence of partial melt and intrusions. The apparent increase of potential deep-crustal intrusions towards Iceland (fuchsia lines in
Figure 2a–e) is consistent with the magmatic history of the region with gradually younger magmatism (i.e., potentially including partially molten rocks) towards Iceland.
Table 1. Density average and ranges for common crustal and mantle rocks.
Density values significantly higher than that of granitic continental crust and comparable to peridotite are highlighted in red. The corresponding rock types are unlikely to generate a significant contrast in acoustic impedance with mantle peridotite, thus potentially resulting in a diffuse crust–mantle Moho boundary (e.g.,
Figure 2b–f). In contrast, densities significantly lower than that of mantle peridotite are displayed in blue. These rock types (serpentinite) are likely to generate a significant contrast in acoustic impedance both with mantle peridotite and crustal rocks, thus potentially resulting in a bright Moho reflection like near the coast of southeastern Iceland (e.g.,
Figure 2b).
| Continental crustal rocks | Average density | Density range | Contrast with density 2.8 continental crust (%) | Sources |
|---|
| granite | 2.8 | 2.5–3.1 | 0.0 | Birch, 1960; Eshaghi et al. 2019; Henkel, 1970; Jones, 2015; Smithson, 1971 |
| migmatite | 3.0 | 2.7–3.2 | 7.1 | Eshaghi et al., 2019; Smithson, 1971; Subrahmanyam & Verma, 1981 |
| mylonite | 2.8 | 2.6–3.0 | 0.0 | Christensen & Szymanski, 1988; Eshaghi et al. 2019; Jones & Nur, 1982; McCaffree & Christensen, 1993; Punturo et al., 2014; Smithson, 1971 |
| mafic gneiss | 2.9 | 2.6–3.2 | 3.6 | Eshaghi et al. 2019; Smithson, 1971 |
| mafic granulite | 3.0 | 2.8–3.2 | 7.1 | Ito & Kennedy, 1970; Smithson, 1971; Subrahmanyam & Verma, 1981 |
| felsic granulite | 2.7 | 2.6–2.8(3.1) | −3.6 | Ito & Kennedy, 1970; Subrahmanyam & Verma, 1981 |
| amphibolite | 3.0 | 2.7–3.2 | 7.1 | Christensen, 1965; Eshaghi et al. 2019; Henkel, 1991; Smithson, 1971 |
| eclogite | 3.4 | 3.2–3.5(3.7) | 21.4 | Cao et al., 2013; Coleman & Lanphere, 1971; Henkel, 1991; Ito & Kennedy, 1970; Ringwood & Green, 1966; Van der Straaten, 2008; Ye et al., 2022 |
| charnockite | 3.0 | 2.6–3.4 | 7.1 | Birch, 1960; Subrahmanyam & Verma, 1981 |
| blueschist | 3.0 | 2.7–3.3 | 7.1 | Cao et al., 2013; Coleman & Lanphere, 1971; Ott et al., 2024; Van der Straaten, 2008 |
| pseudotachylyte | 2.7 | 2.6–3.0 | −3.6 | Eshaghi et al. 2019 |
| Oceanic crustal rocks
| | | | |
| gabbro | 3.0 | 2.7–3.1 | 7.1 | Birch, 1960; Birch, 1961; Eshaghi et al. 2019; Glen et al., 2007; Henkel, 1970; Hyndman & Drury, 1977; Nilsen, 1973; Ringwood & Green, 1966 |
| basalt | 2.9 | 2.6–3.1 | 3.6 | Birch, 1960; Birch, 1961; Eshaghi et al., 2019; Hyndman & Drury, 1977; Ito & Kennedy, 1970 |
| diorite | 2.9 | 2.6–3.1 | 3.6 | Eshaghi et al. 2019; Glen et al., 2007; Henkel, 1970; Henkel, 1976; Jones, 2015 |
| anorthosite | 2.9 | 2.6–3.0(3.3) | 3.6 | Birch, 1960; Birch, 1961; Eshaghi et al., 2019; Jones, 2015; Smithson, 1971; Subrahmanyam & Verma, 1981 |
| Mantle rocks
| | | | |
| serpentinite | 2.6 | 2.4–2.8 | −7.1 | Birch, 1960; Birch, 1961; Hyndman & Drury, 1977 |
| peridotite | 3.3 | 3.1–3.4 | 17.9 | Boyd & McCallister, 1976; Ye et al., 2022 |
Farther southeast, the Moho is diffuse and cannot be tied to any specific set of reflections (
Figure 2a–f). The lack of high acoustic impedance contrast suggests the absence of partial melt in the uppermost mantle away from Iceland and that the lower crust at the Iceland–Faroe Ridge consists of rocks with a density comparable to that of peridotite (c. 3.3), e.g., eclogite (c. 3.4), and/or migmatite (c. 3.0, up to 3.2), and/or granulite (c. 3.0, up to 3.2), and/or charnockite (c. 3.0, up to 3.4), and/or gabbro (c. 3.0), and/or diorite (up to 3.1), and/or amphibolite (c. 3.0, up to 3.2), and/or blueschist (c. 3.0, up to 3.3), and/or mafic gneiss (up to 3.2; Birch, 1960; Birch, 1961; Boyd & McCallister, 1976 and references therein; Cao et al., 2013; Christensen, 1965; Coleman & Lanphere, 1971; Eshaghi et al., 2019; Glen et al., 2007; Henkel, 1976; Henkel, 1991; Hyndman & Drury, 1977; Ito & Kennedy, 1970; Jones, 2015 and references therein; Nilsen, 1973; Ott et al., 2024; Ringwood & Green, 1966; Smithson, 1971; Subrahmanyam & Verma, 1981; van der Straaten, 2008; Ye et al., 2022 and references therein;
Table 1).
Mid–lower crust
The offset of hundreds-of-meter- to km-scale, asymmetric, curving-up reflections by km-scale disruption surfaces with reverse offset (
Figure 4b,
Figure 5c, g, and l,
Figure 6b, and
Figure 7e and j), their geometries ranging from open to overturned and tight recumbent isoclinal (e.g.,
Figure 5a–n and
Figure 6a–j), and their consistent vergence on the limbs of the major, hundred-km-wide domes (
Figure 2a–e,
Figure 5a–n,
Figure 6a–j, and
Figure 7a–j) suggest that they reflect tectonic deformation. They are therefore interpreted as asymmetric contractional folds indicating the direction of tectonic transport during thrusting. Their size (hundreds of meters to km) and range of geometries (open to tight recumbent isoclinal) are comparable to that of well-studied onshore structures in fold-and-thrust belts (e.g., Fitz-Diaz et al., 2011; Goscombe et al., 2017; Mosqueira Gonzalez et al., 2021; Rutter et al., 2007). The moderate acoustic impedance contrast creating these reflections may reflect alternating felsic and mafic rock units folded and/or sheared together.
Alternatively, the curving-up reflections may represent (folded?) mafic intrusions in a dominantly felsic crust or (folded?) felsic intrusions in a dominantly mafic crust. However, plutons are generally relatively isotropic and, thus, appear as large zones with lower reflectivity on seismic reflection data because of the lack of rock type variations (i.e., lack of acoustic impedance contrast), which is not consistent with the interpreted data. It is therefore more probable that the asymmetric reflections correspond to folded metaigneous and metasedimentary rocks.
The hundred-km wide domes and troughs flanked by the gently northwest- and southeast-dipping disruption surfaces (
Figure 2a–f,
Figure 5g and l,
Figure 6e,
Figure 7d and i, and
Figure 8c–e and g) correlate with anticlines and synclines in previous seismic studies, e.g., Austurbrún anticline, Austurbrún syncline, and Iceland Basin Anticline (Hjartarson et al., 2017;
Figure 1b). The gently-dipping, tens of km wide disruption surfaces and their occurrence together with curving-up asymmetry fold reflections of opposite vergence (i.e., northwest-dipping disruption surfaces occurring with southeast-verging folds) and packages of Z- and S-shaped reflections suggest that they correspond to crustal-scale, potentially mylonitic, thrust surfaces (e.g.,
Figure 5g and l,
Figure 6e,
Figure 7d and i, and
Figure 8c–e and g).
The occurrence of S- and Z-shaped reflections together with asymmetric folds suggest and their transitional nature with the latter suggest that they represent more intensely deformed rocks. The occurrence of S- and Z-shaped reflections along major, gently-dipping disruption surfaces and their arrangement into antiformal stacks suggest that they correspond to duplex horses (
Figure 2a–f,
Figure 5g, i–j, and l–n,
Figure 6c and e,
Figure 7a–j, and
Figure 8a–h; e.g., Boyer & Elliott, 1982). While some Z- and S-shaped duplex reflections are transitional with nearby asymmetric fold geometries, e.g., at antiformal (thrust) stacks where they indicate reverse movement along the main disruption thrust surfaces (
Figure 5g, i–j, and l–n,
Figure 6c and e,
Figure 7a–j, and
Figure 8a–h), others show smoother S- and Z-like shapes, which indicate normal movement (
Figure 8a–h).
The interpreted mylonitic thrusts and related asymmetric folds and duplexes (
Figure 2a–f and
Figure 4a–b,
Figure 5a–n,
Figure 6a–j,
Figure 7a–j, and
Figure 8a–h) are similar to other well-documented examples of fold-and-thrust belts on seismic reflection data worldwide (e.g., Calvert & Doublier, 2019; Fazlikhani et al., 2022; Freeman et al., 1988; Koehl et al., 2022; Koehl et al., 2023a; Koehl et al., 2024a; Koehl, 2025; Koehl & Stokmo, 2024; Koehl, 2025; Koehl et al., 2026), and to modelled asymmetric folds along major shear zones (e.g., Wrona et al., 2020).
The subvertical, < 1.0 second-thick disruptions may represent processing and/or migration artifacts (e.g., vertical data gaps in the upper 2.0–3.5 second TWT of the data;
Figure 2a–e), including potential noise attenuation issues (e.g., Li et al., 2022). However, given their non-offsetting character and the extensive magmatic history of the region, it is also possible that they correspond to mafic (feeder) dykes. These subvertical disruptions appear with increased frequency in the hinge of major anticlines and may thus also partly reflect areas with increased sub-vertical fracturing related (e.g., axial fold cleavage).
Upper crust
The rugose geometry of the seafloor near southeastern Iceland is related to erosion of stacks of the shallow, gently to moderately southeast- and northwest-dipping, in place prograding reflections (
Figure 2a-e and
Figure 9a). The geometry and widespread occurrence of these shallow (≤ 1.5 second deep), gently-dipping reflections between Iceland and the Faroe Islands (e.g.,
Figure 9a–e) suggest that they reflect Cenozoic lava flows and/or hyaloclastites, possibly including some interbedded sedimentary rocks. This is supported by the results of DSDP 38 at site 336, which penetrated 43 ± 3.3 Ma basalt (Talwani et al., 1976) and by seismic refraction data suggesting a 1.5 km thickness for this upper crustal basalt layer (Bohnhoff & Makris, 2004). The alternating dip and prograding character of the lavas indicate that they locally form deltas (
Figure 9b–d).
The 0.2–1.0 second-thick, up to hundred km wide, pinching-out layers of chaotic reflections occur at a comparable depth as the gently- to moderately-dipping lava flows (≤ 1.5 second depth) and may correspond to more chaotic magmatic endmembers, e.g., hyaloclastites, volcaniclastics, or lava flows intruded by numerous dykes (e.g., Geoffroy et al., 2022; Phillips & McCaffrey, 2019; Walker et al., 2022). However, considering the large number of migration artifacts, multiples, and potential seismic noise in the shallow portion of the data (e.g.,
Figure 9b–d), they may as well be regular lavas with interbedded sedimentary rocks.
Considering the thick character of Cenozoic lavas around the Faroe Islands (c. 3–10 km thick; Ólavsdóttir et al., 2016; Ólavsdóttir et al., 2021; Richardson et al., 1998; Waagstein et al., 1982) and Iceland (≥ 4.8 km; Friðleifsson et al., 2017; Tryggvason & Båth, 1961), the upper 2.0 seconds below seafloor may realistically consist dominantly of Cenozoic lavas. Using the seismic velocities obtained by Bohnhoff & Makris (2004; 4.7–5.0 km.s−1), Cenozoic lavas at the Iceland–Faroe Ridge may thus amount for up to c. 5 km of crustal thickness. However, this is an upper estimate considering the large number of migration artifacts and multiples that make it challenging to differentiate lavas from sedimentary rocks in the upper 2.0–3.0 second (TWT) of the analyzed seismic reflection data and the thinning of the lava succession towards Iceland (
Figure 2a–e and
Figure 9b–d).
Magnetic data
Description
The Reykjanes Ridge oceanic crustal domain of the northeastern Atlantic Ocean is characterized by hundreds to a thousand kilometers long, NE–SW-striking, rectilinear magnetic anomalies (
Figure 10a–d). These anomalies are continuous on the edge of the Reykjanes oceanic crustal domain near Rockall Bank and Greenland and semi-continuous to disrupted in places near the Reykjanes Ridge (
Figure 10a–d and
Figure 11a–b). The central and northeastern parts of the Reykjanes Ridge oceanic crustal domain show subsidiary N–S-striking, medium- to high-amplitude anomalies, which extend into southwestern Iceland and the Greenland–Iceland Ridge (
Figure 10a–d and
Figure 11a–b). In the south and southwest, N–S-trending anomalies are widespread but show a low amplitude and high frequency.
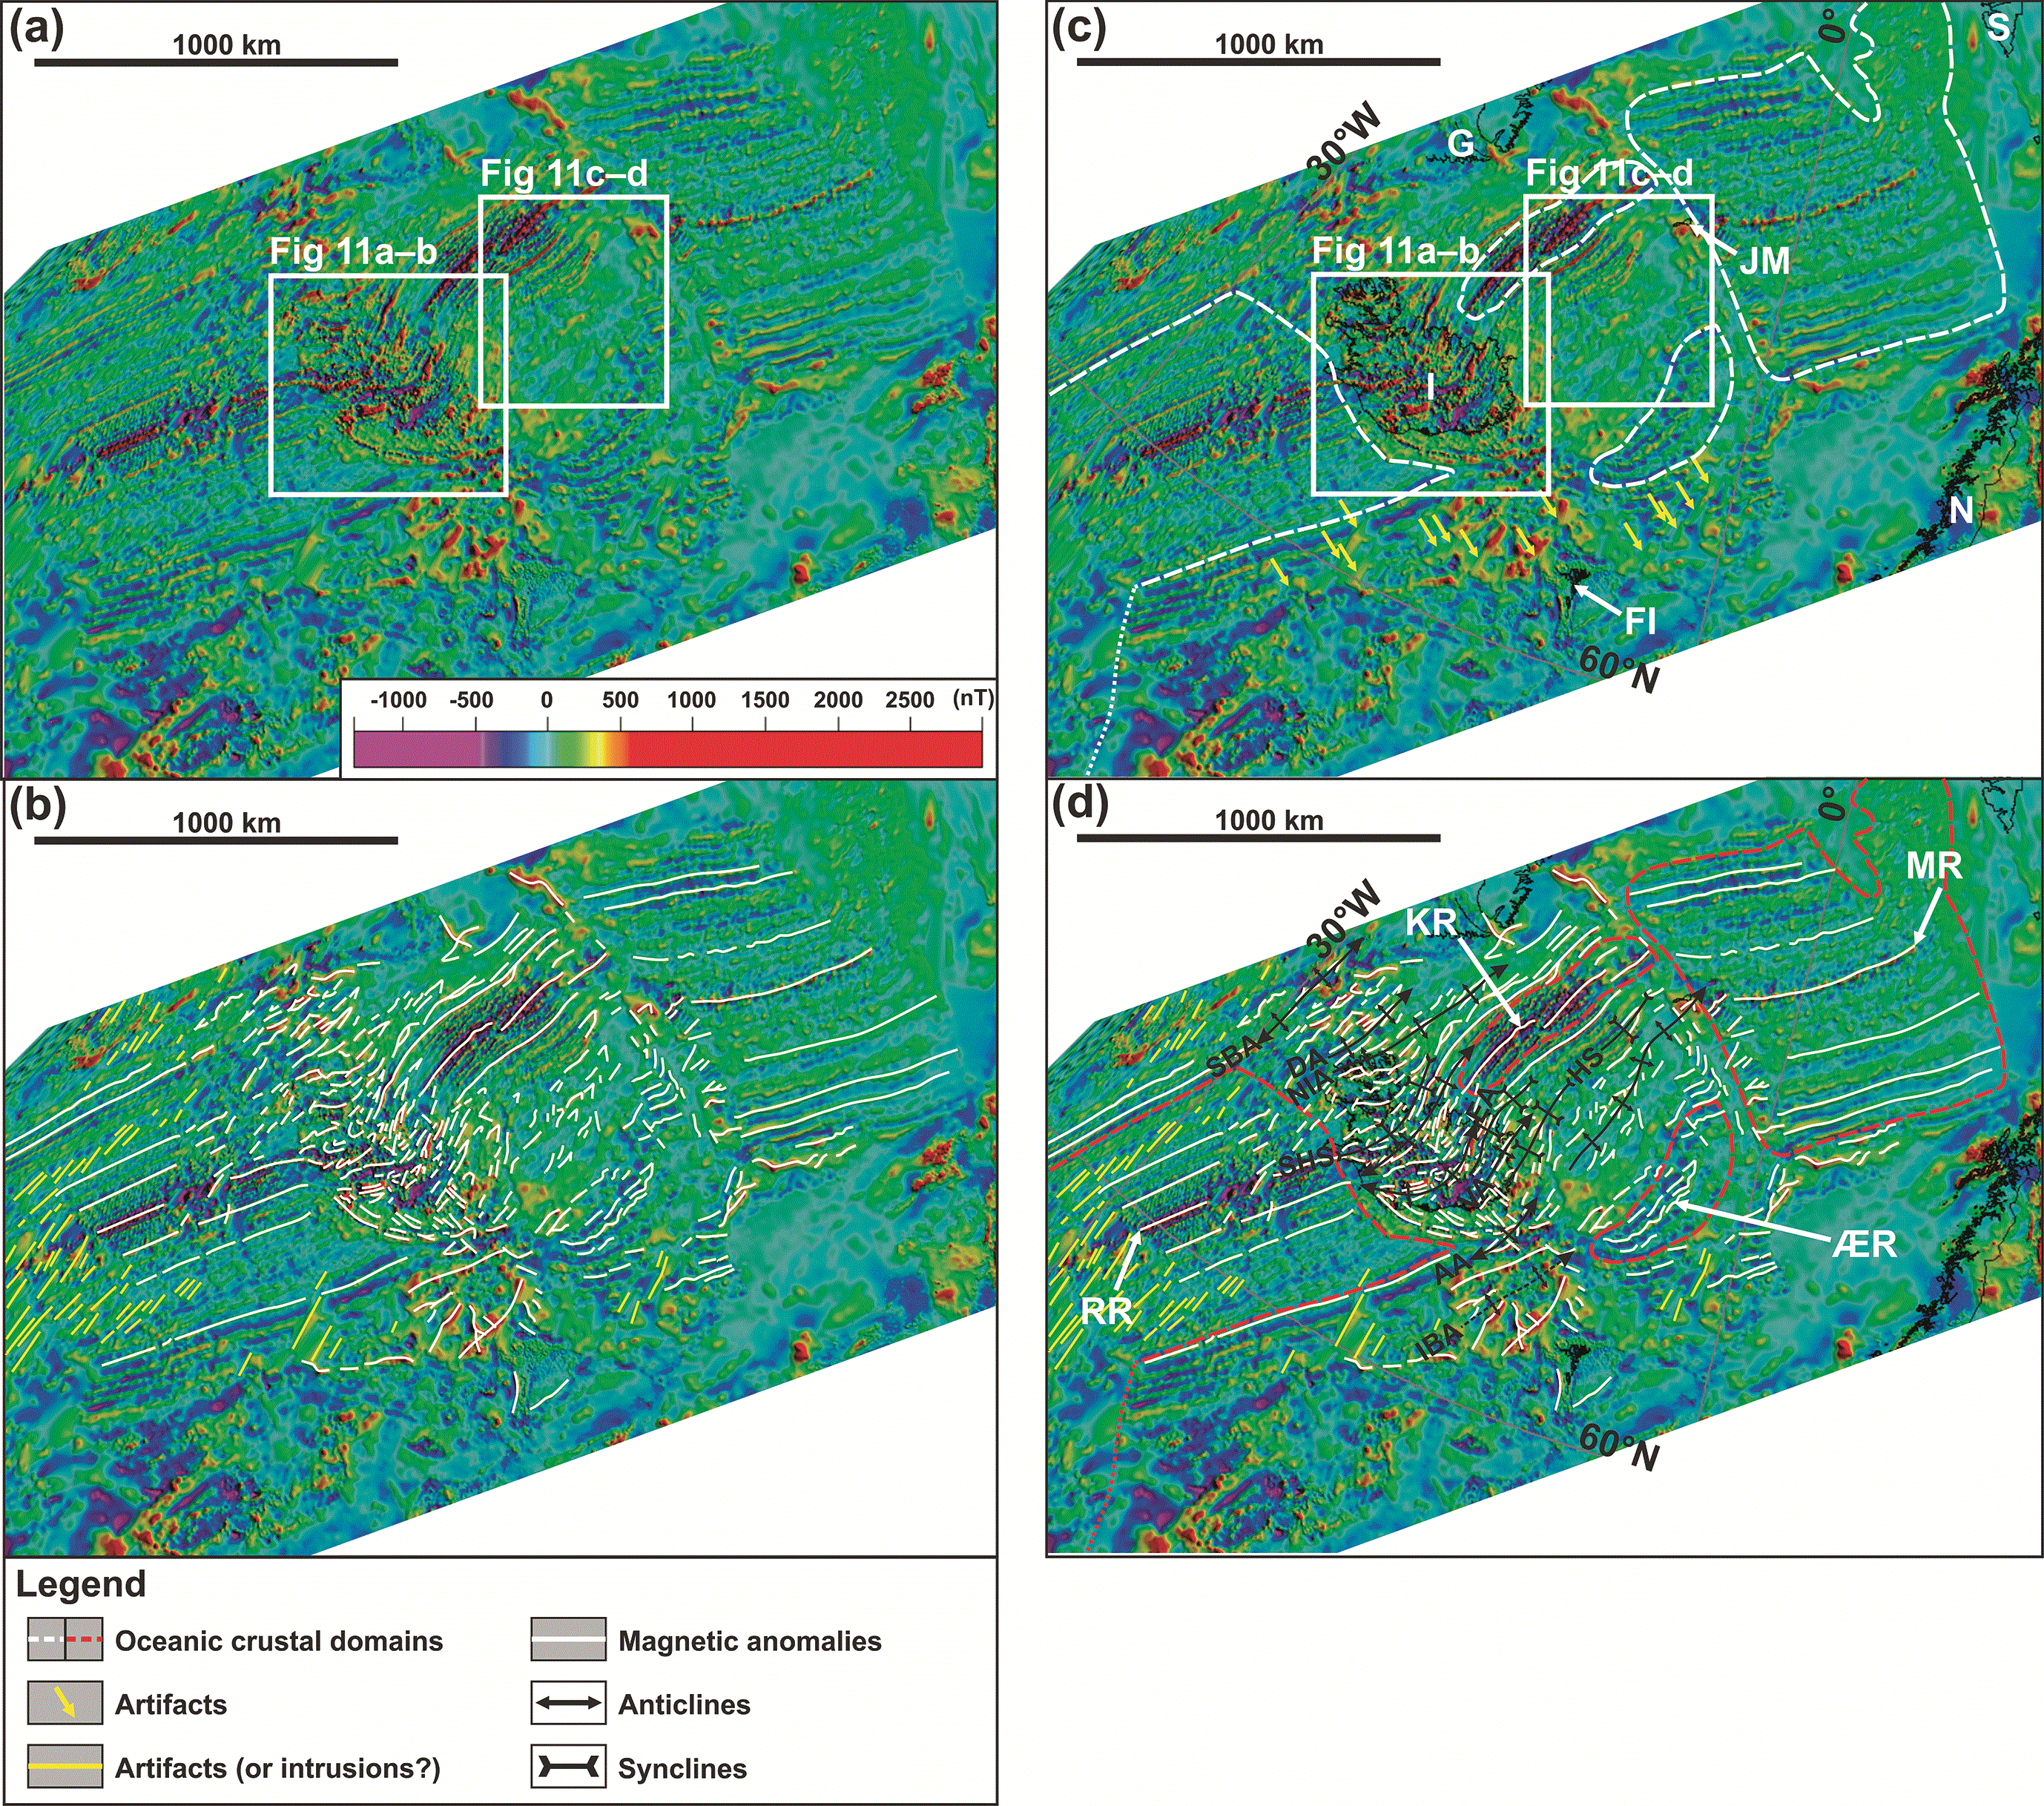
Figure 10. (a) Uninterpreted and (b–d) interpreted magnetic anomaly map in the northeastern Atlantic Ocean
(Gaina et al., 2017; Hopper et al., 2014; Nasuti & Olesen, 2014a; Nasuti & Olesen, 2014b). (b) shows the interpreted magnetic anomalies without the coastlines to illustrate the contrast between the Greenland–Iceland–Faroe Ridge and adjacent oceanic crustal domains shown in (c). (d) shows interpreted tectonic fold structures in continental crustal domains. The continent–ocean boundary (dashed white lines in (c) and dashed red lines in (d)) is from the present study at the Greenland–Iceland–Faroe Ridge, Dumais et al. (2020) in the Fram Strait, Geoffroy et al. (2021) at the Reykjanes oceanic segment, and based on Gernigon et al. (2021) off mid-Norway. Abbreviations: AA: Austurbrún Anticline; DA: Djúpáll Anticline; EA: Eyjafjörður Anticline; FI: Faroe Islands; G: Greenland; HS: Héraðsflói Syncline; I: Iceland; IBA: Iceland Basin Anticline; JM: Jan Mayen; KR: Kolbeinsey Ridge; MR: Mohns Ridge; N: Norway; NIA: NW Iceland Anticline; RR: Reykjanes Ridge; S: Svalbard; SBA: Strede Bank Anticline; SHS: Snæfellsnes–HúnaflóI Syncline; VA: Vopnafjörður Anticline; ÆR: Ægir Ridge.
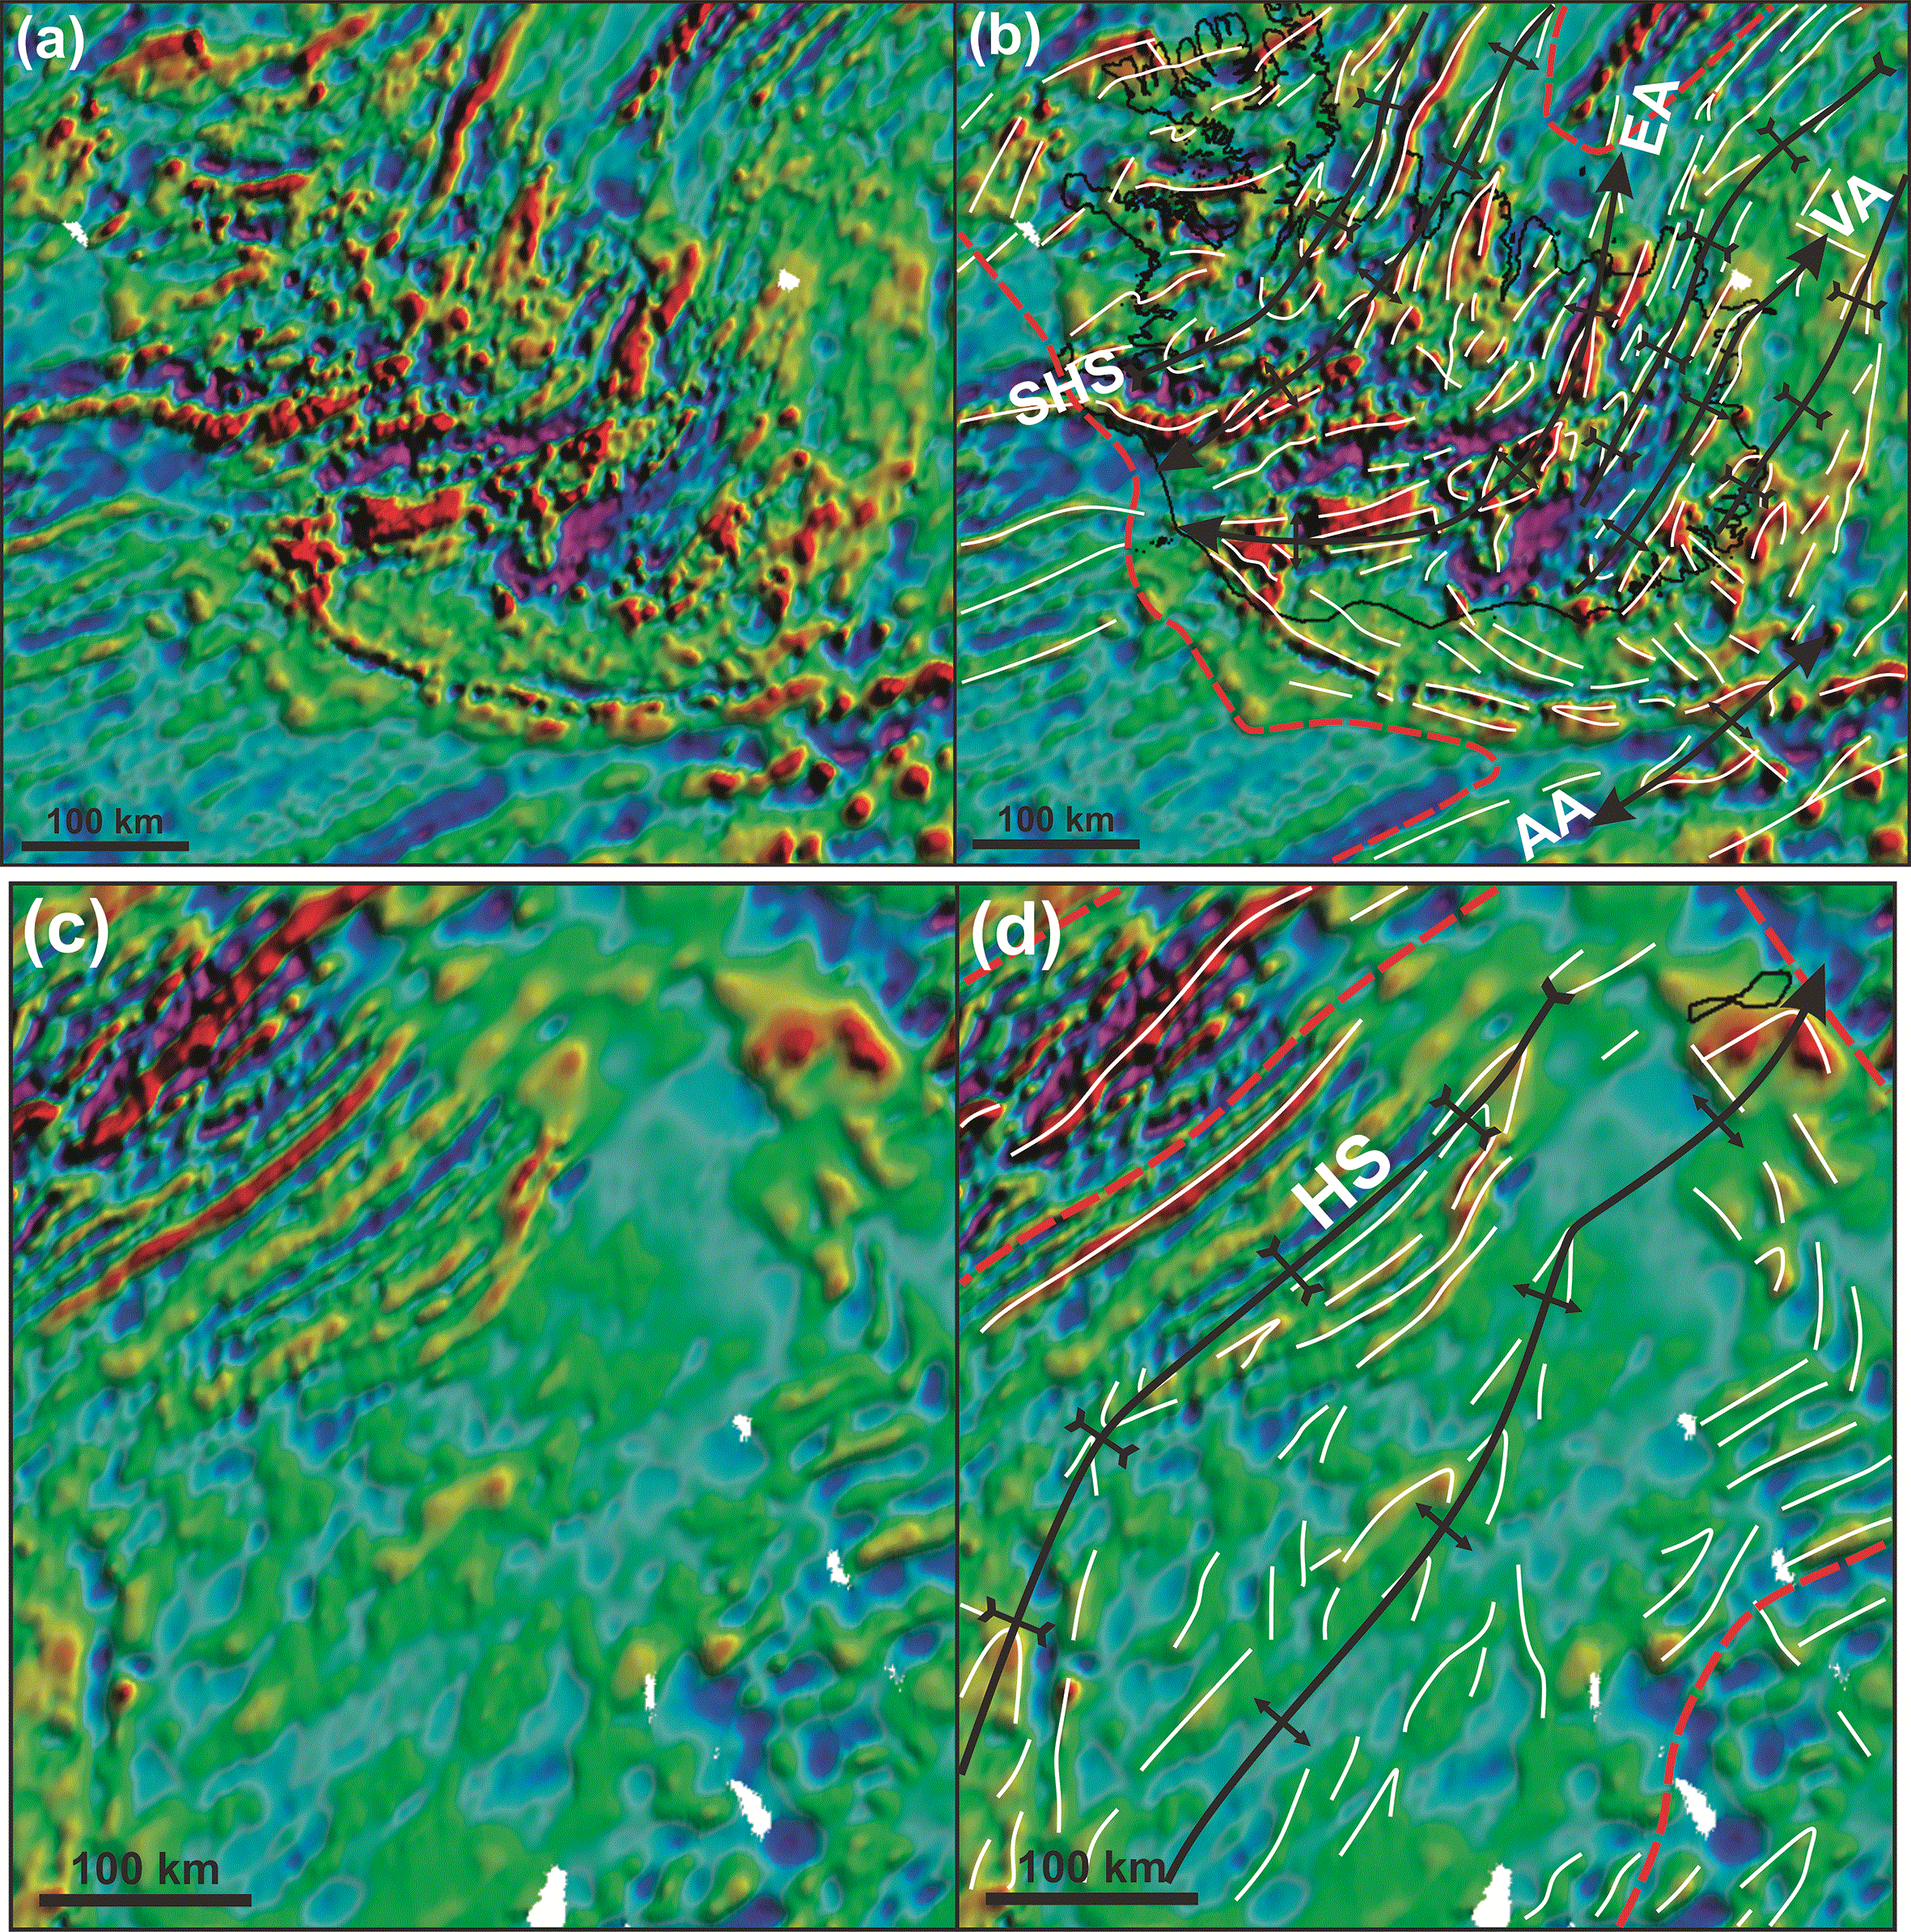
Figure 11. (a & c) Uninterpreted and (b & d) interpreted zoom in magnetic anomaly map in Iceland and the Jan Mayen Microcontinent Complex showing Λ- and V-shaped magnetic anomalies interpreted as overall NE–SW-striking Caledonian folds.
Locations are shown in
Figure 10a and c. Legend is the same as
Figure 10. Abbreviations: AA: Austurbrún Anticline; EA: Eyjafjörður Anticline; HS: Héraðsflói Syncline; SHS: Snæfellsnes–HúnaflóI Syncline; VA: Vopnafjörður Anticline.
The Greenland–Iceland Ridge and Iceland–Faroe Ridge are both characterized by generally broad (≥ 10 km wide), arcuate to undulating and discontinuous (≤ 100 km long) magnetic anomalies (
Figure 10a–d and
Figure 11a–b). In places, two anomalies merge and form triangular, dominantly ᴧ- and subsidiary V-shaped anomalies. In addition to the dominant NE–SW to NNE–SSW strike, magnetic anomalies at the Greenland–Iceland Ridge strike subsidiarily N–S. In contrast at the Iceland–Faroe Ridge, anomalies strike dominantly WNW–ESE, whereas NE–SW- and N–S-striking anomalies are subsidiary (
Figure 10a–d). Furthermore, the central part of the Iceland–Faroe Ridge is characterized by circular to oval dominantly positive and subsidiarily negative magnetic anomalies.
Iceland is characterized by overall arcuate, discontinuous (≤ 100 km long), NE–SW- to NNE–SSW-striking anomalies, which bend into a N–S strike northwards (
Figure 10a–d and
Figure 11a–b). In central and eastern Iceland, some anomalies display Λ-like geometries and align along NE–SW- to NNE–SSW-striking undulating axes (
Figure 10a–d and
Figure 11a–b). Furthermore, southernmost and southeasternmost Iceland are dominated by a series of tens to hundred km long, WNW–ESE- to E–W-striking anomalies, i.e., orthogonal to the northeastern Atlantic rift system. These anomalies are similar to the dominant anomaly trend in the Iceland–Faroe Ridge (
Figure 10a–d).
At the Ægir Ridge oceanic domain, moderate-amplitude magnetic anomalies display an overall arcuate shape, bending from an ENE–WSW strike in the southwest to a NNE–SSW strike in the northeast. In this region, they are discontinuous to semi-continuous and of low amplitude.
In contrast, magnetic anomalies at the Kolbeinsey Ridge oceanic crustal domain are continuous, rectilinear to mildly undulating, NNE–SSW-striking moderate-amplitude anomalies on the edges and right-stepping, high-amplitude in the basin center around the Kolbeinsey Ridge (
Figure 10a–d).
In between the oceanic crustal domains of the Kolbeinsey and Ægir ridges, continental crust of the Jan Mayen Microcontinent Complex is characterized by dominantly low- up to moderate-amplitude anomalies, some of which display dominantly Λ- and subsidiary V-like shapes aligning along NNE–SSW-striking axes, especially towards the center of the Jan Mayen continental crustal domain (
Figure 10a–d and
Figure 11c–d). The main Λ-shaped anomaly coincides in the northeast with the location of the Jan Mayen Archipelago (
Figure 10a–d and
Figure 11c–d).
Farther northeast, the Mohns Ridge oceanic crustal domain is characterized by a similar pattern as the Reykjanes Ridge domain with anomalies showing increasing disruptions towards the active mid-ocean ridge (
Figure 10a–d).
Interpretation
The NE–SW-striking rectilinear anomalies in the Reykjanes and Mohns oceanic domains are parallel to the Reykjanes and Mohns ridges and to V-shaped valleys along the Reykjanes Ridge and, thus, are likely the product of the variations of the magnetic field intensity and polarity and seafloor spreading off these mid-ocean ridges. As suggested by recent studies of magnetic and seismic reflection data in the area and other rifted margins, the more proximal NE–SW-striking (pseudo-) rectilinear anomalies are interpreted as intrusions in thinned continental crust, e.g., outer seaward-dipping reflectors (Geoffroy et al., 2021; Geoffroy et al., 2022). The arcuate, moderate-amplitude, ENE–WSW- to NNE–SSW-striking and NNE–SSW-striking anomalies at the Ægir and Kolbeinsey oceanic domains are interpreted to result from seafloor spreading. In both the Ægir and the Kolbeinsey oceanic domains, the magnetic anomalies converge toward the active spreading center in the northeast (Mohns Ridge) either by counterclockwise bending (Ægir domain) or right stepping (Kolbeinsey domain;
Figure 10a–d).
The N–S-striking low- to high-amplitude anomalies in the Reykjanes oceanic domain, Greenland–Iceland–Faroe Ridge, and adjacent continental margins parallel the mid-ocean ridge farther south between the Charlie Gibbs and Bight transform fault zones (
Figure 1a). The high-amplitude endmember of these anomalies may correspond to local ultramafic intrusions in oceanic or mafic–ultramafic intrusions in continental crust. In contrast, the low-amplitude, high-frequency endmember could either reflect artifacts related to acquisition or processing issues, or intrusions along high-frequency, N–S-striking fractures that propagated northwards from the Charlie Gibbs–Bight oceanic domain due to local stress propagation. An interpretation as processing artifacts is also suggested for high-amplitude N–S-striking anomalies on the UK–Faroe continental margin, where they appear to distort nearby NE–SW-striking anomalies (yellow arrows in
Figure 10a).
The geometry of NE–SW- to NNE–SSW-striking anomalies in the Greenland–Iceland–Faroe Ridge significantly differs from similarly striking continuous and rectilinear anomalies in the adjacent Rekjanes, Ægir, and Kolbeinsey oceanic crustal domains (
Figure 10a–d and
Figure 11a–b). Their discontinuous, arcuate character is more consistent with (folded? bending?) mafic–ultramafic intrusions in continental crust (e.g., Koehl et al., 2019; Koehl & Stokmo, 2024; Nasuti et al., 2015).
The triangular anomalies in the Greenland–Iceland–Faroe Ridge, Jan Mayen Microcontinent Complex, and southeastern Greenland margin are similar to gently- to moderately-plunging contractional folds in continental crust on magnetic data, e.g., in the Barents Sea and northern Norway, which are produced by folded mafic intrusions and highly-magnetic metasedimentary beds (Koehl et al., 2019; Koehl et al., 2022; Koehl & Stokmo, 2024; Roberts & Siedlecka, 2013; Roberts & Williams, 2013). The Λ-shaped magnetic anomaly in the Iceland–Faroe Ridge (
Figure 10a–d) coincides with the location of the hinge of the hundred-km-wide, NE–SW-striking Austurbrún Anticline observed on seismic reflection data (present study and Hjartarson et al., 2017;
Figure 2a–e). Considering the extensive Cenozoic magmatism in Iceland and nearby margins, the triangular magnetic anomalies are interpreted to reflect mafic–ultramafic intrusions along northeast- to NNE-plunging and southwest-plunging anticlines.
In the Iceland–Faroe Ridge and southernmost and southeasternmost Iceland, WNW–ESE-striking anomalies strike sub-orthogonal to nearby active and extinct mid-ocean ridges (
Figure 10a–d and
Figure 11a–b). In contrast, they are parallel to in the Iceland–Faroe Ridge (present study;
Figure 2a–f). Thus, these rift-orthogonal anomalies are interpreted as potential intrusions along WNW–ESE-striking faults.
Circular to oval anomalies at the Iceland–Faroe Ridge align both along WNW–ESE- and NE–SW-trending axes. Some of these circular anomalies coincide with known igneous centers around the Faroe Islands (e.g., Jolley et al., 2021; Kimbell et al., 2005; Stoker et al., 2015). They are thus interpreted as mafic–ultramafic Cenozoic igneous centers, possibly at the intersection of NE–SW- and WNW–ESE-striking faults. While those displaying negative anomalies likely intruded coeval with the bulk of the igneous centers in the Rockall region (Kimbell et al., 2005; Waddams & Cordingley, 1999) when the magnetic field was reversed (ca. 63–53.5 Ma), those correlating with positive magnetic anomalies possibly intruded during the previous and/or following period with normal magnetic field (i.e., at ca. 65–63 Ma and/or 53.5–45.5 Ma or even down to ca. 36 Ma;
Figure 10a–d; Walker & Geissmann, 2022). Given the 62.15–43.3 Ma ages obtained for igneous rocks of the North Atlantic Igneous Province in the Faroe Islands, Greenland–Iceland–Faroe Ridge, and southeastern Greenland (Bohnhoff & Makris, 2004; Brooks, 2011; Hansen & Ganerød, 2023; Larsen et al., 2014; Storey et al., 2007; Talwani et al., 1976; Tegner & Duncan, 1999; Tegner et al., 2008; Wilkinson et al., 2016), their position closer to the active spreading centers in Iceland, and the 43 ± 3.3 Ma ages obtained for basalts in the Iceland–Faroe Ridge (Bohnhoff & Makris,2004; Talwani et al., 1976), a 53.5 to 36 Ma age is proposed for the igneous centers at the Iceland–Faroe Ridge (
Figure 10a–d).
Discussion
Tectonic structures at the Greenland–Iceland–Faroe Ridge
The interpretation of seismic reflection and magnetic data suggest the existence of hundred-km-long, top-SSW thrust systems and hundred-km-wide, NE–SW- to NNE-SSW-striking folds at the Greenland–Iceland–Faroe Ridge and under Iceland (
Figure 2a–f,
Figure 10a–d, and
Figure 11a–d). The NNE-dipping thrust systems are characterized by WNW–ESE-striking anomalies at the Iceland–Faroe Ridge, probably reflecting along-strike (ultra) mafic intrusions (
Figure 10a–d), and tens of km wide, top-SSW thrusts and SSW-verging folds in seismic reflection data (
Figure 2f). The widespread, WNW–ESE-striking, rift-related faults and zones of seismicity onshore Iceland (e.g., Southern Iceland Seismic Zone; Bergerat & Angelier, 2008; Khodayar et al., 2018a; Khodayar et al., 2018b; Khodayar et al., 2020; Villemin et al., 1994), which parallel these NNE-dipping thrust systems in the Iceland–Faroe Ridge and correlate with their northwestward continuation, are thus interpreted as rift overprints and reactivation of these thrust systems.
The coincidence of the hinge zone of anticlines in seismic reflection data with triangular (dominantly Λ-shaped) magnetic anomalies suggests that the top-SSW thrust systems are reworked into dominantly NNE-plunging folds (e.g., Austurbrún and Iceland Basin anticlines;
Figure 2a–f,
Figure 10a–d, and
Figure 11a–d). This relationship is also valid for the Greenland–Iceland Ridge, onshore Iceland, and Jan Mayen Microcontinent Complex, where the Djúpáll and Strede Bank anticlines (Hjartarson et al., 2017 based on seismic reflection data), the NW Iceland, Eyjafjörður, and Vopnafjörður anticlines and the Snæfellsnes–HúnaflóI and Héraðsflói synclines (Jóhannesson & Sæmundsson, 2009 based on onshore structural data), and the main ridge of the Jan Mayen Microcontinent Complex (Péron-Pinvidic et al., 2012 and Blischke et al., 2016 based on seismic reflection and gravimetric data) correlate with NE–SW- to NNE–SSW-striking alignments of triangular magnetic anomalies of matching, hundred-km-wide width (
Figure 10a–d, and
Figure 11a–d). In places, the alignment of both V- and Λ-shaped magnetic anomalies indicates a dome- or trough-shaped (i.e., both SSW- and NNE-plunging) geometry for the NE–SW- to NNE–SSW-striking folds (
Figure 10a–d and
Figure 11a–d). These double-plunging folds typically extend across (perpendicular to) the Greenland–Iceland–Faroe Ridge for c. 400–500 km and terminate at the Rekjanes and Kolbeinsey oceanic domains (
Figure 10a–d, and
Figure 11a–b).
The dominant top-SSW vergence of the thrust systems and related asymmetric folds in NNE–SSW-trending seismic cross section (
Figure 2f) is comparable to that of late Paleoproterozoic Laxfordian structures in basement rocks around the Faroe Islands (Koehl et al., 2024a) and northern Scotland (Beach, 1974; Coward et al., 1980; Coward & Park, 1987). In NW–SE-trending cross section, the alternating top-southeast and top-northwest vergence of hundreds of meters- to km-wide asymmetric folds respectively on the northwestern and southeastern limb of the major, hundred-km-wide anticlines (e.g., Austurbrún and Iceland Basin anticlines) and their increased symmetry in the large anticlines’ hinge zone (
Figure 2a–e) also mimics the attitude of WNW–ESE-striking late Paleoproterozoic Laxfordian thrust systems around the Faroe Islands and onshore northern Scotland, which were reworked into hundred-km-wide, open, dominantly NNE-plunging folds during the Caledonian Orogeny and extend beyond seaward-dipping reflectors and feeder dyke complexes northwest of the Faroe Islands (Koehl et al., 2024a;
Figure 12a–b). In addition, the top-southeast, top-northwest, and top-SSW vergence of asymmetric folds and thrust surfaces in seismic reflection data (yellow and red lines in
Figure 2a–f) are consistent with the dominantly NNE-plunging character of the anticlines in magnetic data (
Figure 10a–d and
Figure 11a–d). The tens of km wide, mid–lower crustal disruption surfaces and related asymmetric folds (
Figure 2a–f,
Figure 5g, i–j, and l–n,
Figure 6c and e,
Figure 7a–j, and
Figure 8a–h) are therefore interpreted as hundreds (to thousand) km long, tens of km wide, overall WNW–ESE-striking and NNE-dipping Laxfordian thrust systems reworked during the Caledonian Orogeny (
Figure 12a–c; see also Koehl et al., 2024a their Figure 5a–c). The thrust systems mapped in the present study (
Figure 2a–f) are tentatively correlated with the Suðurøy and West Faroe fault zones of Koehl et al. (2024a).
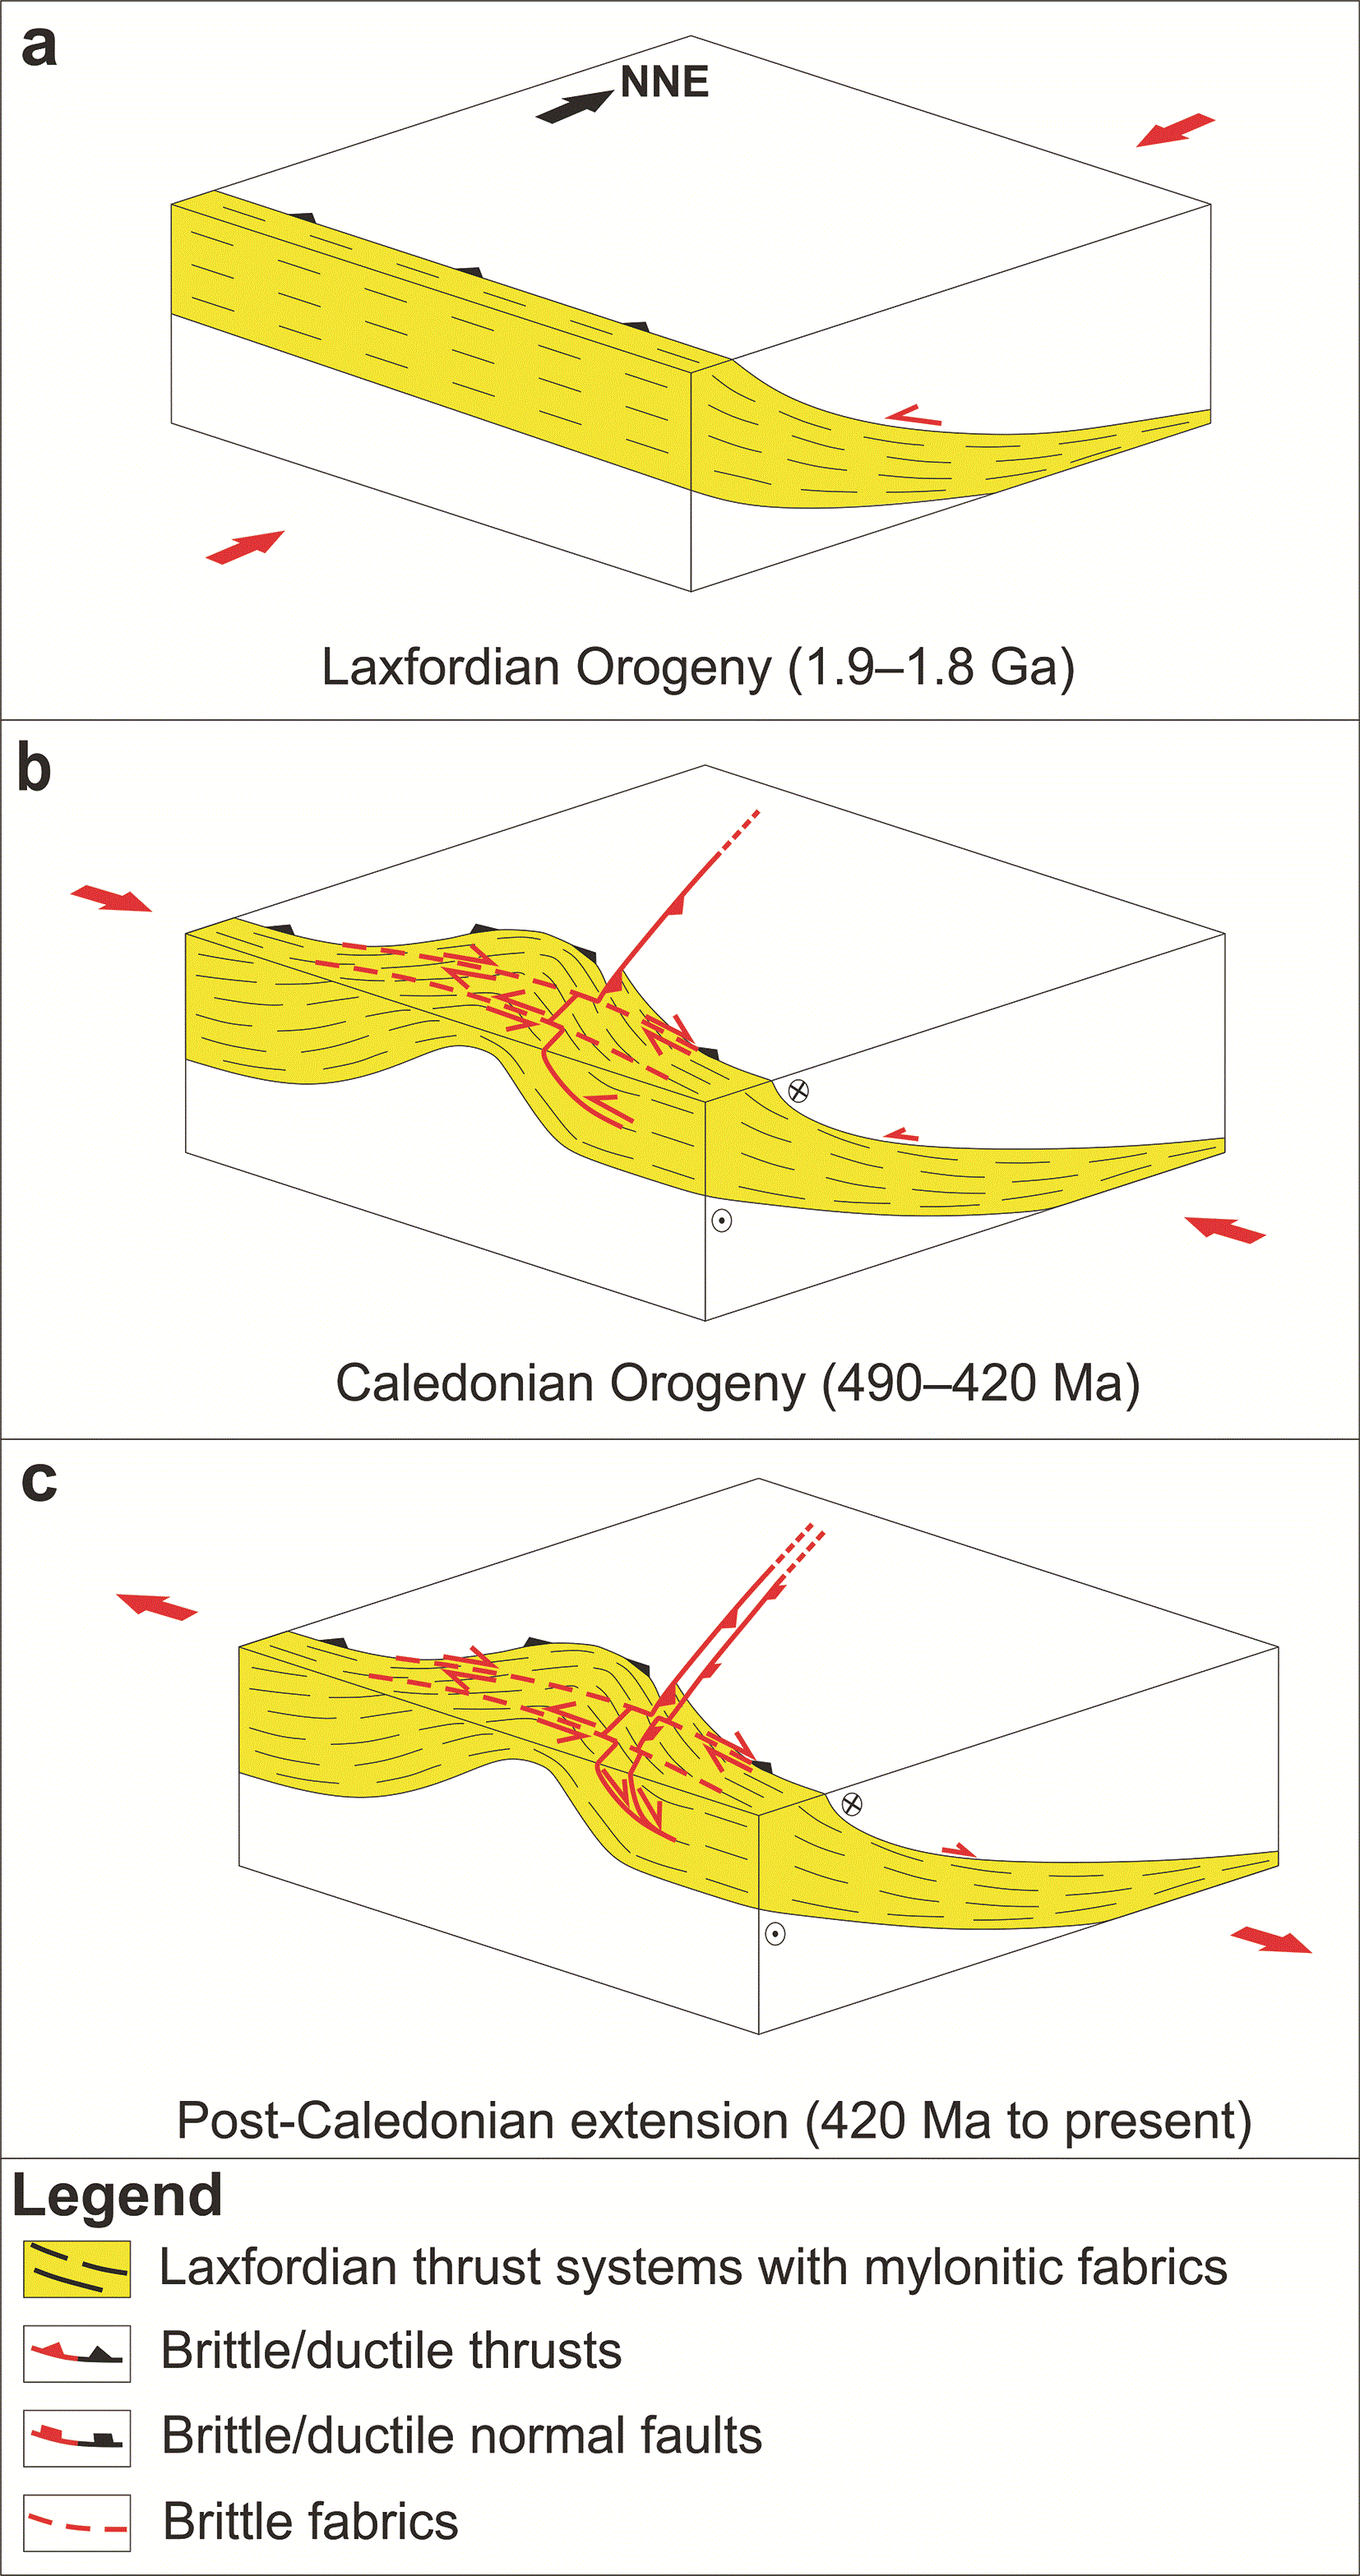
Figure 12. (a) Formation of top-SSW thrust systems during the (Neoarchean?–) late Paleoproterozoic (Badcallian–Inverian event and/or) Laxfordian Orogeny.
(b) Reworking of the thrust systems into hundred km wide, open, NNE–SSW-striking folds during the Caledonian Orogeny. Notice the potential formation of Caledonian thrusts on the limbs of the folded Paleoproterozoic thrust systems. (c) Post-Caledonian (i.e., Devonian–Permian and possibly Mesozoic–Cenozoic) inversion of Laxfordian and Caledonian structures. Modified after Koehl et al. (2024a).
Complementarily, given the occurrence of circular–oval igneous centers in the Iceland–Faroe Ridge and their alignment along both WNW–ESE- and NE–SW- to NNE–SSW-striking axes (
Figure 10a–d), it is probable that the core of the hundreds km wide anticlines also consist of Cenozoic intrusions. This is suggested by the subvertical disruptions in the hinge of the anticlines, which may correspond to feeder dykes along Caledonian axial fold cleavage (black lines in
Figure 2a–e), and by the c. 10-km-wide, 8.5–9.5 second-deep, high-amplitude, undulating reflections possibly reflecting lower-crustal (plutonic?) intrusions (fuchsia lines in
Figure 2a–e). These suggests that both Laxfordian and Caledonian structures acted as magma pathways in the crust.
Asymmetric folds are also found at depth > 8.0–9.0 seconds (TWT;
Figure 2a–f). This suggests that the mantle has also been involved in contractional folding. This further supports a long-lived tectonic history and, thus, a continental nature for both the crust and lithospheric (cratonic?) mantle at the Iceland–Faroe Ridge.
In the northwesternmost part of the Iceland–Faroe Ridge, some of the interpreted asymmetric reflections occur up to 0.5 second (TWT) below the seabed, thus suggesting a thinning of Cenozoic lava flows (
Figure 2a–e). The present interpretation as contractional structures could thus possibly be tested via drilling of these shallow occurrences.
A late Paleoproterozoic age for the WNW–ESE-striking thrust systems at the Iceland–Faroe Ridge is a conservative estimate since Laxfordian fabrics reactivated Neoarchean–earliest Paleoproterozoic WNW–ESE-striking Badcallian–Inverian fabrics (Attfield, 1987; Barooah & Bowes, 2009; Coward & Park, 1987; Evans & Lambert, 1974; Park, 1970; Storey et al., 2010; Zirkler et al., 2012).
Nature of the crust at the greenland–iceland–faroe ridge
Difference with oceanic crust
Typical oceanic crustal transects in seismic reflection data at various rifted margins worldwide are displayed in
Figure 13a–h. The crustal thickness at the Greenland–Iceland–Faroe Ridge is ≥23 km and up to 40 km (e.g., Bohnhoff & Makris, 2004; Darbyshire et al., 1998; Foulger et al., 2003; Funck et al., 2014), i.e., significantly thicker than Penrose-like oceanic crust (c. 7–8 km; Vine & Moores, 1972; Christeson et al., 2019;
Figure 13a–h). The lower part of oceanic crust typically includes sets of crisscrossed (conjugate?), margin-parallel, 5–10 km wide, planar to gently-undulating, moderate–high-amplitude reflections (
Figure 13a–h). These likely reflect magmatic sills in the gabbroic–dioritic lower oceanic crust (e.g., Hoggard et al., 2017 their Figure 2a–f; Reeve et al., 2021 their seismic facies 3; Sinha, 2024 his Figure 6.8; Vasileiou et al., 2023 their Figure 5a and 6a; oceanic crustal layer 3 of Vine & Moores, 1972). A magmatic origin for these reflections is supported by the absence of offset across these features (
Figure 13a–h). The relatively high acoustic impedance contrast produced by the sills may be explained either by relatively (ultra-) mafic intrusions in relatively isotropic gabbroic–dioritic lower oceanic crust, or by mafic–ultramafic intrusions in hyperextended continental crust (e.g., Geoffroy et al., 2022; Reeve et al., 2021).
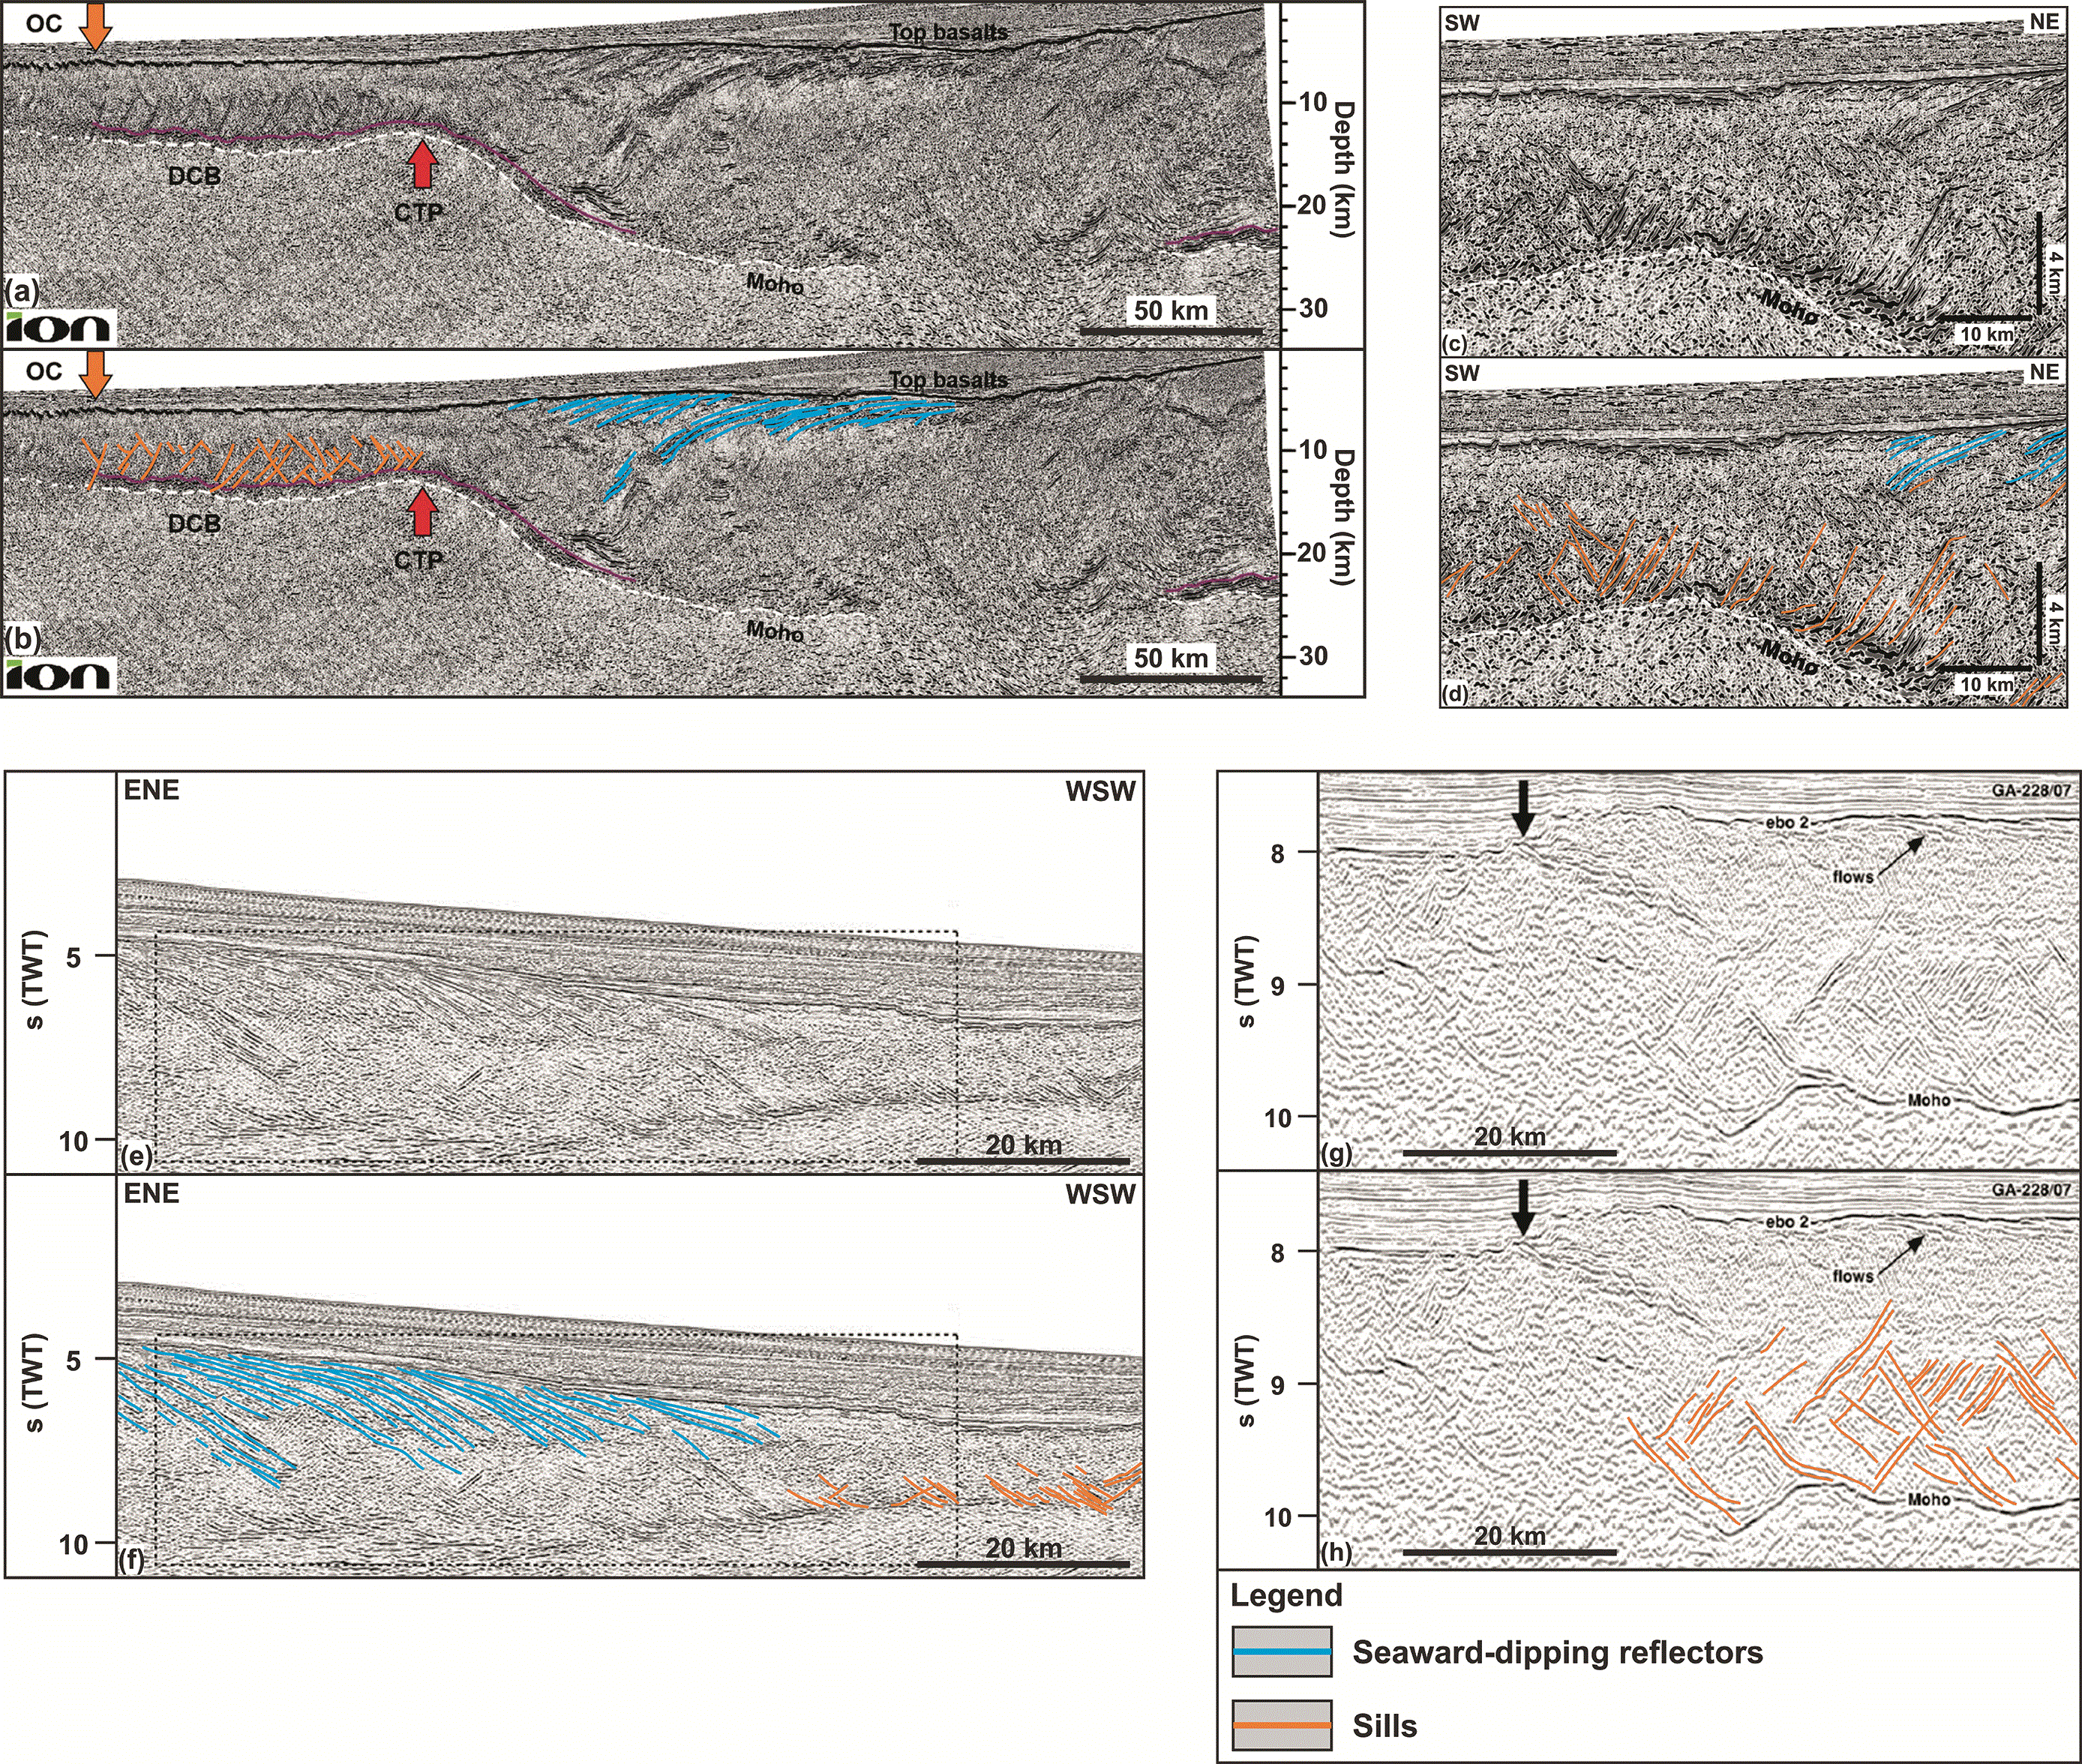
Figure 13. (a, c, e, and g) Uninterpreted and (b, d, f, and h) interpreted seismic sections at the continent–ocean boundary at rifted margins in (a–f
) Namibia and (g–h) Antarctica showing lower-crustal intrusions (orange lines) characteristic of 7–8 km-thick Penrose-like oceanic crust and seaward-dipping reflectors (blue lines) onto adjacent thinned continental crust.
The interpretation shown in (b, d, e, g, and i) is by the authors of the present study. Earlier interpretations are found in (a–d) Geoffroy et al. (2022; their Figure 3a and 4e), (e–f
) Sapin et al. (2021; their Figure 5), and (g–h) Sinha (2024; their Figure 6.8).
Such lower crustal, crisscrossed sills and related high- to moderately-amplitude reflections are absent at the Greenland–Iceland–Faroe Ridge (
Figure 2a–f). Instead, saucer-shaped sills occur in upper crustal sedimentary strata (e.g., Koehl et al., 2024a their Figure 2e). Furthermore, lower crustal magmatic sills in oceanic crust are typically broader (5–10 km wide) and display higher amplitudes (moderate to high;
Figure 13a–h) than the interpreted, low- to moderate-amplitude, hundreds of meters to km-scale, mid to lower crustal asymmetric folds at the Greenland–Iceland–Faroe Ridge (Figure 2a–f). In addition, the intrusions in hyperextended continental crust and Penrose-like oceanic crust are associated with relatively planar, i.e., undeformed, reflections (
Figure 13a–h; Geoffroy et al., 2022; Reeve et al., 2021; Sapin et al., 2021), whereas the curving and disrupted character of the mid–lower crustal asymmetric reflections at the Greenland–Iceland–Faroe Ridge suggests a long-lived history and involvement in tectonic deformation (
Figure 2a–f,
Figure 3,
Figure 4a–b,
Figure 5a–n,
Figure 6a–j,
Figure 7a–j, and
Figure 8a–h). Thus, despite the ≤5 km of upper crustal lavas, the crust at the Greenland–Iceland–Faroe Ridge is interpreted to be continental (
Figure 2a–f).
Possible analogs for the hundreds km wide, NE–SW- to NNE–SSW-striking anticlines at the Greenland–Iceland–Faroe Ridge are potential magmatic domes at rifted margins (e.g., Péron-Pinvidic, 2025) and abandoned spreading centers in oceanic crust (e.g., Ding et al., 2018). However, the radiant and crisscrossed reflection patterns observed at magmatic domes and interpreted as sheeted dykes (Péron-Pinvidic, 2025) are absent in the Greenland–Iceland–Faroe Ridge. In addition, there is no evidence of high-amplitude, subhorizontal reflections interpreted as axial, subaxial, or off-axis magmatic lenses as seen along and off the East Pacific Rise, Galappagos, and Juan de Fuca spreading centers (e.g., Boddupalli & Canales, 2019; Carbotte et al., 2021; Nedimović et al., 2005). Furthermore, the crust in these areas is 6–7.5 km thick, i.e., in the range of that of oceanic crust (Vine & Moores, 1972; Christeson et al., 2019).
A partial local similarity with lower oceanic crust is observed for the lowermost crust (depth of 6.0–9.0 seconds; TWT) at the Iceland–Faroe Ridge near southeastern Iceland, where the Moho appears more well-defined (
Figure 2a–e). There, lowermost crustal lensoidal reflection packages suggest the occurrence of relatively isotropic rock units, i.e., possible plutons (
Figure 2a–e). If such is the case, the relatively higher acoustic impedance contrast between the lower crustal rocks and mantle peridotites may result from the occurrence of young, relatively less dense, gabbroic–dioritic (density of c. 2.9–3.0), anorthosite (c. 2.9), or granitic plutons (c. 2.8) instead of high-density, continental, lower crustal rocks (e.g., eclogite and migmatite; density of c. 3.2–3.4; e.g., Birch, 1960; Birch, 1961; Cao et al., 2013; Coleman & Lanphere, 1971; Eshaghi et al., 2019; Glen et al., 2007; Henkel, 1976; Henkel, 1991; Hyndman & Drury, 1977; Ito & Kennedy, 1970; Jones, 2015 and references therein; Nilsen, 1973; Smithson, 1971; Ringwood & Green, 1966; Subrahmanyam & Verma, 1981; van der Straaten, 2008; Ye et al., 2022;
Table 1), the latter of which are probably responsible for the diffuse Moho in the rest of the ridge towards the Faroe Islands (
Figure 2a–f). This further suggests a continental nature for the crust at the Greenland–Iceland–Faroe Ridge.
Migmatite and ptygmatic folds
The early Cenozoic magmatic record of the North Atlantic Igneous Province at the Greenland–Iceland–Faroe Ridge, including igneous centers, thick lava flows, intrusions (e.g., dykes and sills), and seaward-dipping reflectors (e.g., Davison et al., 2010; Hitchen, 2004; Jolley et al., 2021; Koehl et al., 2024a; Parson et al., 1988; Smythe, 1983; Spence et al., 1989), and ongoing magmatism in Iceland (e.g., Harðarson et al., 2008; Sæmundsson, 1979) suggest a rich magmatic activity in the region. It is therefore necessary to consider the possibility that the interpreted asymmetric folds in seismic reflection data at the Iceland–Faroe Ridge are (partly?) of magmatic origin, e.g., partially molten rocks (migmatite).
Migmatites reflect partial melting of the bedrock due to increased pressure and temperature conditions (e.g., Mehnert, 1968). These typically include structures such as ptygmatic folds (Ghosh, 1966; Godfrey, 1954), whose origin has been debated. Ptygmatic folds occur when a relatively competent layer bounded by or within less competent rocks becomes folded. Their apparently chaotic organization and geometry with regard to other tectonic structures (e.g., foliation, folds, and shear zones) and nearby rock units may, in places, appear to be random (e.g., Ghosh, 1966 his Figure 14; Ramberg, 1959 his Figure 10), and in outcrop it may be tricky to measure the strike of ptygmatic folds and to compare it to that of other tectonic structures (Llorens et al., 2013).
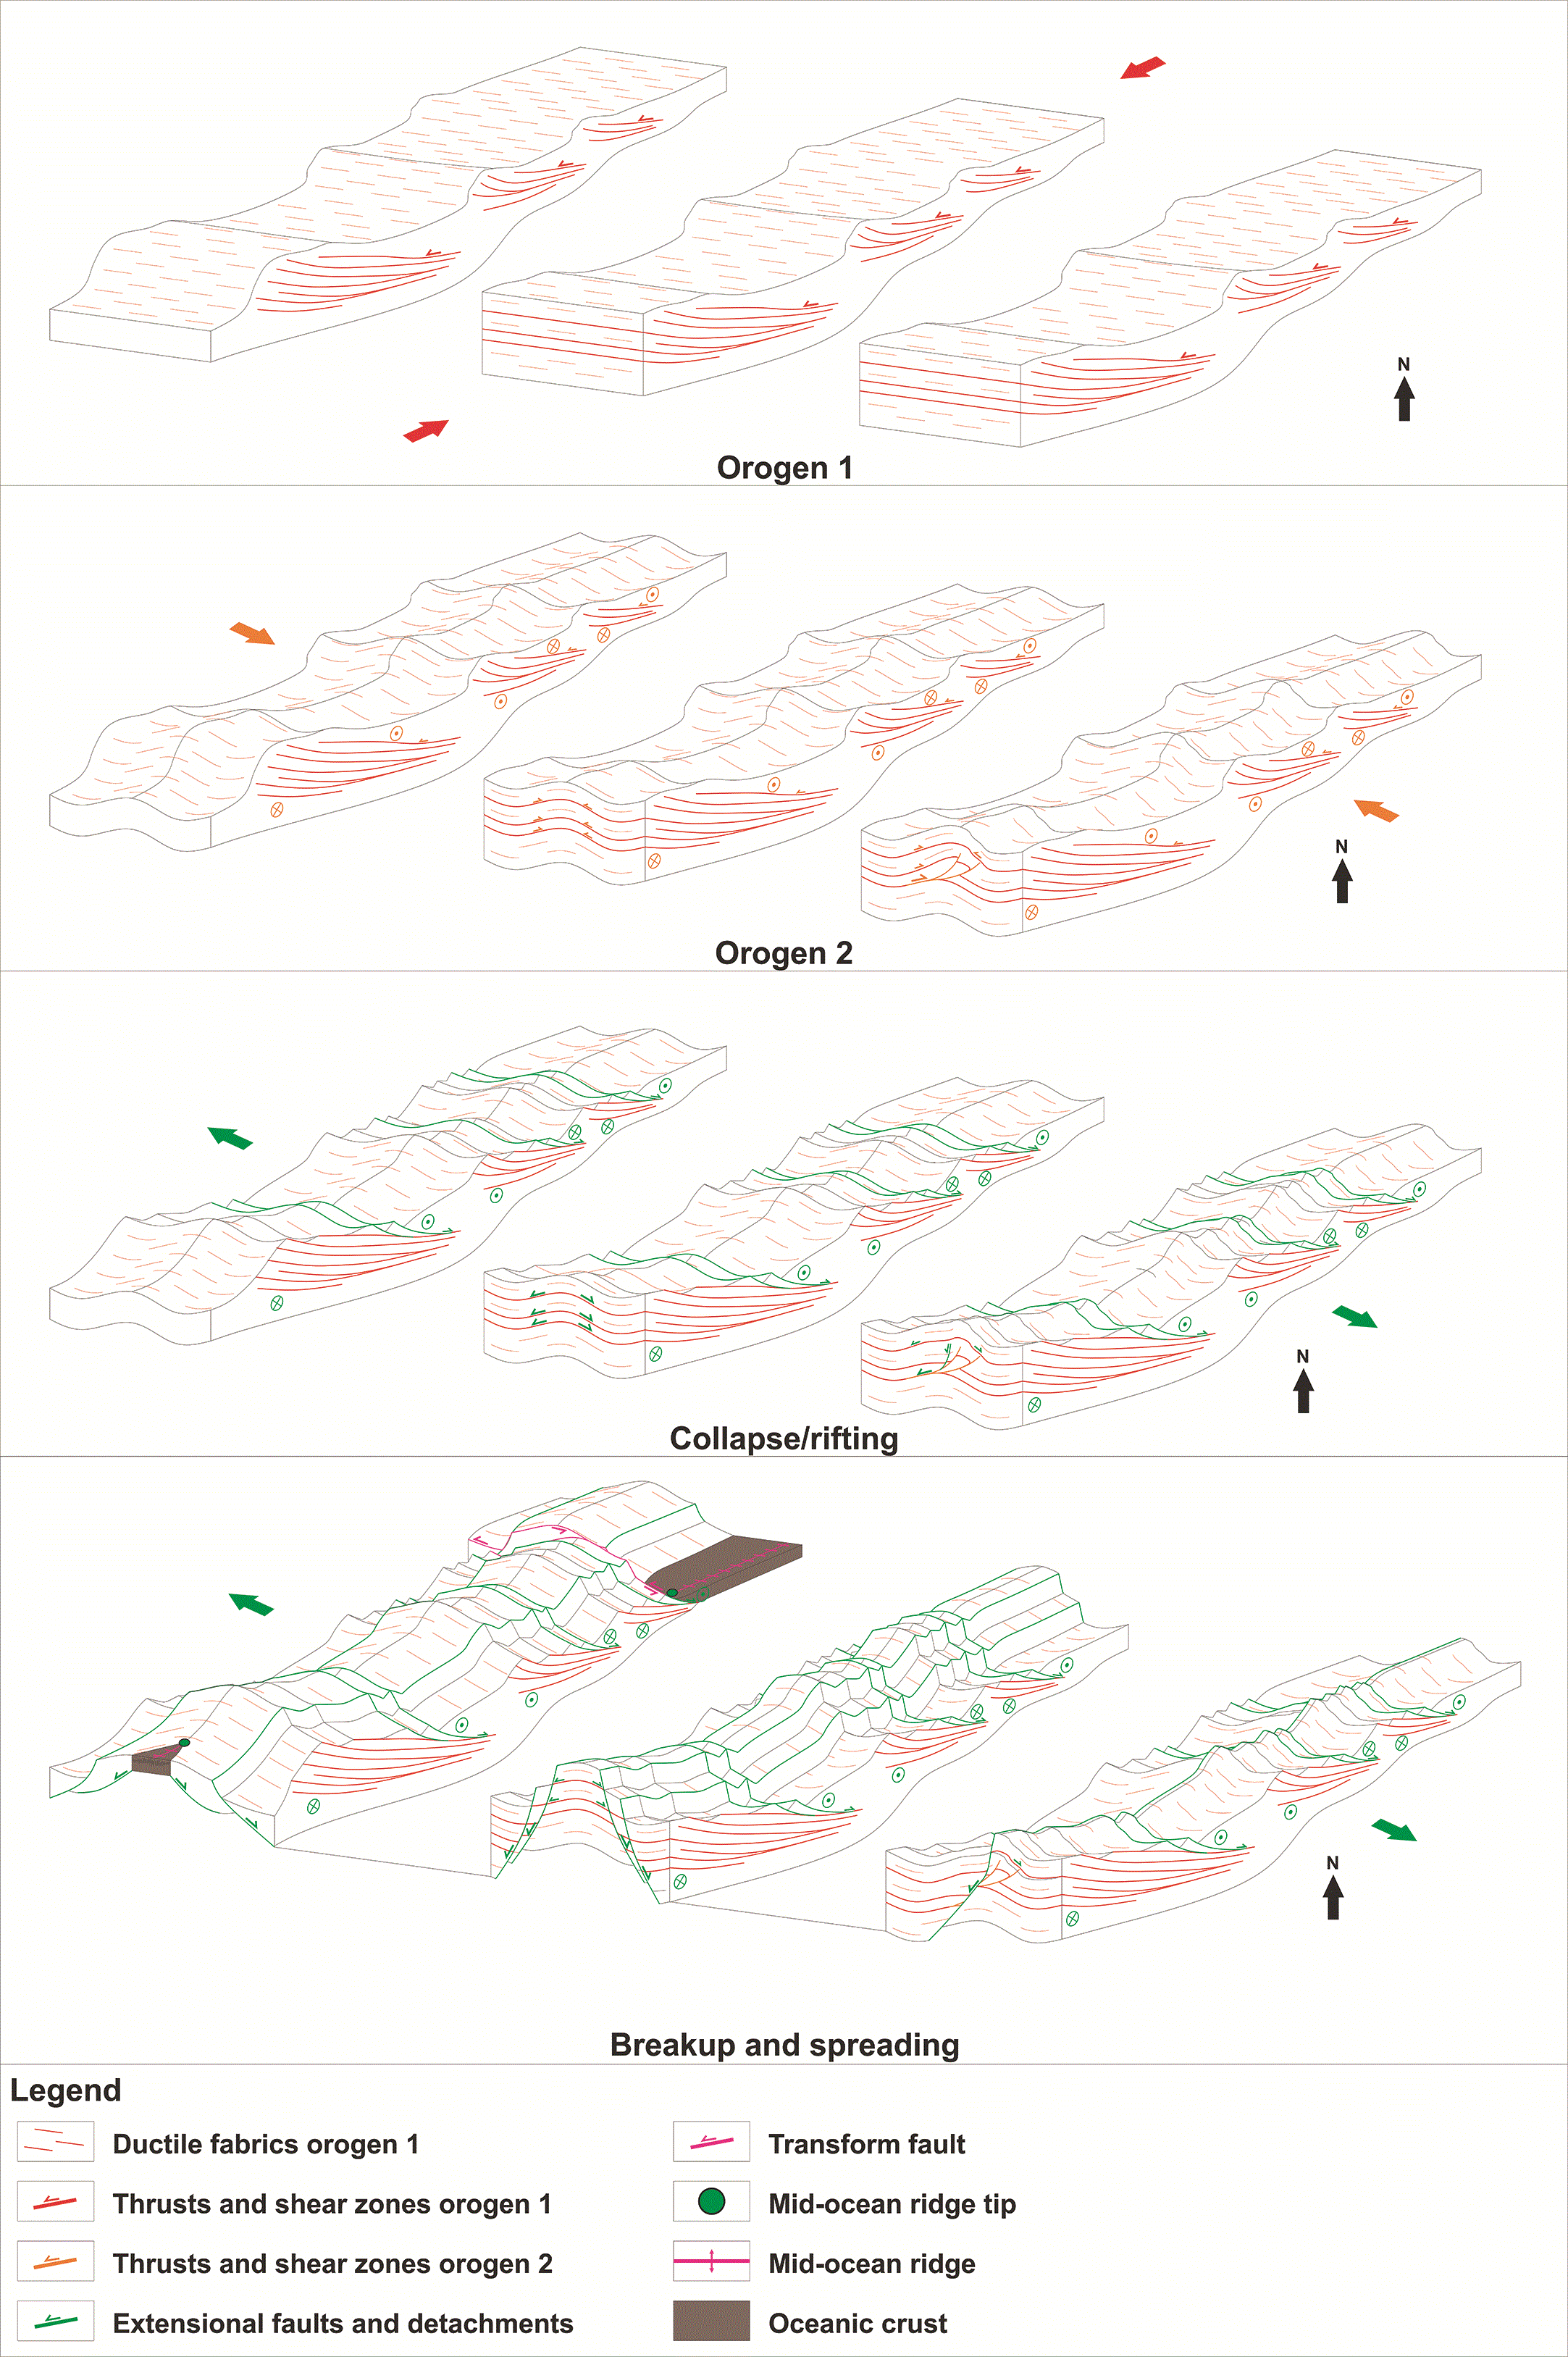
Figure 14. Schematic model showing the critical steps in the development of orogenic bridges through two orogeneses whose main stress directions (σ1) are perpendicular, repeated extension along extensional faults and detachments and inherited orogenic structures, and breakup along inherited, reactivated/overprinted orogenic structures.
Note that any number of additional orogeneses and/or extension (collapse/rifting) may be added in between these events. (a) First orogenesis deforming the crust, e.g., in the present case with a WNW–ESE-oriented maximum stress (Badcallian–Inverian event and/or Laxfordian Orogeny). (b) New period of orogenesis deforming the crust with the maximum stress oriented perpendicular to the first orogeny (i.e., NNE–SSW), thus resulting in reworking of preexisting orogenic structures, tightening of deformation, formation of new orogenic structures with highly oblique to perpendicular strike to those formed during the first orogeny, and further thickening and locking of the crust. Note that it is not necessary that the orogenic keel of the first orogeny be preserved as extensional collapse is likely to occur between the two orogenies. (c) Episode of extensional collapse and/or rifting thinning the crust through reactivation and overprinting of preexisting orogenic structures. Note that the crust is easier to thin at anticlines (uplift leading to increased erosion compared to synclines) and therefore it is easier to exhume the mantle there. Also note the strike-slip kinematic reactivation component of preexisting structures formed during the first orogeny. (d) Breakup occurs at non-orogenic or less tightly deformed portions of the crust, propagating towards tightly deformed crust. There, breakup is stalled because the crust is tightly deformed and “locked” by two sub-orthogonal structural trends, one of which is unsuitably oriented to thin the crust (structural fabrics formed during the first orogeny). This results in a scissor-like geometry at that end of the mid-ocean ridge (e.g., Reykjanes Ridge). The rift may then step sideways (e.g., opening of the Labrador Sea) and/or bypass the orogenically thickened crust, thus resulting in the formation of a major transform fault between the locked continental crust and the oceanic crustal domain (e.g., Tjörnes fault zone in northern Iceland). The portion of locked orogenic continental crust is hereby referred to as an “orogenic bridge” because it remains as a bridge of continental crust connecting two diverging continental plates (e.g., Greenland and Europe), while breakup has occurred on either side of the orogenic bridge, i.e., where the crust was not orogenically locked and, thus, was relatively quickly thinned down to breakup. The orogenic bridge may eventually rupture once enough extension has occurred (e.g., Newfoundland defining a continental salient into oceanic crustal domain denoting the existence of ruptured early–mid Paleozoic orogenic bridge related to the Appalachian–Caledonian Orogen; Koehl & Foulger, 2025).
Nevertheless, modern studies have shown that ptygmatic folding typically occurs under tectonic stress and consistently reflects the direction of maximum stress (e.g., Bathaeian, 2018). Thus, apparently chaotic, incoherent folding in migmatitic rocks is simply the result of the high viscosity contrast between the partially melted portion of the bedrock (neosome) and the remaining (unmelted) competent portion of the bedrock (mesosome) during coeval magmatic and tectonic processes. This way, the partially molten character (i.e., less competent) of the country rock offers less resistance to more competent rock layers, which can thus deform rapidly into relatively tight geometries under relatively low tectonic stress, i.e., similarly to competent layers in weak, mobile evaporite successions (e.g., Rowan et al., 2019). Thus, the geometry of ptygmatic folds is of tectonic origin and related to the dominant tectonic stress orientation during partial melting and/or follows the geometry of inherited tectonic crustal structures, which may create local stress perturbations. Alternatively, post-migmatization ptygmatic folding may result from the viscosity (competence) contrast of the leucosome, melanosome, and mesosome components of the bedrock, i.e., anyway of tectonic origin. Thus, despite a possible influence of magmatic processes (e.g., late Paleoproterozoic to present-day migmatization) on the formation of the interpreted hundreds of meters to km-scale, lower crustal fold structures at the Iceland–Faroe Ridge, their origin is more likely to be primarily tectonic, thus supporting a continental origin of the crust there.
Deep conductive layer under Iceland
Despite the lack of seismic reflection coverage over Iceland, the suggested presence of a high-grade metamorphic continental crust at the Greenland–Iceland–Faroe Ridge opens new possibilities. A continental nature of the lower crust under Iceland is suggested by the character of the deep conductive layer, which likely consists of iron- and titanium-rich and/or hydrated minerals such as amphibole (Arnason et al., 2025). It is possible that the higher conductivity in a WNW–ESE direction is related to magmatic-flow-related fabrics in gabbroic lower crust as observed in lower oceanic crustal rocks (e.g., Dilek et al., 1998; Trutner, 2016; VanTongeren et al., 2015). However, this would suggest a different nature for the lower 20 km of the Icelandic crust (i.e., below the 5–20-km-deep deep conductive layer), which show much lower conductivity (Arnason et al., 2025).
Iron-rich minerals include biotite (e.g., annite), which is common in high-pressure metamorphic rocks such as metapelite (e.g., in Scotland and Greenland; Lamont et al., 2025; Lang & Gilotti, 2015 – and elsewhere worldwide; e.g., Faryad, 1999; Mposkos, 1989). Biotite is also typically found in (mylonitic) shear zones and foliation where it can also be enriched in titanium (e.g., Pe-Piper et al., 2004).
Other iron- and titanium-rich rocks include mafic to ultramafic intrusions and anorthosite, the latter of which typically contains ilmenite and titanomagnetite (e.g., Charlier et al., 2014; Duchesne, 1999; Owens & Dymek, 1992; Årebäck & Stigh, 2000). Anorthosite is typical in Archean–Paleoproterozoic basement rocks in Greenland and Europe (e.g., Sotiriou & Polat, 2023), including in the late Paleoproterozoic Laxfordian Orogen in northern Scotland (Bergh et al., 2012; Frazer, 1977; Mason et al., 2004; Tarney & Weaver, 1987) and Ammassalit Belt in southeastern Greenland (Bridgewater et al., 1973; Moorlock et al., 1972; Nunes et al., 1974), i.e., the two continental margins bounding the Greenland–Iceland–Faroe Ridge (
Figure 1a–b). Both in northern Scotland and southeastern Greenland, Archean anorthosite is involved in late Paleoproterozoic, WNW–ESE-striking ductile foliation and (mylonitic) shear zones (Bridgewater & Myers, 1979; Bridgewater et al., 1973; Frazer, 1977; Nunes et al., 1974; Weaver & Tarney, 1980). Some anorthosites have been ascribed to partial melting of continental granulite (e.g., Moorlock et al., 1972; Oliver, 1977; Weaver & Tarney, 1980), and/or granulite protolith (e.g., charnockite; Mukherjee & Das, 2002), and/or contamination by continental crust (e.g., Ghose et al., 2008). Granulite and charnockite are dominant rock types both in the Lewisian Complex in northern Scotland and the Ammassalik Belt in southeastern Greenland (Bridgewater & Myers, 1979; Chadwick et al., 1989; Evans & Lambert, 1974; Frazer, 1977; Kalsbeek et al., 1993a; Park, 1970; Sutton & Watson, 1950; Tarney & Weaver, 1987; Weaver & Tarney, 1980).
These suggest the presence of continental crust with well-developed, WNW–ESE-striking, (mylonitic) ductile fabrics in high-grade metamorphic rocks (e.g., granulite and anorthosite) under Iceland. These fabrics are proposed to represent the continuation of the late Paleoproterozoic Laxfordian Orogen (Lewisian Complex) and Ammassalik Belt (
Figure 1a–b). This is further supported by the deep conductive layer’s higher conductivity in the extension direction (WNW–ESE; Arnason et al., 2025), i.e., parallel to the (Neoarchean?–) late Paleoproterozoic structures and fabrics in southeastern Greenland and northern Scotland (Bergh et al., 2012; Bridgewater & Myers, 1979; Chadwick et al., 1989; Mason et al., 2004) and in the Iceland–Faroe Ridge (
Figure 2a–f; present study and Koehl et al., 2024a), and its occurrence at a 5–20 km depth (Arnason et al., 2025), i.e., comparable to that of the potential thrust systems mapped in the Iceland–Faroe Ridge in the present study (
Figure 2a–f). It is also supported by the doming of the deep conductive layer under volcanic centers and geothermal fields, which mimics the attitude of the interpreted Caledonian anticlines interpreted in seismic and magnetic data (
Figure 2a–e,
Figure 10a–d, and
Figure 11a–d), which also rework Precambrian basement rocks in Greenland and Scotland (e.g., Andresen et al., 2007; Coward, 1980).
A continental nature of the lower crust under Iceland could also explain the occurrence of anorthosite inclusions in Cenozoic dolerite in western Iceland (Snæfellsnes Volcanic Zone;
Figure 1b; Griffin et al., 1974; Kristmannsdóttir, 1971) given the possible continental affinities of anorthosites (e.g., Ghose et al., 2008; Moorlock et al., 1972; Mukherjee & Das, 2002; Oliver, 1977; Weaver & Tarney, 1980) and presence of anorthosite in both northern Scotland and southeastern Greenland (Bergh et al., 2012; Bridgewater et al., 1973; Frazer, 1977; Mason et al., 2004; Moorlock et al., 1972; Nunes et al., 1974; Tarney & Weaver, 1987).
Differential thinning of the crust at the greenland–iceland–faroe ridge
A continental nature of the crust at the Greenland–Iceland–Faroe Ridge adds a new challenge to reconstructing plate tectonics in the northeastern Atlantic region. It suggests that, despite ongoing extension (e.g., Sigmundsson et al., 2020), breakup may not be complete or has occurred significantly later in Iceland than at the Reykjanes and Ægir–Kolbeinsey rift segments (
Figure 1a–b).
A possible way to reconcile delayed breakup at the Greenland–Iceland–Faroe Ridge with seafloor-spreading at adjacent rift segments and ongoing extension in Iceland is an initially relatively thicker continental crust at the Greenland–Iceland–Faroe Ridge. This is possible given the presence of late Paleoproterozoic thrust systems of the Laxfordian Orogen off the Faroe Islands and within the (Greenland–) Iceland–Faroe Ridge (
Figure 2a–f). A thickened orogenic keel is unlikely to have been preserved for 1.8 billion years, but a hypothesis of relatively thicker crust at the Greenland–Iceland–Faroe Ridge prior to the opening of the northeastern Atlantic does not require the continental crust to have been 70–80 km thick at the onset of rifting in the latest Cretaceous–early Cenozoic. The crust had already been thinned repeatedly, e.g., during late–post-Caledonian collapse and Permian and Jurassic–Early Cretaceous extension (e.g., Clift et al., 2004; Kimbell et al., 2016; Musgrove & Mitchener, 1996; Waddams & Cordingley, 1999). Thus, the hypothesis of relatively thicker continental crust at the Greenland–Iceland–Faroe Ridge simply requires a more efficient thinning of the orogenic crust at the Reykjanes and Ægir–Kolbeinsey rift segments than at the Greenland–Iceland–Faroe Ridge during these extensional episodes.
A thicker crust at the Greenland–Iceland–Faroe Ridge is supported by crustal thickness variations in northern Europe (e.g., Funck et al., 2014 their Figure 6.6; Kimbell et al., 2016 their Figures 3–4). Late Paleozoic collapse and Jurassic–Early Cretaceous extension had significantly thinned the crust to 5–6 km in the Southern Rockall and Møre basins, while the crust at the Greenland–Iceland–Faroe Ridge and nearby areas in northern Europe (Faroe Islands, Shetland Islands, Northern Rockall Basin, northern Scotland) is generally >10 km thick (except under the Faroe–Shetland Basin where it is down to 6–7.5 km; Funck et al., 2014; Kimbell et al., 2016).
Preserving a relatively thicker continental crust at the Greenland–Iceland–Faroe Ridge and delayed breakup in Iceland were likely facilitated by the orientation and geometry of 5–10 km thick, late Paleoproterozoic thrust systems (present study and Koehl et al., 2024a). Their WNW–ESE strike (i.e., perpendicular to the NE–SW-striking rift axis) was unsuitable to thin the crust, and their low-angle geometry was unsuitable to accommodate (transform-related) strike-slip faulting (
Figure 2a–f).
In addition, the dominantly diffuse Moho below the Iceland–Faroe Ridge (
Figure 2a–e) suggests that the crust is mechanically stronger and that these inherited thrusts consist of high-density rocks (i.e., density comparable to mantle peridotite), which are relatively resistant to further deformation (e.g., eclogite, granulite, and migmatite). A mechanically stronger crust under the Greenland–Iceland–Faroe Ridge, Faroe Islands, and northern Scotland is also supported by the northward step in the Mesozoic rift system between the Southern Rockall Basin and the Northern Rockall Basin, which coincides with the Scottish Hebrides where prominent, late Paleoproterozoic, WNW–ESE-striking Laxfordian shear zones are well known onshore (Beach, 1974; Coward & Park, 1987).
The well-developed, long-lived, late Paleoproterozoic (to Neoarchean?), rift-orthogonal orogenic fabrics at the Greenland–Iceland–Faroe Ridge formed prior to the occurrence of all known tectonic episode with NW–SE-oriented main stress in the region, e.g., rifting of Iapetus (?), Caledonian Orogeny, late–post-Caledonian collapse, Variscan Orogeny (?), and Permian, Jurassic–Early Cretaceous, and Cenozoic rifting. Given their unsuitable orientation to contribute to thinning or thickening the crust under NW–SE-oriented stress and their probably relatively resistant constitution (e.g., eclogite, migmatite, granulite, and/or anorthosite), WNW–ESE-striking, preexisting, rift-orthogonal structures are believed to have locally hindered the development of NNE–SSW- to NE–SW-striking fabrics during subsequent tectonic episodes with NW–SE-oriented main stress. Thus, while rifting has efficiently used well-developed, rift-parallel (NNE–SSW-striking) Caledonian structures off the (north-) western coast of Norway and northern coast of Ireland (e.g., Clift et al., 2004; Doré et al., 1999; Musgrove & Mitchener, 1996; Norton et al., 1987; Péron-Pinvidic & Osmundsen, 2020), which led to early breakup and seafloor spreading northeast and southwest of Iceland, the lack of well-developed rift-parallel, pre-rift structures delayed these processes at the Greenland–Iceland–Faroe Ridge.
The present interpretation can be further tested by acquiring new WNW–ESE- to NW–SE- and NE–SW-striking seismic reflection transects over Iceland and/or potentially by reprocessing the KRISE seismic reflection transect north of Iceland. The latter is, however, less ideal because oriented E–W and only partially overlapping the Greenland–Iceland–Faroe Ridge. Drilling the lower crust in Iceland and the Iceland–Faroe Ridge and/or Greenland–Iceland Ridge would also provide additional constraints on the nature and composition of the crust.
Assuming a pre-rift crustal thickness of c. 35 km at the Greenland–Iceland–Faroe Ridge, Faroe Islands, and northern Scotland (e.g., Funck et al., 2014), a ≥ 23 km thick crust at the Greenland–Iceland–Faroe Ridge at present (Bohnhoff & Makris, 2004; Darbyshire et al., 1998; Foulger et al., 2003), and an average 5 km cap of lava flows (i.e., ≥ 18 km thick mid–lower crust), a maximum of 17 km crustal thinning has occurred pending no contribution from diking (i.e., magma intrusions and resulting crustal growth along sub-vertical fractures).
Stretching of the middle to lower crust in the Iceland–Faroe Ridge is apparent from localized inversion of the main thrust surfaces and S–C-like fabrics within WNW–ESE-striking thrust systems (e.g., extensional duplexes), especially where reworked as NNE–SSW-striking folds (
Figure 2a–f and
Figure 8a–h and Koehl et al., 2024a their Figure 3e).
Other indications of Cenozoic extension in the mid–lower crust at the Iceland–Faroe Ridge include potential NNE–SSW-striking dykes intruded in the hinge zone of NNE–SSW-striking Caledonian anticlines (i.e., potential diking along Caledonian axial fold cleavage?;
Figure 2a–e and
Figure 4a) and similarly striking sills intruded perpendicular to inverted portions of WNW–ESE-striking thrust systems, e.g., Wyville–Thomson fault zone (Koehl et al., 2024a their Figure 3e;
Figure 1b), possibly in response to (tensile?) fracturing during extensional inversion. Swarms of magmatic sills intruded perpendicular to an inverted major thrust system also occur in Svalbard (Koehl et al., 2022 their Figure 3e and 6d–e, Koehl et al., 2024b their Figures 3–7), thus suggesting this is not an isolated phenomenon and should be further investigated to evaluate the influence of the inversion of crustal-scale thrust systems on partial melting and swarms of magmatic intrusions.
Orogenic bridges and implications for plate tectonics
Transform margins have been known for their relatively abrupt continent–ocean transition (e.g., Lundin et al., 2022; Mercier de Lépinay et al., 2016). Lundin et al. (2022) proposed that the abrupt transition from thick continental to thin oceanic crust at transform margins suggests very limited pre-breakup lithospheric thinning at such margins. This contrasts with evidence from the geological record in the northeastern Atlantic region. In the Fram Strait, at least two episodes of post-Caledonian, pre-Cenozoic extension were recorded in the latest Silurian–earliest Permian (Braathen et al., 2018; Chorowicz, 1992; Gudlaugsson et al., 1998; Koehl & Muñoz-Barrera, 2018; Koehl et al., 2022; Koehl et al., 2023b; McCann & Dallmann, 1996; Roy, 2007; Stemmerik et al., 1991; Strachan, 1994) and Late Jurassic–Early Cretaceous (Faleide et al., 1984; Faleide et al., 1993; Indrevær et al., 2013; Blaich et al., 2017). The Greenland–Iceland–Faroe Ridge margins recorded at least three pre-breakup tectonic episodes, including late–post-Caledonian collapse and Permian–Triassic and Jurassic–Early Cretaceous extension (Clift et al., 2004; Kimbell et al., 2016; Musgrove & Mitchener, 1996; Waddams & Cordingley, 1999). It is therefore probable that some lithospheric thinning did occur but was less efficient at these transform margins.
A model that reconciles repeated extension at transform margins with their abrupt continent–ocean transition is that of orogenic bridges, i.e., the hindering of crustal thinning and breakup by rift-oblique orogenic structures and fabrics (Koehl & Foulger, 2025;
Figure 14a–d). Orogenic bridges consist of intensely deformed continental crust tightened into at least two orogenic episodes with sub-orthogonal main stress (
Figure 14a–b). The crust is then thinned during several episodes of late–post-orogenic collapse and rifting (
Figure 14c). Breakup then occurs at inherited, rift-parallel orogenic structures and major transform faults develop at inherited, rift-orthogonal orogenic structures (
Figure 14d; Koehl & Foulger, 2025).
An interpretation of the Greenland–Iceland–Faroe Ridge as thinned (orogenic) continental crust implies that the presumed mantle plume under Iceland is not responsible for the anomalously thick (25–40 km) crust at the Greenland–Iceland–Faroe Ridge.
A continental nature of the crust at the Greenland–Iceland–Faroe Ridge fits the interpreted seismic reflection and magnetic data (
Figure 2a–f,
Figure 10a–d, and
Figure 11a–d). It is also in agreement with seismic attenuation under Iceland, which suggests a relatively cold lower crust (Menke & Levin, 1994), the strong continental affinities of lavas in eastern Iceland (Torsvik et al., 2015), and possibly explains why the distance between some of the oldest lavas onshore Iceland is about twice larger than what is predicted by the full-plate spreading rate (Foulger, 2006).
The interpretation of a continuous late Paleoproterozoic (to Neoarchean?) orogenic belt between the Faroe Islands and Iceland suggests a potential extended link (ca. 1.8 Ga up to 2.6 Ga) between Laurentia, Baltica, and Avalonia. This is also suggested by new constraints on the late Neoproterozoic Timanian Orogen in northern Laurentia (Estrada et al., 2018a; Estrada et al., 2018b; Rosa et al., 2016) and northern Baltica (Klitzke et al., 2019; Koehl, 2020; Koehl et al., 2022; Koehl, 2025; Koehl & Mottram, 2025). These new anchors significantly reduce the possible paleo plate movements of these three cratons relative to one another and as a whole in the past 1.8 Gyr. The similar WNW–ESE strike of late Paleoproterozoic structures in Greenland (Bridgewater & Myers, 1979; Chadwick & Vasudev, 1989), the UK (Attfield, 1987; Beach, 1974; Coward et al., 1980; Coward & Park, 1987; Evans, 1965), and Scandinavia (Bergh et al., 2012; Nordgulen & Saintot, 2008; Saintot et al., 2011) indicates that plate models and paleogeographic reconstructions involving rotation (e.g., Cocks & Torsvik, 2002; Merdith et al., 2021; Rehnström et al., 2002; Torsvik & Rehnström, 2001) are not realistic and that all three cratons have most likely remained in a configuration similar to present day for the past 1.8 Gyr (e.g., Cao et al., 2021). In addition, pinning these three cratons to one another for the past 1.8 Gyr reduces the realm of their possible movements as a whole due to the increased size.
The present model of orogenic bridge should be tested at other margins where mantle plumes were proposed to explain anomalously thick crust, e.g., Walvis Ridge (Bai et al., 2024; Fromm et al., 2015), Rio Grande Rise (Hoyer et al., 2022), Mozambique Ridge (Jacques et al., 2019; O’Connor et al., 2019), Madagascar Ridge (Sato et al., 2022). Additional long-lived connections between other cratons (e.g., late Neoproterozoic Damara Belt in Namibia and Dom Feliciano Belt in South America and possibly at the Walvis Ridge and Rio Grande Rise; Koehl & Foulger, 2025) would further reduce the uncertainty around paleo plate reconstructions and provide new constraints on future plate movements and related geohazards and distribution of natural (e.g., hydrocarbon, hydrogen, geothermal, mineral) resources.









