Introduction
The beetle Cerambyx cerdo Linnaeus, 1758 is a xylophagous insect that can be considered as an indicator of forest maturity and health. This is why, in the European Union, this species is protected through its inclusion in Annexes II and IV to Council Directive 92/43/EEC, of 21 May 1992, about conservation of natural habitats and of wild fauna and flora. The protection of this species is based on the importance of maintaining the ecological balance of forests, as Cerambyx cerdo plays an important role in the decomposition of old or weakened trees. However, despite this protection, in certain regions of southern Spain, Cerambyx cerdo together with Cerambyx welensii (Küster, 1846), both species that share geographical distribution and lifestyle habits (Torres-Vila et al., 2023), they are considered a pest due to their abundance and the damage they cause to trees, especially those of the genus Quercus.
This research work has been carried out thanks to project 101156076 – Dryad, under the European Union Horizon Programme, which aims at the demonstration and modelling of Nature based Solutions (NbS) to improve the resilience of Mediterranean Agrosilvopastoral Ecosystems (MAE).
The work has focused on research and development of an autonomous system for the non-invasive detection of Cerambyx cerdo on trees, thus avoiding its felling as a detection method. The work was coordinated by the Natural Heritage Foundation of Castile and León, with the participation of M2Sensors as experts in IoT and manufacturers of
Termidetect® equipment, on the one hand, and the Department of Zoology of the University of Córdoba, on the other, for the collection and analysis of samples of live Cerambyx specimens.
Methods
The methodology followed in this work comprises the following steps:
1.
Taking samples: two Cerambyx larvae have been located in their natural habitat and kept alive for controlled laboratory observation.
2.
Register of audios: Termidetect® brand equipment has been used to capture microvibrations generated by insects when feeding on wood.
3.
Selection of registers: the audios obtained have been filtered to identify those containing the signals characteristic of the activity of Cerambyx.
4.
Development of the algorithm: using Python (Python Software Foundation, 2023) and signal processing and Machine Learning techniques, acoustic patterns associated with insect behaviour have been detected.
5.
Integration into the micro-controller
: adaptation of the algorithm for execution on the embedded 32-bit system of the Termidetect® equipment.
6.
On-site validation: field tests with 10 devices installed on common oaks (Quercus robur Linnaeus, 1753) and holm oaks (Quercus ilex Linnaeus, 1753) on a parcel in the province of Salamanca.
Taking samples
The samples obtained come from the municipality El Viso in the province of Córdoba (38° 30′ 02.5″ N, 5° 00′ 06.0″ W). From the falling branches of a holm oak (Q. ilex), 20–25 cm in diameter, several pieces of approximately 30–35 cm in length were cut; from one of these pieces a larvae (Figure 1), which was subsequently returned to its gallery of origin for laboratory study. In another piece, another larvae was detected which was not extracted and which has also been tested in the laboratory.
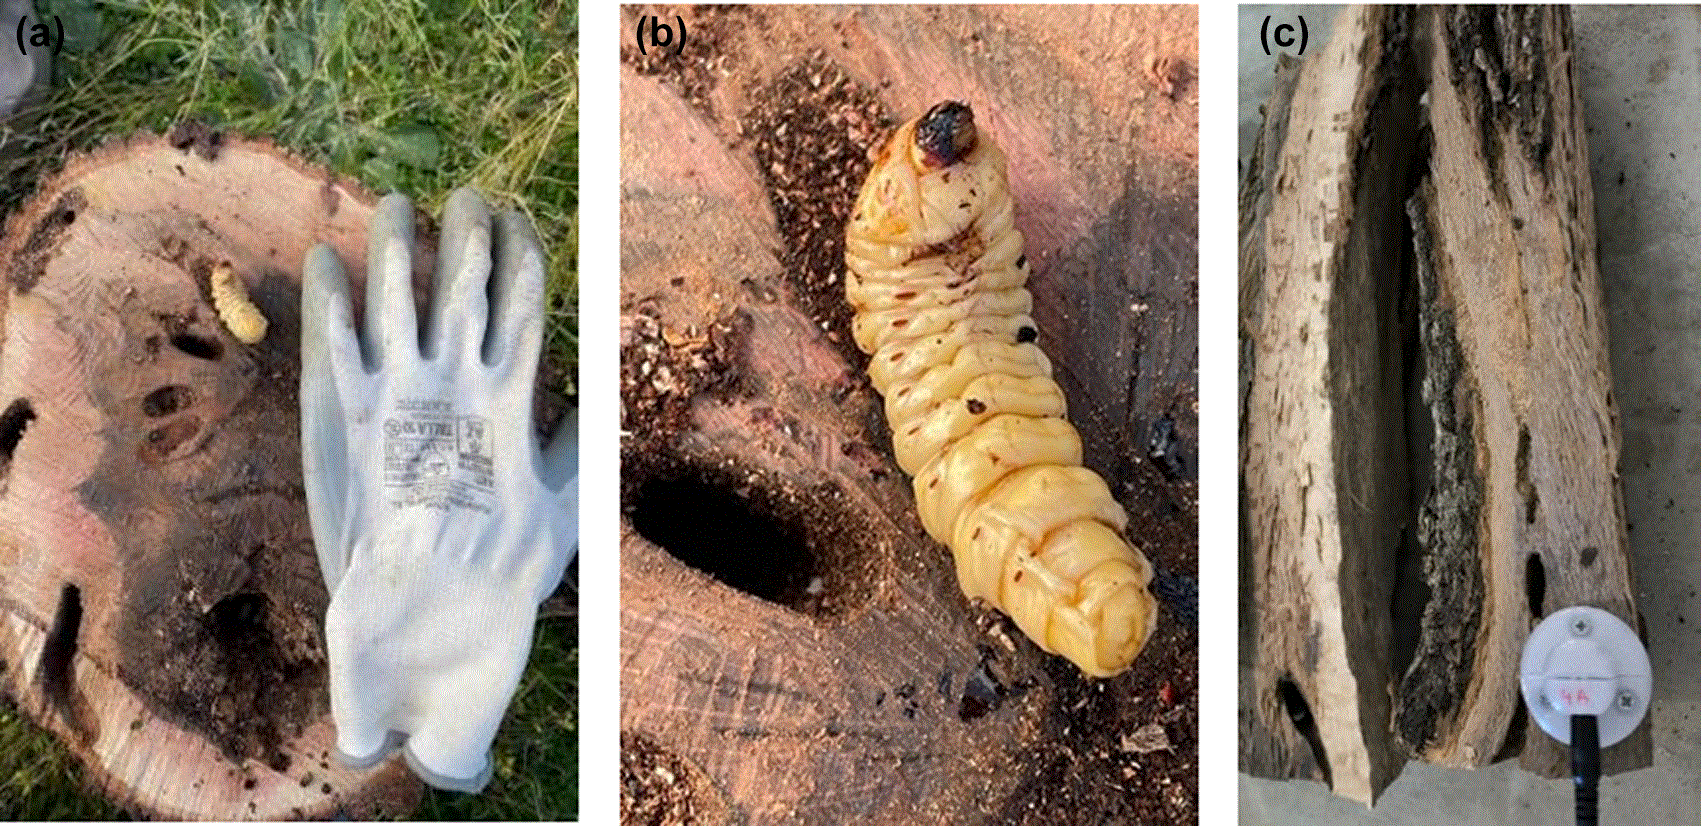
Figure 1. Obtaining Cerambyx larvae.
Left: freshly extracted larva compares to a glove size XL; Centre: larval detail; Right: sensor.
Given that in Córdoba Cerambyx cerdo and Cerambyx welensii they live together in the same area, even on the same tree (Torres-Vila et al., 2017) and that their larvae are similar in size and appearance, it is not possible to guarantee with certainty to which of them the registered specimens belong until they complete their development (see results). However, it is expected that the behaviour of the larva and its digital footprint when eating the wood will be similar for both species.
The first larvae obtained was approximately 5 cm long (Figure 1), indicating that it was at an advanced larval stage. During transport and laboratory testing the specimen has been kept in the pieces of holm oak trunk from which it had been removed. In Figure 1 you can see the larvae and a sensor to record your sounds.
The second specimen of Cerambyx captured was found on the basis of sound recording, without displaying the larvae. The specimen was captured, transported and stored on a piece of wood measuring 35 × 20 × 13 cm from the holm oak from which it was removed (Figure 2).
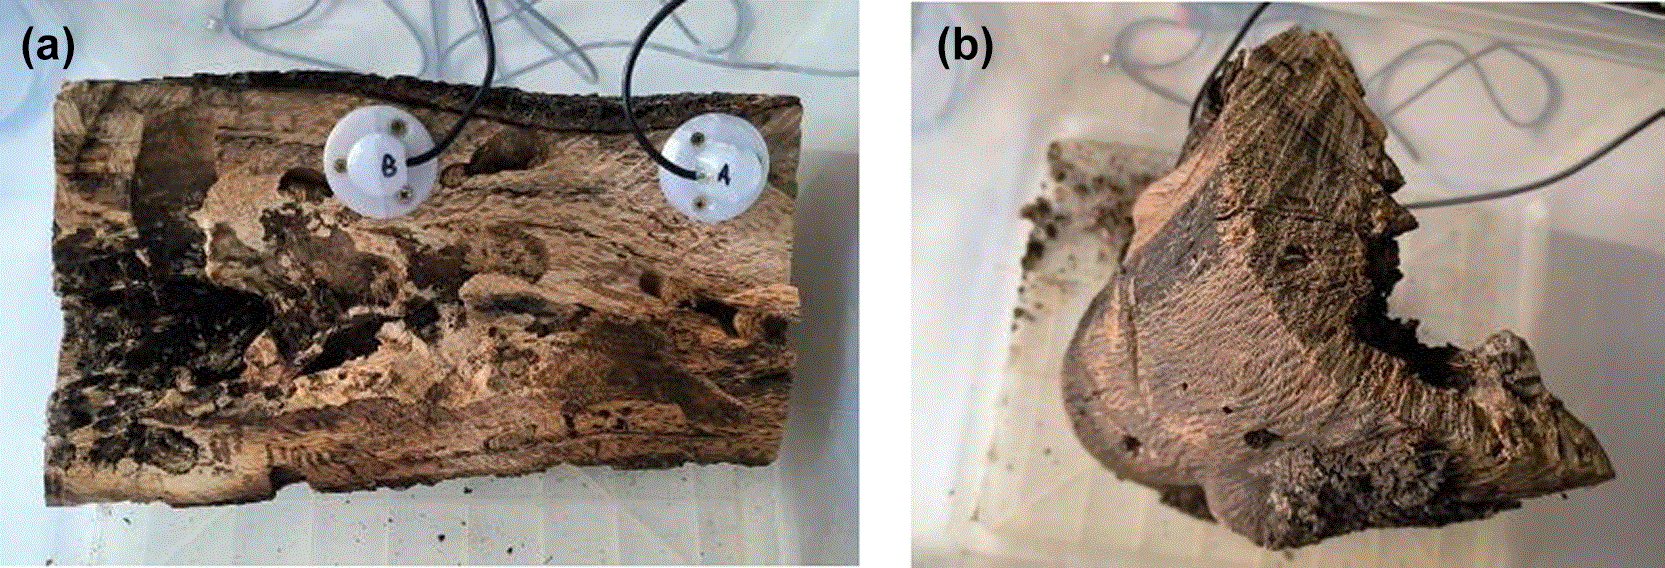
Figure 2. Second sample of Cerambyx.
Registration and selection of audios
Audio recordings of the 2 pieces of Cerambyx were made in the laboratory of the University of Córdoba. Termidetect® brand equipment, version SIMAT v1.0 with 3 input channels (Figure 3). The records have been carried out continuously, for several days. The audio configuration has been 44 100 Hz for each channel and 16 bit encoding. The data have been stored on the local 32 GB micro-SD card of each device. Most records have been carried out at night to ensure low noise levels.
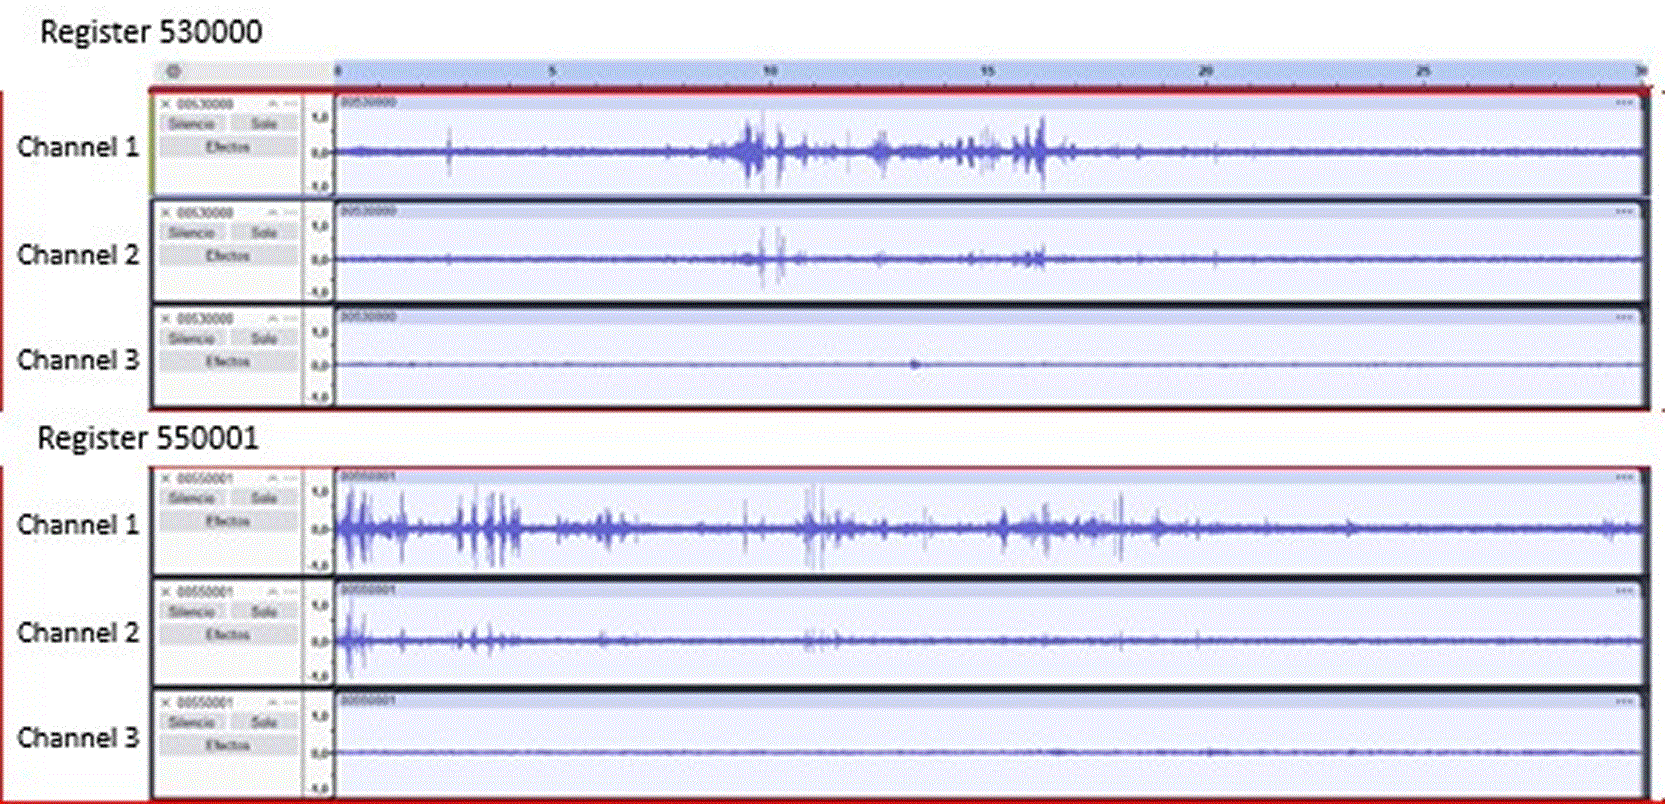
Figure 3. Graphs of the 3 channels out of 2 of the records obtained.
For the first sample, only one sensor was used, while for the second sample, 2 vibration sensors of the same type as for the first sample and an environmental microphone were used. The data from the 3 sensors in the second sample are synchronized, making it possible to discern whether the source of the sound is ambient or of the piece of wood monitored.
From the two samples shown in
Figure 3, it can be seen that the environmental noise level, recorded on channel C, is almost zero, confirming that the sound recorded on channels A and B is from the larvae found in the wood. In addition, when comparing the maximum amplitude between channel A and channel B signals, the larvae can be considered to be closer to the sensor connected to channel A.
All the records have been reviewed and those that most clearly captured the activity of the larvae have been selected. This task of preparing samples is critical to obtaining good results.
Algorithm development
The algorithm has been developed using Python (Python Software Foundation) in a Linux (Ubuntu) operating system environment. Previously selected audio logs have been used during algorithm training.
The algorithm development pipeline consists of 5 phases, ranging from audio signal processing to model validation in the target hardware:
Phase 1: audio signal pre-processing
Phase 2: extraction of acoustic characteristics
Phase 3: training of the classification model
Phase 4: model optimisation and conversion for embedded systems
Phase 5: performance evaluation and analysis of results
The main challenge in the feature vector selection and description phase is the balance between the information wealth of the features and the computational restriction imposed by the 32-bit microcontroller of Termidetect® equipment. Initially, an extensive set of more than 60 potential acoustic features was considered. However, a thorough analysis of class separability, stability and computational cost led to the selection of an optimal and highly representative subset of only 8 characteristics. This drastic reduction in dimensionality is essential to ensure the efficient inference of the device.
Given the similarity of the acoustic signals of xylophagous insects, Cerambyx recordings have been compared with those of termites to differentiate them. Audio records of the species of termites Reticulitermes grassei,
obtained in the same laboratory at the University of Córdoba, have been used for this purpose in a previous R&D&i project. A comparative visual analysis of the 4 selected acoustic characteristics is presented in
Figure 8, showing their distribution for each of the three audio classes (termite, Cerambyx and noise) using box diagrams.
Each of the eight subgraphs (Figure 4) corresponds to a specific characteristic, making it possible to observe how their values vary (on the Y axis, normalised) between the different classes (on the X axis). This visualisation is a key tool to validate the feature selection step, as it allows to qualitatively assess the ability of each descriptor to differentiate the classes of interest.
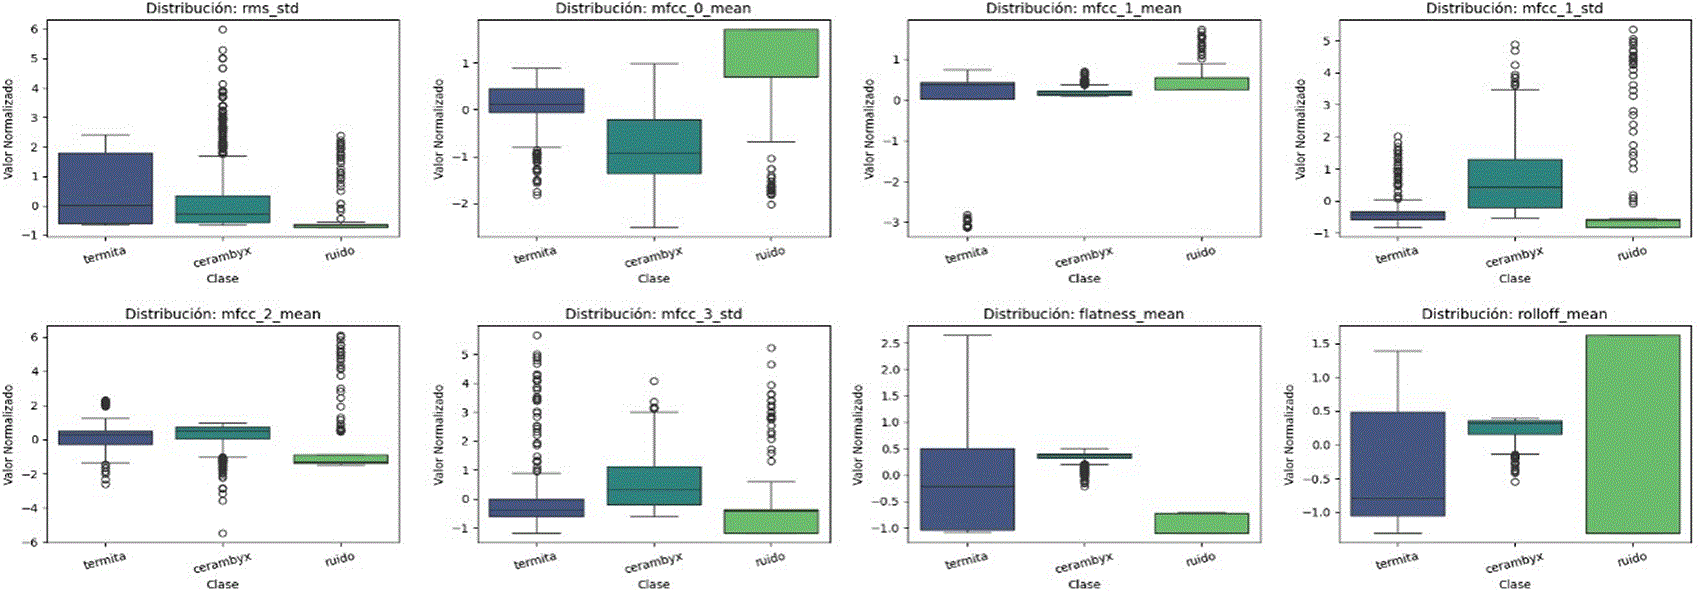
Figure 4. Box diagrams comparing the distribution of each of the 8 selected features through the three audio classes.
The heart of the system is a classification model based on an artificial neural network. For their training, network parameters were adjusted using a previously labelled dataset, with the aim of mapping vectors of characteristics to their corresponding classes. Optimisation techniques such as class balancing using SMOTE (Lemaître et al., 2017) and regularisation using Dropout and Batch Normalisation (Abadi et al., 2016) were implemented to prevent overadjustment.
To further improve the robustness of the model Mixup (Zhang et al., 2018) was used. This method creates new training examples by mixing two existing examples and their labels. By training with these ‘mixtures’, the model learns softer transitions between classes, becoming less susceptible to noise and variations in the input data.
The final validation of the system was performed to quantify its effectiveness in a test data set, completely independent of the one used during training. A total of 553 audio samples were assessed.
The model achieved an overall accuracy of 88.4%, indicating a high degree of accuracy in the overall classification. This value represents the percentage of correct predictions on the total number of samples assessed.
Next confounding matrix (Figure 5) provides a detailed picture of the model performance for each class, showing the correct predictions on the main diagonal and classification errors outside the main diagonal.
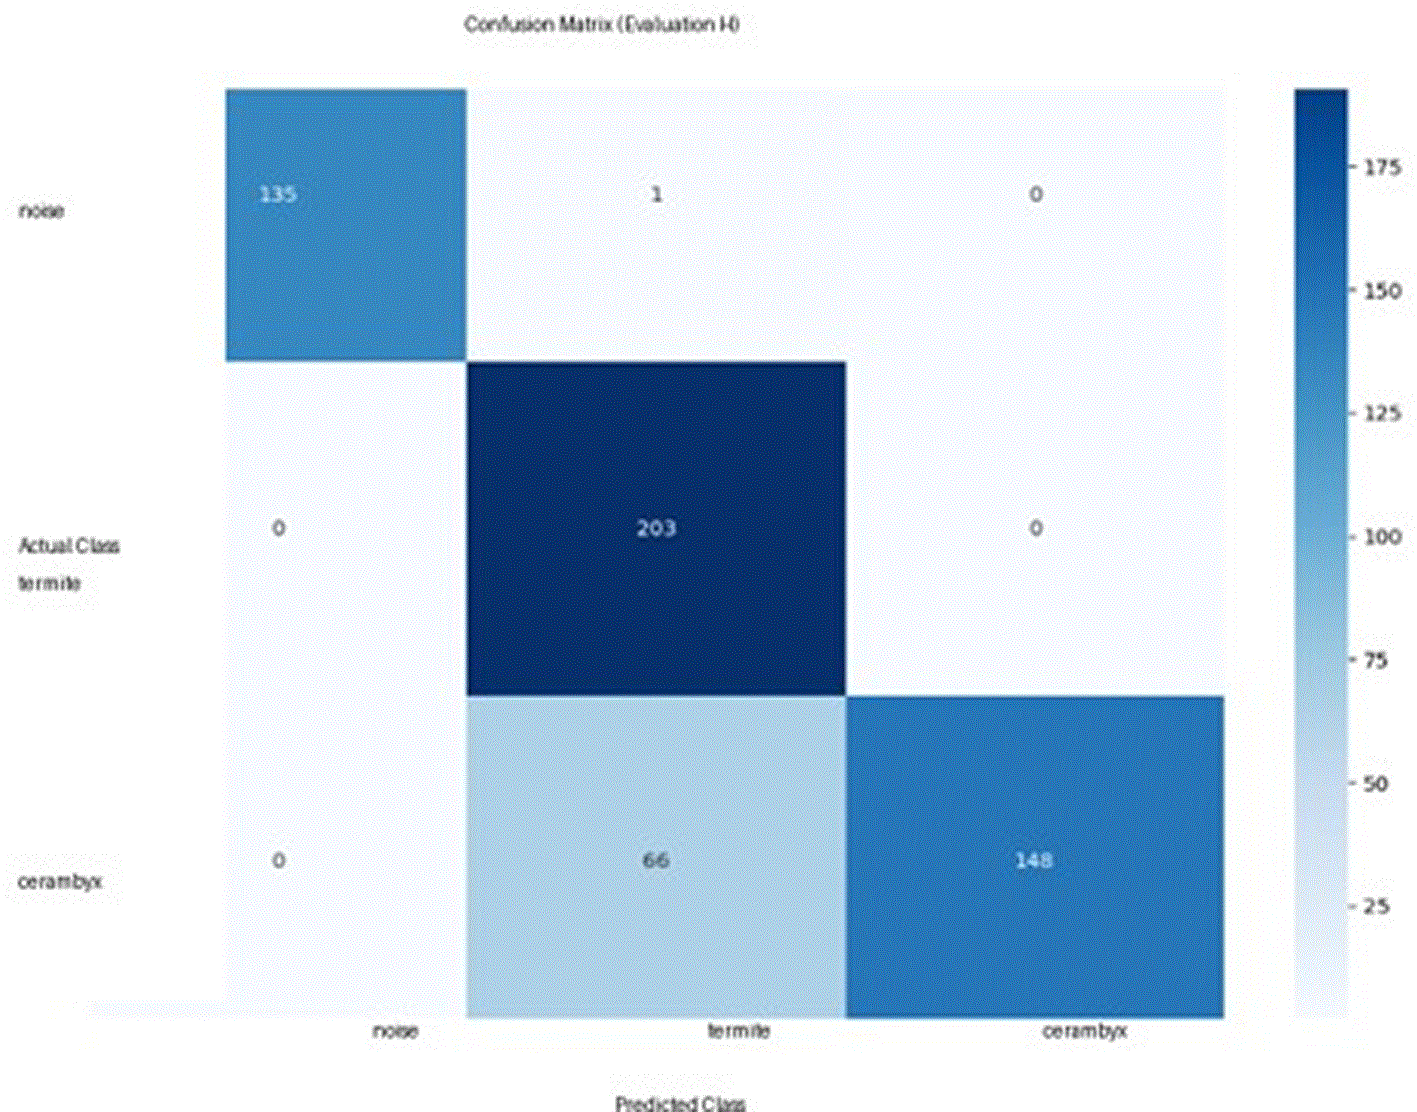
Figure 5. Confusion matrix of the model under assessment.
The ‘Actual Class’ axe represent the true labels and the ‘Predicted Class’ axe represent the model predictions.
Analysis of the Confusion Matrix:
• ‘Noise’ class: The model shows almost perfect performance. Out of 136 noise samples, 135 were correctly classified and only 1 were confused with ‘termite’.
• ‘Termite’ class: The model correctly identified the 203 samples of termites, without making any error of omission for this class.
• ‘Cerambyx’ class: This class presents the greatest challenge. Of 214 samples, 148 were correctly classified, but 66 were wrongly classified as ‘termite’.
In addition, the analysis of the precision metrics, Recall and F1-Score (
Table 1) allows a deeper understanding of the classifier’s behaviour.
Table 1. Analysis of precision metrics, Recall and F1-Score, to discriminate between ‘noise’, ‘termite’ and ‘Cerambyx’.
| Class | Accuracy | Recall (Sensitivity) |
F1-Score |
|---|
| Noise | 1.00 | 0.99 | 0.996 |
| Termite | 0.76 | 1.00 | 0.864 |
| Cerambyx | 1.00 | 0.70 | 0.827 |
The interpretation of the metrics in each class is as follows:
• ‘Noise’ class: With a precision of 1.0, every time the model predicts ‘noise’, it sounds correct. Its 0.99 Recall indicates that it detects 99% of all actual noises.
• ‘Termite’ class: The 1.0 Recall is the most remarkable result, as it means that the model is able to identify 100% of termite samples, leaving none undetected (zero false negatives). However, the 0.76 Precision reveals that 24% of the times it predicts ‘termite’, it is actually another class (mainly ‘Cerambyx’).
• ‘Cerambyx’ class: As with noise, its 1.0 Precision is perfect: if the model reads ‘Cerambyx’, it is ‘Cerambyx’. However, its 0.70 Recall is the weakest point, indicating that it only manages to identify 70% of the real longhorn beetles’ larvae, confusing the remaining 30% with termites.
Integration into the micro-controller
After obtaining the algorithm in Python, it was integrated into the 32-bit microcontroller of the Termidetect® equipment, adapting and typing the necessary functions in C++ to achieve the same result as in the computer. The implementation has been optimised to be efficiently executed on microcontrollers with limited resources in terms of RAM and flash memory.
On-site validation tests
Once the integration of the code into the micro-controller has been completed, it has started with the on-site validation tests. For these tests, 10 Termidetect® devices (SIMAT v1.0 model) of the company M2Sensors have been used, adapted for use under the environmental conditions of the project. Each device (Figure 6) has one vibration sensor, one temperature and humidity sensor, an environmental microphone and one 32 GB micro SD card.
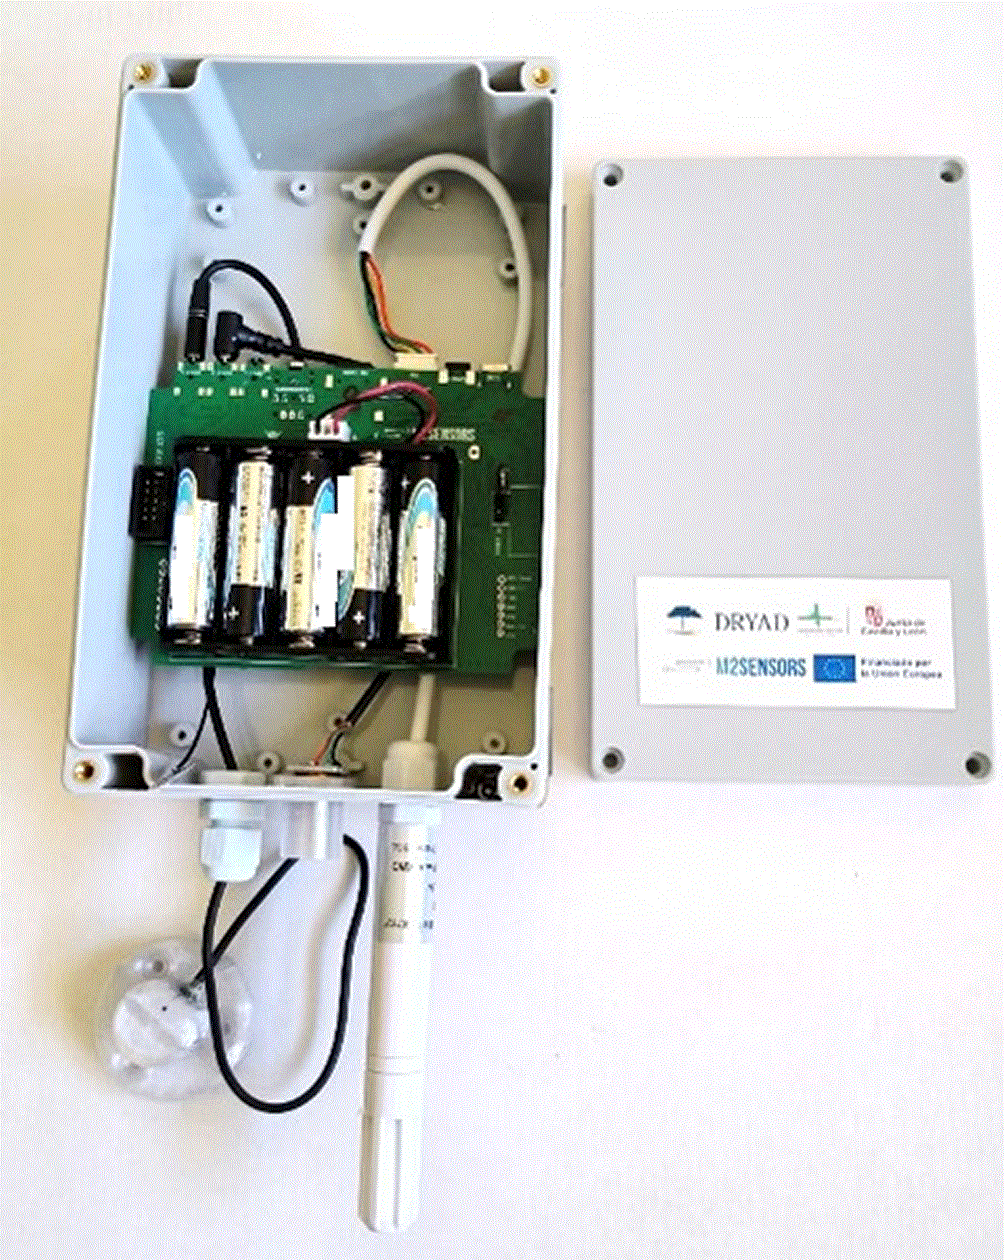
Figure 6. Device used for the validation of the AI model.
The device records ambient sound via microphone and the microvibrations of the tree via the vibration sensor. The audio records are stored raw, as a file with the extension “.bin”, on the micro SD card. Each record lasts 30 seconds and weighs 2.5 MB.
The on-site tests were carried out on a private estate located in the locality of Trabadillo in the province of Salamanca (41° 07 ′ 24.7 ′′ N, 6° 09 ′ 20.5 ′′ W). The initial distribution of the 10 devices used in the tests is shown in
Figure 7.
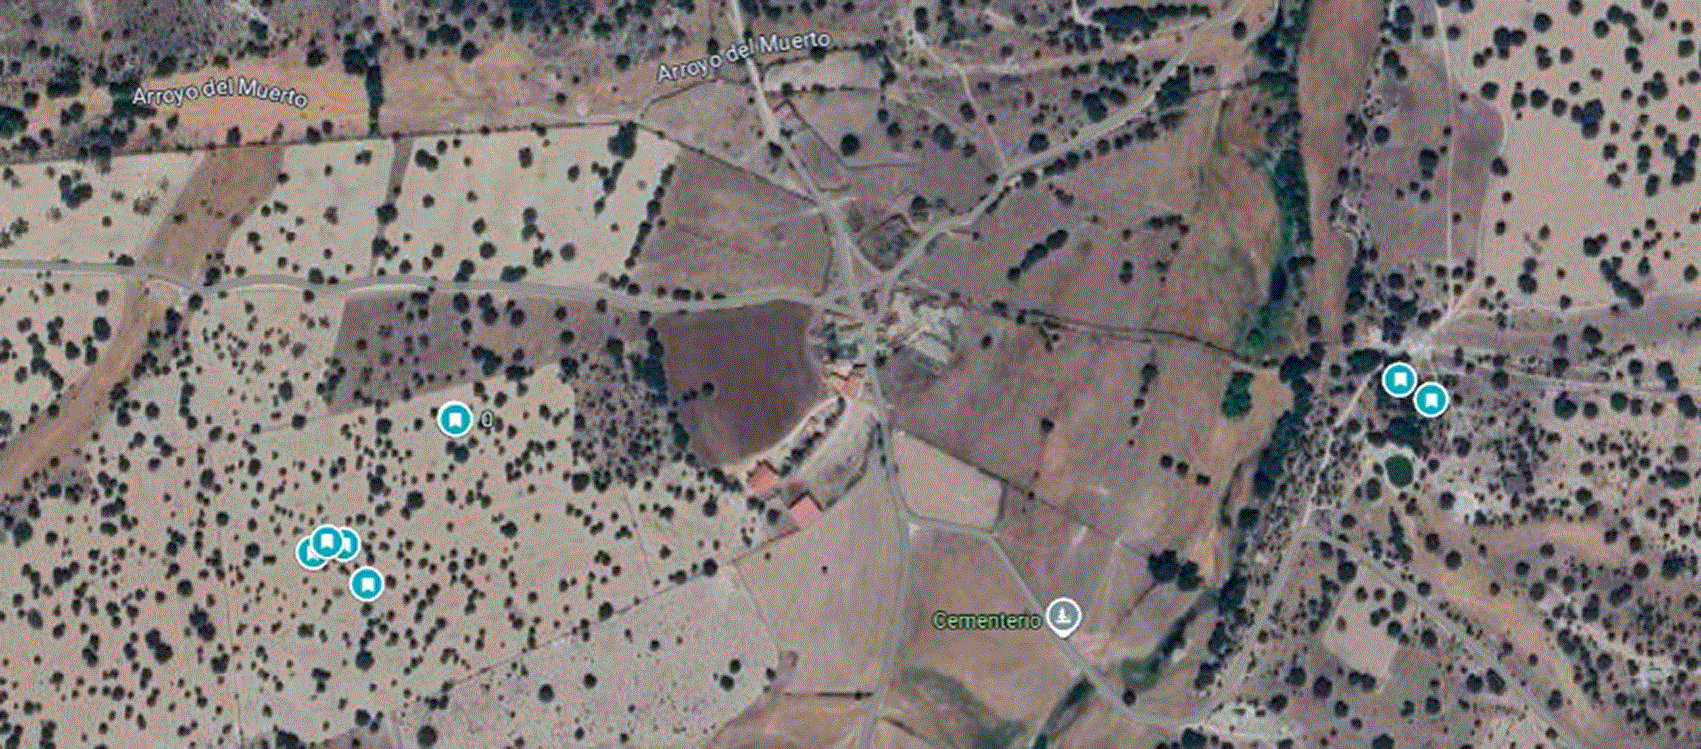
Figure 7. Location and distribution of equipment.
Following the first tests, Devices 1, 2 and 3 have been repositioned close to Devices 4 ÷ 6 to optimise data delivery through the solar panel powered 4G modem.
The tree selection for the validation of equipment was made based on the damage level of the individual tree, according to the scale proposed by (González et al., 2010) and improved in (González et al., 2013), which starts from grade 0 (no damage, healthy tree) and reaches grade 4 (dead or moribund tree, with frequent damage specific to Cerambyx cerdo larvae).
In this way, 2 groups of tree species have been selected: Quercus ilex (holm oak) and Q. robur (common oak). For holm oaks, five trees were classified as grade 1, one as grade 4 and 2 as grade 0. For common oaks two as grade 1 and one were grade 0.
Figure 8 shows the selected trees and the equipment installed in each of them, with devices 1, 2, 4, 5 and 6 installed in infected holm oaks, 3 and 10 in healthy holm oak, 7 and 8 in infected common oak and 9 in a healthy common oak.
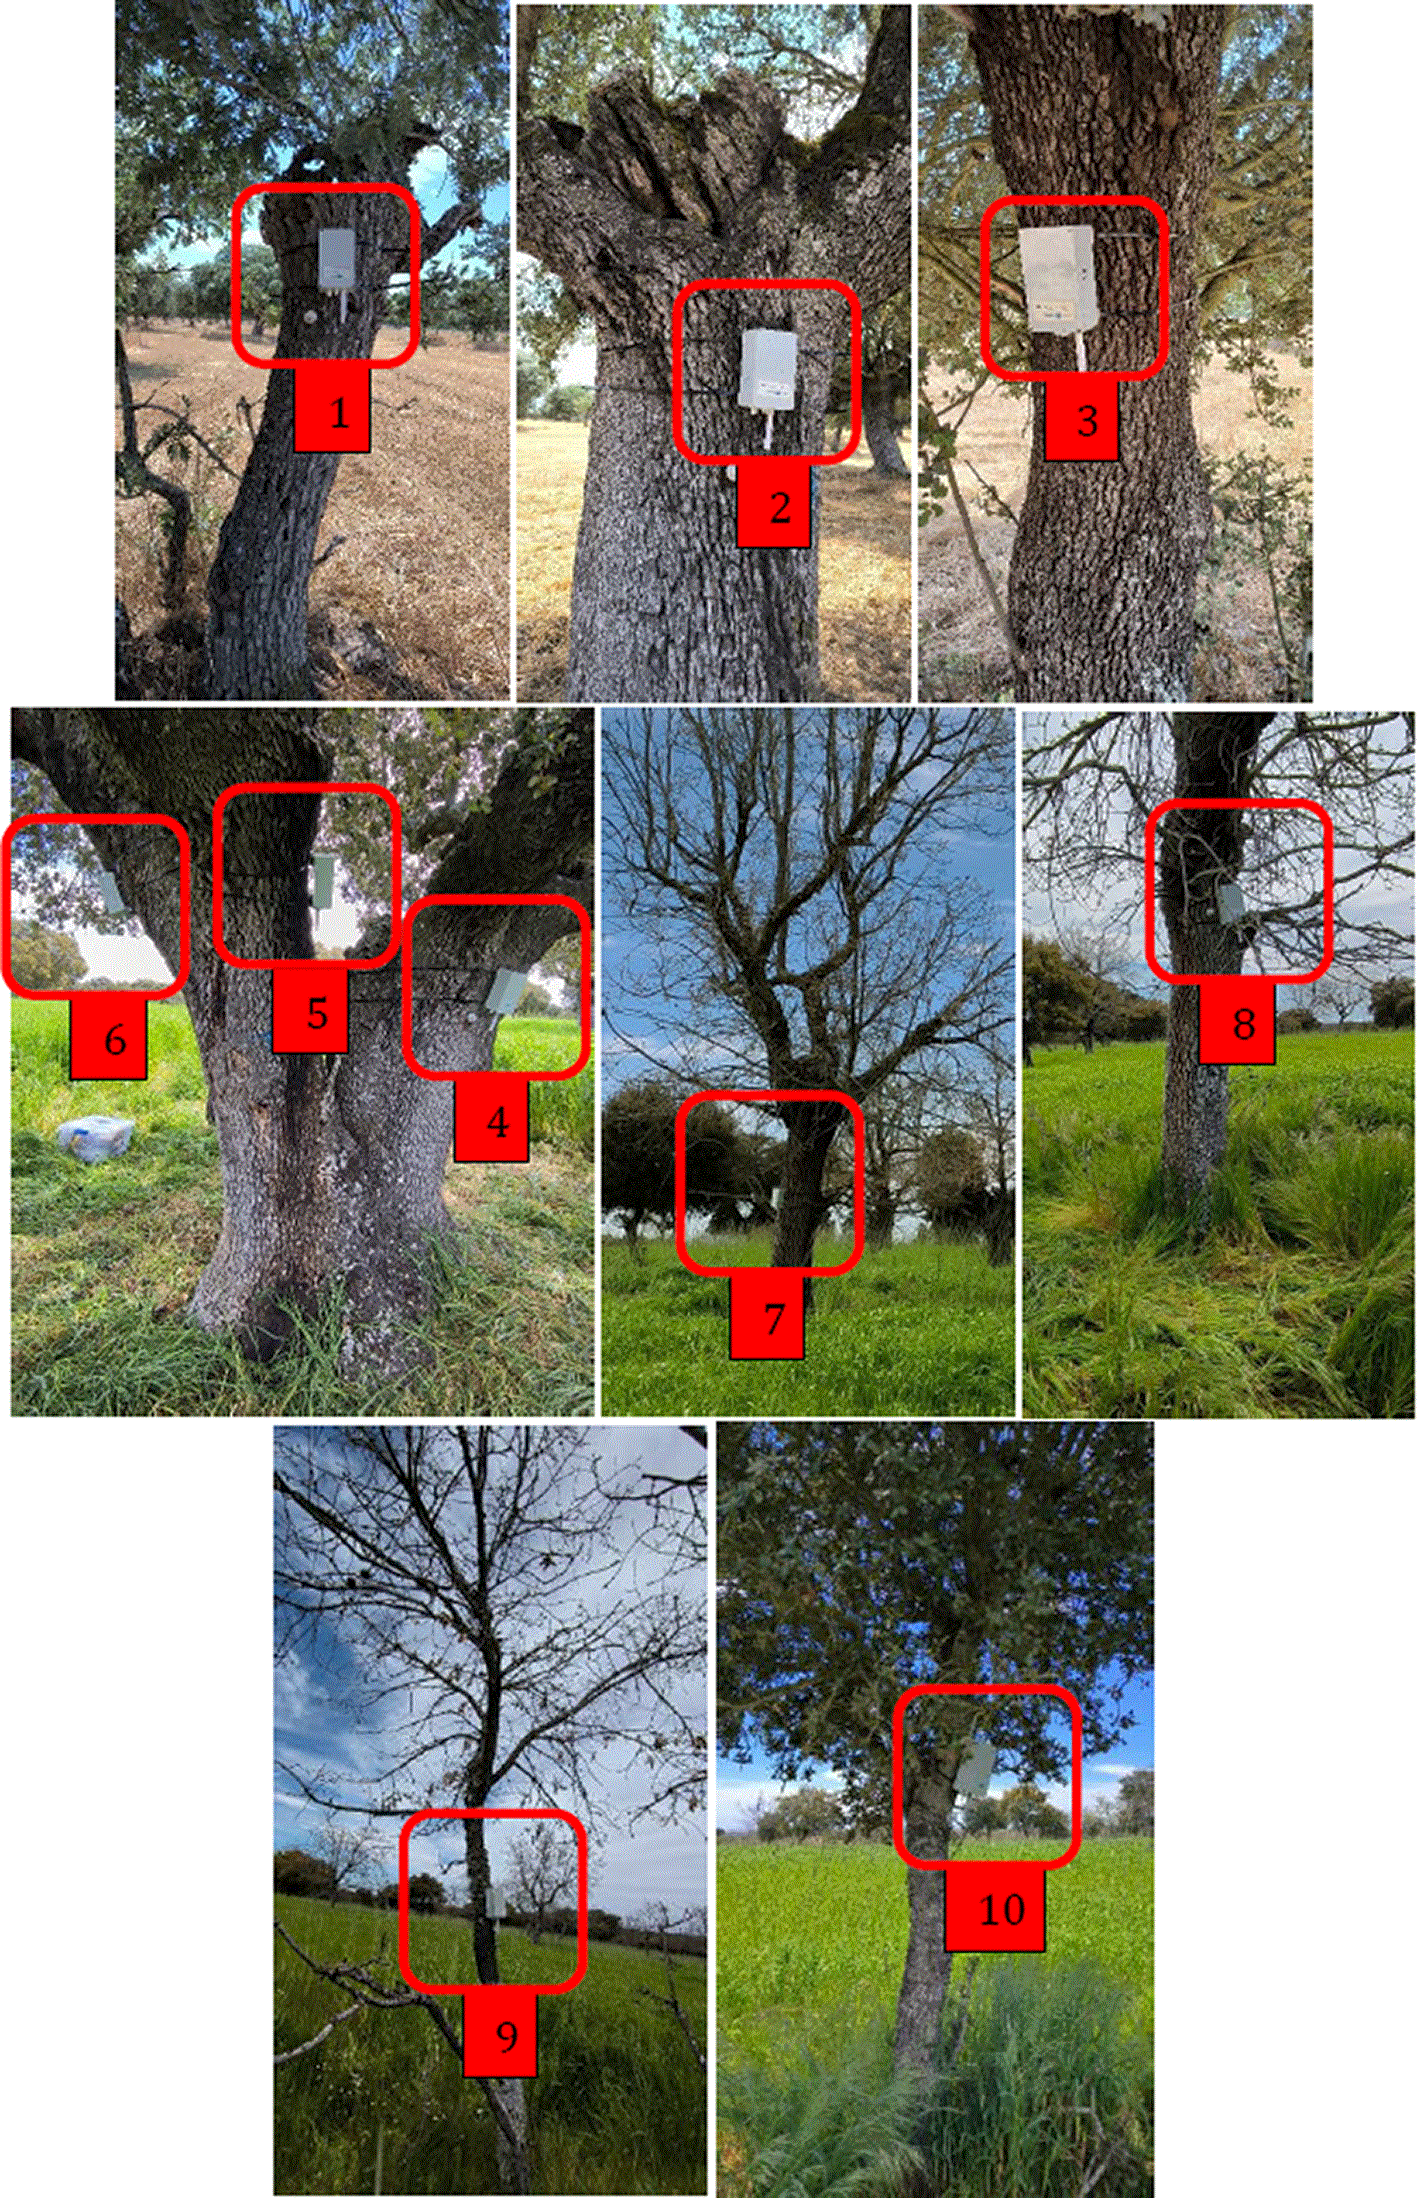
Figure 8. View of selected trees and equipment installed.
For trees classified as grade 1 infected, existing perforations do not reveal the species that caused them.
For the attachment of the device to the tree, nylon flanges have been used instead of metal clamps or other fixing methods, considering that the flanges are safe enough to keep the device in position while allowing the tree to grow freely.
To assemble the sensor in contact with the tree, the surface of the bark has been smoothed and a M3×20 mm screw has been screwed, on which the sensor, which in turn has been attached to the trunk with 3 M3×26 mm screws, has been mounted.
The contact screw for the sensor acts as a point concentrating vibration in a small area, allowing the sensor to capture vibrations more effectively. This is particularly important in the case of long-term monitoring and where the bark of the trees has an irregular area that may vary over time, leaving the sensor in the air.
After considering the use of the plot and the access in the area by the animals (wild boar, cows and pigs), it has been decided to install the equipment at a height of approximately 1.8 metres.
Results and discussion
For the feedback of the AI algorithm, both laboratory-registered and on-site audio records have been used. The latter have been carried out continuously for 17 days. Subsequently, the frequency of 1 minute of recording per day, to be maintained for the next 12 months, has been adjusted. The data have been stored on the SD card of each device and collected manually.
To understand the acoustic signal generated by Cerambyx, its signal has been compared with the recorded signal of the specie Reticulitermes grassei. A comparative example between Cerambyx and Reticulitermes audio samples is presented in
Figure 9.
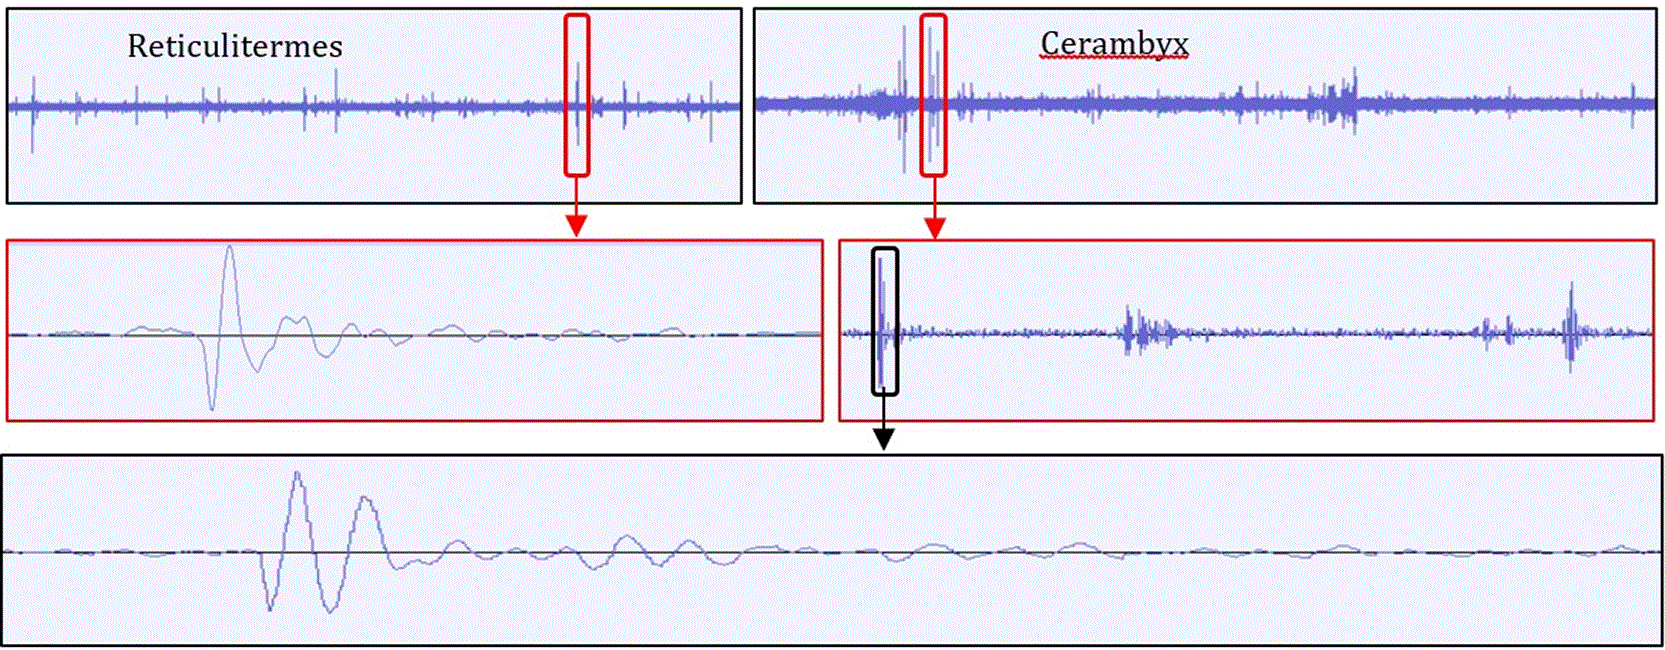
Figure 9. Audio samples from Cerambyx and Reticulitermes.
The Reticulitermes sample has been recorded in one termiter and its peaks correspond to the activity of multiple termites, while all the peaks in the Cerambyx sample correspond to a single specimen.
Analysis of the samples of the first specimen of Cerambyx captured showed that the specimen was at the end of the larval phase as during the investigation the specimen went through the pup phase and emerged as an adult.
Figure 10 shows the newly emerged copy and its details that have made it possible to identify it.
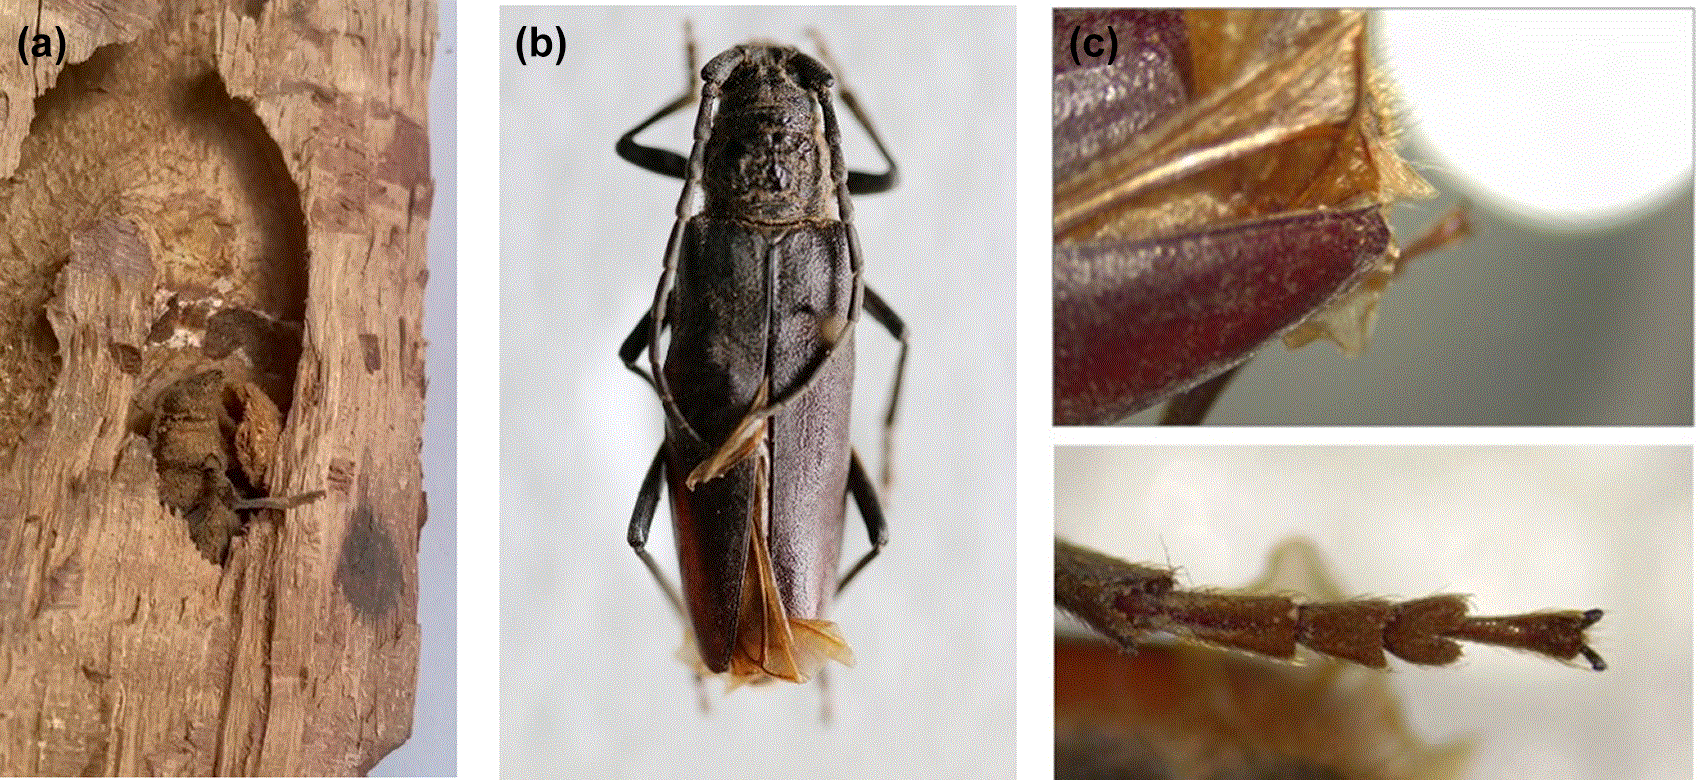
Figure 10. Identification of the first specimen of Cerambyx caught.
Left: adult leaving the pupal chamber. Centre: sample prepared for identification. Right: details of the apex of the elytron (top) and details of the ventral pilosity of the subsequent tarts.
Based on the analysis of the apex of the elytron and the ventral pilosity of the subsequent tarsus (Martínez-García, 2010) it has been concluded that the first specimen captured is a female of the species Cerambyx welensii.
During the analysis of the audio samples, it has been necessary to consider the length of the food phases and the rest between them. We have considered as rest between meals when the full 30-second audio record does not record any wood snap sound.
Thus, when analysing the sound records of the 2 specimens caught, it was observed, as expected, that the Cerambyx larva of the first sample feeds more frequently than that of the second sample. This suggests that the first stage was in the final stage of the larval stage, resulting in almost continuous eating, which is considered to be preparation for pupa processing.
In the audio records of the second sample, the frequency with which it is fed is lower than in the first sample, so we understand that the Cerambyx specimen could be at an intermediate larval stage (before the prepupa stage).
Figure 11 shows the audio record of the sensor located in Channel A of the Termidetect® device, 14 centimetres away from the sensor connected in Channel B. Comparative signal amplitude allows the identification of the position of the Cerambyx specimen relative to the sensors.
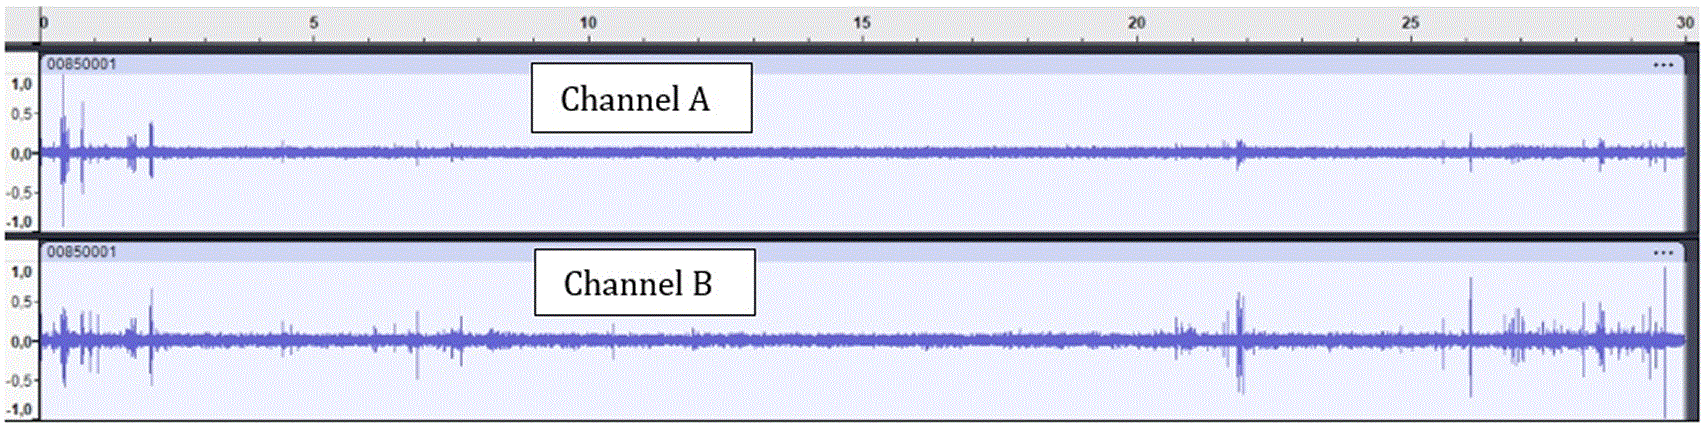
Figure 11. Audio record of the second sample.
For on-site testing, the detection of any of the ‘Cerambyx’ or ‘Thermite’ classes has been considered as a validated detection of the algorithm. This detects whether the tree is infested with xylophagous insects but does not identify whether it is Cerambyx. This decision has been made because if the infestation is at a certain distance from the sensor, it would detect only the highest peaks and would be classified as ‘termite’ and considered as not detected.
In addition, a function has been implemented so as not to analyse the data if the external noise detected by the microphone exceeds a certain threshold level. This rules out vibrations due to rain, wind or any external activity (birds or other insects) that could distort the data.
Figure 12 shows some of the audio records received remotely between 1:00 and 2:00 UTC + 0. Each record is 30 seconds and the sound amplification is identical for all samples.
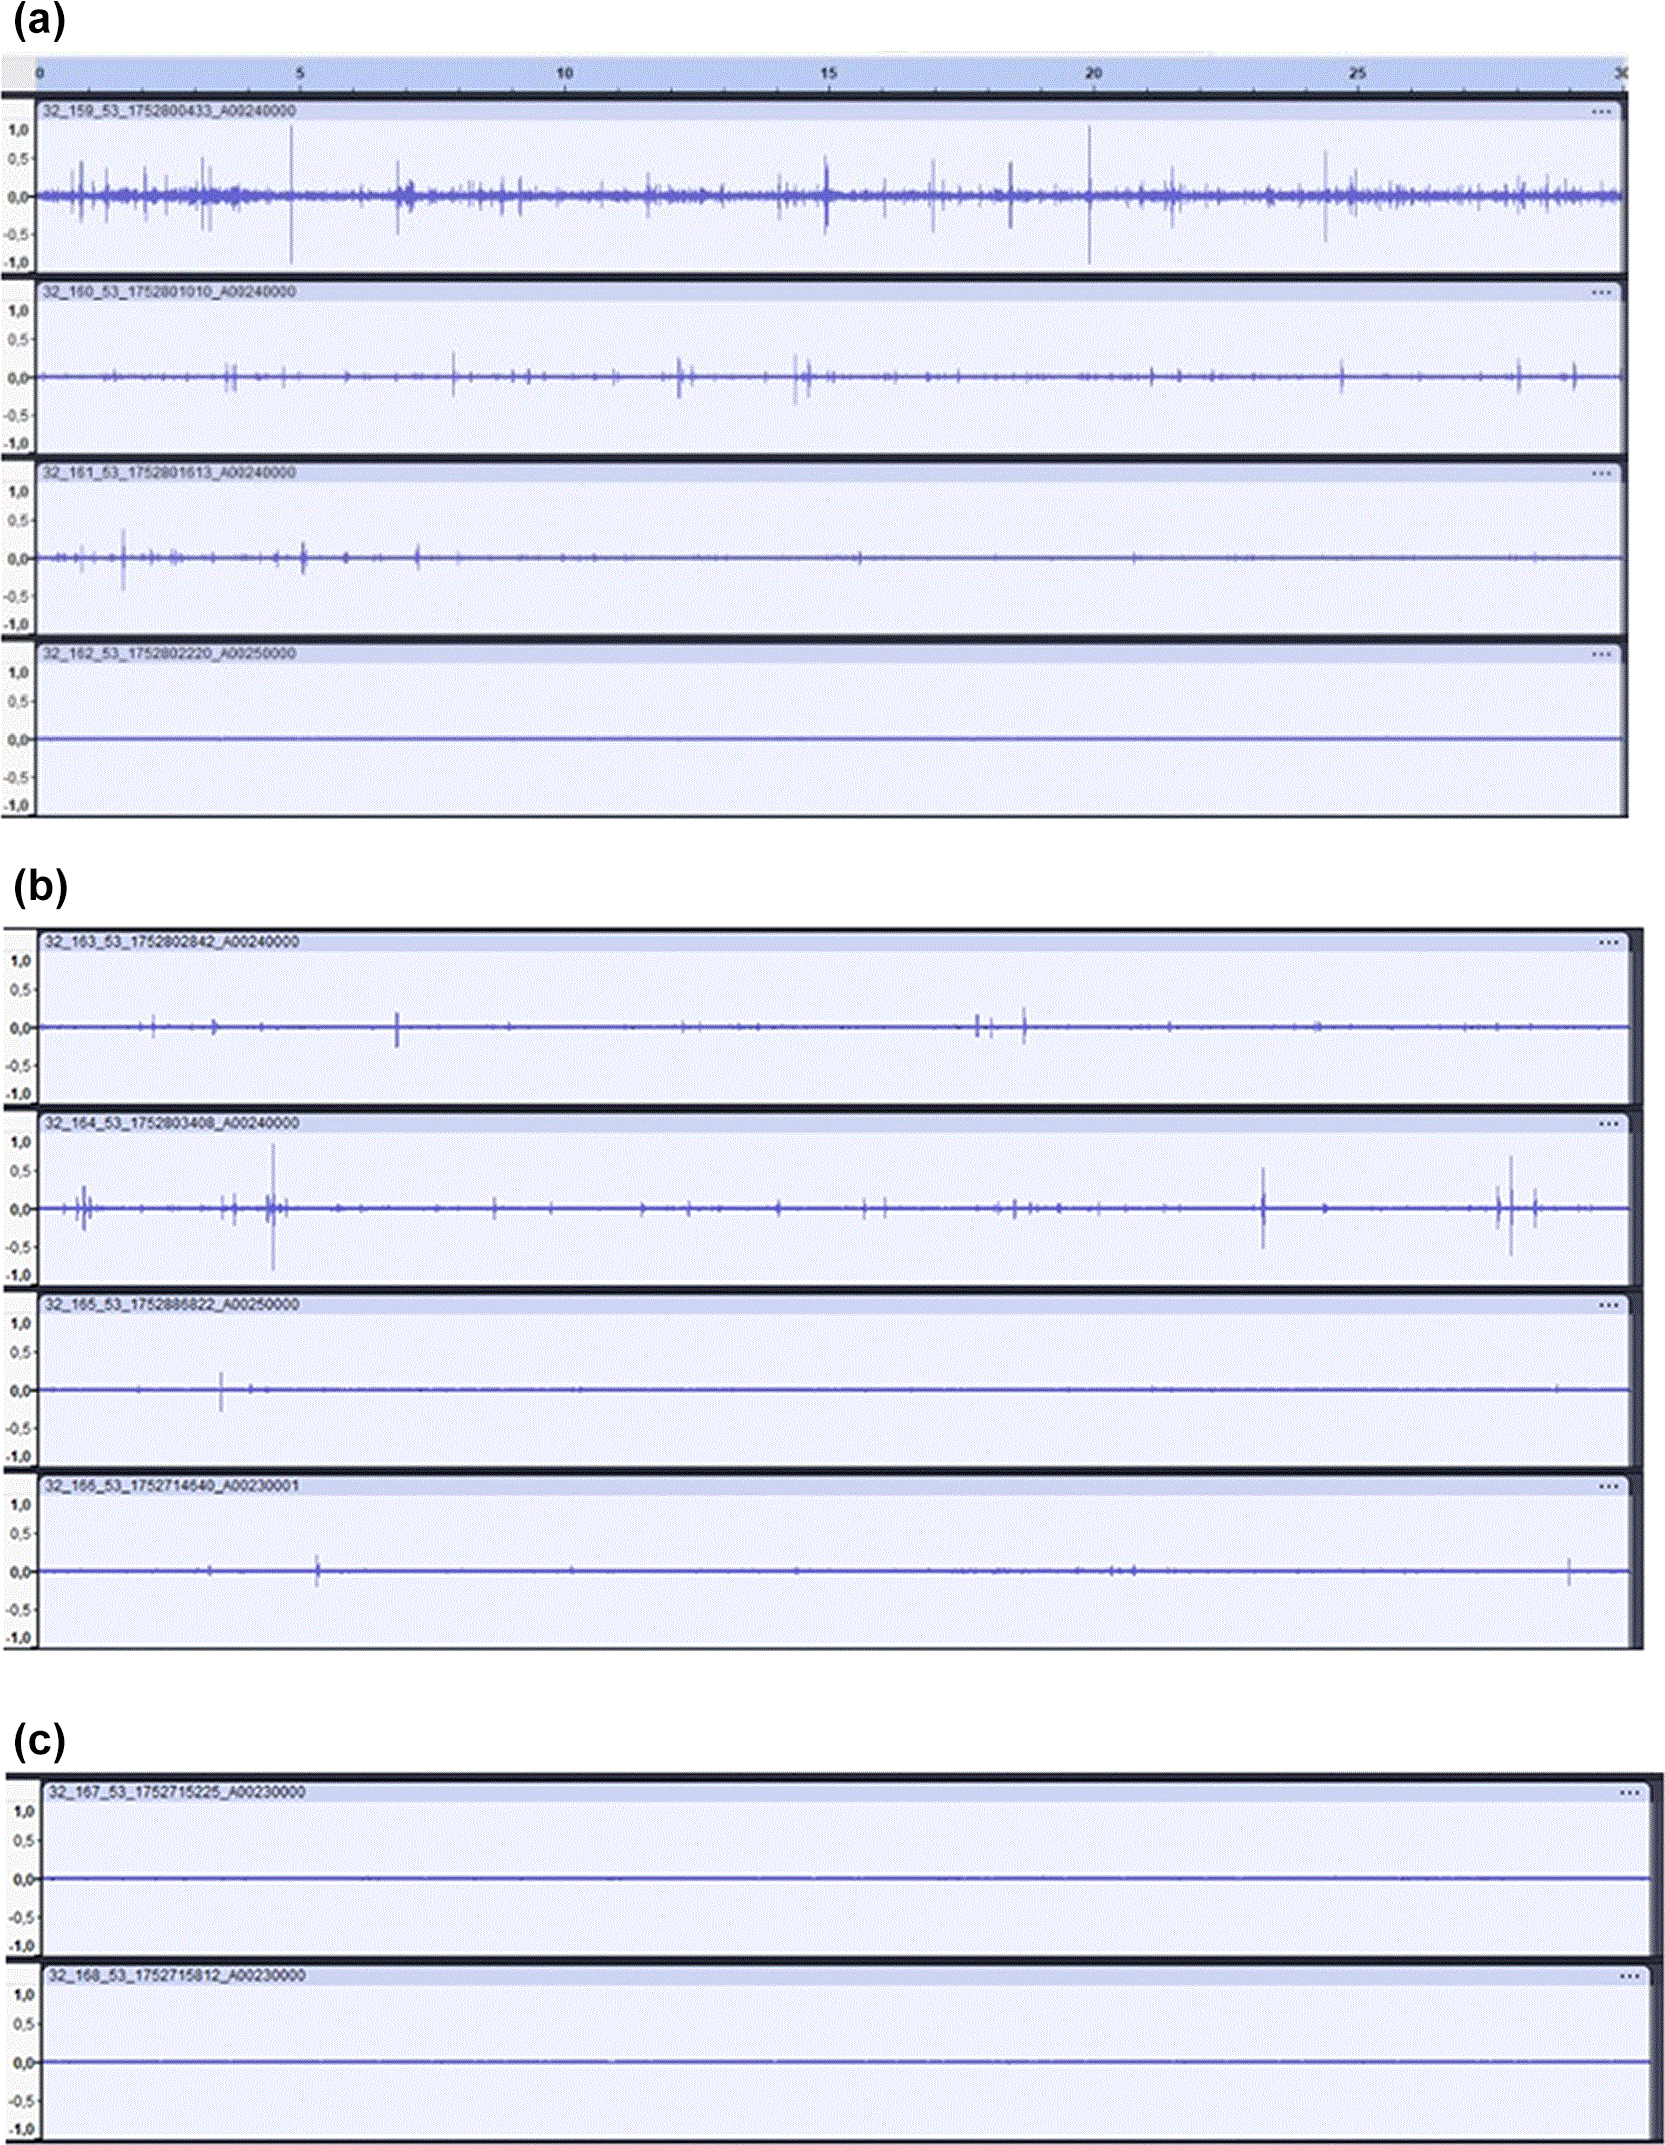
Figure 12. Audio records received remotely from the 10 devices installed ‘on-site’.
Figure 13 shows the results of the 10 on-site devices installed between July 1 and 20, 2025. The data have been sent remotely (Chiriac, 2026) via an industrial modem 4G.
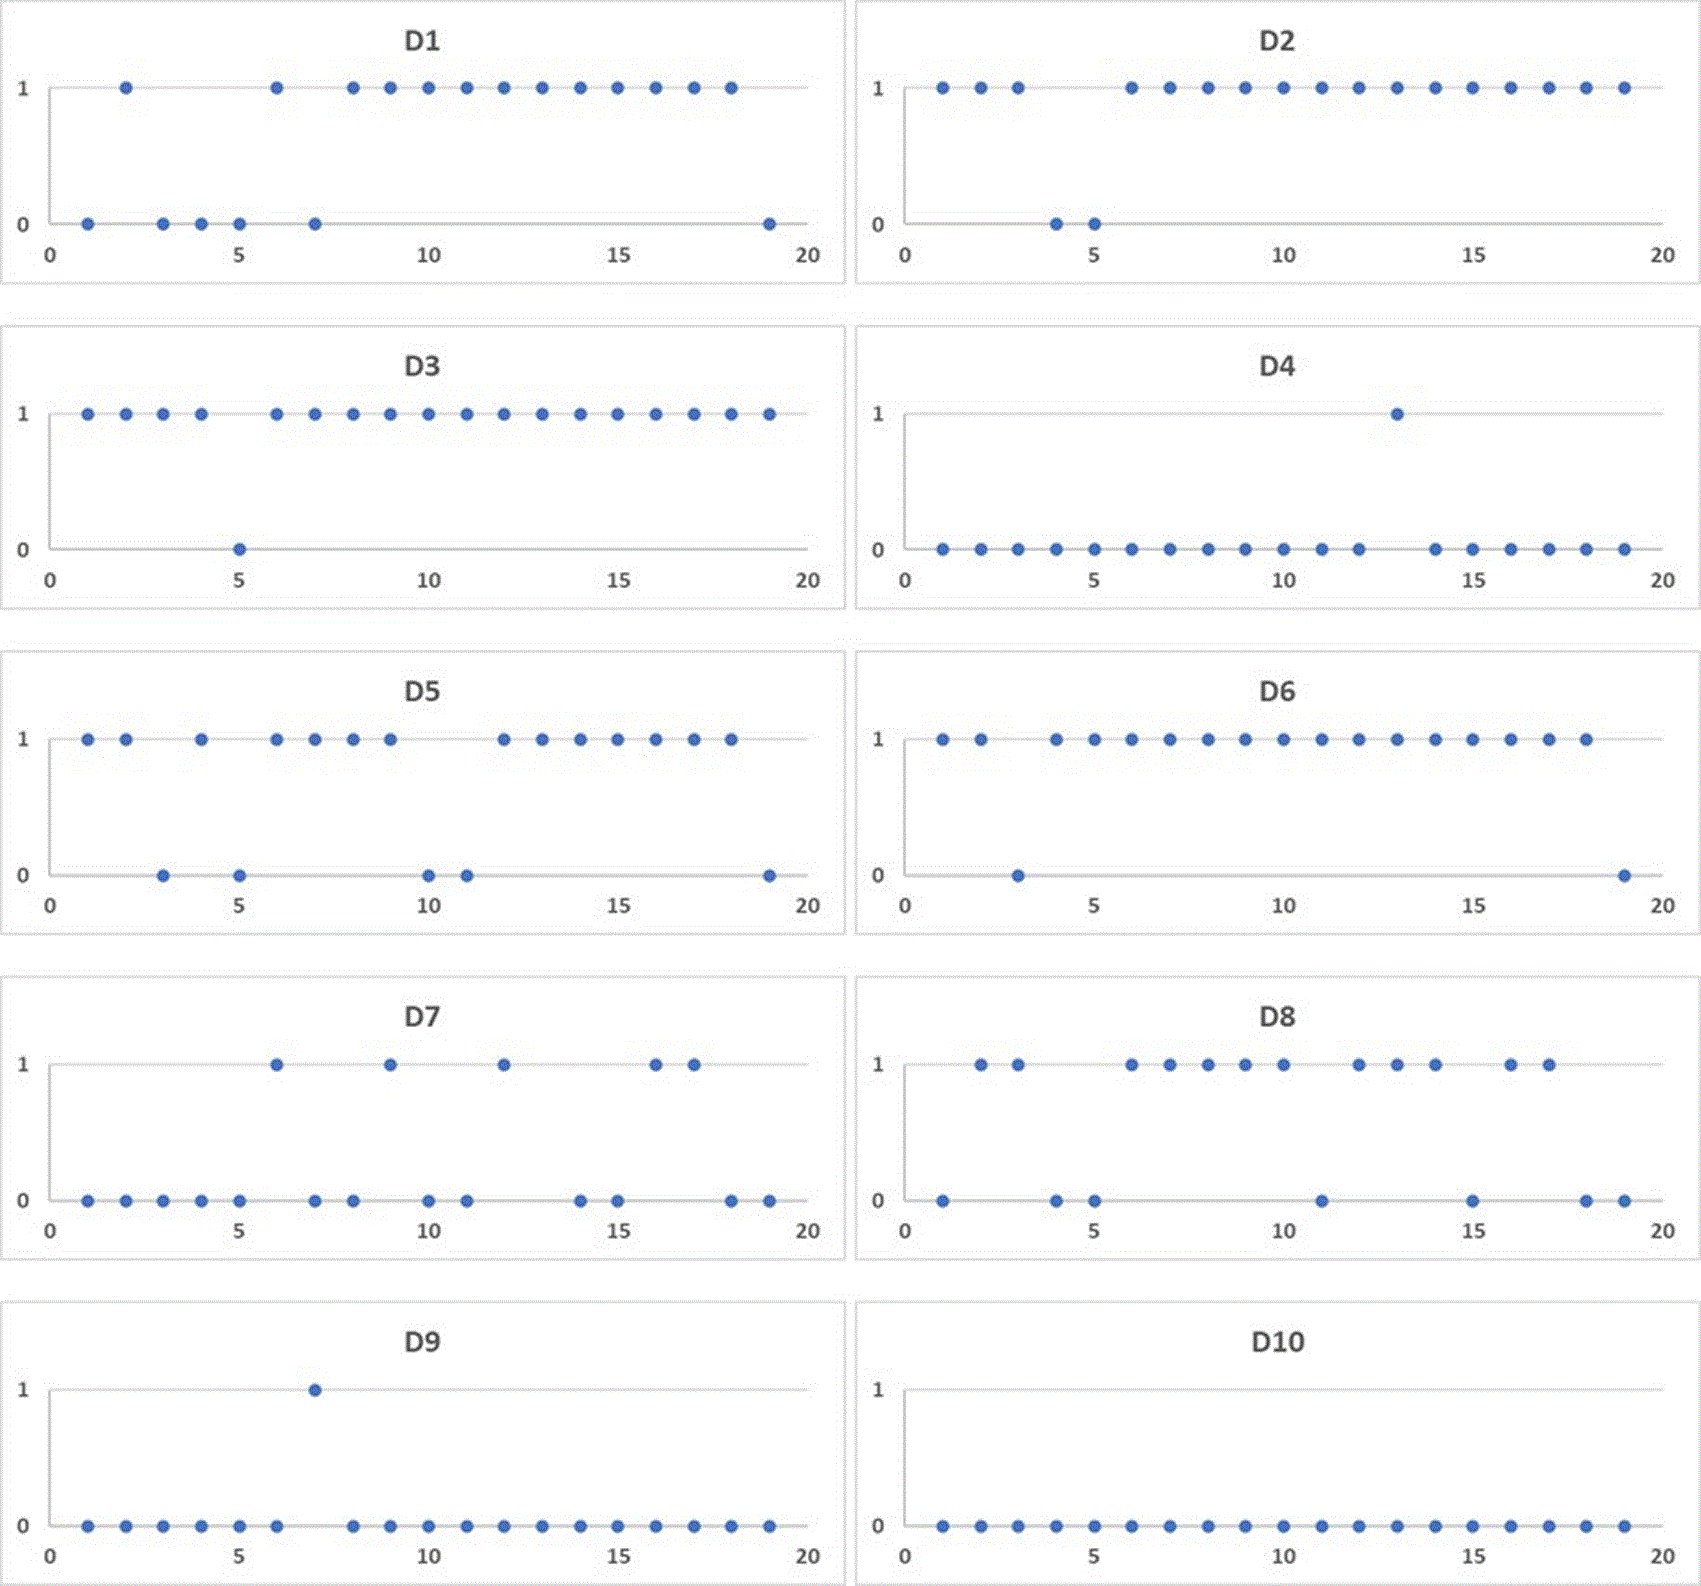
Figure 13. Results obtained from the equipment installed ‘on-site’ within a period of 20 days.
Each point corresponds to one day (1) decay of any activated by ‘Cerambyx’ or ‘termite’ or (0) without detection.
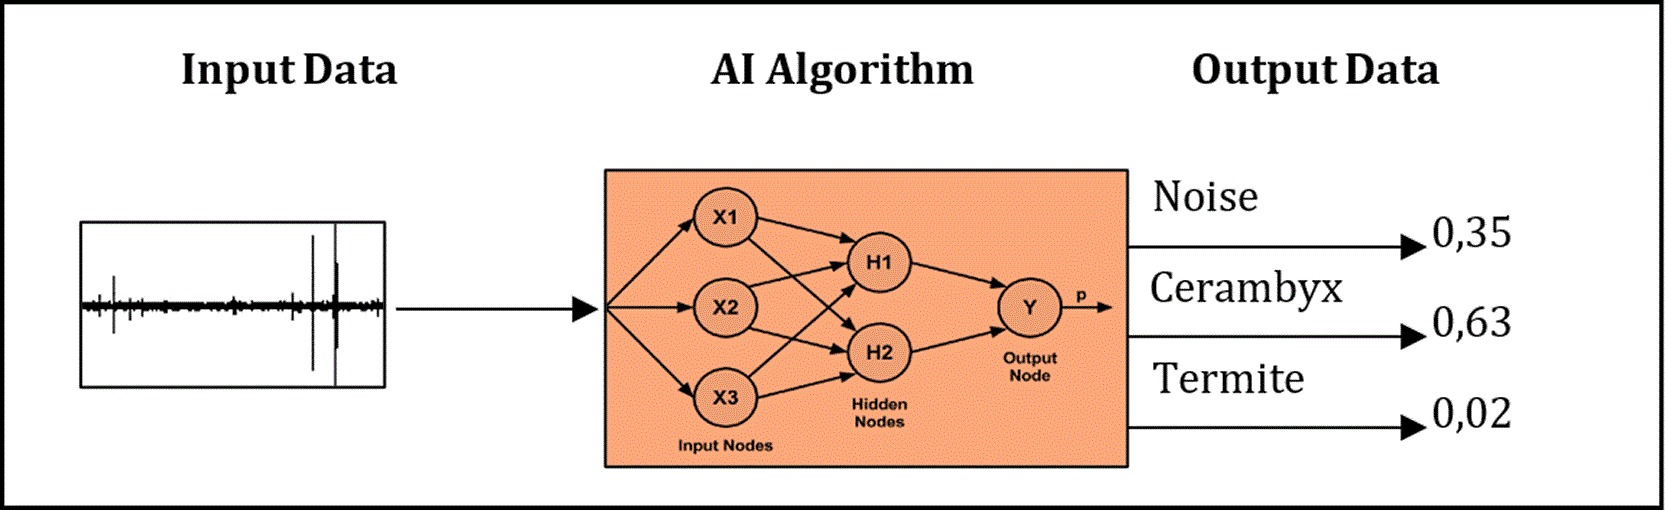
Figure 14. Operation of the detection algorithm.
An analysis of the results reveals the following:
• D1 is active as it is a decay trunk of a tree.
• D2 is active but not close to the sensor.
• D3 was supposed to be a healthy holm oak but had insect activity.
• D4 was supposed to be infected but not active.
• D5 is active but not close to the sensor.
• D6 is active in Cerambyx.
• D7 and D8 are active but not in Cerambyx.
• D9 and D10 are not active as expected as they are young trees.
The lack of continuous detection in the trees considered infested is due to the rest of the insects due to the possible external noise detected by the microphone.
Spot detection for those trees considered not to be infested, such as D9, can be considered as false positive.
Since sound records are sent to the control centre remotely, it is possible to analyse these records to determine the class of the insect or detect false positives or negatives.
These results should take into account the considerations indicated by several investigations, where Cerambyx cerdo is considered to be in the lower part of the trunk, while Cerambyx welensii is in the upper part (Torres-Vila et al., 2017). This means that the specimens detected with the 10 monitoring devices can be Cerambyx welensii and not Cerambyx cerdo.
Conclusions
Evidence shows that Artificial Intelligence embedded in IoT equipment allows detection of beetle larvae of the genus Cerambyx in trees of the genus Quercus. The AI algorithm was performed on the basis of audio samples of 2 pieces of Cerambyx recorded in the laboratory. The first sample was found to be Cerambyx welensii (confirmed by the emergence of the adult beetle), while in the second sample it is not possible to determine whether it belongs to Cerambyx cerdo or Cerambyx welensii until it is transformed into an adult.
As both species have a strong morphological similarity (Martínez-García, 2010), it can be expected that the digital footprint of the sound generated by the larvae of both species when eating the wood will be similar. This suggests that the algorithm generated for Cerambyx welensii should be effective also for Cerambyx cerdo.
The results of the AI algorithm demonstrate that the model is extremely reliable for noise detection and crucially for termite identification, where it displays perfect sensitivity. The main point of improvement lies in the one-way confusion between ‘Cerambyx’ and ‘termite’. The model tends to be conservative, preferring to classify an ambiguous sample as ‘termite’ rather than ‘Cerambyx’. Despite this, the high overall accuracy and perfect recall for Cerambyx validate the robustness and usefulness of the system for field application.
Despite the fact that IoT equipment with AI embedded allows the detection of Cerambyx cerdo, this species is usually on the lower part of the trunk of the tree, an area easily accessible by the animals (wild boar, pigs, cows, etc.), which poses a risk to the integrity of any equipment installed there.
As a future avenue of investigation, it is considered to extend the number of samples of Cerambyx larvae to be analysed in a laboratory in order to be able to identify accurately the audio records of Cerambyx cerdo and to look for any differentiating elements with respect to Cerambyx welensii.
Ethics and consent
Ethical approval and consent were not required. This method article followed the provisions described in the DRYAD Data Management Plan (Deliverable D7.5 - Data Management Plan, initial version) to ensure that data and other research outputs from the DRYAD project adhere to FAIR (Findable, Accessible, Interoperable, Reusable) principles and specific quality standards. The Data Management Plan has been reviewed and accepted by the European Commission and it’s findable at: https://dryad-project.eu/knowledge-center/.







