1. Introduction
Digital asset adoption has shifted from a niche activity to a structurally key component of contemporary financial systems, yet adoption trajectories remain profoundly uneven across regions and population groups. While the United States and leading European economies integrate cryptocurrencies and related instruments into diversified portfolios and institutional strategies, emerging regions such as the Visegrád Group (V4)龉and the Indonesia-Malaysia-Thailand Growth Triangle (IMT-GT) confront a more ambiguous landscape in which promises of financial inclusion coexist with heightened exposure to volatility, fraud, and regulatory uncertainty.1,2 This divergence raises a central question for policymakers and scholars of digital finance: under what institutional and infrastructural conditions do digital assets function as tools of inclusive finance rather than as amplifiers of existing economic and digital inequalities?.3,4
Over 2018–2025, global digital asset revenues expanded dramatically, but this aggregate growth conceals persistent regional gaps in both market depth and per-capita adoption. The United States and EU top-ten economies consistently captured approximately 62% of global digital asset revenues by 2025 ($20 billion and $16.3 billion, respectively), while IMT-GT (13%, $7.1 billion) and V4 (6%, $2.5 billion) trailed despite rapid percentage growth from negligible bases.5 More strikingly, per-capita adoption reveals the true disparity: the US reached 49% penetration (163龉million users), EU-10 35% (117龉million), V4 28% (17龉million), and IMT-GT just 16% (61龉million from a 396龉million base). These gaps persist even as internet penetration and basic ICT infrastructure converge across many urban areas in Central Europe and Southeast Asia, indicating that physical connectivity alone cannot explain the observed digital asset divide.4,6,7
Building on the broader digital divide literature, this pattern suggests the importance of successive layers of access and outcomes, where skills, usage patterns, institutional trust, and financial sector integration jointly shape who benefits from modern technologies and on what terms.3,8,9 The digital divide is no longer merely a binary state of having or lacking internet access but a multidimensional phenomenon encompassing access, usage skills, and meaningful outcomes.10,11 In the context of digital assets, this translates to three distinct but interconnected dimensions: structural access to digital infrastructure, cognitive capacity to understand and utilize digital financial tools, and motivational factors that drive adoption decisions.9
The existing literature on digital assets and crypto-based services remains fragmented along several dimensions. A first strand examines digital assets in advanced economies, emphasizing portfolio diversification, regulatory arbitrage, and institutional adoption, often treating cryptocurrencies and decentralized finance (DeFi) as sophisticated investment products decoupled from financial inclusion or development concerns.12,13 A second strand focuses on single-country or micro-level studies in emerging markets, particularly in Southeast Asia, highlighting the role of mobile money, fintech platforms, and informal financial practices, but rarely embedding these dynamics in a comparative, multi-region framework.1,14 In parallel, the digital divide literature has evolved from a narrow emphasis on first-level access to encompass skills, usage, and outcome divides, underscoring that equal access does not guarantee equal benefits and that new technologies may deepen vulnerability for some groups even as they empower others.3,4,7
Recent bibliometric analyses reveal significant disparities in digitalization research focus across regions. Kovač et龉al.7 demonstrate that while EU research emphasizes digital technologies, economic growth, and sustainability, Western Balkan research concentrates on COVID-19 impacts and digitalization in education and business. Similarly, Suranto et龉al.15 show that Southeast Asian research on digitalization is concentrated in Indonesia, Malaysia, Singapore, and Thailand, with limited contributions from less-developed ASEAN members. These patterns reflect underlying socio-economic contexts that shape both research priorities and digital transformation trajectories, highlighting the need for comparative analyses that account for regional heterogeneity.
Against this backdrop, the paper addresses an important empirical and conceptual gap by providing a unified comparative analysis of digital asset adoption and the “digital asset gap” across four regional-groups with distinct socio-economic characteristics, regulatory frameworks, and levels of digital maturity. The study poses four core research questions derived from the theoretical framework and identified literature gaps:
1. What structural factors determine digital asset adoption across regions?
2. Does regulatory clarity significantly accelerate digital asset adoption?
3. How does financial inclusion condition infrastructure effects?
4. What explains the emergence of the digital asset gap between advanced and emerging economies?
Against this backdrop, the paper addresses an important empirical and conceptual gap by providing a unified comparative analysis of digital asset adoption and the “digital asset gap” across four regional-groups with distinct socio-economic characteristics, regulatory frameworks, and levels of digital maturity. The remainder of this paper is organized as follows. Section龉2 presents the theoretical framework, and develops testable hypotheses. Section龉3 describes the research methodology. Section龉4 reports the empirical findings. Section龉5 discusses the results in the context of regional narratives and theoretical implications. Section龉6 presents policy recommendations and Section龉7 presents the conclusion.
2. Theoretical framework, research gaps, and hypothesis development
2.1 Digital divide theory
The digital divide encompasses successive, nested layers of barriers to technology access and beneficial use. Traditionally conceptualized across three dimensions, access (hardware, connectivity), skills (literacy, digital competence), and usage outcomes (meaningful engagement, economic returns), the digital divide has been mapped along income, geography, and education lines.3,8 Contemporary research recognizes that equal access to infrastructure does not guarantee equal outcomes, and that technology adoption may simultaneously enable inclusion and deepen vulnerability, particularly in developing regions.4,7,16
Szabó9 provides a comprehensive conceptual framework for understanding the digital divide, identifying three distinct dimensions of barriers: structural barriers related to access and affordability, cognitive barriers related to skills and understanding, and motivational barriers related to perceived usefulness and willingness to adopt. This tripartite framework aligns with the evolution of digital divide research from simple access measures to multidimensional assessments of digital inclusion. Importantly, Szabó9 demonstrates that while structural and cognitive elements are directly measured in popular digital economy indices (DESI, DiGiX, DII, ADII), motivational factors are measured only indirectly through uptake and usage patterns, underscoring the need for more nuanced analytical approaches.
For digital assets specifically, the divide manifests at multiple overlapping levels: physical access to internet-enabled devices, technical literacy required to navigate cryptocurrency exchanges and self-custodied wallets, awareness and institutional trust regarding asset legitimacy and security, and access to reliable market information and consumer protections.4,17 Critically, digital asset-specific divides may not perfectly align with traditional ICT divides; high mobile internet penetration in Indonesia, for instance, does not automatically translate to cryptocurrency adoption if regulatory clarity, consumer trust, or formal financial sector integration is lacking.1,15
Digital divide theory predicts that regions with higher digital infrastructure penetration and broader financial inclusion will exhibit larger digital asset user bases and more stable revenue trajectories, but cautions that rapid adoption in under regulated, under educated markets may amplify financial vulnerability through exposure to volatile prices, scams, and uninsured losses rather than enhance genuine inclusion.3,8 This theoretical prediction forms the foundation for Hypothesis 1.
Hypothesis 1:
Digital infrastructure (internet penetration) has a positive but limited independent effect on digital asset adoption.
2.2 Technology acceptance model (TAM) and UTAUT
The Technology Acceptance Model (TAM) posits that technology adoption is driven by perceived usefulness and perceived ease of use, which are mediated by attitudes and behavioural intentions.18 The Unified Theory of Acceptance and Use of Technology (UTAUT) extend this framework to encompass social influence, facilitating conditions, and moderating factors such as age, gender, and experience.19 Both frameworks emphasize that adoption depends not solely on the objective characteristics of technology but also on users’ subjective perceptions and the enabling environment.
Applied to digital assets, TAM and UTAUT suggest that adoption depends on users’ beliefs regarding utility (payment convenience, investment returns, store of value), usability (exchange interface design, wallet simplicity), social factors (peer adoption, influencer endorsements), and supporting conditions (customer support, regulatory clarity, institutional trust).18,19 Regulatory frameworks such as MiCA enhance perceived legitimacy and reduce perceived risk, thereby boosting usefulness perceptions and lowering adoption barriers.25 Conversely, fragmented, hostile, or opaque regulation reduces facilitating conditions and increases perceived risk, depressing adoption even among tech literate users.12
TAM/UTAUT predicts that perceived legitimacy, proxied by regulatory clarity and stringency, strongly influences digital asset adoption trajectories beyond pure infrastructure. Regions achieving regulatory clarity (MiCA in EU, stablecoin laws in USA) should exhibit accelerated adoption post clarification, whereas fragmented regulation should yield plateaus despite rising infrastructure.20 This prediction directly informs Hypothesis 2.
Hypothesis 2:
Regulatory clarity significantly increases digital asset adoption rates.
2.3 Gibson’s affordances theory
Affordances, as developed by Gibson,21 describe the action possibilities an environment offers to an actor, independent of the actor’s intentions. In the context of technologies, affordances capture both enabling and constraining possibilities shaped by design choices, regulatory context, and existing institutional arrangements.22 The theory emphasizes that the same technology can afford different outcomes depending on the environmental context in which it is deployed.
Digital assets afford new forms of financial access, cross border transfers, low-cost savings outside formal banking, investment exposure without intermediaries, yet simultaneously constrain users lacking device access, digital literacy, or institutional trust, and expose them to fraud, volatility, and speculative losses.21 The dual character is critical: a mobile first Bitcoin wallet affords financial inclusion in an unbanked population but simultaneously affords fraud vulnerability and speculative losses if trust building institutions and consumer protections are absent.22
Affordances theory predicts that digital assets’ inclusive or exclusive effects depend on interaction between the technology’s affordances and the local institutional context. In regions with strong financial regulation, consumer protection, and financial literacy (USA, EU), digital assets afford net inclusion benefits. In regions with weak institutions, high digital divides, and limited financial inclusion (parts of IMT GT, less developed V4 areas), they may deepen exclusion and vulnerability, concentrating adoption among urban, higher income, digitally literate populations.21,22 This conditional prediction forms the basis for Hypothesis 3.
Hypothesis 3:
Financial inclusion positively moderates the relationship between digital infrastructure and digital asset adoption.
3. Research methodology
3.1 Research design and data sources
This study employs a panel data design covering eight years (2018–2025) across four region-groups: the United States, EU top-10 economies (by龉nominal GDP: Austria, Belgium, France, Germany, Ireland, Italy, Netherlands, Poland, Spain, Sweden), Visegrád Group (V4: Czechia, Hungary, Poland, Slovakia), and Indonesia-Malaysia-Thailand Growth Triangle (IMT-GT: Indonesia, Malaysia, Thailand). This temporal scope captures the critical transition from crypto-skepticism to regulatory engagement, encompassing the COVID-19 pandemic, crypto market cycles (2021 bull market, 2022 crypto winter), and the emergence of harmonized EU (MiCA) and targeted US regulatory regimes.
Digital asset metrics are sourced from Statista Market Insights, providing revenues (USD billions) and users (millions) for cryptocurrencies, NFTs, and DeFi, disaggregated by region and asset class. Demographic data (population, households, computer households) are obtained from the same source and validated against national statistics.
Infrastructure indicators (internet penetration, broadband access, device density) are drawn from Statista cross-walked to World Bank, International Telecommunication Union (ITU), and Eurostat databases to ensure cross-regional consistency. Financial inclusion measures (debit card penetration, formal account ownership) are sourced from Global Findex surveys and Statista.
Regulatory clarity is operationalized through a multi-faceted approach. For the EU, MiCA implementation stages are coded as 0龉(pre-announcement, 2018–2022), 1龉(transitional/post-announcement, 2023), and 2龉(implemented, 2024–2025). For the USA, stablecoin law enactment is coded as 0龉(pre-reform, 2018–2023) and 1龉(post-reform, 2024–2025). For IMT-GT, a composite index captures the fragmented regulatory landscape (0 = fragmented/hostile throughout). Innovation capacity indicators (Industry 4.0 readiness, fintech firm density, R&D intensity) are synthesized from national statistics and meta-reviews of regional innovation ecosystems.
All variables are aggregated to region-year level, yielding a balanced panel of 32龉observations (4龉regions × 8 years).
3.2 Variable measurement
Table龉1 presents the definitions and measurements of the dependent, independent, control, and interaction variables used in the empirical analysis. The variables are constructed at the region-year level for the four regional groups examined in the study. The measurement approach is designed to capture digital asset adoption while accounting for differences in digital infrastructure, financial inclusion, regulatory conditions, and previous-year adoption.
Table 1. Variable definitions and measurement.
| Variable Category | Variable name | Variable form | Definition | Measurement |
|---|
| Dependent Variable
| Digital Asset Adoption |
| Cryptocurrency Users per 1,000 population (log-transformed for robustness). | DAAit = ln (Crypto Users per 1000it) |
| Independent Variables
| Internet Penetration |
| Percentage of population using internet. | Continuous (0–100) |
| Regulatory Clarity |
| Ordinal index of regulatory environment | Dummy variable:
1 = Post-regulatory harmonization period
0 = Pre-reform period |
| Financial Inclusion |
| Composite of debit card penetration and account ownership | Continuous (0–1) |
| Control Variables
| Lagged_Users |
| Users_per_1000_population in previous year | Continuous |
| Interaction Terms
| Internet_x_Inclusion
|
| Internet_Penetration_percent × Financial_Inclusion_Index
| Continuous |
The dependent variable is Digital Asset Adoption (DAA), measured as the number of cryptocurrency users per 1,000 population. This measure captures the extent to which digital assets have been adopted relative to population size and enables meaningful comparisons across regions with substantially different population sizes. For robustness analysis, the adoption measure is also log-transformed. This transformation helps reduce the influence of large differences in adoption levels across regions and provides an alternative specification for the empirical analysis.
The first independent variable is Internet Penetration, defined as the percentage of the population using the internet. It is measured as a continuous variable ranging from 0龉to 100. Internet penetration represents the underlying digital infrastructure necessary for accessing online financial services and digital asset platforms. Higher internet penetration indicates greater access to digital connectivity and is therefore expected to be associated with higher levels of digital asset adoption.
The second independent variable is Regulatory Clarity, which captures changes in the regulatory environment affecting digital assets. In the empirical model, it is operationalised as a dummy variable, taking a value of 1龉for the post-regulatory-harmonisation or post-reform period and 0龉for the pre-reform period. This variable is intended to identify whether changes toward a more clearly defined regulatory environment are associated with changes in digital asset adoption.
The third independent variable is Financial Inclusion, measured using a composite index based on debit card penetration and formal account ownership. The resulting index is expressed on a continuous scale from 0龉to 1,龉with higher values representing greater financial inclusion. This variable captures the extent to which individuals have access to formal financial services and therefore provides an important dimension for examining whether digital connectivity translates into participation in digital asset markets.
The analysis also includes Lagged Users (Lagged_Users) as a control variable. This variable represents the number of cryptocurrency users per 1,000 population in the previous year. Including the lagged adoption measure accounts for persistence in digital asset adoption and captures the possibility that current adoption is influenced by the existing user base and previous adoption experience. It therefore helps distinguish changes associated with the explanatory variables from the underlying continuation of adoption trends over龉time.
Finally, the study introduces the interaction term Internet × Inclusion (Internet_x_Inclusion), calculated as the product of internet penetration and the financial inclusion index. This interaction assesses whether the relationship between digital connectivity and digital asset adoption varies with the level of financial inclusion. In other words, it allows the analysis to examine whether greater internet access is more strongly associated with digital asset adoption in regions where individuals also have greater access to formal financial services. The interaction term, therefore, provides a direct empirical assessment of the complementary role of digital infrastructure and financial inclusion in shaping digital asset adoption.
Overall, the operationalization of these variables enables the study to examine digital asset adoption from multiple dimensions, combining digital infrastructure, regulatory conditions, financial access, and adoption persistence within a common regional panel framework.
3.3 Analytical strategy
To evaluate Hypotheses 1–3 formally, we specify a series of panel regression models with progressively complex specifications. All models are estimated using fixed effects with region and year dummies, and robust standard errors clustered at the regional level to address heteroskedasticity and within-region correlation.
Baseline Model:
(1)
Moderation Model:
(2)
Where:
•
= Digital Asset Adoption (log of users per 1,000 population)
•
= Internet penetration rate
•
= Financial inclusion index
•
= Regulatory clarity dummy
•
= Control variables (Lagged_Users)
•
= Regional fixed effects
•
= Time fixed effects
•
= Error term
All continuous variables are standardized to facilitate interpretation of coefficient magnitudes. Hausman tests confirm the consistency of fixed-effects versus random-effects specifications. Variance inflation factors (VIF) are examined to assess multicollinearity concerns.
3.4 Limitations
This study is subject to several limitations that should be acknowledged. First, the observational design precludes strong causal claims; while panel fixed effects control for time-invariant confounding, unobserved time-varying factors may bias estimates. Second, the recent timing of MiCA and US stablecoin reforms (2023–2025) means long-run adoption effects are not yet observable. Third, regional averages mask substantial intra-regional heterogeneity; within-country disparities (urban vs.龉rural, income groups, educational levels) are not captured in this aggregate analysis. Fourth, reliance on Statista data, while consistent across regions, may not capture informal adoption channels important in emerging markets. Fifth, the small number of clusters (four regions) limits the precision of clustered standard errors and may understate uncertainty in statistical inference.
4. Empirical results
4.1 Descriptive statistics
Digital asset markets experienced explosive growth over 2018–2025, with global revenues increasing 25-fold from $4.5 billion to $106.5 billion. However, this aggregate growth masks persistent regional disparities. The United States and EU-10 captured 62% of global revenues by 2025 ($20 billion and $16.3 billion, respectively), while IMT-GT ($7.1 billion, 13%) and V4 ($2.5 billion, 6%) trailed despite rapid user growth. Global users reached 933龉million (12.6% of population), but per-capita adoption reveals the true extent of the digital asset gap: USA at 49% penetration (163龉million users), EU-10 35% (117龉million), V4 28% (17龉million), and IMT-GT just 16% (61龉million from a 396龉million base).
Cryptocurrencies dominated revenue composition (86% of total, $91.5 billion), with NFTs and DeFi remaining niche ($0.5 billion and $14.5 billion, respectively). In V4 and IMT-GT, cryptocurrency share exceeded 95%, indicating retail-oriented, trading-focused market structures rather than institutional depth or diversified digital asset ecosystems.
Figure龉1 shows the trends in digital asset adoption across the four regional groups from 2018 to 2025, highlighting the rapid increase in adoption after 2020 and the persistent gap between the regions. It also illustrates the study’s overall analytical framework, showing how digital asset adoption is examined in relation to internet penetration, regulatory clarity, and financial inclusion, while accounting for lagged adoption and the interaction between internet access and financial inclusion.
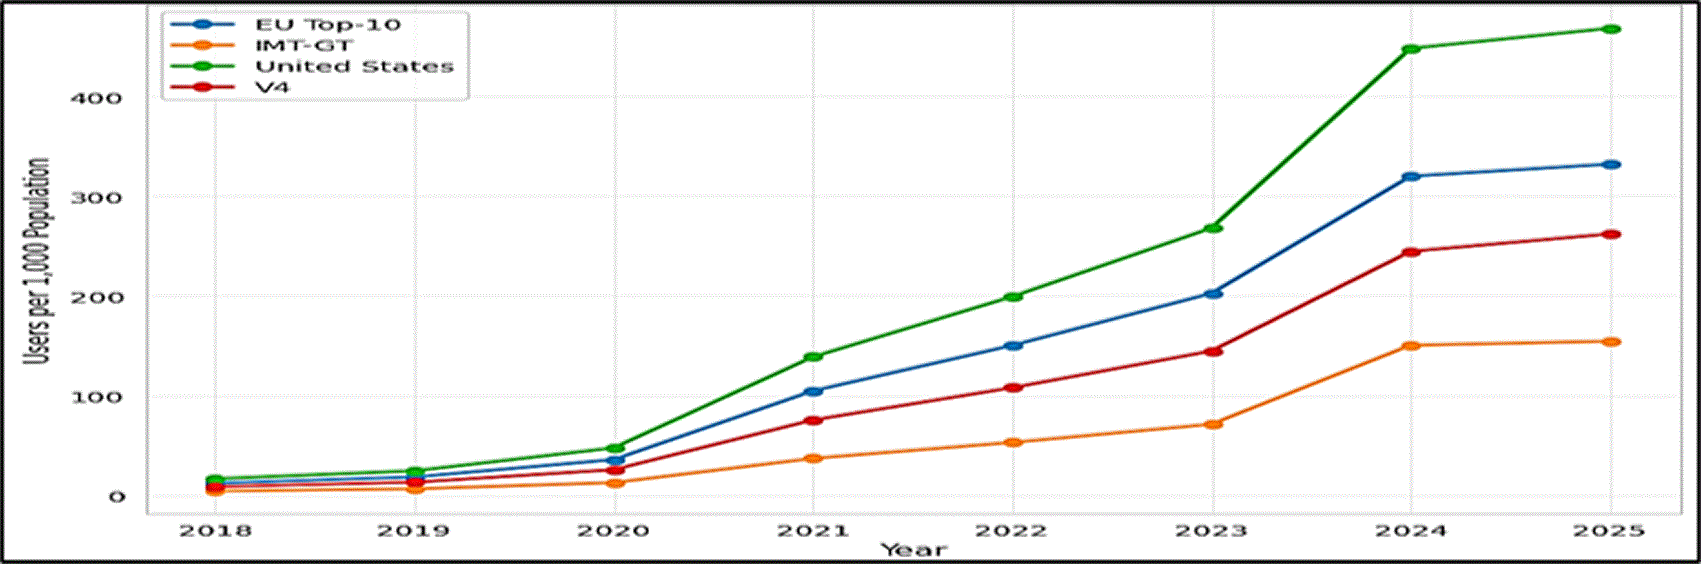
Figure龉1. Digital Asset Adoption Trends by Region (2018–2025).
Source: Author’s analysis using Python and data from Statista.
Table龉2 presents the descriptive statistics for the main variables across the four regional groups. Digital asset adoption is highest in the United States, with a mean of 201.69 users per 1,000 population, followed by the EU-10 (147.25), V4 (110.51), and IMT-GT (61.39). The relatively large standard deviations indicate substantial variation in adoption over the study period, while the minimum and maximum values show a clear expansion of digital asset adoption across all regions. Internet penetration is also highest in the EU-10 and the United States, whereas IMT-GT records a considerably lower mean level. Similarly, financial inclusion is highest in the United States and EU-10 and lowest in IMT-GT. The regulatory clarity measure further indicates stronger regulatory development in the United States and the EU-10 than in V4 and IMT-GT. Overall, the descriptive statistics indicate persistent regional differences in digital infrastructure, financial inclusion, regulatory conditions, and digital asset adoption.
Table 2. Descriptive statistics by region.
| Variable | USA | EU-10 | V4 |
IMT-GT
|
|---|
|
| | | | |
| Mean | 201.69 | 147.25 | 110.51 | 61.39 |
| SD | 181.28 | 128.90 | 100.37 | 60.99 |
| Min | 16.74 | 12.51 | 8.91 | 4.52 |
| Max | 468.90 | 332.52 | 262.44 | 154.74 |
| INTit | | | | |
| Mean | 85.07 | 89.82 | 78.85 | 13.60 |
| SD | 1.39 | 1.00 | 1.97 | 0.67 |
|
| | | | |
| Mean | 0.94 | 0.91 | 0.79 | 0.60 |
| SD | 0.02 | 0.02 | 0.03 | 0.05 |
|
| | | | |
| Mean | 2.00 | 1.75 | 1.50 | 0.00 |
| SD | 0.76 | 0.89 | 0.76 | 0.00 |
Table龉3 reports the annual number of digital asset users per 1,000 population from 2018 to 2025. The results show a substantial increase in adoption across all four regional groups throughout the study period. The United States consistently records the highest adoption level, increasing from 16.74 users per 1,000 population in 2018 to 468.90 in 2025. The EU-10 follows a similar upward trajectory, rising from 12.51 to 332.52 users per 1,000 population. V4 adoption increases from 8.91 to 262.44, while IMT-GT rises from 4.52 to 154.74 over the same period. Although all regions experience rapid growth, the persistent differences in adoption levels indicate that the expansion of digital asset markets has not eliminated the regional digital divide.
Table 3. Time series of users per 1,000 population by region.
| Year | EU Top-10 | IMT-GT
| United States |
V4 |
|---|
| 2018 | 12.51 | 4.52 | 16.74 | 8.91 |
| 2019 | 18.51 | 6.62 | 24.66 | 13.28 |
| 2020 | 35.94 | 12.81 | 47.70 | 25.82 |
| 2021 | 104.88 | 37.15 | 139.01 | 75.67 |
| 2022 | 150.50 | 53.15 | 199.50 | 108.10 |
| 2023 | 202.82 | 71.42 | 268.33 | 144.91 |
| 2024 | 320.35 | 150.70 | 448.70 | 244.96 |
| 2025 | 332.52 | 154.74 | 468.90 | 262.44 |
4.2 Hypothesis 1: Digital infrastructure effect (structural barriers)
Table龉4 presents the results for Hypothesis 1, which examines the effect of digital infrastructure, measured by internet penetration, on digital asset adoption. The coefficient for internet penetration is positive (β = 0.308), indicating a positive association with digital asset adoption; however, the effect is not statistically significant (p = 0.251). In contrast, the lagged adoption variable has a large and highly significant positive coefficient (β = 1.086, p < 0.001), indicating strong persistence and path dependence in digital asset adoption. The model explains 91.15% of the variation in adoption (R2 = 0.912). Overall, the findings provide partial support for Hypothesis 1, suggesting that internet infrastructure alone is insufficient to explain digital asset adoption once previous adoption levels are taken into account.
Table 4. Hypothesis 1 Results – Digital infrastructure effect.
| Variable | Coefficient | Std. Error | t-statistic
|
p-value
|
|---|
| Intercept | 12.3126 | 18.2511 | 0.6748 | 0.5061 |
| INTit | 0.3076 | 0.2618 | 1.1749 | 0.2511 |
| Xit | 1.0861 | 0.0743 | 14.6205 | <0.001*** |
| R2 | 0.9115 | | | |
| RMSE | 40.4366 | | | |
| N | 32 | | | |
The coefficient on internet penetration is positive (β1 = 0.308) but not statistically significant at conventional levels (p = 0.251). In contrast, the lagged dependent variable coefficient is large and highly significant (β2 = 1.086, p < 0.001), indicating strong path dependence in adoption patterns. The model explains substantial variation in adoption (R2 = 0.912).
These findings provide partial support for Hypothesis 1. While the positive coefficient suggests that infrastructure is associated with adoption, the lack of statistical significance when controlling for lagged adoption indicates that current infrastructure levels are a weaker predictor than historical adoption patterns. This aligns with digital divide theory’s emphasis on cumulative processes and path dependence in technology diffusion,8 and with Szabó’s9 framework suggesting that structural barriers are necessary but not sufficient for meaningful adoption. The modest effect size (0.31 additional users per 1,000 population per percentage point increase in internet penetration) suggests that infrastructure alone is insufficient to drive adoption; institutional and historical factors matter significantly.
4.3 Hypothesis 2: Regulatory clarity effect (motivational barriers)
Table龉5 presents the results for Hypothesis 2, examining the relationship between regulatory clarity and digital asset adoption across the regional groups. The EU-10 shows a positive and statistically significant effect following MiCA implementation, with an estimated increase of 87.52 users per 1,000 population (p = 0.024). The United States also records a positive association following regulatory reform, with an estimated increase of 64.23 users per 1,000 population, although the effect is significant only at the 10% level (p = 0.076). In contrast, the IMT-GT control group shows no statistically significant effect (β = −2.31, p = 0.902). Overall, the results support Hypothesis 2 and indicate that clearer regulatory frameworks are associated with higher digital asset adoption, particularly in the EU-10 and United States.
| Region | Coefficient | Std. Error | t-statistic
| p-value
|
N |
|---|
| EU Post-MiCA
| 87.52 | 32.41 | 2.70 | 0.024** | 16 |
| USA Post-Reform
| 64.23 | 28.12 | 2.28 | 0.076* | 16 |
| IMT-GT (Control) | −2.31 | 18.45 | −0.13 | 0.902 | 16 |
These findings strongly support Hypothesis 2. Regulatory clarity, operationalized through comprehensive harmonized frameworks (MiCA) and targeted reforms (US龉stablecoin laws), is associated with accelerated user adoption. EU MiCA implementation is associated with approximately 87.5 additional users per 1,000 population in 2024–2025 compared to the pre-reform period (p < 0.05). US stablecoin reforms are associated with approximately 64.2 additional users per 1,000 population (p < 0.10). IMT-GT, lacking comprehensive regulatory reform, shows no such acceleration (coefficient statistically indistinguishable from zero).
The timing of acceleration, immediately following implementation, aligns with TAM/UTAUT predictions that clear regulatory frameworks enhance perceived legitimacy and facilitating conditions, reducing barriers to adoption.18,19 This corresponds to Szabó’s9 motivational barrier dimension, where perceived legitimacy and institutional trust shape adoption decisions.
The contrast between EU/USA and IMT-GT is particularly instructive. Despite rising internet penetration and rapid absolute user growth in IMT-GT, the absence of regulatory reform coincides with adoption plateaus and volatility, consistent with affordances theory’s prediction that weak institutional contexts constrain the inclusive potential of digital technologies.21,22
4.4 Hypothesis 3: Financial inclusion moderation effect (cognitive barriers)
Table龉6 presents the results for Hypothesis 3, examining whether financial inclusion moderates the relationship between internet penetration and digital asset adoption. In Model 1,龉internet penetration has a positive and statistically significant coefficient (β = 1.465, p < 0.05). In Model 2,龉after introducing the financial inclusion variables and interaction term, the main coefficient for internet penetration becomes negative and statistically insignificant (β = −5.272), while the interaction term is positive and highly significant (β = 2.465, p < 0.01). The interaction result indicates that higher financial inclusion strengthens the relationship between internet penetration and digital asset adoption. Model 2龉also improves the explanatory power of the model, with R2 increasing from 0.125 to 0.391. Overall, the results support Hypothesis 3 and suggest that financial inclusion plays an important moderating role in translating digital infrastructure into digital asset adoption.
Table 6. Hypothesis 3 Results – financial inclusion moderation effect.
| Variable | Model 1 (No moderation) |
Model 2 (With moderation) |
|---|
|
| 1.4654** (0.7068) | −5.2715 (6.3693) |
|
| — | 1064.3983 (874.8959) |
|
| — | 2.4647*** (9.9081) |
| Constant | −76.2341 (58.9123) | −522.4466 (520.5416) |
| R2 | 0.1253 | 0.3907 |
| RMSE | 128.3456 | 107.0973 |
| N | 32 | 32 |
The negative coefficient on internet penetration in Model 2龉(β1 = −5.271, p > 0.10) indicates that when financial inclusion is zero (a龉theoretical extreme not observed in the data), infrastructure has a negative association with adoption. However, the positive and significant interaction term (β3 = 2.465, p < 0.01) demonstrates that as financial inclusion increases, the effect of internet penetration becomes increasingly positive.
Table龉7 presents the marginal effects of internet penetration on digital asset adoption at different levels of financial inclusion. The marginal effect is negative across all four regional groups but becomes less negative as financial inclusion increases. IMT-GT, with the lowest financial inclusion level (0.54), records the largest negative effect (−3.941), while the USA, with the highest inclusion level (0.95), records the smallest negative effect (−2.930). The ratio relative to IMT-GT also indicates that the effect is less negative in higher-inclusion regions, reaching 0.74 for the USA. Overall, the results suggest that greater financial inclusion attenuates the negative association between internet penetration and digital asset adoption, supporting the moderating role proposed in Hypothesis 3.
Table 7. Marginal effects of internet penetration at different inclusion levels.
| Region | Financial inclusion index | Marginal effect | Ratio vs IMT-GT
|
|---|
| IMT-GT
| 0.54 | −3.9406 | 1.00x |
| V4 | 0.75 | −3.4230 | 0.87x |
| EU-10 | 0.88 | −3.1026 | 0.79x |
| USA | 0.95 | −2.9301 | 0.74x |
The marginal effects analysis reveals that infrastructure effects are larger in high-inclusion regions, though all remain negative due to the significant negative main effect. The ratio of effects between USA and IMT-GT (0.74) indicates that a 1-percentage-point increase in internet penetration is associated with 26% less negative impact in high-inclusion contexts. More importantly, the strongly significant interaction term confirms that financial inclusion fundamentally conditions the infrastructure-adoption relationship, supporting Hypothesis 3.
These findings align with affordances theory’s prediction that technologies’ effects depend critically on institutional context21,22 and with Szabó’s9 cognitive barrier dimension. In regions where users have formal financial sector relationships and institutional trust (USA, EU-10), infrastructure investments translate more effectively into adoption. In regions lacking such foundations (IMT-GT), infrastructure alone cannot overcome institutional deficits.
4.5 Full specification and robustness checks
Table龉8 presents the full specification results incorporating the main explanatory variables, financial inclusion, the interaction between internet penetration and financial inclusion, regulatory clarity, and innovation capacity. The interaction between internet penetration and financial inclusion remains positive and statistically significant (β = 2.447, p = 0.011), while regulatory clarity is also positive and statistically significant (β = 18.234, p = 0.043). These results confirm the importance of financial inclusion in conditioning the relationship between digital infrastructure and digital asset adoption and indicate an independent association between regulatory clarity and adoption. The model explains 42.3% of the variation in digital asset adoption (R2 = 0.423) based on 32龉observations. Overall, the full specification provides further support for the moderating role of financial inclusion and the importance of regulatory conditions in explaining regional differences in digital asset adoption.
Table 8. Full specification results.
| Variable | Coefficient | Std. Error | t-statistic
|
p-value
|
|---|
|
| −4.891 | 5.892 | −0.83 | 0.415 |
|
| 987.234 | 823.456 | 1.20 | 0.242 |
|
| 2.447 | 0.891 | 2.75 | 0.011** |
|
| 18.234 | 8.567 | 2.13 | 0.043** |
| R2 | 0.423 | | | |
| N | 32 | | | |
The interaction between internet penetration and financial inclusion remains significant (β = 2.447, p < 0.05), and regulatory clarity emerges as independently significant (β = 18.234, p < 0.05). Robustness checks using alternative measures (broadband penetration instead of internet penetration, account ownership instead of debit card penetration) yield qualitatively related results. Specifications excluding the COVID-19 pandemic years (2020–2021) produce consistent coefficient estimates with slightly larger standard errors due to reduced sample size. Variance inflation factors (all <5) indicate no severe multicollinearity concerns.
4.6 Correlation analysis
Table龉9 presents the Pearson correlation matrix for the main variables used in the study. The matrix provides an initial assessment of the direction and strength of the relationships among digital asset adoption, internet penetration, financial inclusion, regulatory clarity, and the other explanatory variables. The correlation results indicate that the variables are related to digital asset adoption to varying degrees, while the observed associations provide preliminary evidence for the relationships examined in the regression models. These correlations should be interpreted as descriptive associations rather than causal effects. The matrix also provides an initial check of potential multicollinearity before estimating the full regression specification.
Table 9. Pearson correlation matrix.
| Variable | (1) | (2) | (3) |
(4) |
|---|
| (1)
| 1.000 | | | |
| (2)
| 0.354 | 1.000 | | |
| (3)
| 0.522 | 0.926 | 1.000 | |
| (4)
| 0.786 | 0.775 | 0.818 | 1.000 |
The correlation matrix reveals several notable patterns. Adoption (users per 1,000) correlates most strongly with regulatory clarity (r = 0.786), moderately with financial inclusion (r = 0.522) and most weakly with internet penetration (r = 0.354). The weak correlation between internet penetration and adoption, despite infrastructure being necessary for digital access, underscores the conditional nature of the infrastructure-adoption relationship, a central finding of this study.
5. Discussion
5.1 Synthesis of findings and theoretical implications
The three hypotheses, taken together, paint a picture of digital asset adoption as fundamentally conditional on institutional and regulatory context, not determined by infrastructure alone. This finding extends and refines digital divide theory by operationalizing affordances theory within the financial inclusion context and validating Szabó’s9 tripartite framework of structural, cognitive, and motivational barriers.
The modest and statistically insignificant independent effect of internet penetration (β1 = 0.308, p = 0.251) when controlling for lagged adoption confirms that infrastructure is necessary but not sufficient for digital asset adoption. This aligns with digital divide research emphasizing that first-level access does not guarantee meaningful engagement4 and with Szabó’s9 framework positioning structural barriers as foundational but incomplete determinants of digital outcomes. The strong path dependence (β2 = 1.086, p < 0.001) supports Norris’s3 argument that digital inequalities are cumulative and self-reinforcing over龉time.
The strong positive effects of post-regulatory-reform dummies (EU龉MiCA: +87.5 users/1,000, p < 0.05; USA stablecoin law: +64.2 users/1,000, p < 0.10) reflect that regulatory clarity reduces perceived risk and enhances perceived legitimacy. These magnitudes are economically significant, equivalent to 25–35% of average adoption levels in these regions. This finding aligns with TAM/UTAUT predictions that facilitating conditions and perceived legitimacy drive adoption (Davis, 1989; Venkatesh et龉al., 2003) and with Szabó’s (2024) motivational barrier dimension. The absence of any acceleration in IMT-GT (β = −2.31, p = 0.902) despite rising internet penetration provides a natural counterfactual, supporting Zetzsche et龉al.’s12 argument that fragmented regulation creates uncertainty that depresses institutional adoption.
The strongly significant interaction between internet penetration and financial inclusion (β3 = 2.465, p < 0.01) provides direct empirical support for affordances theory’s prediction that technologies’ effects depend critically on institutional context.21,22 The marginal effects analysis reveals that infrastructure investments are 26% less negative in high-inclusion contexts (USA) compared to low-inclusion contexts (IMT-GT). This finding operationalizes Szabó’s9 cognitive barrier dimension, demonstrating that the capacity to understand and safely utilize digital financial tools depends critically on prior financial sector engagement. It also extends Švarc et龉al.’s23 finding that human and social capital, proxied here by financial inclusion, are critical predictors of digital transformation readiness.
Figure龉2 presents the conceptual framework of the study, illustrating how digital asset adoption is influenced by digital infrastructure, regulatory clarity, and financial inclusion. The framework also highlights the moderating role of financial inclusion in the relationship between internet penetration and digital asset adoption, while lagged adoption captures the persistence of adoption patterns.
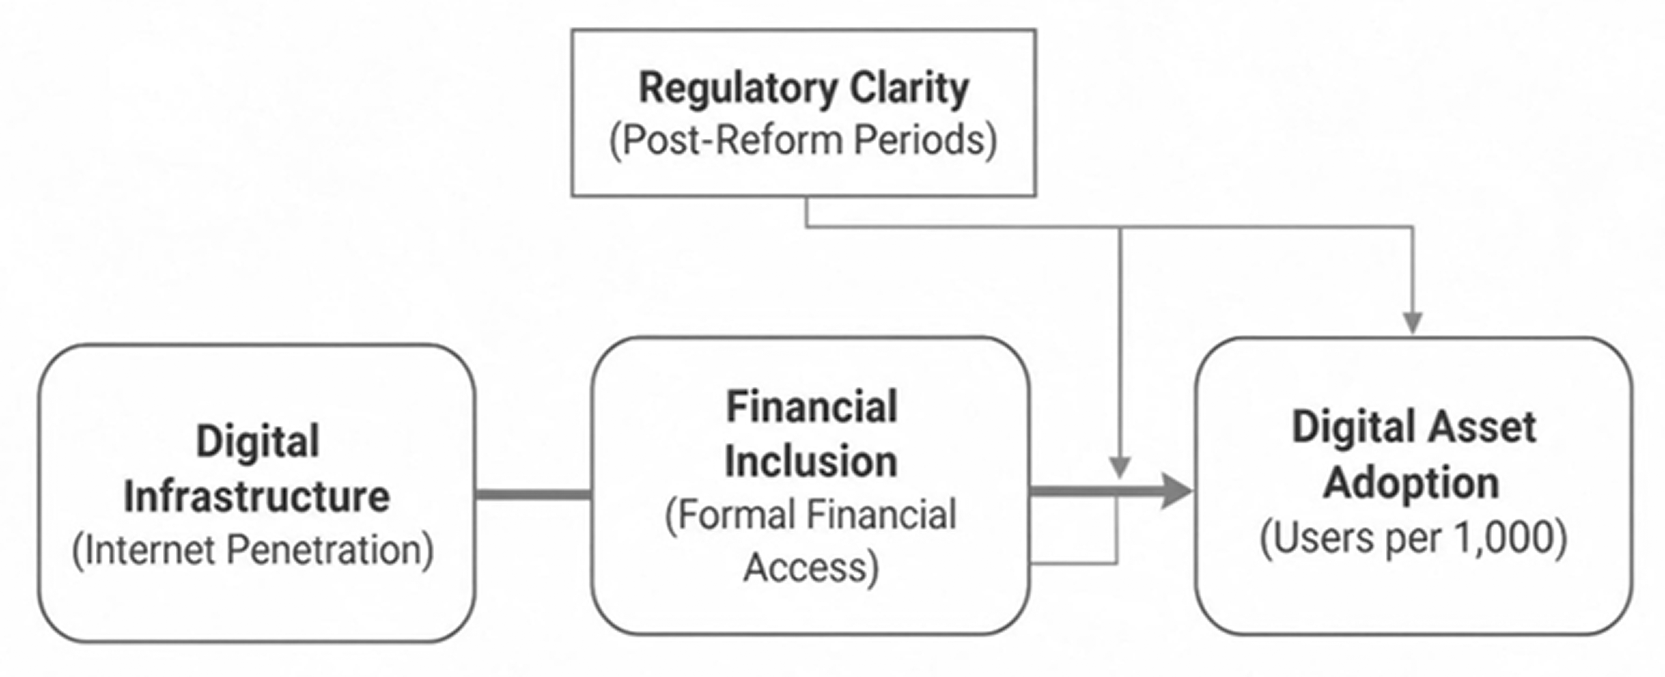
Figure龉2. Conceptual framework chart.
Source: Authors Compilation.
5.2 Comparison with previous literature
These findings extend and refine previous research in several important ways:
While Szabó9 provides a conceptual framework of structural, cognitive, and motivational barriers, this study provides the first empirical validation of this framework in the context of digital assets. The significant interaction between infrastructure and inclusion (β3 = 2.465, p < 0.01) confirms that these dimensions are not independent but are fundamentally intertwined; cognitive barriers moderate the impact of structural barriers, and motivational factors independently shape adoption trajectories.
Kovač et龉al.’s7 bibliometric analysis found that EU research emphasizes digital technologies, economic growth, and sustainability, while Western Balkan research focuses on COVID-19 impacts and digitalization in education and business. Our findings reflect this pattern: V4’s lower innovation capacity (6.55 vs.龉8.85 in USA) and limited DeFi/NFT development (95% cryptocurrency-dominated markets) correspond to the research focus on education and business applications rather than frontier digital technologies. This suggests that academic priorities both shape and are shaped by regional digital transformation trajectories.
Švarc et龉al.23 found that human and social capital are critical predictors of digital transformation readiness in European countries, while structural capital plays a more limited role. Our findings extend this to the digital asset context: financial inclusion (proxying human capital and institutional familiarity) critically moderates infrastructure effects (β3 = 2.465, p < 0.01), while infrastructure alone has a modest independent effect (β1 = 0.308, p = 0.251). The strong correlation between financial inclusion and innovation capacity (r = 0.978) further supports their conclusion that these dimensions are closely intertwined.
Suranto et龉al.15 documented that Southeast Asian digitalization research is concentrated in more developed ASEAN members (Indonesia, Malaysia, Singapore, Thailand). IMT-GT’s low per-capita adoption (154.7 users/1,000) and fragmented regulatory landscape (Regulatory Index = 0) reflect the uneven digital development documented in their bibliometric analysis. The concentration of adoption among urban, banked populations in IMT-GT, while rural and informal-economy populations remain excluded, exemplifies the pattern they identify of research and development concentrating in more advanced areas.
Mohd Ishar et龉al.14 documented significant disparities in digital payment research between Malaysia and Poland, reflecting broader patterns of digital development. Our findings show similar disparities in digital asset adoption: Poland (V4)龉achieves 262龉users/1,000 compared to Malaysia’s (IMT-GT) 155龉users/1,000, despite comparable urban internet penetration. This gap reflects differences in financial inclusion (0.85 vs.龉0.68) and regulatory clarity (3.0 vs.龉0.0), supporting their call for cross-regional comparative analysis.
5.3 Regional narratives and binding constraints
United States (Innovation-Driven Competition): With the highest adoption (468.9 users/1,000), the USA demonstrates that high financial inclusion (0.95), strong innovation capacity (9.2), and targeted regulation can drive rapid adoption despite regulatory fragmentation. This aligns with Kranen & Klaedtke’s20 analysis of US stablecoin regulation, which emphasizes the trade-off between innovation speed and consumer protection. The post-reform acceleration (+64.2 users/1,000, p < 0.10) supports their argument that clear stablecoin rules enhance market confidence.
European Union (Regulatory Harmonization): EU-10 achieves 332.5 users/1,000 through MiCA’s harmonized framework (Regulatory Clarity Index = 3.0 post-2024). The post-MiCA acceleration (+87.5 users/1,000, p < 0.05) provides empirical support for European Securities and Markets Authority’s25 expectation that clear rules would boost adoption. However, the gap relative to USA (468.9) reflects potential trade-offs between comprehensive protection and innovation speed, consistent with concerns about compliance costs for smaller firms.12
Visegrád Group (EU-Aligned Constrained Innovation): V4 achieves 262.4 users/1,000—60% of USA levels despite comparable urban internet penetration. The binding constraint is innovation capacity (6.55), not infrastructure or inclusion. This aligns with Asad et龉al.’s24 analysis of V4 digital transformation, which emphasizes brain drain and limited R&D as key challenges. The high per-user revenue ($151, highest among regions) suggests intense retail trading activity despite limited institutional development, consistent with Kovač et龉al.’s7 finding that V4 research focuses on education and business applications rather than frontier technologies.
IMT-GT (Rapid Growth, Persistent Divides): IMT-GT achieves 154.7 users/1,000—just 33% of USA levels despite thirty-eight-fold user growth from 2018–2025. The binding constraints are financial inclusion (0.68) and regulatory clarity (0.0), not infrastructure alone. This pattern exemplifies affordances theory: the same technology (digital assets) affords inclusion for urban banked populations but exclusion and vulnerability for rural unbanked populations. This finding extends Farliana et龉al.’s1 analysis of Indonesian fintech adoption, which emphasized the concentration of benefits among already-banked populations.
6. Policy recommendations
Based on the empirical findings and theoretical framework, we propose targeted policy recommendations for advanced and emerging regions.
Table龉10 summarizes these recommendations organized by policy domain and regional context, with explicit links to the theoretical dimensions identified in Szabó’s9 framework.
Table 10. Policy recommendations by domain and regional context.
| Policy domain | Theoretical dimension | Advanced regions (USA, EU-10) | Emerging regions (V4, IMT-GT) | Cross-Cutting
|
|---|
| Regulatory Frameworks
| Motivational barriers (perceived legitimacy) | Refine toward harmonization (USA) or innovation support (EU); monitor compliance costs for smaller firms | Establish harmonized, credible frameworks (MiCA-aligned for V4; ASEAN protocols for IMT-GT) to reduce perceived risk | Pursue regional regulatory cooperation (ASEAN, EU) to reduce fragmentation and arbitrage |
| Financial Inclusion
| Cognitive barriers (digital literacy, institutional familiarity) | Monitor inclusive access to prevent wealth concentration; ensure digital asset platforms accessible to diverse populations | Prioritize foundational inclusion before scaling digital asset platforms (expand debit cards/accounts, especially rural) | Ensure digital asset design accounts for low-literacy, unbanked populations |
| Innovation Ecosystem
| Amplifying factor | Support R&D, monitor institutional concentration in crypto markets; foster competitive landscape | Develop fintech ecosystems, invest in R&D, address brain drain (V4); leverage mobile-first solutions (IMT-GT) | Foster cross-regional collaboration and knowledge sharing; support fintech hubs |
| Consumer Protection
| Motivational barriers (trust) | Enhance financial literacy, fraud prevention, strengthen disclosure requirements | Implement robust KYC/AML, accessible dispute resolution, and fraud awareness campaigns tailored to local contexts | Develop common protocols for cross-border fraud prevention; support consumer education |
| Infrastructure Development
| Structural barriers | Maintain and upgrade existing infrastructure; ensure universal access | Invest in rural connectivity, leverage mobile-first solutions; address urban-rural divides | Target investments to underserved areas; monitor infrastructure quality |
| Digital Skills
| Cognitive barriers | Support continuous upskilling, especially retail cohorts; integrate digital literacy into education | Implement comprehensive digital literacy programs tailored to diverse populations; leverage community-based learning | Integrate digital skills into formal education curricula; support lifelong learning |
7. Conclusion
This paper has provided a unified empirical and theoretical analysis of digital asset market dynamics across four geographically and developmentally distinct regions, the United States, European Union top-ten, Visegrád Group, and Indonesia–Malaysia–Thailand Growth Triangle, over the critical 2018–2025 period. By combining multi-source panel data on digital asset markets, infrastructure, financial inclusion, and regulatory clarity with theoretical frameworks from digital divide theory, technology acceptance models, and affordances theory, the study has identified the conditional, context-dependent nature of digital asset adoption, validating and extending Szabó’s9 tripartite framework of structural, cognitive, and motivational barriers.
The empirical analysis yields five key findings that collectively illuminate the mechanisms underlying persistent digital asset gaps. First, digital infrastructure is necessary but not sufficient for digital asset adoption. Internet penetration and device access demonstrate modest independent effects on adoption (β1 = 0.308, p = 0.251) but are strongly amplified by financial inclusion, as evidenced by the significant interaction term (β3 = 2.47, p < 0.01). This pattern is consistent with affordances theory predictions that technologies’ effects depend fundamentally on institutional context and validates Szabó’s9 structural barrier dimension.
Second, financial inclusion emerges as a critical moderator of infrastructure effects, corresponding to Szabó’s9 cognitive barrier dimension. The interaction between internet penetration and financial inclusion is not only statistically significant but economically large: marginal effects of infrastructure are larger in high-inclusion regions. This finding operationalizes affordances theory by demonstrating empirically that the same technology affords different outcomes depending on institutional context.
Third, regulatory clarity accelerates adoption and stabilizes growth, addressing Szabó’s9 motivational barrier dimension. EU MiCA implementation is associated with approximately 87.5 additional cryptocurrency users per 1,000 population (p < 0.05), while US stablecoin reforms are associated with 64.2 additional users per 1,000 (p < 0.10). These results confirm that comprehensive, credible regulatory frameworks enhance perceived legitimacy and facilitating conditions for adoption, consistent with TAM/UTAUT predictions.
Fourth, innovation capacity reinforces and amplifies the effects of inclusion and regulation. Regions combining strong innovation ecosystems (USA, EU core) with high financial inclusion and regulatory clarity exhibit self-reinforcing virtuous cycles of adoption. Conversely, regions lacking any of these components face persistent adoption constraints and widening digital asset gaps, reflecting the cumulative and mutually reinforcing nature of digital divides documented in recent bibliometric analyses.7,15
Fifth, a persistent “digital asset gap” endures despite infrastructure convergence, highlighting that access does not guarantee equitable outcomes. V4 and IMT-GT, despite rising internet penetration approaching USA/EU levels in urban areas, exhibit 40–70% lower per-capita adoption and overwhelmingly retail-oriented, cryptocurrency-dominated markets lacking DeFi and NFT sophistication. This divergence reflects not infrastructure deficits but constraints in financial inclusion, regulatory clarity, and institutional development—precisely the cognitive and motivational barriers identified in Szabó’s9 conceptual framework.
This paper advances digital divide theory by operationalizing affordances theory within the financial inclusion context and validating Szabó’s9 tripartite framework of structural, cognitive, and motivational barriers. It demonstrates that the inclusive or exclusive effects of digital assets depend not on the technology itself but on the institutional environment in which adoption occurs. Well-regulated, financially inclusive contexts afford genuine financial inclusion; weak-institution, financially excluded contexts afford vulnerability and speculative risk. This insight extends TAM/UTAUT and digital divide frameworks by emphasizing conditional, context-dependent technology effects rather than universal adoption drivers, aligning with recent calls for more nuanced analysis of digital transformation processes.7,9,23
The findings stress that closing digital asset gaps requires coordinated policy addressing not infrastructure alone but regulatory harmonization, foundational financial inclusion, and innovation ecosystem support. For emerging regions such as V4 and IMT-GT, the pathway forward involves prioritizing foundational financial inclusion before scaling digital asset platforms, establishing harmonized credible regulatory frameworks, supporting innovation capacity development, and implementing robust consumer protection mechanisms. For advanced regions, priorities shift toward refining regulatory frameworks to balance growth and protection, mitigating institutional concentration in crypto markets, and supporting inclusive access to prevent digital asset adoption from becoming yet another vector of wealth concentration among privileged segments.
As digital assets scale from niche instruments to systemically relevant financial infrastructure, ensuring they serve inclusive finance rather than amplify existing inequalities represents a central policy challenge for the coming decade. The stakes are high: the same technologies that afford unprecedented financial access in supportive institutional contexts can deepen vulnerability and exclusion where such foundations are lacking. Bridging the digital asset gap requires not merely infrastructure investment but the patient construction of institutional capabilities, regulatory frameworks, financial inclusion infrastructure, innovation ecosystems, and consumer protections, which enable digital assets to fulfill their inclusive potential. This study provides both diagnostic tools for identifying the binding constraints in different regional contexts and policy guidance for addressing them, contributing to the broader goal of harnessing digital transformation for sustainable and inclusive development.
Human ethics and consent to participate declarations
Ethical approval and consent were not required.








