Introduction
Heatwaves are a growing topic of interest in plant and soil science research related to climate change. This extreme weather event is generally defined as a period of several consecutive days with abnormally high temperatures (Perkins et al., 2013). Some definitions specify a duration of at least three or five consecutive days, during which time temperatures exceed either a fixed threshold (e.g. 5 °C above average) or a statistical limit, such as the 95th percentile (P95). While definitions may vary, the impact of heatwaves on plant functioning, ranging from the molecular to the ecosystem level (Andreu Cera et al., 2026), has been well evidenced over recent decades (Breshears et al., 2021; Geange et al., 2021; Jagadish et al., 2021; Teskey et al., 2015). The increasing frequency and intensity of heatwaves have raised significant concerns in many areas (Intergovernmental Panel on Climate Change (IPCC), 2023;
Perkins-Kirkpatrick et al., 2020), emphasising the importance of understanding their impact on plants and more broadly on ecosystems.
Simulating heatwaves has become essential to study their effects on plants under controlled conditions (Breshears et al., 2021; De Boeck et al., 2016). Heatwaves are erratic events that are difficult to study in nature and challenging to recreate in the field. Consequently, most studies are conducted in greenhouses or croplands, with few conducted in wildlands or on wild species (Geange et al., 2021). Furthermore, field experiments with replicates are rarely carried out due to the costs of current techniques, which, moreover, require either fuel- or electricity-powered generators (Rasmussen et al., 2015). A literature review describes multiple techniques for simulating heatwaves in the field (De Boeck et al., 2010). They essentially involve the use of heaters, with or without additional structures, such as chambers (Uppal et al., 2025). A recent methodological paper compared the simulation of heatwaves in the field using structures with or without heaters, i.e. active or passive heating (Arnold et al., 2025). The authors concluded that using heaters was the most effective way to simulate heatwaves. However, this study used an expensive method, limiting the number of replicates. Standard open-top chamber (OTC) can also be used to induce heat shocks, but as OTCs were designed to reproduce warming in tundra experiments (Hollister et al., 2023), they required the use of ceramic heaters in experiments conducted in dryland, and, above all, already hot environments (Milner et al., 2023). Another study, investigating the impact of heatwaves on soils in a warm and semiarid region of the USA, used black mirrors made of poly (methyl methacrylate) covered with infrared-reflecting film to raise the temperature (Rasmussen et al., 2015). This option is more affordable and easily replicable, but lacks the infrastructure required to simulate homogeneous heatwaves across the entire plant community (e.g. using chambers). To improve the study of the effects of heatwaves on plants, a methodology is needed to simulate heatwaves in natural environments by multiplying the replicates while limiting the costs.
Heatwaves are characterized not only by increased temperature, but also by a substantial rise in vapor pressure deficit (VPD) and enhanced incoming solar radiation. In Western Europe, heatwaves are usually concomitant to drought, thus implying high VPD. Although daytime maximum temperatures increase significantly during heatwaves, nighttime minimum temperatures do not necessarily follow the same pattern (De Boeck et al., 2010). Previously proposed experimental setups to simulate heatwaves failed to capture one or more of these key features. While infrared heaters, which are among the less expensive options, can increase VPD, they do not induce additional solar radiation and they tend to elevate nocturnal minimum temperatures (Kimball et al., 2008). Therefore, a more suitable experimental infrastructure that would mimic these associated conditions remains to be developed.
Here, we present a solar-powered structure designed to create local heatwaves in the field, allowing the impact of heatwaves on herbaceous and small shrub communities to be analysed. This structure is low-cost, does not require the use of electricity or fossil fuel energy, and is easily replicable which allows issues of pseudoreplication and spatial autocorrelation in ecological studies to be mitigated (Diniz-Filho et al., 2003; Hurlbert, 1984). We realised a pilot study in Spain aimed at inducing a spring heatwave in a semiarid Mediterranean Ecosystem. We then analyzed the results against historical weather data from a nearby station.
Methodology
Heat-crater design
Our goal was to design a low-cost, easily replicable structure to study how plants respond to heatwaves in the field. The structure had to mimic real heatwaves without increasing relative humidity, reducing VPD or raising night-time temperatures, to avoid confounding microclimatic artefacts. Rather than physically enclosing the plant in a chamber, the structure was designed to retain incoming solar energy and increase the air temperature through radiative trapping and reduced convective exchange within an open chamber.
The resulting structure, hereafter referred to as the heat-crater (
Figure 1), is a hexagonal frustum constructed from 2 mm polycarbonate sheets coated with a solar control film. Each of the six panels is an isosceles trapezoid measuring 800 x 300 x 500 mm (larger base x smaller base x height). The smaller base is positioned at ground level, with the larger base forming the upper opening. Given the geometry of the panels and their vertical height of 240 mm above the soil surface, each panel is inclined at approximately 30° relative to the ground. This configuration enhances radiative convergence while maintaining airflow. Additionally, a rectangular trapezoid spoiler for each panel measuring 350 x 100 x 500 mm (larger base x smaller base x height) was added to each panel to slightly reduce the ventilation of accumulated heat. The dimensions were selected to enclose a central 500 × 500 mm plot for herbaceous vegetation surveys on semiarid conditions, ensuring that the entire sampling area remained fully exposed to passive radiative warming, because the hexagon area is 0.5 m2.
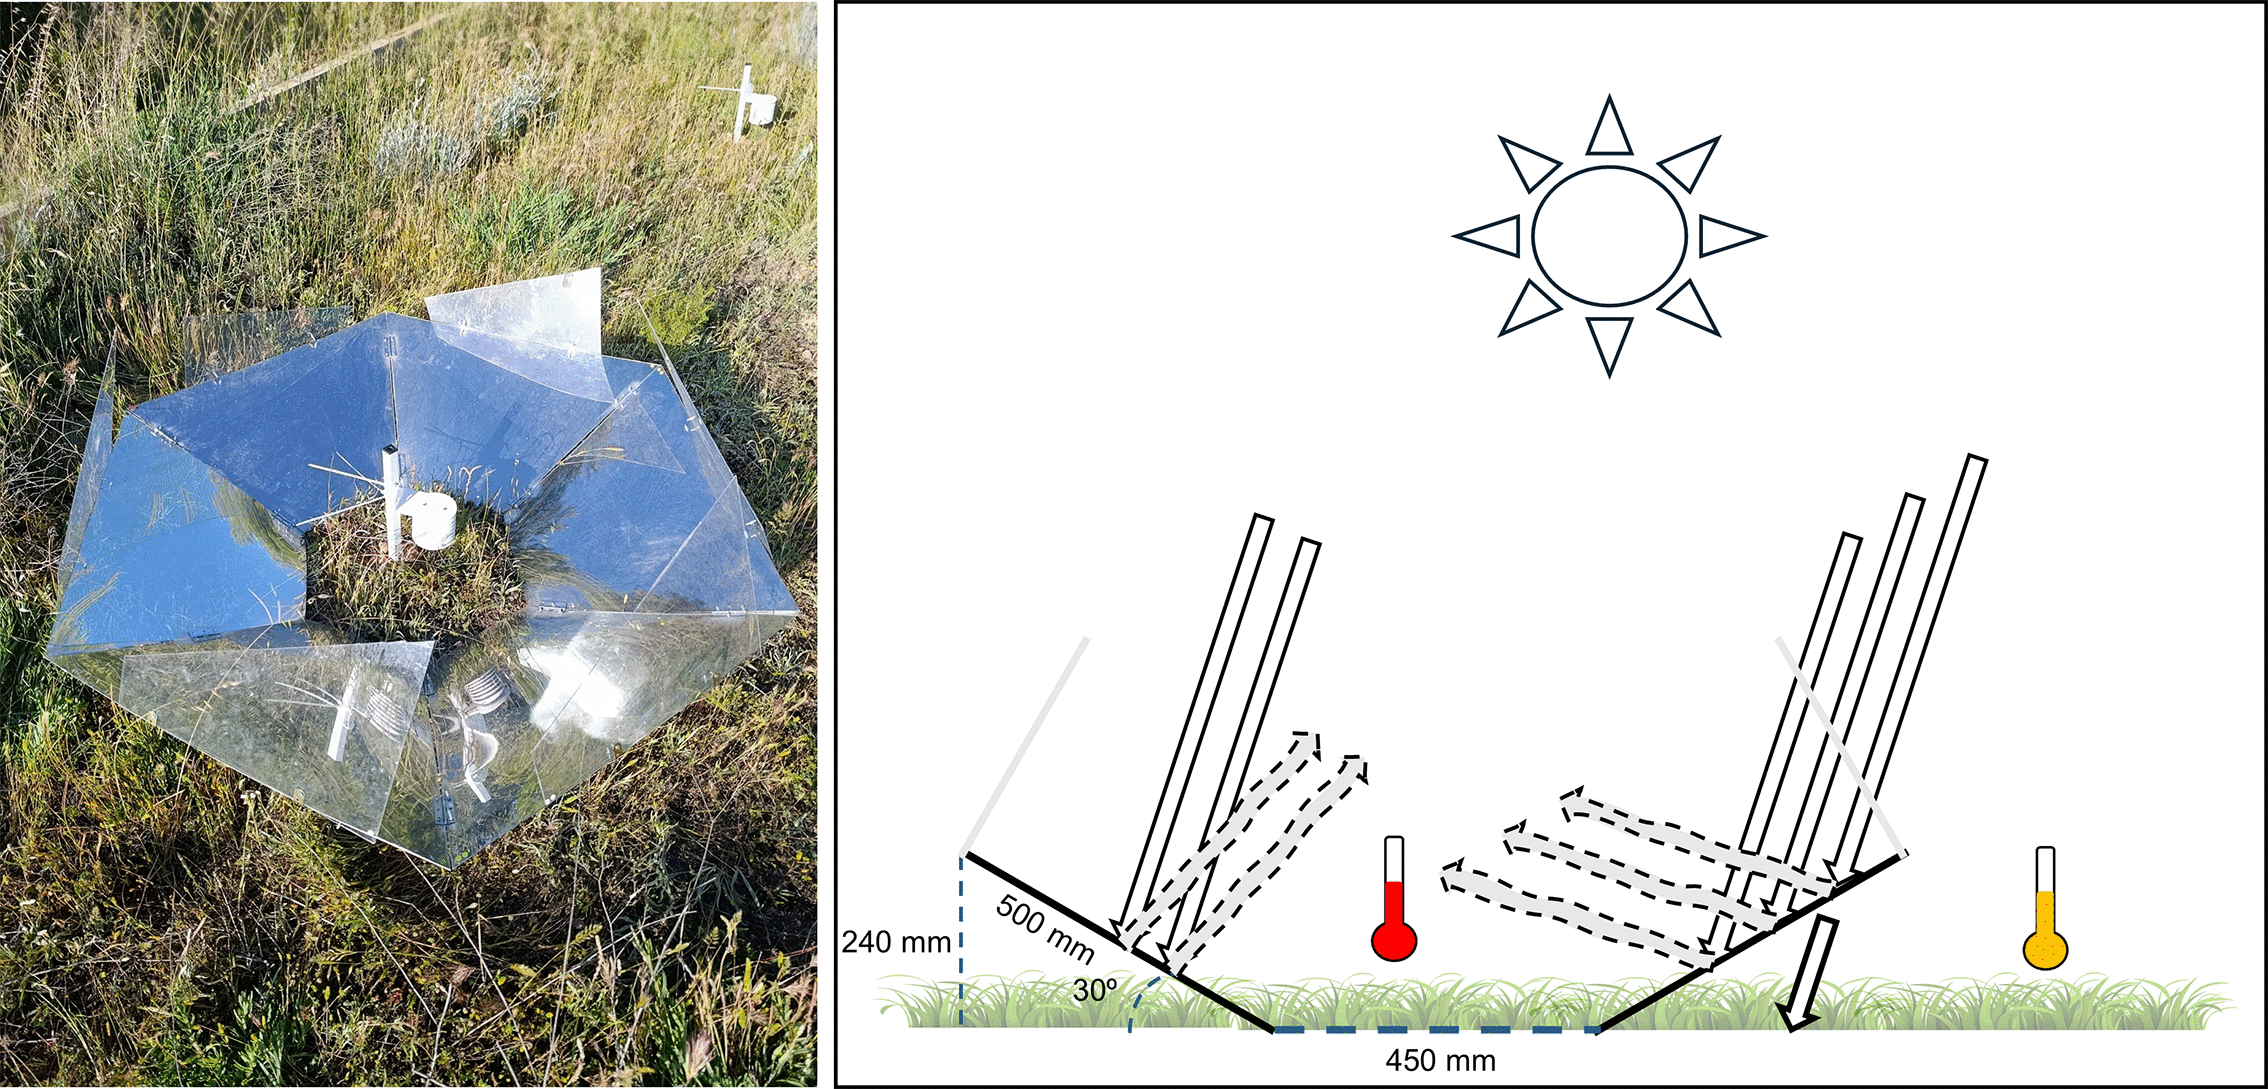
Figure 1. Heat-crater.
Sensors are installed inside and outside the infrastructure. Photography was taken in Albacete (Spain) during the pilot study.
The solar control film reflects up to 89% of incident solar energy in the infrared range. This reduces long-wave losses and promotes heat accumulation within the crater. This configuration enables the system to raise the air temperature and VPD at plant height, thus effectively reproducing the conditions of a real heatwave.
Pilot test: Induction of local heatwaves
Spring heatwaves are becoming more frequent in the Mediterranean region (Boboc et al., 2025). We focused on this type of heatwave designing this test because spring is the growing period for herbaceous species in the Mediterranean region, particularly in semiarid areas. Although summer heatwaves are more commonly studied, they are less relevant to species in a semiarid ecosystem (Milner et al., 2023). We built a heat-crater according to the above-described dimensions. We placed the heat-crater in the Botanical Garden of Castilla-La Mancha in Albacete (38°58′19.0”N, 1°51′36.6”W) on a two-week period from 12 to 25 May 2026. The structure was located within an herbaceous community dominated by Plantago lanceolata L., Medicago minima (L.)L. and Avena sterilis
L.
Temperature and atmospheric vapor pressure were recorded at five-minute intervals over a two-week period, including seven consecutive days of warm weather. These variables were recorded using Atmos14 sensors and saved on a ZL6 datalogger (Meter Group, Inc., Pullman, USA). One sensor was placed inside the heat-crater and another for the control 2 m away from it (outside). Both sensors were placed 150 mm from the soil.
Statistical analyses
To test whether the effects of the heat-crater could mimic local heatwaves, we conducted two analyses: (i) the differences between the variables acquired with the sensors located inside and outside the heat-crater were quantified; and (ii) the induced local heatwave was compared to extrapolated heatwave conditions in Albacete. Because only a single experimental structure was available, independent replication was not possible. Therefore, days were used as temporal replicates to provide a preliminary statistical evaluation of this pilot study. We acknowledge that this approach constitutes pseudoreplication and should be interpreted as a methodological validation rather than a fully replicated experiment.
For the first analysis, temperature and vapor pressure deficit (VPD) that had been recorded during the two-week period were used. For both variables, we calculated the mean, maximum and minimum values. Three datasets were considered: (i) all hours, (ii) daytime (11 am–5 pm), and (iii) night-time (12 am–6 am). Student’s t-tests were applied to each variable to evaluate daily differences between sensors inside and outside the heat-crater. Additionally, we calculated the daily differences in the mean, maximum and minimum temperatures between the two sensors for each variable.
For the second analysis, we used data from an automatic weather station (AWS) located near the Botanical Garden (2 km away) in Albacete Base Aérea (AEMET, 38°57′25.8”N 1°52′28.3”W). We calculated daily 90th percentile (P90) and 95th percentile (P95). Temperature percentiles were calculated using records from 1940 to 2025 (Serrano-Notivoli et al., 2022). We also analysed the daily absolute maximum air temperature recorded 2 meters above the ground by the AWS during the study period. To extrapolate these datasets from the first analysis, we added the observed temperature differences between the sensors to the AWS data. This derived variable removed microclimatic variability and enabled comparison with climate heatwave conditions (hereafter referred to as “AWS + heat-craterdiff “).
Results
During the 14-day study period, the sensor located inside the heat-crater recorded higher temperatures and VPD values than the sensor outside (
Figure 2,
Table 1). Average maximum differences exceeded 4 °C and 0.63 kPa, respectively, while minimum differences were approximately 0.3 °C and 0.01 kPa. The mean difference was 0.63 °C and 0.22 kPa, respectively. Maximum differences were constantly greater during the daytime than at night. In fact, nighttime differences in VPD were not significant for maximum or mean values.
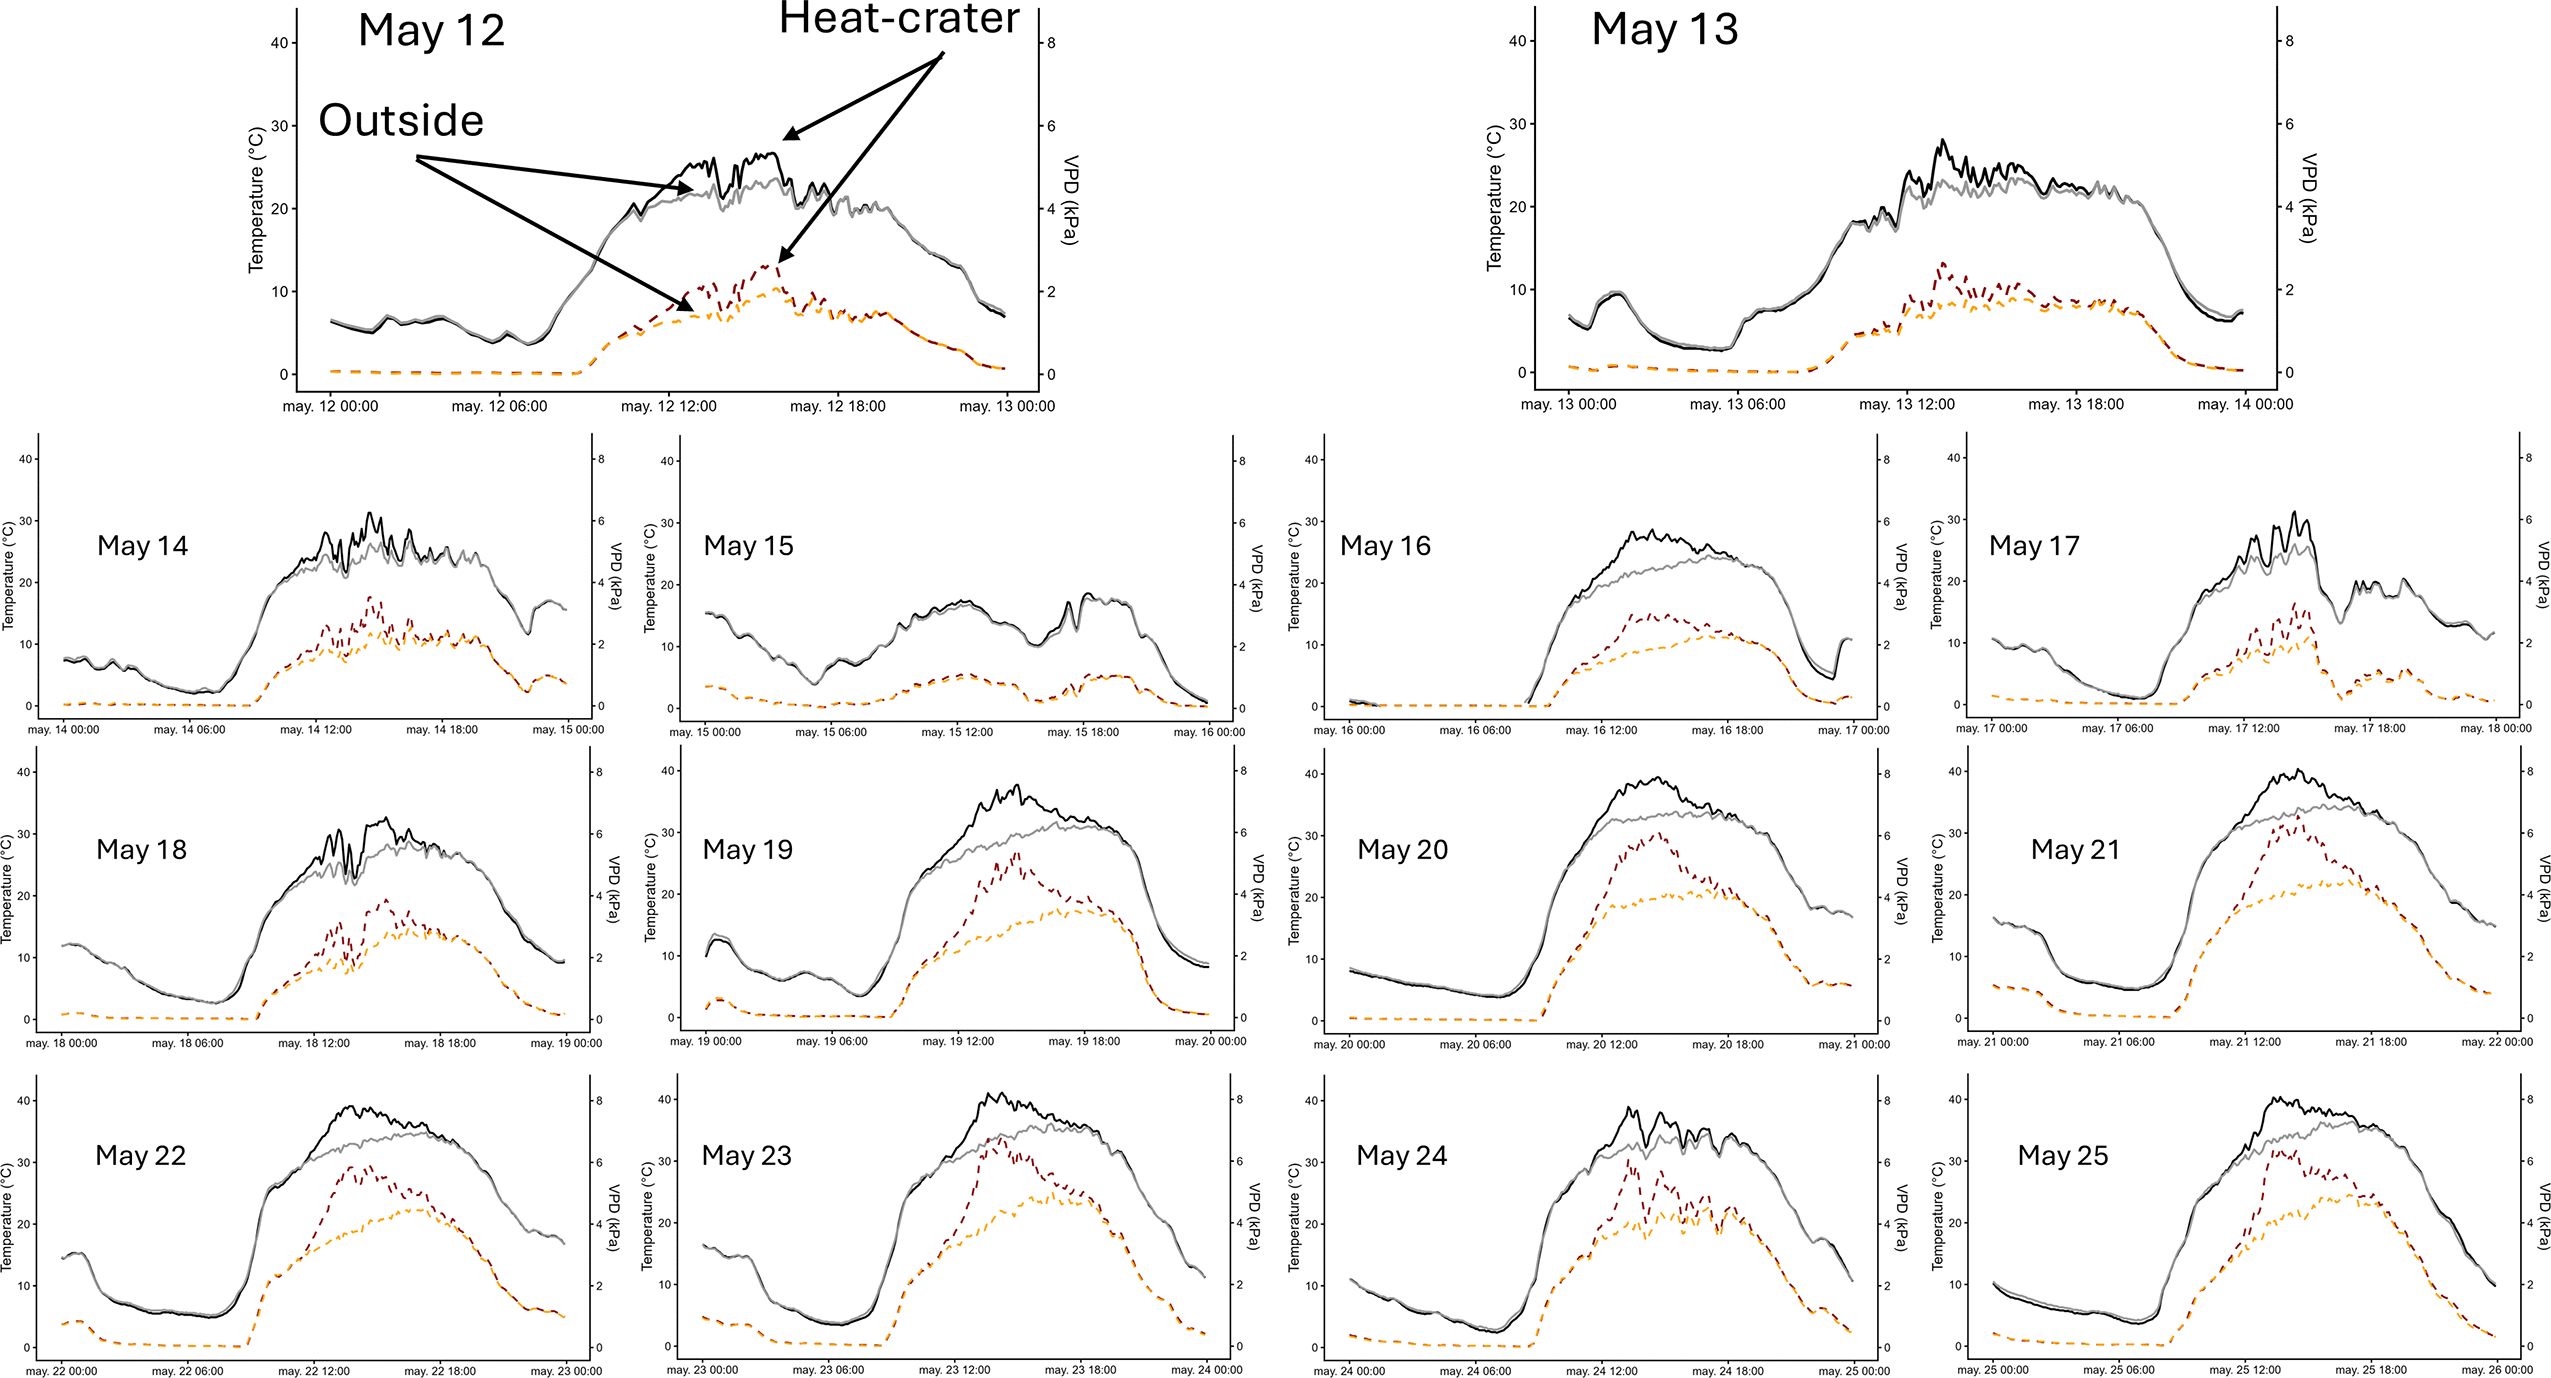
Figure 2. Temperature (solid lines) and vapor pressure deficit (dotted lines) at 5-minute intervals over a two-week period in May 2026 in Albacete (Spain), recorded by sensors inside the heat crater (black and red) and outside (grey and orange).
Table 1. Student’s t-test of the difference between heat-crater and control sensors on variables of temperatures and vapor pressure deficit.
Estimated mean difference by test is shown.
| | T-test (Heat-crater vs Control) | Df | p-value
|
Mean difference (estimate) |
|---|
| All hours | | | | | |
| Temperatures | Max | 9.02 | 14 | <0.001 | 4.08 |
| Min | −6.76 | 14 | <0.001 | −0.29 |
| Mean | 5.54 | 14 | <0.001 | 0.63 |
| VPD | Max | 6.99 | 14 | <0.001 | 1.15 |
| Min | 10.58 | 14 | <0.001 | 0.01 |
| Mean | 6.27 | 14 | <0.001 | 0.22 |
| 11 AM- 5 PM | | | | | |
| Temperatures | Max | 11.52 | 14 | <0.001 | 4.42 |
| Min | 3.24 | 14 | <0.001 | 0.38 |
| Mean | 9.76 | 14 | <0.001 | 2.51 |
| VPD | Max | 7.45 | 14 | <0.001 | 1.21 |
| Min | 5.37 | 14 | <0.001 | 0.10 |
| Mean | 6.91 | 14 | <0.001 | 0.67 |
| 12 PM- 6 AM | | | | | |
| Temperatures | Max | −3,19 | 14 | 0.007 | −0.24 |
| Min | −5.37 | 14 | <0.001 | −0.25 |
| Mean | −6.71 | 14 | <0.001 | −0.22 |
| VPD | Max | 0.42 | 14 | 0.683 | 0.00 |
| Min | 6.45 | 14 | <0.001 | 0.01 |
| Mean | 3.29 | 14 | 0.006 | 0.00 |
At a daily scale (
Table 2 and
Figure 2), the maximum temperature difference between the sensors exceeded 6 °C, reaching 8.5 °C on 19 May 2026 during the daytime. In contrast, nighttime temperature differences were small (below 1 °C), but significant, with the outside sensor consistently recording higher temperatures (i.e. negative differences).
Table 2. Daily mean, standard error, and minimum and maximum temperature differences between sensors located inside and outside the heat crater, computed separately for daytime (11 AM–5 PM) and nighttime (12 AM–6 AM).
| | 11 AM - 5 PM | 12 PM - 6 AM |
|---|
| Day of May
| Sun hours | Min | Max | Mean + SE | Min | Max | Mean + SE |
|---|
| 12 | 10.1 | 0.2 | 4 | 2.09 ± 0.14 | −0.5 | 0 | −0.23 ± 0.02 |
| 13 | 7.6 | 0.4 | 4.9 | 1.67 ± 0.11 | −0.6 | −0.1 | −0.30 ± 0.01 |
| 14 | 7.4 | 0.4 | 5.4 | 2.07 ± 0.14 | −0.7 | 0 | −0.30 ± 0.02 |
| 15 | 3.4 | 0.1 | 1.2 | 0.50 ± 0.03 | −0.5 | 0.3 | −0.15 ± 0.02 |
| 16 | 12.5 | 0.8 | 6.6 | 3.32 ± 0.19 | −0.8 | 0 | −0.27 ± 0.02 |
| 17 | 7.4 | −0.1 | 5.4 | 1.83 ± 0.16 | −0.4 | 0.4 | −0.05 ± 0.02 |
| 18 | 11.7 | 0.2 | 5.3 | 2.55 ± 0.17 | −0.3 | 0.3 | −0.08 ± 0.01 |
| 19 | 12.7 | 0.8 | 8.5 | 4.14 ± 0.26 | −1 | 0.1 | −0.24 ± 0.03 |
| 20 | 12.8 | 0.1 | 6.2 | 3.08 ± 0.22 | −0.5 | −0.1 | −0.26 ± 0.01 |
| 21 | 12.9 | −0.2 | 7 | 3.06 ± 0.24 | −0.4 | 0.5 | −0.08 ± 0.03 |
| 22 | 12.9 | −0.3 | 6.3 | 2.83 ± 0.22 | −0.5 | 0.2 | −0.22 ± 0.02 |
| 23 | 12.9 | −0.1 | 7.4 | 3.18 ± 0.25 | −0.4 | 0.3 | −0.09 ± 0.02 |
| 24 | 12.9 | 0 | 6.1 | 2.13 ± 0.18 | −0.6 | 0.1 | −0.24 ± 0.02 |
| 25 | 13 | 0.2 | 6.7 | 2.84 ± 0.22 | −0.8 | −0.1 | −0.51 ± 0.02 |
The absolute maximum temperatures recorded by the automatic weather station (AWS) during the two-week study period were generally below the P95 threshold (
Figure 3). These observations made it possible to ensure that no heatwave had occur at this station, such events implying that maximum temperatures exceed the P95 threshold for at least three consecutive days. However, the derived temperature (AWS + heat-craterdiff) exceeded the P95 threshold, calculated using records from 1940 to 2025, for at least seven consecutive days. These results indicate that the sensor located inside the heat-crater consistently recorded absolute maxima temperatures higher than those outside, with differences ranging between 4 and 6 °C during the study period (
Table 1). The heat crater succeeded then in producing a heatwave.
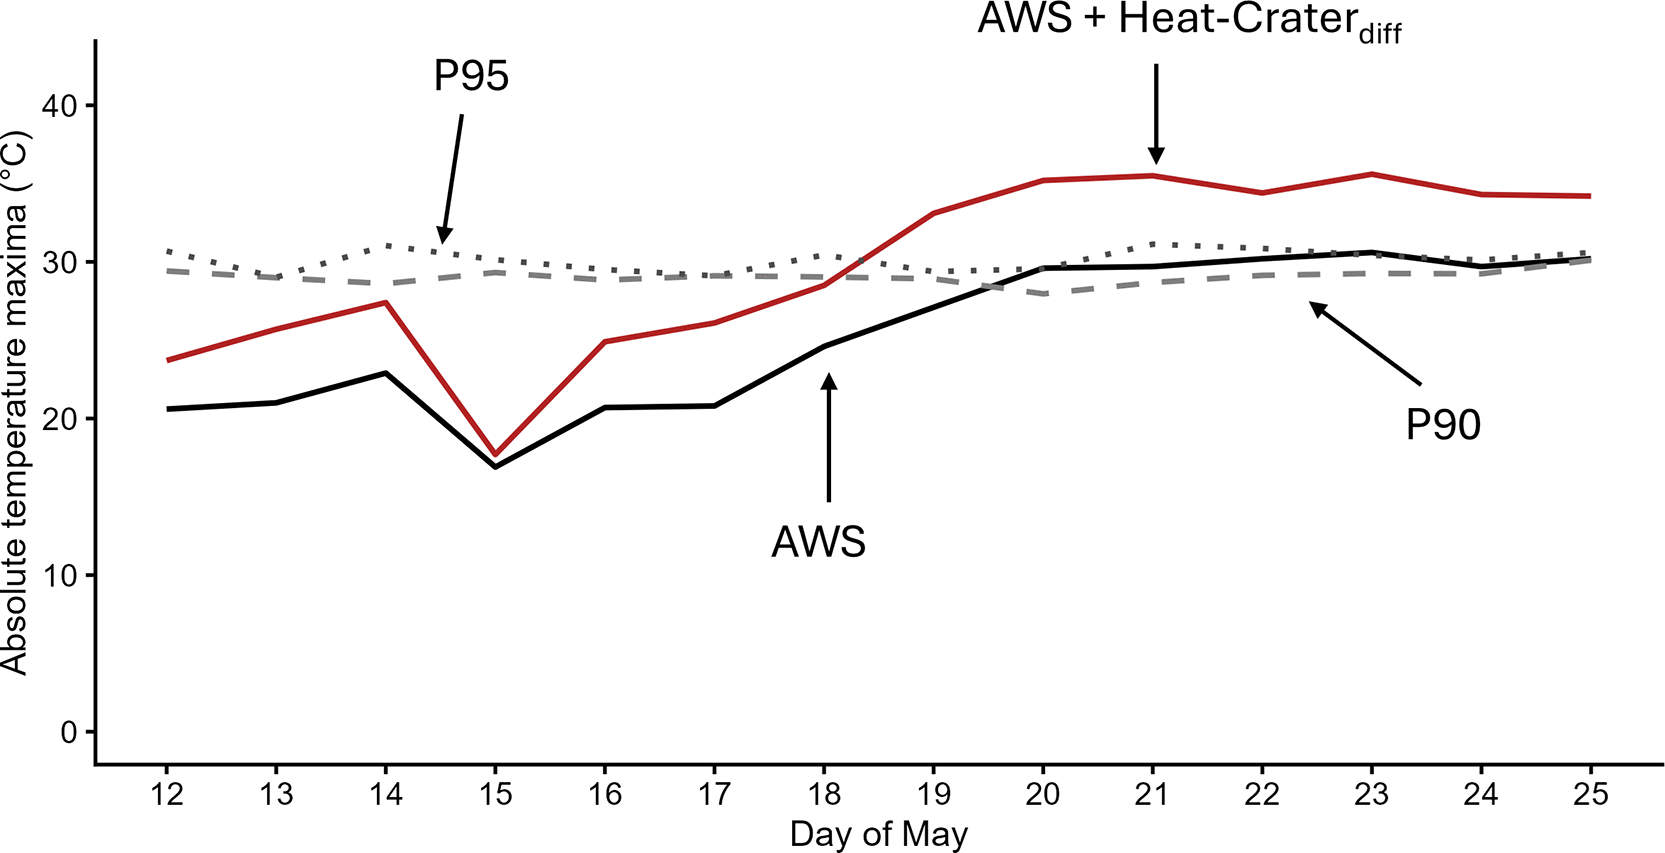
Figure 3. Daily absolute maximum temperature over a two-week period in May 2026 in Albacete (Spain).
Data from an automatic weather station (AWS) are presented, including AWS 2-m air temperature, and an adjusted temperature derived by adding the heat-crater experiment difference. Daily P90 and P95 temperature percentiles are also shown, calculated using records from 1940 to 2025.
Discussion
The proposed structure (heat-crater) successfully induced a local heatwave in May in Albacete (Spain). This was characterised by higher daytime temperatures and vapor pressure deficit, and similar or even lower nighttime temperatures and vapor pressure deficit. On average, the heat-crater induced an increase of 4 °C, which, when extrapolated to the historical register, indicated a heatwave exceeding the P95 threshold for at least seven consecutive days.
Simulating heatwaves is challenging due to the difficulty of mimicking heatwave conditions in field conditions (De Boeck et al., 2010). Heatwaves are usually characterised by high temperatures over several consecutive days, periods of low humidity or high VPD and increased irradiance (Kimball et al., 2008). We designed a structure capable of mimicking these conditions. The heat-crater amplified temperatures by over 6 °C, reaching up to 8.5 °C, and the daily absolute maxima temperatures were always above 4 °C. These temperature amplifications exceed those obtained with other passive structures such as open-top chamber (Milner et al., 2023). The definition of a heatwave varies, particularly regarding whether the daily absolute maximum temperature must exceed a fixed threshold (e.g. +5 °C) or a relative threshold, such as the 95th percentile, over several consecutive days. Both criteria were met by our proposed infrastructure in this study. The +5 °C threshold for daily absolute maximum temperature was consistently exceeded on sunny days, demonstrating the structure’s capacity to induce substantial warming. Nevertheless, exceeding the 95th percentile depended on the absolute daily maximum temperature, as the structure primarily enhanced microclimate conditions rather than generating heatwaves independently. Heat-crater also induced an increase in vapor pressure deficit, a metric of the atmospheric desiccation strength driven by temperature and typical of heatwaves (Grossiord et al., 2020). Another feature of heatwaves is increased solar irradiation (Kimball et al., 2008). Although this parameter was not measured in the present study, we assume that it increased within our proposed infrastructure, given we induced the local heatwave by the increase of radiation at least at long wavelengths. It remains to measure the effect on photosynthetically active radiation. Furthermore, to mimic real heatwave conditions, both higher temperatures and higher VPD must cease at night. Unlike infrared heaters (De Boeck et al., 2010; Kimball et al., 2008), our proposed structure successfully mimics this pattern.
Although the heat-crater successfully reproduces the conditions of real heatwaves, it has some limitations. As a passive structure designed to induce local heatwaves, it requires sufficient solar radiation at midday to increase temperature and VPD. During several cloudy days (e.g. 13, 14 and 17 May), we observed a saw-tooth pattern rather than a plateau during the hours of maximum solar irradiance (
Figure 2). While this does not prevent higher absolute maximum temperatures from being reached—provided the baseline ambient temperature is sufficiently high—it limits the accumulation of latent heat within the structure, which is necessary for achieving higher peak temperatures. This limitation is also significant when the absolute maximum temperature occurs later in the afternoon (e.g. around 6 pm), reducing the structure’s effectiveness. Consequently, while temperature differences (between inside and outside) may reach +8 °C at midday, they can be +4 °C at the time to compare the daily absolute maximum. Nevertheless, this reduced difference is often sufficient to induce heatwave conditions in spring, as demonstrated in our experiment. Another limitation concerns the size of the structure. It was designed to study the effects of heatwaves on low and open herbaceous vegetation and small shrubs, rather than large shrubs or trees. However, future studies could adjust its dimensions to larger experimental patches, provided an appropriate angle is maintained to ensure sufficient solar irradiation. Despite its limitations, the heat-crater may promote further experimental ecological studies in natural habitats. The structure is low-cost (approximately €300) and easy to assemble, dismantle and relocate, making it suitable for deployment across multiple sites. These characteristics may facilitate the use of sufficient independent replicates, which are essential in order to avoid pseudoreplication (Hurlbert, 1984) and issues of spatial autocorrelation (Diniz-Filho et al., 2003).
Next steps to full validate and implement this infrastructure to research community
This manuscript is a pilot case study. The proposed infrastructure represents a novel experimental method designed to induce heatwave conditions under semi-controlled field conditions. Although comprehensive validation has not yet been performed, the structure is expected to provide researchers with a low-cost platform to investigate plant, soil, and ecosystem responses to extreme heat events. Further steps are needed to enhance the robustness of the design and identify potential applications and improvements. We suggest the next steps to complete the validation:
1) To demonstrate the effectiveness of the heat-crater on a temperature gradient, either altitudinal or latitudinal, with spatial replication.
2) To measure plant ecophysiological variables related to heat stress, such maximum efficiency of photosystem II, leaf temperature or stomatal conductance, and measure edaphic variables, such as temperature and humidity.
3) To test on other ecosystems rather than semiarid ones, as this pilot test, such as including high herbaceous communities with high vegetation cover and density. If it is necessary, redesign heat-crater dimensions.
Ethics and consent
Ethical approval and consent were not required.
Data and software availability
Source data
Historical climate records spanning 1940–2025, together with daily meteorological data, were downloaded from the Spanish State Meteorological Agency (AEMET) website (www.aemet.es).
Underlying data and software availability
All novel data collected and used as part of this article is found on https://github.com/andreucera/Heat-crater
. This project contains the following underlying data:
Acknowledgements
We gratefully acknowledge the Botanical Garden of Castilla-La Mancha and its director, Prof. Pablo Ferrandis, for permitting the installation of the heat -rater and facilitating this pilot experiment. We also thank Óscar Ruiz and Julio Morales for their guidance and technical support during the construction of the heat-crater; Roberto Serrano-Notivoli for his advice on meteorological data.
References
- Arnold PA, Brown FM, Brown ZA, et al.:
Effective heating chamber design to simulate acute heatwaves and night-time warming for ecological communities under natural field conditions.
Methods Ecol. Evol.
2025; 16(9): 1935–1947. Publisher Full Text
- Andreu Cera;
andreucera/Heat-crater: Heat-crater v1.0.0 (Version v1.0.0) [Computer software].
Zenodo.
2026. Publisher Full Text
- Boboc L, Dima M, Vaideanu P, et al.:
Trends and variability of heat waves in Europe and the association with large-scale circulation patterns.
Weather and Climate Extremes.
2025; 49: 100794. Publisher Full Text
- Breshears DD, Fontaine JB, Ruthrof KX, et al.:
Underappreciated plant vulnerabilities to heat waves.
New Phytol.
2021; 231(1): 32–39. PubMed Abstract
| Publisher Full Text
- De Boeck HJ, Bassin S, Verlinden M, et al.:
Simulated heat waves affected alpine grassland only in combination with drought.
New Phytol.
2016; 209(2): 531–541. PubMed Abstract
| Publisher Full Text
- De Boeck HJ, Dreesen FE, Janssens IA, et al.:
Climatic characteristics of heat waves and their simulation in plant experiments.
Glob. Chang. Biol.
2010; 16(7): 1992–2000. Publisher Full Text
- Diniz-Filho JAF, Bini LM, Hawkins BA:
Spatial autocorrelation and red herrings in geographical ecology.
Glob. Ecol. Biogeogr.
2003; 12(1): 53–64. Publisher Full Text
- Geange SR, Arnold PA, Catling AA, et al.:
The thermal tolerance of photosynthetic tissues: a global systematic review and agenda for future research.
New Phytol.
2021; 229(5): 2497–2513. PubMed Abstract
| Publisher Full Text
- Grossiord C, Buckley TN, Cernusak LA, et al.:
Plant responses to rising vapor pressure deficit.
New Phytol.
2020; 226(6): 1550–1566. Publisher Full Text
- Hollister RD, Elphinstone C, Henry GHR, et al.:
A review of open top chamber (OTC) performance across the ITEX Network.
Arctic Science.
2023; Vol. 9(2): pp. 331–344. NRC Research Press. Publisher Full Text
- Hurlbert SH:
Pseudoreplication and the Design of Ecological Field Experiments.
Ecol. Monogr.
1984; Vol. 54(2): pp. 187–211. Ecological Society of America. Publisher Full Text
- Intergovernmental Panel on Climate Change (IPCC):
Climate Change 2022 – Impacts, Adaptation and Vulnerability.
Working Group II Contribution to the Sixth Assessment Report of the Intergovernmental Panel on Climate Change.
Cambridge:
Cambridge University Press;
2023. Publisher Full Text
- Jagadish SVK, Way DA, Sharkey TD:
Plant heat stress: Concepts directing future research.
Plant Cell Environ.
2021; 44(7): 1992–2005. PubMed Abstract
| Publisher Full Text
- Kimball BA, Conley MM, Wang S, et al.:
Infrared heater arrays for warming ecosystem field plots.
Glob. Chang. Biol.
2008; 14(2): 309–320. Publisher Full Text
- Milner KV, French K, Krix DW, et al.:
The effects of spring versus summer heat events on two arid zone plant species under field conditions.
Funct. Plant Biol.
2023; Vol. 50(6): pp. 455–469. CSIRO PUBLISHING. Publisher Full Text
- Perkins SE, Alexander LV:
On the Measurement of Heat Waves’.
J. Clim.
2013; Vol. 26(13): pp. 4500–4517. American Meteorological Society. Publisher Full Text
- Perkins-Kirkpatrick SE, Lewis SC:
Increasing trends in regional heatwaves.
Nat. Commun.
2020; Vol. 11(1): p. 3357. Nature Publishing Group. Publisher Full Text
- Rasmussen C, Gallery RE, Fehmi JS:
Passive soil heating using an inexpensive infrared mirror design – a proof of concept.
Soil.
2015; Vol. 1(2): pp. 631–639. Copernicus GmbH. Publisher Full Text
- Serrano-Notivoli R, Lemus-Canovas M, Barrao S, et al.:
Heat and cold waves in mainland Spain: Origins, characteristics, and trends.
Weather and Climate Extremes.
2022; 37: 100471. Publisher Full Text
- Teskey R, Wertin T, Bauweraerts I, et al.:
Responses of tree species to heat waves and extreme heat events.
Plant Cell Environ.
2015; 38(9): 1699–1712. PubMed Abstract
| Publisher Full Text
- Uppal R, Rohan M, Brill R, et al.:
Field-Based Portable Heat Chambers for the Determination of Day-Time Heat Stress in Canola (Brassica napus L.).
J. Agron. Crop Sci.
2025; 211(6): e70119. Publisher Full Text









