Plain language summary
This research analyses patents in order to answer the question: what is the impact of open access to scientific publications on innovation? To answer this question, we measured citations from patents to open access full-texts. Our work describes a useful methodology and approach for others, who investigate the effects of open science on innovation using openly available big data sources.
Introduction
Open Science policies aim at improving the discovery, access and re-use of research not only within the scientific community, but also within broader society. Catalysing innovation is a major goal in this latter regard (ElSabry, 2017). Yet, the extent to which openly available scientific work impacts technological inventions remains largely unknown. Here, we combine publicly available data sources about patents and scholarly publications to explore uptake of Open Access to scientific literature cited in patents. In doing so, we expand existing patent citation analysis methodologies in order to provide evidence about the use of Open Access resources in innovation.
According to the World Intellectual Property Organization (WIPO), “a patent is an exclusive right granted for an invention”1, which, along with technical documentation, must be publicly disclosed as a patent application. To support any claims, patents can refer to other patents (patent-to-patent citations) and, to a lesser extent, to other types of work, termed non-patent literature (NPL) by the WIPO and large patent offices. The majority of NPL citations is to scholarly literature, also referred to as scientific non-patent-references (SNPR), while NPL can also include references to technical documentation or reports (van Raan, 2017).
For more than 40 years, SNPR have been studied as an indicator of science-technology interactions. In their pioneering work, Carpenter et al. (1980) used patent citation analysis to determine the value of basic research to the economic, societal and technological development of a country. Since then, an increasing body of research has drawn on SNPR to study various aspects of the linkage between science and technology (van Raan, 2017). Likewise, evaluative patent citation analysis has become a monitoring tool to support policy-making.2
Here, we apply patent citation analysis to measure the extent to which Open Access resources were mentioned in patents. Only a few studies so far focused particularly on Open Access to SNPR. Drawing on a combination of publicly available big data sources, we explore and analyse levels of Open Access in SNPR. In particular, we extracted typically used identifiers for scholarly publications from Google Patents and matched those with Unpaywall, Europe PMC and arXiv. The compiled data enabled us to analyse Open Access uptake levels by patent subject and inventor’s country, as well as to relate our patent citation analysis to the overall growth of Open Access in scientific publishing.
Background
Characteristics of patent citations to scientific literature
In patenting, both inventors and examiners are legally obliged to support claims made in the patent application through citations (van Raan, 2017). Particularly, US patent law requires that the patent examiner carefully selects references (Tijssen, 2001). Also, the European Patent Convention demands that examiners consult a variety of scientific literature and include documents, which are considered as most relevant (Verbandt & Vadot, 2018). However, evidence suggests that most citations are made by the inventors themselves (Ahmadpoor & Jones, 2017).
SNPR should not be interpreted in every case as constituting the key sources of an invention, but rather as indicative for a spectrum of science-technology interactions, ranging from signalling the “awareness of scientific results” to considerable direct contributions to the innovation (Tijssen, 2001). Drawing on patents from the field of nano-scale technologies, Meyer (2000) found that SNPR mainly represent the more general background of an invention, rather than a direct link. Interviewing inventors, Callaert et al. (2014) confirmed that SNPR rarely acted as a source of inspiration for technological invention.
Research has revealed important trends in patent citation practices. First of all, several studies observed a highly-skewed distribution of NPL, with a large proportion of patents lacking any references at all (van Raan, 2017). Callaert et al. (2006) estimated that 55% United States Patent and Trademark Office (USPTO) and 64% European Patent Office (EPO) of NPL are SNPR published in journals. There is, however, conflicting evidence concerning coverage across journals. While Guerrero-Bote et al. (2021) estimated that within five years, patent citations cover one third of Scopus-indexed journals, van Raan’s (2017) comprehensive review found that SNPR appeared only in a small group of journals. In another work on “sleeping beauties”, publications whose impact (in terms of citations) is not immediate but grows over time, van Raan & Winnink (2018), van Raan & Winnink (2019) noticed a considerable time-lag between an SNPR’ publication date and the patent application, although the lag has shortened over the years due to inventor-author self-citations. Scientific articles, which made a novel contribution to a field, are significantly more likely cited in patents (Veugelers & Wang, 2019).
There are also studies investigating the link between the country affiliation of an invention and the cited SNPR. Narin et al. (1997) found that US-based inventors cited a large proportion of scientific articles that were authored in their own country at prestigious universities and laboratories and were funded by the important research funders National Science Foundation (NSF) and National Institutes of Health (NIH). In a recent large-scale study of biomedicine patents, Ke (2020) confirmed the dominance of scientific articles linked to research funded by the US government and the NIH in particular. Investigating the situation in the Netherlands, Tijssen (2001) observed an increasing proportion of Dutch-invented patents that cite domestic research, particularly driven by author-inventor self-citations and patents from large multinational firms from the technology sector like Philips. Cross-country comparisons need to take national citation practices into account in the interpretations of their findings, which are governed by the respective patenting law as well as the availability of literature (Callaert et al., 2006).
As in scholarly communication, patent citation analysis revealed field-specific differences. Investigating life science and biomedicine patents, Ke (2020) reports large variations among the different technology sectors in terms of SNPR coverage. In particular, biotechnology and drug patents had an above-average SNPR uptake and growth rate. Similarly, Hötte et al. (2021) observed an increase of SNPR among patents targeting low-carbon energy technologies. Because of the evidence of varying SNPR uptake rates among patents, the number of SNPR is a widely considered indicator to measure the “science intensity” of a field of innovation (van Vianen et al., 1990).
Open Access to scientific non-patent references (SNPR)
While an increasing body of research focuses on Open Access to scientific research articles (Pinfield, 2015; Piwowar et al., 2018), only a few studies have thus far examined the specific impact of Open Access on innovation using SNPR, indicating the importance of our present study. Bryan and Ozcan (2020) investigated a sample of 43 medical and biotechnology journals published between 2005 and 2012. Similar to the effect on public sector research (Staudt, 2020), they found a modest increase in citations to NIH-funded research after the introduction of the NIH Open Access policy, while citation rates to non-funded research stagnated. Focusing on small biotechnology companies, Bryan and Ozcan (2020) found that these companies likely benefit most from Open Access, because they require access to robust and specific scientific knowledge, but are too small for costly subscriptions. The positive impact of Open Access publications on innovation seems to be particularly strong amongst small- and medium-sized enterprises without collaborators at universities or other public research institutions who usually have access to subscription journals (ElSabry & Sumikura, 2020).
Evidence-base associated with patents and scientific non-patent references (SNPR)
A recurring theme in the quantitative study of patent citations is the difficulty of identifying NPL generally and SNPR in particular. NPL are provided as text strings, making it difficult to analyse them (van Raan, 2017). In recent years, the application of big data analytic tools for patent citation analysis can be observed. For instance, Knaus and Palzenberger (2018) applied a Solr full text search procedure on the EPO worldwide bibliographic data (DOCDB), the EPO core reference raw data product. They were confident that they successfully matched more than six million unique NPL to journal articles indexed in the Web of Science. Using a similar approach, Jefferson et al. (2018) were able to resolve 14.1 million SNPR from the DOCDB. Instead of using the proprietary Web of Science, they queried openly available scholarly datasets from Crossref and Pubmed / PubMed Central. The findings are made publicly available through the discovery service lens.org, which allows searching for inventions that referenced scholarship.
Methods
We collected data relating to Open Science practices in innovation with a particular focus on Open Access by drawing on publicly available data sources. The workflow involved a number of steps specific to the patent database and scholarly data sources that can be summarised as follows (see Table 1).
Table 1. presents results for each workflow step and data source.
| | Google Patents
retrieved | Number of IDs extracted
and matched | Works published
between
2008–2020 |
|---|
| Source | ID type | In-text
citations | Patent
families | Unique IDs | Patent families | Unique IDs | Patent
families |
|---|
| Unpaywall | DOI | 594,094 | 240,010 | 415,148 | 230,108 | 204,847 | 137,498 |
| arXiv | arXiv ID | 25,571 | 14,983 | 8,469 | 8,317 | 8,317 | 9,523 |
| Europe PMC | PMID/PMCID | 11,134 | 4,122 | 7,284 | 3,974 | 2,801 | 1,862 |
|
Total
| |
-
|
-
|
-
|
-
|
215,962
|
146,382
|
Google Patents
First, we identified patents with NPL through the Google Patents data snapshot accessible on Google Big Query, last modified on 13th May 2021. We restricted our search to patent families, defined as “a collection of patent applications covering the same or similar technical content”, that were published between 2010 and 2020. Although other search engines exist that link patents to NPL and SNPL lens.org, we used Google Patents because of its analytical interface provided by Google Big Query, a high-performant cloud-based database for big data analytics. The database interface allows querying NPL in-text citations with SQL. This enabled us to query the Google patent corpus with regular expressions indicating typically used identifiers to refer to scholarly publications without setting up our own computing environment to analyse large amounts of bulk patent data. Then, we parsed the obtained identifiers with regular expressions from the unstructured text strings and collated them into a new dataset using the following scholarly data sources.
Scholarly data sources
As the first type of identifier, we searched NPL for Digital Object Identifiers (DOI). Then, we used Unpaywall to determine SNPR including their Open Access status. This Open Access discovery service checks for links to openly available full texts for all DOIs registered by Crossref (Piwowar et al., 2018). To prepare the match with Unpaywall using DOIs, we extracted syntactically valid DOI patterns using the R package biblids (Held, 2021). Then, we obtained metadata from Unpaywall using the parsed DOIs. We used the publicly available Unpaywall dump from July 2021, restricting ourselves to publications published after 2008. To allow for efficient data manipulation and retrieval, we imported the Unpaywall dump to Google Big Query.
Not all scholarly literature is referenced by DOIs, but researchers make use of other types of unique identifiers. In biomedicine and the life sciences, the use of PubMed identifiers is a common practice to provide references to scientific articles. PubMed is a widely used and comprehensive literature database of research articles in these fields. Following previous SNPR reference matching approaches that complement DOIs with PubMed identifiers (Jefferson et al., 2018), we queried Google Patents Big Query interface for the standard identifiers PubMed-ID (PMID) and PubMed Central reference number (PMCID). While the former represents metadata about a scholarly publication in PubMed, the latter provides linkage to PubMed Central, a free full text archive of PubMed-indexed literature. Again, we started by querying the NPL in-text citations for patterns indicating PMIDs and PMCIDs. Next, we extracted candidate IDs using regular expressions. The matching to PubMed / PubMed Central was carried out by retrieving metadata from Europe PMC, which is a PubMed mirror and allows searching PubMed metadata and the PubMed Central repository simultaneously (Ferguson et al., 2021). During this automated matching, we used the R package europepmc (Jahn, 2021) that interfaces the Europe PMC REST API. Data matching with Europe PMC was carried out on 31st August 2021.
We also mined arXiv identifiers. arXiv, launched in 1991, is an Open Access repository for scholarly articles in the fields of physics, mathematics, computer science, quantitative biology, quantitative finance, statistics, electrical engineering and systems science, and economics. Similar to the situation in biomedicine and the life sciences, citing an arXiv document through a unique identifier is recommended. The canonical form of arXiv ID is a sequence of alphanumeric code starting with “arxiv”. After retrieving relevant text strings from Google Patents Big Query corpus using patterns resembling arXiv IDs, we extracted the IDs and validated them against the arXiv metadata API. Here, we used the R package arXiv (Ram & Broman, 2021).
Open Access evidence
Drawing on the compiled data allowed us not only to investigate the prevalence of Open Access resources in our sample, but also the type of Open Access provision. Here, we drew on Unpaywall’s classification of the Open Access host, which distinguishes between publisher and repository-provided Open Access. Because versions of the Open Access full text can be provided by publishers and repositories at the same time, we distinguished between Open Access full texts provided only by publishers (“Publisher only”) or repositories (“Repositories only”), or both (“Publisher & Repositories”). We extended this classification to SNPR linked to Europe PMC. PMC largely consists of full texts, which were made freely available in collaboration with publishers (Ferguson et al., 2021). Therefore, we coded Open Access full texts in PMC as (“Publisher & Repositories”). SNPR indexed in the arxiv were coded as (“Repositories only”), although a considerable number of journals in subjects covered by the arxiv have become Open Access as well (Gentil-Beccot et al., 2009). However, the data did not allow us to determine this overlap sufficiently.
Results
This section first presents the results of our large-scale analysis with a view on patent families published between 2010 and 2020 with reference to non-patent literature (NPL) by year, inventor countries and patent subject. Then, we present a more detailed analysis of our compiled data about scientific non-patent references (SNPR), that we obtained by parsing unique identifiers from in-text patent citations, which could be mapped to scholarly work published between 2008–2020. The focus of the SNPR analysis is on the Open Access uptake by year and type of provision relative to the country of affiliation of the inventor and patent subjects.
Coverage of non-patent literature (NPL)
Overview. Between 2010 and 2020, Google Patents comprised 22,186,393 published patent families. Of these, 7,681,566 had at least one citation to NPL, representing a share of 36%. In total, we found 24,752,870 unique NPL text strings in the investigated period. On average, 8.23 NPL text strings were cited per patent family with NPL. The median number of NPL citations was 2, the maximum number of NPL citations was 10,645.
Figure 1 presents the yearly distribution of the number of issued patents by year of publication, suggesting a steady growth of patent families, although its number has seemingly decreased since 2018, which can be explained, however, by an indexing lag in Google Patents. Figure 1 also shows a proportional decrease of NPL. This lag between the publication date of patents and the inclusion of NPL is not surprising, because scholarly work supporting patents can be provided after the publication of a patent (Guerrero-Bote et al., 2021).
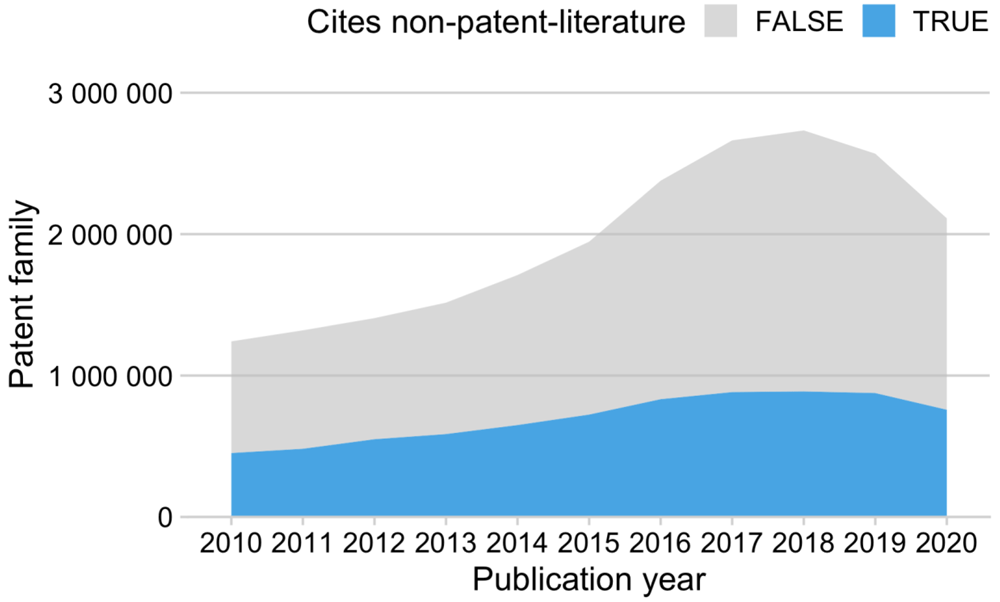
Figure 1. Patent families with reference to at least one non-patent literature (NPL) between 2010 and 2020.
The blue area shows the absolute number of patent families with at least one NPL, the grey area illustrates the overall number of patent families.
NPL coverage by subject
Table 2 provides a breakdown by the nine main sections of the Cooperative Patent Classification (CPC), an extension of the International Patent Classification (IPC), jointly curated by the European Patent Office (EPO) and the US Patent and Trademark Office (UPTO). Between 2010 and 2020, the CPC sections “G - Physics” and “H - Electricity” recorded the most patent families as well as NPL citations, while the NPL percentage among these fields was close to the overall NPL uptake. Patent families classified in the CPC sections “C - Chemistry; metallurgy” and “A - Human necessities” had the highest NPL percentage. Interestingly, the NPL percentage varies considerably among the CPC sections, ranging from 20.67% in the main section “E - Fixed constructions” to 52.20% in “C - Chemistry”.
Table 2. Overview patent families with NPL 2010 -2020 by the Cooperative Patent Classification (CPC). Note that a patent family can belong to more than one CPC section. Here, we present full counts.
| CPC section | Patent families | with NPL | in% |
|---|
| A - Human necessities | 2,553,254 | 1,084,538 | 42.48 |
| B - Performing operations; transporting | 3,251,311 | 831,292 | 25.57 |
| C - Chemistry; metallurgy | 2,306,879 | 1,204,100 | 52.20 |
| D - Textiles; paper | 221,382 | 64,915 | 29.32 |
| E - Fixed constructions | 657,813 | 135,954 | 20.67 |
F - Mechanical engineering; lighting;
heating; weapons;
blasting engines or pumps | 1,631,687 | 346,164 | 21.22 |
| G - Physics | 4,410,801 | 1,744,117 | 39.54 |
| H - Electricity | 4,265,802 | 1,463,138 | 34.30 |
| Y - General | 2,295,435 | 807,348 | 35.17 |
Figure 2 presents the distribution of NPL per CPC main sections, highlighting the median and the range between the 10th and 90th percentile. The median number of NPL was either two or three, indicating a long-tail distribution of NPL citations. Figure 2 also suggests that considerable variations exist relative to the observed number of NPL. Values from the 90th percentile range from 8 NPL citations per patent family in the CPC sections “D - Textiles; paper”, “E - Fixed constructions”, and “F - Mechanical engineering; lighting; heating; weapons; blasting engines or pumps” to 32 in “A - Human necessities”.
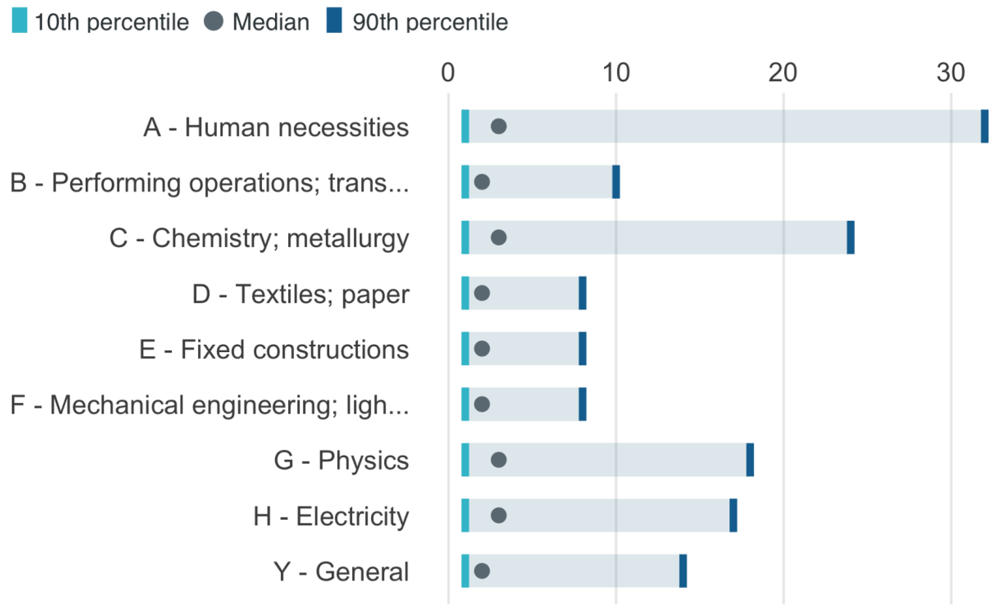
Figure 2. Distribution of the number of NPL strings per patent family by Cooperative Patent Classification (CPC) main section, visualised as a diminutive distribution chart, highlighting the range between 10th and 90th percentile, as well as the median for each CPC main section.
Note that patent families without NPL were excluded.
NPL coverage by inventor countries
Table 3 presents a breakdown of patents with citations to NPL by inventor countries. Note that for most patent families, no geographic information was provided. Google Patents covers most patents from inventors from the US, followed by the Asian countries South Korea and Japan. Germany ranks fourth as the first European country with 711,766 patent families invented. Like in the distribution among CPC sections, we observe large NPL share variations, ranging from 11% (South Korea) to 51% (United States).
Table 3. Overview patent families with NPL 2010 -2020 by the countries of the inventors, ranked by the number of patent families per country. Note that a patent family can have inventors from different countries.
Here, we present full counts.
| Country | Patent families | with NPL | in% |
|---|
| No Info | 13,415,994 | 2,185,384 | 16.29 |
| United States | 1,944,038 | 994,604 | 51.16 |
| South Korea | 1,473,120 | 163,924 | 11.13 |
| Japan | 887,836 | 425,645 | 47.94 |
| Germany | 711,766 | 231,838 | 32.57 |
| Taiwan | 347,836 | 45,878 | 13.19 |
| France | 244,127 | 100,455 | 41.15 |
| Russia | 235,076 | 81,241 | 34.56 |
| China | 220,861 | 96,735 | 43.80 |
| United Kingdom | 147,642 | 64,763 | 43.86 |
| Other | 1,184,180 | 439,146 | 37.08 |
In the following, Figure 3 presents the distribution of the number of NPL text strings per patent family by inventor’s country for the top nine countries, highlighting the range between the 10th and 90th percentile. Note that we excluded patent families without NPL. Patent families representing inventions from the United States show the largest variations. On average, as represented by the median NPL number per patent family, a patent family from the United States cited five NPL, while the median NPL number for patent families from South Korea, Japan, and Germany is two.
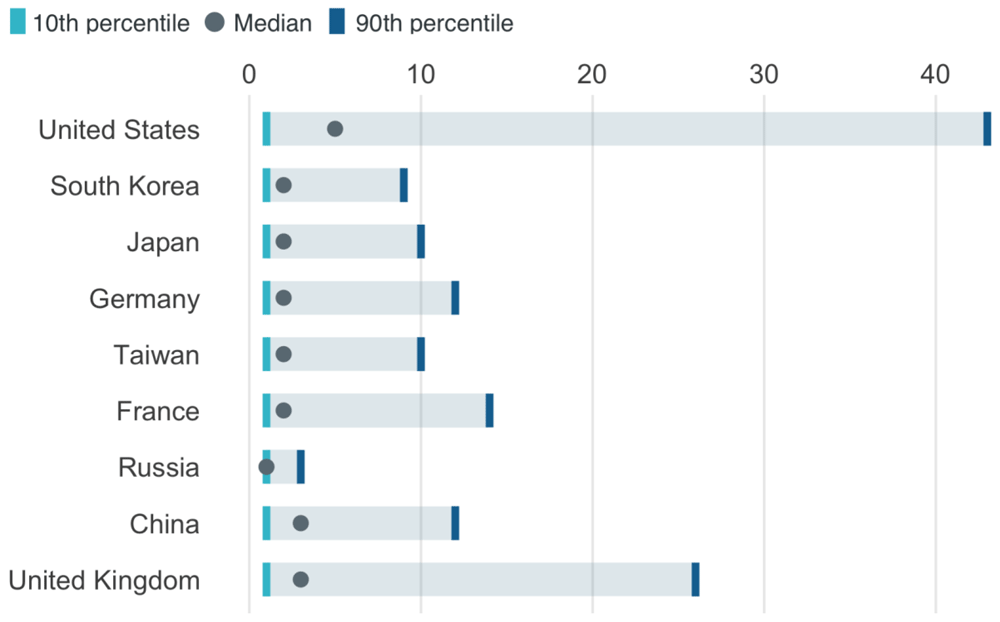
Figure 3. Distribution of the number of NPL strings per patent family by the countries of the inventors, visualised as a diminutive distribution chart, highlighting the range between 10th and 90th percentile, as well as the median for the top nine countries in terms of published patent families.
Note that patent families without NPL were excluded.
Open access to scientific non-patent references (SNPR)
Mapping unique identifiers parsed from NPL text strings and resolving them against Unpaywall, Europe PMC and arXiv offers insight into the extent to which SNPR are Open Access. First, we explore the share of Open Access. Then, we provide an overview about the Open Access venues. Overall, we were able to extract 215,962 scholarly data identifiers, constituting the sample for our Open Access analysis. 96,228 SNPR had an Open Access full text, representing an Open Access availability rate of 45%.
Figure 4 illustrates the number of SNPR in our sample by Open Access availability over the years. It reveals that the majority of scholarly publications in our sample were published before 2015. As expected, Figure 4 suggests an increasing share of Open Access for more recent publications. Open Access uptake rates grew from 35% in 2008 to 82% in 2020. Note that the total number of SNPR in our sample decreased over time. In conjunction with the small number of normalised SNPR relative to the overall number of NPL text strings in our sample, these data artefacts necessitate a careful interpretation of our results.
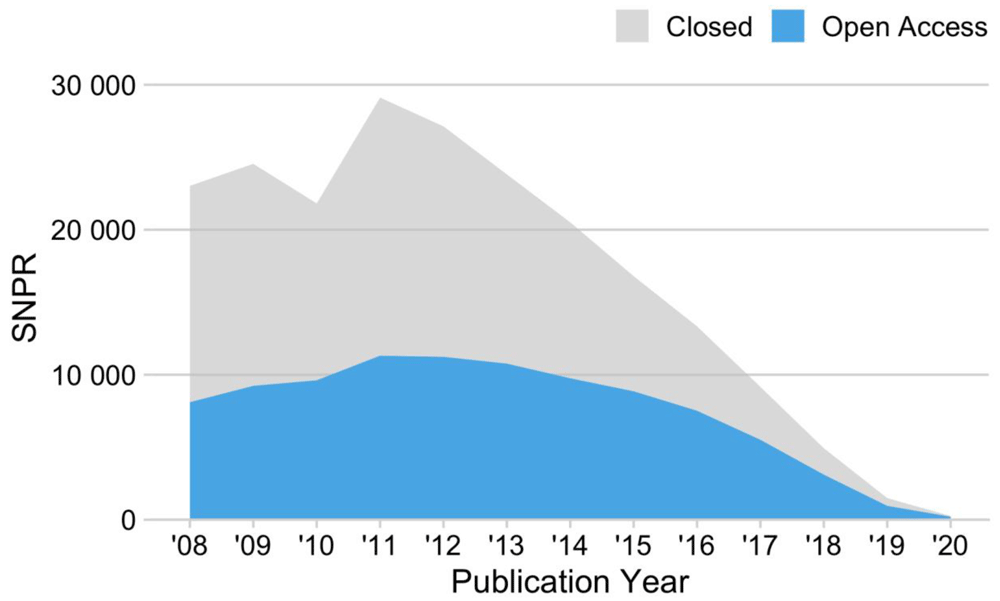
Figure 4. Development of the number of scientific non-patent references (SNPR) by Open Access status and year.
In terms of publication types, most scholarly works in the sample were journal articles (n = 175,361, 81%), followed by conference proceedings articles (n = 28,977, 13%) and preprints (n = 8,489, 4%) (see Table 4). The table also illustrates large variations relative to the Open Access share by publication type. All preprints were openly available, followed by journal articles and proceedings articles.3
Table 4. Open access to text-mined NPL by publication types, 2008 – 2020.
| All | Open Access |
|---|
| Publication type | NPL | in% | NPL | in% |
| journal article | 175,361 | 81.20 | 81,759 | 46.62 |
| proceedings article | 28,977 | 13.42 | 4,927 | 17.00 |
| preprints | 8,489 | 3.93 | 8,489 | 100.00 |
| Other | 3,135 | 1.45 | 1,053 | 33.59 |
Interestingly, SNPR not only included preprints from arxiv.org (n = 8,317), but also from other subject-specific preprint archives, in particular from bioRxiv (n = 154), which targets research in biology and the life sciences.4 Launched in 2013, bioRxiv recently gained popularity as a platform to rapidly communicate life science research related to the COVID-19 pandemic. This trend can be also observed in our data: thirty-three recently published bioRxiv preprints, which were cited in patents, are related to COVID-19 research.
Figure 5 presents the yearly Open Access uptake in SNPR in comparison to the overall Open Access distribution in Unpaywall, restricting the analysis to journal articles, the most prevalent publication type in Unpaywall (n = 41,207,091, 70%), and in our SNPR sample (n =175,361, 81%). Figure 5 reveals that the SNPR Open Access share is larger than the overall average across journals. However, the yearly distribution follows the general trend of an increasing proportion of journal articles becoming openly available. The peak in 2020 in the SNPR Open Access percentage might be due to a data artefact; only a small number of articles from the year 2020 were cited in patents.
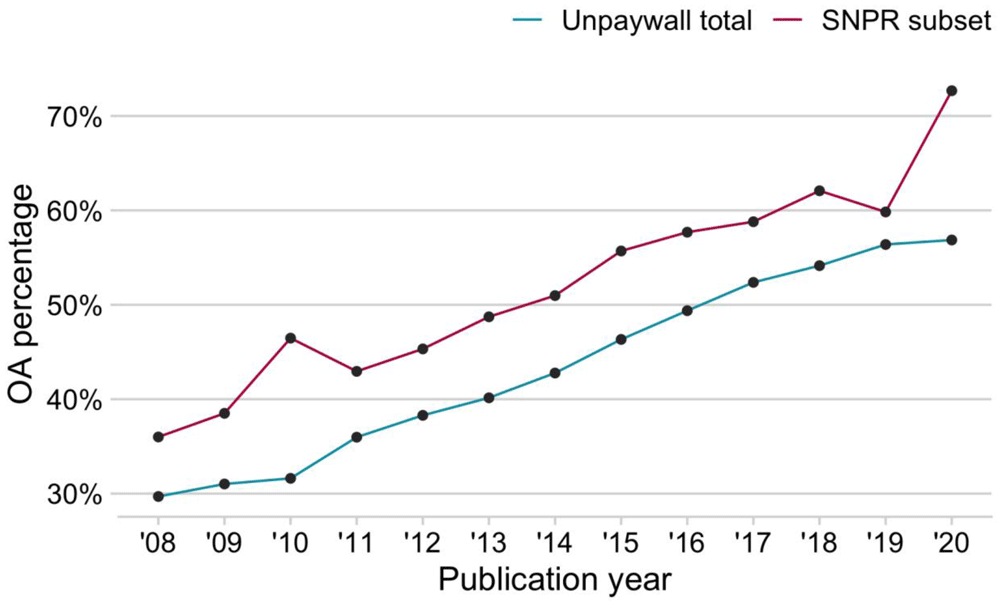
Figure 5. Yearly development of openly available non-patent literature (NPL) in comparison to the total.
Data source: Unpaywall dump from July 2021. Note that only journal articles were investigated.
Citation windows. Previous studies reported a considerable time-lag until SNPR were cited in patents, which needs to be considered when investigating the Open Access uptake in patents. Figure 6 shows the yearly differences between the SNPR and patent families’ publication year. The median lag between the SNPR publication and that of the patent is five years. It must be noted, however, that only SNPR citations from 2008 onwards were included, presumably underestimating the overall lag. A few patent families refer to SNPR published after the patent, highlighting that SNPR can be also provided after the publication of a patent.
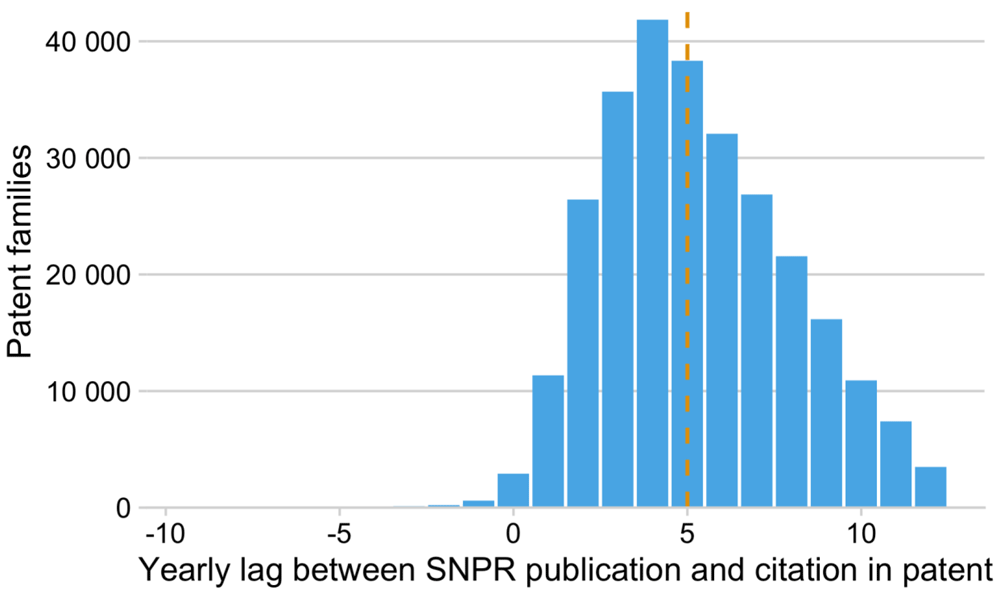
Figure 6. Time lag between the year of publication of scientific non-patent references (SNPR) and the patent citation.
The dashed yellow line shows the median difference of five years, highlighting that 50% of the SNPR were cited within five years after initial publication. Note that we only considered SNPR published between 2008 and 2020.
Figure 7 presents the yearly differences between publication dates by scholarly data sources. SNPR to scholarly work provided by arXiv show a lesser yearly delay than publications with DOI or PMID/PMCID. Interestingly, Europe PMC accounts for a considerable number of articles that were published and thus cited after the patent publication in contrast to the general trend.
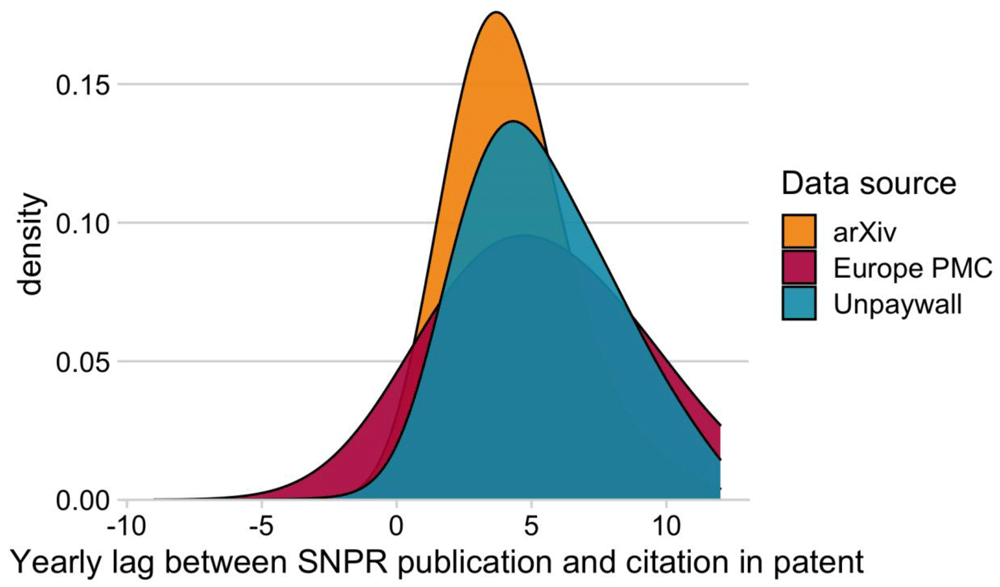
Figure 7. Density estimates of the time lag between the year of publication of scientific non-patent references (SNPR) and patent citation of the scholarly data source.
Note that we only considered SNPR published between 2008 and 2020.
SNPR Open Access share by main subject
Figure 8 presents the SNPR Open Access percentage by CPC main section in comparison to the overall share. While patent families belonging to the CPC main sections “A - Human necessities” (56%), “C - Chemistry; metallurgy” (52%) and “G - Physics” (49%) were above average. ”D - Textiles; paper” (25%) and “E - Fixed constructions” (25%) had a considerably lower Open Access share. Likewise, patent families belonging to these CPC main sections were represented to a lesser extent in our NPL data in terms of the total number of identified NPL, presumably because of the overall low NPL coverage in these fields (see Table 2).
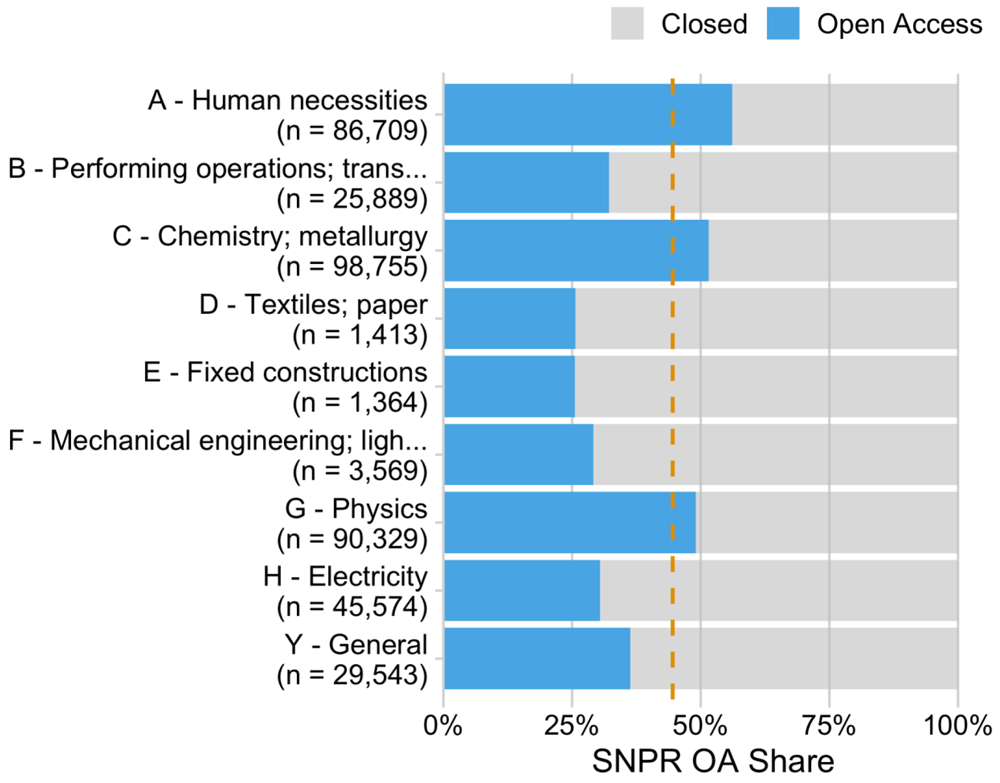
Figure 8. Open access to scientific non-patent references (SNPR) by Cooperative Patent Classification (CPC) main sections published between 2008 and 2020.
Labels show the total NPL in our sample, while blue bars present the Open Access percentage per CPC main section. The dashed yellow line shows the overall Open Access percentage.
SNPR Open Access share by the country of the inventor
Furthermore, our compiled data provides insights into the Open Access shares by the inventor countries. Figure 9 illustrates the Open Access percentage for the top nine countries in terms of patent families published (see Table 3). Patents invented in the United States (55%) and United Kingdom (54%) had an above-average share of openly available SNPR. Germany (43%) showed a larger Open Access uptake than Japan (39%) and France (38%).
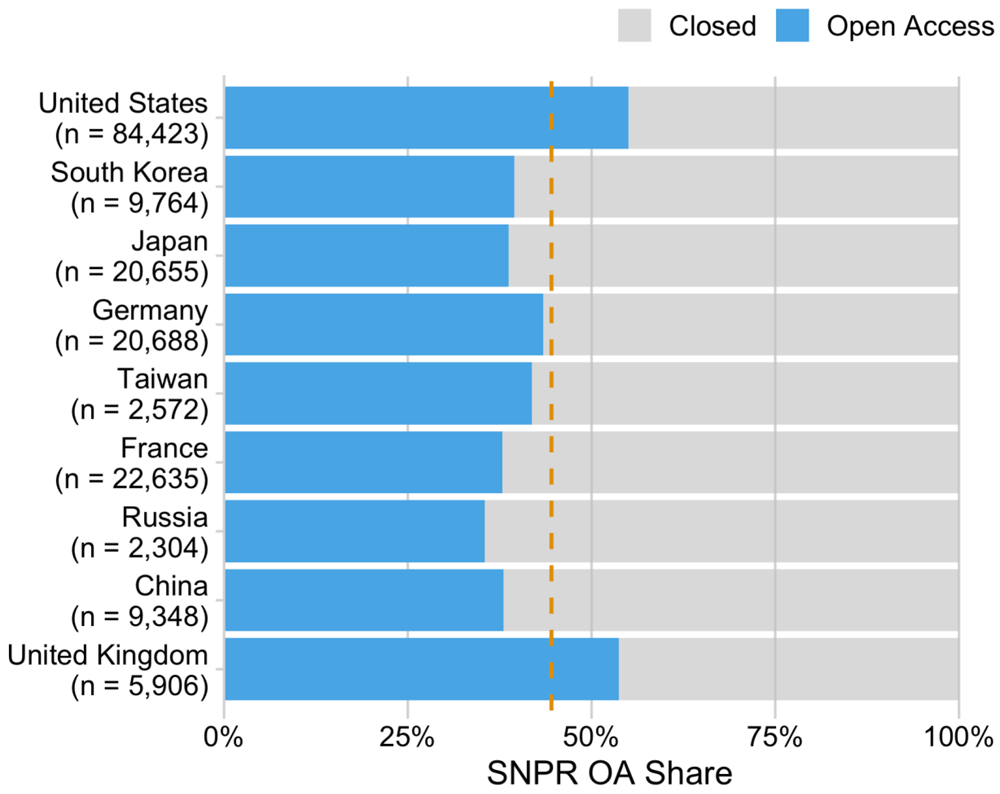
Figure 9. Open access to scientific non-patent references (SNPR) by the countries of the inventors, ranked by the total number of patent families per country between 2010 and 2020.
Labels show the total number of NPL in our sample, while blue bars present the Open Access percentage per country. The dashed yellow line shows the overall Open Access percentage. SNPR were published between 2008 and 2020.
Open Access by provider. Overall, most Open Access SNPR in our sample were provided by both a publisher and a repository (n = 43,475, 45%). 39% of Open Access SNPR were only available through repositories (n = 37,511) and 16% through publisher websites only (n = 15,242). Figure 10 presents the yearly distribution of Open Access host types relative to the total number of Open Access articles in our sample, highlighting the value of the repository infrastructure in patenting over time.
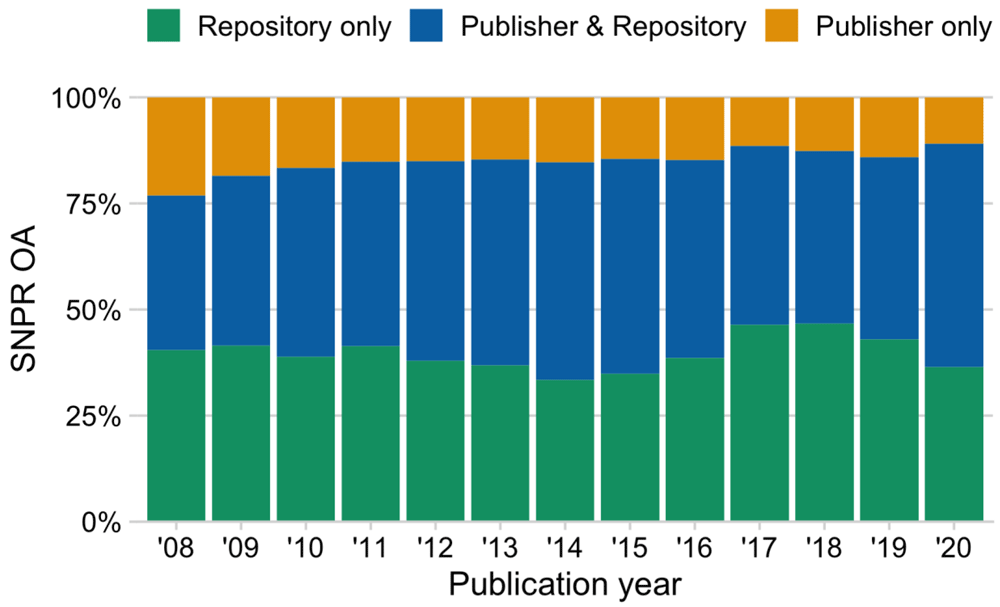
Figure 10. Relative development of openly available scientific non-patent references (SNPR) by years and the Open Access host.
Figure 11 provides a breakdown by CPC main section. It illustrates that the majority of Open Access SNPR was hosted by repositories across all CPC main sections, either solely or in combination with an Open Access journal publication. Interestingly, CPC section with a relatively large proportion of full texts, which were only made openly accessible through repositories, were “H - Electricity” (n = 8,148, p = 59%), “B - Performing operations; transporting” (n = 3,912, 47%) and “G - Physics” (n = 20,593, 46%).
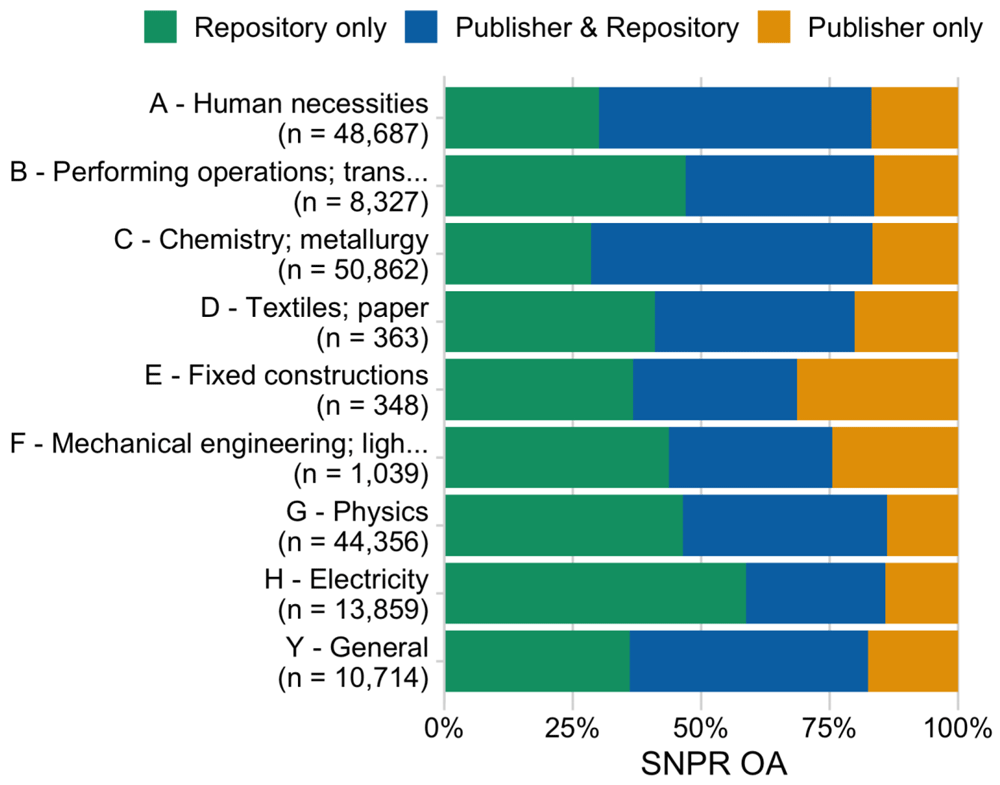
Figure 11. Open Access to scientific non-patent references (SNPR OA) by Cooperative Patent Classification (CPC) main sections and host type.
Labels show the total number of Open Access SNPR in our sample, while coloured bars present the breakdown by Open Access host per CPC main section.
Figure 12 presents a breakdown by country of the patent inventors. Again, no considerable variations relative to the overall trend could be observed, although the proportion of Open Access SNPR only hosted by a repository is somewhat lower among patent families from Russia.
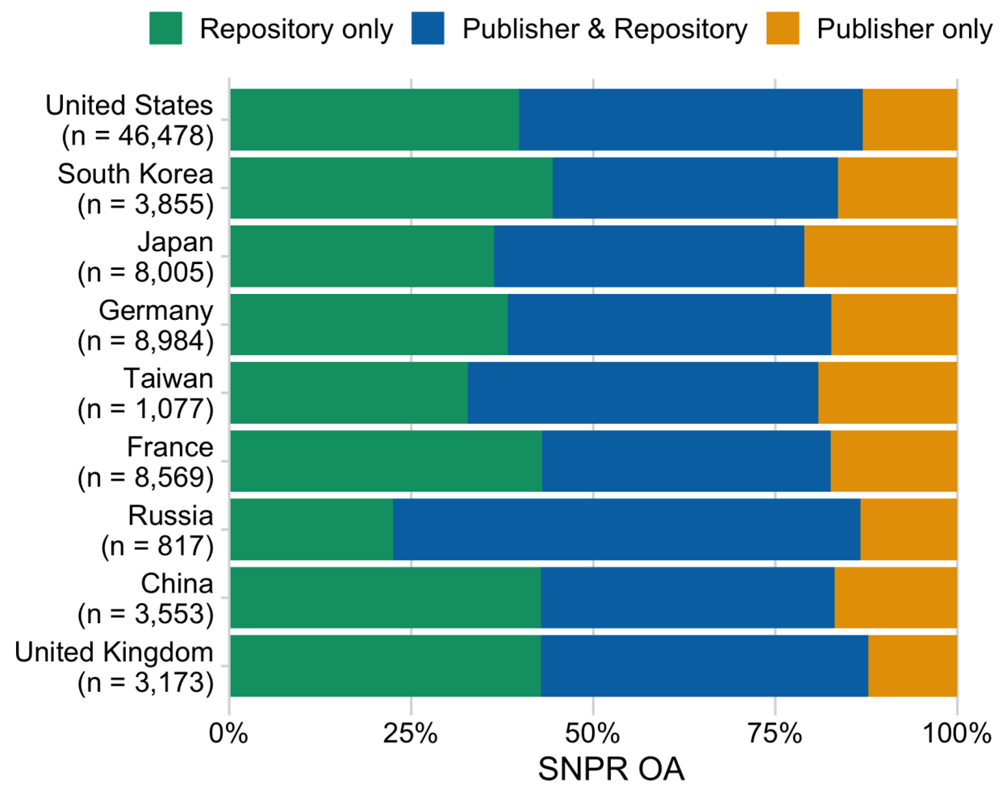
Figure 12. Open Access to scientific non-patent references (SNPR OA) by the countries of the inventors, ranked by the number of patent families per country, and host type.
Labels show the total number of Open Access SNPR in our sample, while coloured bars present the breakdown by Open Access host per country.
Discussion
Using openly available big data sources, this paper has presented a large-scale view of the state of citation practices within patents to non-patent literature (NPL), and especially use of Open Access resources among scientific non-patent references (SNPR). Overall, we found that around one third of patent families were supported by at least one NPL, although the number of references per patent family can vary considerably across subjects and inventor countries, which is in accordance with previous research (Jefferson et al., 2018).
To obtain the SNPR Open Access status, we parsed unique identifiers representing scientific work from the Google Patents corpus and matched them with the scholarly data sources Unpaywall, Europe PMC and arXix. In doing so, we were able to compile a data sample comprising 215,962 SNPR, which were cited by 146,382 patent families. Overall, we found that nearly half of all identifiable SNPR in our sample are openly available.
Over the years, the Open Access rate for SNPR representing journal articles was above that of Unpaywall, a major OA discovery service, indicating that openly available scientific articles are more likely cited in patents. In line with previous research, we found considerable disciplinary and country-specific variations (Huang et al., 2020; Robinson-Garcia et al., 2020; Severin et al., 2020). Concerning differences between countries, it is interesting to speculate here about the extent to which these differences are due to differences in levels of access to scientific literature for the innovators themselves, or whether they might also reflect the extent to which examiners from patent offices adding references themselves can access the evidence. Unfortunately, our data does not allow us to draw any conclusions on this point, but we flag it here as a possible route for future research.
Concerning disciplinary differences, it is interesting to note that patents belonging to the CPC section “A - human necessities” stand out. These patents show not only a stronger link to research in terms of the penetration of SNPR, but also to research that is openly available. This is in line with previous research. Piwowar found the highest Open Access rate among scientific articles published in biomedicine journals (Piwowar et al., 2018).
Only a few studies have attempted to measure the impact of Open Access on innovation through examining patents citing NPL. Drawing on a sample of 43 prestigious life science journals that published 132,872 research articles between 2005 and 2012 and U.S. patent applications since 2005, Bryan and Ozcan (2020) found a slight positive effect of the Open Access mandate of the NIH to the citation of SNPR. NIH-funded research was cited much more often after the introduction of the NIH research, ranging between 12% and 27%. Similarly, ElSabry and Sumikura (2020) observed an increasing uptake of articles from Open Access journals in patents from American pharmaceutical companies. In line with our findings, they observed considerable variations by subject.
Although a majority of bibliometric studies suggest that Open Access articles are cited more often than closed-access articles (Langham-Putrow et al., 2021), potential biases need to be considered, both relative to scholarly communication in general and to patent citation in particular. Our observed above-average Open Access share could be explained by the selection bias according to which authors tend to make their work openly available, where they expect most impact in terms of citations (Eysenbach, 2006). As our literature review has shown, previous research found a substantial body of author-inventor self-citations across SNPR. Inventors tend not only to cite their own work, but also scientific articles from their country. Moreover, inventors tend to cite background work to demonstrate knowledge, while research directly linked to the invention is cited to a lesser extent. Furthermore, previous research highlights a considerable link between the country affiliation of an invention and the cited SNPR. National policies and Open Access funder mandates have strongly influenced how this publishing model is implemented, resulting in varying country-specific uptake rates. We found particularly strong uptake rates among inventions from the US and UK. Particularly British universities had the largest share of OA publications, but also the US ranked above the global average (Robinson-Garcia et al., 2020).
In contrast to previous research, our study is not limited to journal articles, but also takes other types of scholarly work into account. This hence presents a key contribution of this study. We were able to confirm the use of preprints in the information seeking behaviour in patenting. Not only preprints from the well-established arXiv were cited, but also preprints from bioRxiv, which, together with the sister repository medRxiv, has gained prominence since COVID-19 for accelerated communication of scientific results (Fraser et al., 2021). Contrasting the lag between preprint publication and citation in a patent furthermore suggests that preprints are cited timelier in patents than other types of scholarly work. However, previous research highlighted the large proportion of delayed Open Access. Indeed, a considerable proportion of Open Access articles indexed in Unpaywall was made available after an embargo period (Piwowar et al., 2019).
We also considered different ways of providing Open Access, whereas ElSabry and Sumikura (2020) focused on Open Access Journals only and Bryan and Ozcan (2020) on the discipline-specific repository PubMed Central. Our findings show that Open Access provided by repositories is most common, although many Open Access SNPR were provided by both repositories and journals. For instance, Larivière & Sugimoto (2018) showed that most funded research results were simultaneously shared. This implies that inventors and patent examiners could have benefited from a diverse landscape of Open Access publishing options, which are not limited to publishing in journals. Indeed, patent offices already make use of federated Open Access discovery during the patent examination. The most widely used tools for searching and retrieving scientific articles at the EPO are Google Scholar, Scopus and PubMed. All these discovery solutions currently provide unified access to various Open Access publishing services (Verbandt & Vadot, 2018).
Our study is limited in various aspects. One and most important is that NPL citations are only accessible as text strings, which need to be parsed and mapped to scholarly data sources. So far, no openly available evidence base exists to measure the influence of Open Access to the scholarly literature on patents. Lens.org provides a graphical user interface to analyse SNPR citations to Open Access documents, but it is not suitable for large-scale analyses as presented here. Because of the large number of patent citations manual matching would not be possible. The limited resources of our work furthermore prevented us from expanding our method by drawing on an increasing number of reference matching and text classification approaches like BERT (Voskuil & Verberne, 2021). Instead, we made use of identifiers in NPL text strings and mapped them to publicly available scholarly data sources. It must be noted, however, that our investigated data sources are selective towards scholarly journals, while lacking other important NPL types, particularly grey literature like technical documentations or standards. In fact, only a small proportion of NPL strings contained an identifier like a DOI, which is widely common in scholarly publishing, but less, for instance, in the grey literature field.
Furthermore, we lack evidence about how valid our SNPR sample is to draw conclusions about the citation motivation. We have no evidence about who cited the NPL, and when. Was the work cited by the inventor, or did it happen through the patent office? We also lack information about the availability of discovery solutions. For instance, the European Patent Office added more and more scholarly literature databases in prior art search, including Open Access full text databases (Verbandt & Vadot, 2018), which might have led to an increase in citations to openly available SNPR. Moreover, due to our research design, we did not test how representative our sample is. Therefore, careful interpretation of our findings is needed, when drawing general conclusions about the Open Access uptake in the SNPR.
Future studies will likely benefit from such an improved evidence base associated with Open Access and patents. During the course of our work, the search engine lens.org has started to offer bulk download of its underlying data for academic use. In its data, metadata about patent families is linked to disambiguated bibliographic metadata and includes Open Access status information. But also, public patent offices curate large databases about NPL. Bulk access, as in the case of the EPO worldwide bibliographic data (DOCDB), for large-scale analytical purposes, is not directly possible. Given the importance of monitoring the influence of science on innovation, we recommend that these essential data sources will be made available without restrictions to the public, ideally in cloud-based big data analytics environments like Google Big Query.
Conclusion
Open Access literature is a widely used and reputable source for scientific information in innovation. Our big data analysis shows that the share of Open Access among scientific non-patent references in patents was above the general trend. Combining structured patent data with scholarly data sources with a focus on Open Access opens up the opportunity to better understand patterns of Open Access adoption. In this regard, and in line with the literature review conducted, we found the comparison across countries of inventors and technological fields as promising indicators to analyse the Open Access uptake in innovation.
While our data analysis suggests that scientific articles cited in patents are more likely openly available in comparison to the general trend, it is challenging to link it to specific science policies and incentives. Overall, analysing the nature of science-technology linkage particularly with regard to Open Access is complex. Meanwhile, there are notable activities to interlink patent information with big scholarly data both in academia and in industry. These activities promise an improved evidence-base and monitoring system to measure technology-science linkage with a focus on Open Access.
Ethics and consent
Ethical approval and consent were not required.