Mean water temperature was higher in summer (18.5 ± 1.2 ºC), whereas mean salinity, DO, and Chl. were higher in spring (40.6 ± 0.1, 7.23 ± 0.29 mg L-1, and 2.63 ± 0.73 µg L-1 respectively (Table 2A., Figure 4A.). Statistically significant differences were found among seasons for all parameters except DO (Extended data).
Biofouling parameters
The biofouling growth was noticeable between seasons and in each season with increasing submersion time of samples (Figure 4, Figure 5, Table 2B., Table 3). Strong statistically significant relationships (RELATE Rho≥0.70) (Table 4A.) were found among all the biofouling parameters, as well as high positive correlations among Richness, TBiom (total biomass), and TDens (total density) (≥0.70) (Table 4B.).
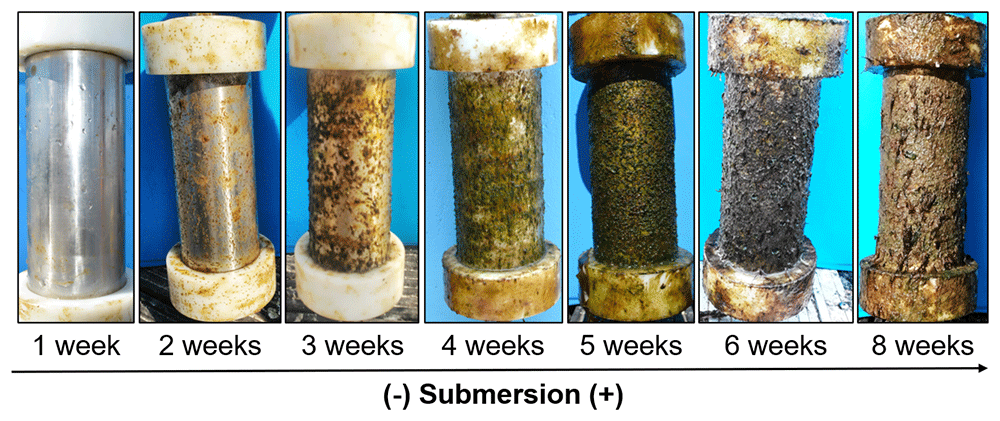
Figure 5. Biofouling growth after one, two, three, four, five, six, and eight weeks of samples submersion.
Richness, TBiom and TDens registered higher mean values in each season at the longest submersion period, with higher values calculated for autumn at 8W. Mean Thickness increased with increasing submersion in spring and summer (Table 2B.). Statistically significant differences were found among seasons for Richness (all seasons), TBiom (except between spring-summer), BIOM (all seasons), TDens (all seasons), DENS (all seasons), and Thickness (except between spring-autumn). Simultaneously, for all the parameters above, statistical differences were found among submersion periods in spring and summer; in autumn, statistical differences between submersion periods were found for TDens and DENS (Extended data).
Table 3. List of taxa found in this study, showing their presence (in grey) across submersion periods (1–8W) within each season.
Total macroalgal and macroinvertebrate taxa are presented per submersion period and per season at the bottom. The number of occurrences (occ.) of each taxon in the study is shown on the right side. Greater numbers are presented in bold. N.I.: Not identified.
| Group | Taxa | Spring | Summer | Autum | Occ. |
|---|
| 1W | 2W | 4W | 1W | 2W | 3W | 4W | 5W | 4W | 6W | 8W |
|---|
| Macroalgae | Ph. Chlorophyta | Or. Ulvales | Ulva sp. (tubular-like form) | | | | | | | | | | | | 10 |
| Ulva sp. (leaf-like form) | | | | | | | | | | | | 10 |
| Ph. Rhodophyta | Or. Ceramiales | cf. Tiffaniella capitata | | | | | | | | | | | | 7 |
| cf. Pterothamnion crispum | | | | | | | | | | | | 5 |
| Polysiphonia sp. | | | | | | | | | | | | 8 |
cf. Halurus flosculosus /
Bornetia secundiflora | | | | | | | | | | | | 7 |
| Ph. Rhodophya | Rhodophyta N.I. | | | | | | | | | | | | 8 |
| Cl. Phaeophyceae | Or. Ectocarpales /
Or. Sphacelariales | Hincksia sp. /
Sphacelaria sp. | | | | | | | | | | | | 9 |
| Macroalgal taxa per submersion period | 1 | 4 | 9 | 1 | 7 | 8 | 9 | 9 | 9 | 7 | 9 | |
| Macroalgal taxa per season | 9 | 9 | 9 | |
| Macroinvertebrates | Ph. Bryozoa | Ph. Bryozoa | Bryozoa N.I. | | | | | | | | | | | | 8 |
| S.Ph. Crustacea | Or. Amphipoda | Amphipoda N.I. | | | | | | | | | | | | 9 |
| Caprella equilibra | | | | | | | | | | | | 7 |
| Or. Decapoda | Anomura /
Brachyura N.I. | | | | | | | | | | | | 3 |
| cf. Pasiphaea sivado | | | | | | | | | | | | 5 |
| Or. Isopoda | Gnathiidae N.I. | | | | | | | | | | | | 2 |
| Tanais dulongii | | | | | | | | | | | | 7 |
| Or. Sessilia | Barnacles
(Perforatus perforatus,
Amphibalanus amphitrite,
Austrominius modestus) | | | | | | | | | | | | 10 |
| Cl. Pycnogonida | Or. Pantopoda | Ammothella longipes | | | | | | | | | | | | 1 |
| Cl. Polychaeta | F. Serpulidae | Spirobranchus sp. | | | | | | | | | | | | 7 |
| F. Syllidae | Syllidae N.I. | | | | | | | | | | | | 2 |
| Ph. Mollusca | F. Nereididae | Nereididae N.I. | | | | | | | | | | | | 1 |
| Cl. Bivalvia | Mytillus galloprovincialis | | | | | | | | | | | | 2 |
| Cl. Gastropoda | cf. Crisilla semistriata | | | | | | | | | | | | 1 |
| Macroinvertebrate taxa per submersion period | 2 | 3 | 7 | 4 | 2 | 9 | 11 | 11 | 7 | 8 | 11 | |
| Macroinvertebrate taxa per season | 7 | 12 | 11 | |
| Total taxa per submersion period | 3 | 7 | 16 | 5 | 9 | 17 | 20 | 20 | 16 | 15 | 20 | |
| Total taxa per season | 16 | 21 | 20 | |
Table 4. Relationships between the frictional resistance forces and biofouling parameters.
A. RELATE analysis; stronger relations (Rho≥0.70) are presented in bold. B. Pearson correlations; higher correlations (≥0.50) are presented in bold.
| A. | Richness | TBiom | BIOM | TDens | DENS | Thickness |
|---|
| Friction forces | 0.396 | 0.237 | 0.382 | 0.248 | 0.380 | 0.094* |
| Richness | | 0.696 | 0.824 | 0.674 | 0.845 | 0.179 |
| TBiom | | | 0.742 | 0.790 | 0.784 | 0.118* |
| BIOM | | | | 0.668 | 0.898 | 0.104* |
| TDens | | | | | 0.803 | 0.201 |
| DENS | | | | | | 0.255 |
| B. | Richness | TBiom | TDens | Thickness | | |
|---|
| Friction forces | -0.722 | -0.401 | -0.525 | -0.532 | | |
| Richness | | 0.698 | 0.715 | 0.640 | | |
| TBiom | | | 0.857 | 0.192 | | |
| TDens | | | | 0.368 | | |
In total 24 taxa were found, 9 macroalgal taxa and 15 macroinvertebrate taxa (Table 3). Summer and autumn registered more taxa (21 and 20 taxa, respectively), which in each season generally increased with the submersion period (maximum of 20 taxa in summer 4W, summer 5W, and autumn 8W) (Table 2B., Table 3).
All macroalgal taxa in this study were recorded in every season, whereas more macroinvertebrate taxa (12 taxa) were found during summer. The most frequent taxa were the green algae Ulva sp. (both tubular-like and leaf-like forms) and barnacles (including Perforatus perforatus, Amphibalanus amphitrite, and the NIS Austrominius modestus) (10 occurrences each), followed by the brown algae Hincksia sp./Sphacelaria sp. and Amphipoda N.I. (9 occurrences each), the red algae Polysiphonia sp. and Rhodophyta N.I., and Bryozoa N.I. (8 occurrences each). Some taxa were found only in summer (Anomura/Brachyura N.I., Gnathiidae N.I., Syllidae N.I., and Mytillus galloprovincialis) or in autumn (Ammothella longipes, cf. Crisilla semistriata, and Nereididae N.I.) (Table 3). Overall, some species succession in the colonization process was observed. For example, after one week of submersion, only the opportunistic green algae (Ulva spp.), barnacles (cf. P. perforatus/A. amphitrite and A. modestus), bryozoans (Bryozoa N.I.; in summer) and other crustaceans (Anomura/Brachyura N.I.; in summer) were recorded; after two weeks, filamentous brown algae (Hincksia sp./Sphacelaria sp.), red algae (e.g. from the order Ceramiales; in summer) and many amphipod individuals were observed; after three or more weeks, several other macroalgal and macroinvertebrate taxa joined the biofouling communities (Table 3).
Not only the structure of the biofouling communities changed between seasons and between submersion periods in each season, so did the proportion of biofoulers biomass and density to the total (Figure 6):
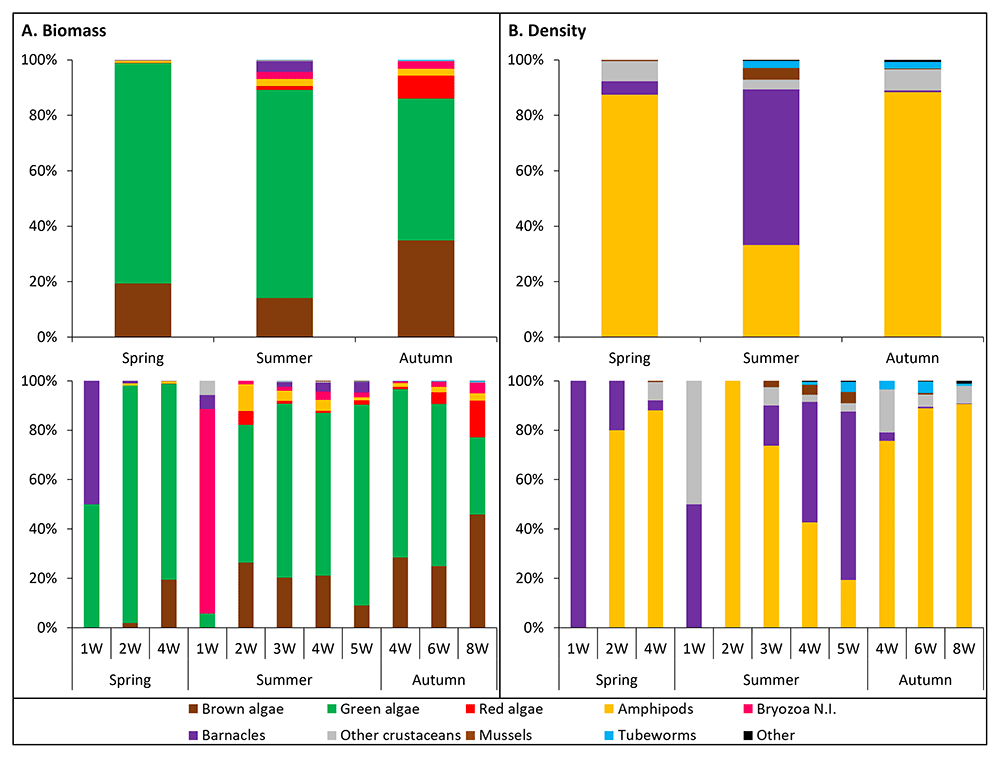
Figure 6. Contribution of major biofouling groups to the communities’ biomass (A.) and density (B.) among seasons (top) and submersion periods (bottom).
Regarding the biofoulers biomass (Figure 6A.), in all seasons the green and brown algae accounted for the greatest share of the total (51–79% and 14–35%, respectively), followed by red algae (1% in summer, 8% in autumn), amphipods (3% in summer, 2% in autumn), bryozoans (3% in summer, 6% in autumn), and barnacles (4% in summer). Changes in the taxa and their proportions between submersion periods in each season were evident, and also between seasons at the same submersion period. Below are provided details for the submersion periods assessed in more than one season:
• 1W (spring vs. summer): In spring, only green algae and barnacles were found, each accounting for 50% of the total biomass. In summer, more taxa (bryozoans, Anomura/Brachyura N.I.) were part of the assemblages compared to spring; green algae and barnacles presented much lower proportions (6% each) and bryozoans accounted for 83%.
• 2W (spring vs. summer): In spring, brown algae and amphipods joined the assemblages; the green algae accounted for 96% of the total biomass. In summer, brown algae, red algae, and amphipods were also part of the assemblages; bryozoans had a very much reduced proportion (1%), whereas the proportion of green algae, brown algae, and amphipods increased (to 56%, 26%, and 11%, respectively).
• 4W (spring vs. summer vs. autumn: The assemblages were composed of most of the taxa found in this study, especially in summer and autumn (e.g. bryozoans were not registered in spring). In all seasons the green algae accounted for greater proportion (66–68% in summer and autumn to 79% in spring), followed by brown algae (19% in spring to 28% in autumn). Other taxa accounted for very low proportions, with the higher values being observed in summer (amphipods and barnacles: 4% each, bryozoans: 3%, red algae: 1%).
Concerning to other submersion periods (i.e. summer 3W and 5W, and autumn 6W and 8W), the distribution of taxa proportion generally followed a similar order compared to the 4W, with green algae accounting for the greatest proportion, followed by brown algae, amphipods, barnacles in summer, bryozoans, and red algae.
Regarding the biofoulers density (Figure 6B.), in all seasons amphipods (33% in summer to 87–88% in spring-autumn), barnacles (1% in autumn to 56% in summer), and other crustaceans (3% in spring to 7–8% in spring-autumn) contributed the most to the total. Like for the biomass, the taxa and their proportions to the total density changed between submersion periods in each season and between seasons at the same submersion period. Below are provided details for the submersion periods assessed in more than one season:
• 1W (spring vs. summer): As mentioned above for the biomass, in spring only green algae and barnacles were found. Thus, barnacles accounted for 100% of the density. In summer, barnacles and Anomura/Brachyura N.I. each accounted for 50%.
• 2W (spring vs. summer): At 2W the amphipods achieved much greater expression. In spring, they accounted for 80% of the total density and barnacles accounted for the remaining 20%. In summer, amphipods accounted for 100% of the total density.
• 4W (spring vs. summer vs. autumn: The amphipods generally accounted for the greatest proportions in all seasons (43% in summer to 88% in spring), followed by barnacles (3–4% in spring-autumn to 49% in summer), motile crustaceans (3% in summer to 17% in autumn), mussels (4% in summer), and tubeworms (1% in summer to 3% in autumn).
Like for the biomass, at other submersion periods (i.e. summer 3W and 5W, and autumn 6W and 8W) the distribution of taxa proportion generally follows a similar order compared to the 4W, with barnacles and amphipods accounting for the greatest proportions, followed by mussels, tubeworms, and motile crustaceans, in summer, and amphipods accounting for the greatest proportions, followed by motile crustaceans and tubeworms, in autumn.
The SIMPER analyses (cut-off 90%) provided further insights about the communities’ structure, with similar patterns being found using BIOM or DENS (Extended data). The similarities within the seasons were high, ranging between 68.59% (BIOM) / 67.53% (DENS) in summer and 85.66% (BIOM) / 80.44% (DENS) in autumn. The greatest dissimilarities between seasons were found between spring-summer, 44.47% using BIOM and 55.1% using DENS.
In each season, similarities within the submersion periods were also high. Using BIOM, similarities ranged between 60.20% for spring 2W and 94.41% for autumn 4W. Using DENS, similarities ranged between 54.6% for summer 3W and 92.92% for summer 2W. Dissimilarities between submersion periods were also high, generally greater between the submersion periods farther from each other, i.e. in spring between 1W-4W (95.47% using BIOM and 79.85% using DENS), in summer between 1W-5W (95.61% using BIOM and 97.70% using DENS; second to 1W-2W: 96.82% and 100%, respectively) and in autumn between 4–8W (34.58% using BIOM and 43.38% using DENS). The lowest dissimilarities were observed between adjacent submersion periods, i.e. in spring between 1–2W (74.50%) using BIOM and between 2W–4W (74.01%) using DENS, in summer between 4–5W (25.93% using BIOM and 23.15% using DENS) and in autumn between 6–8W (21.69% using BIOM and 24.72% using DENS) (Extended data).
Sixteen taxa (7 macroalgal + 9 macroinvertebrate taxa) were responsible for the dissimilarities regarding BIOM, while 11 macroinvertebrate taxa were main contributors to the dissimilarities regarding DENS. Most of the taxa, and especially the Amphipoda N.I., registered biomass or density increase with increasing submersion period in each season and registered higher mean values in autumn (Figure 7, Figure 8; Table 5). Some exceptions were the barnacles and mussels (M. galloprovincialis) which registered much greater biomass and density in summer, and the opportunistic green algae Ulva spp. which were the only taxa with greater biomass in spring.
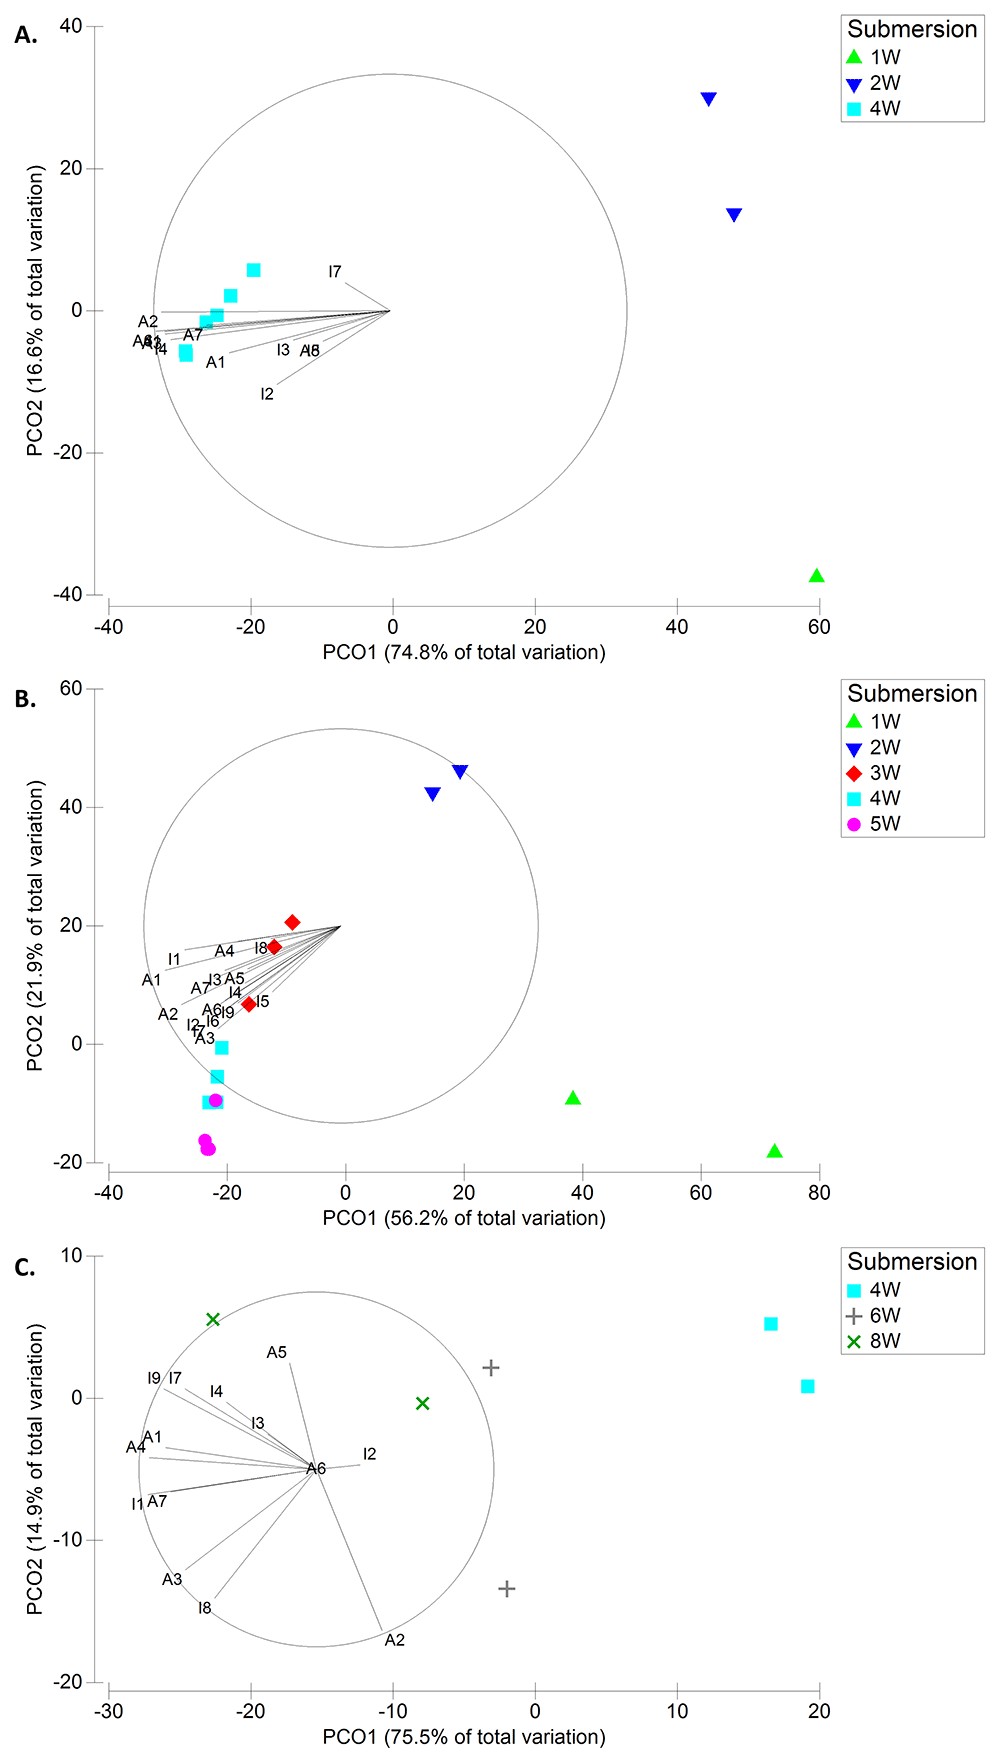
Figure 7. Principal Coordinates Ordination (PCO) plots of the taxa contributing the most to dissimilarities (from SIMPER) using biomass data (BIOM) in Spring (A.), Summer (B.), and Autumn (C.).
Taxa key – Algae: A1-Hincksia sp./Sphacelaria sp.; A2-Ulva sp. (tubular-like form); A3-Ulva sp. (leaf-like form); A4-Polysiphonia sp.; A5-cf. T. capitata; A6-cf. H. flosculosus/B. secundiflora; A7-Rhodophyta N.I.. Invertebrates: I1-Amphipoda N.I.; I2-Barnacles; I3-C. equilibra; I4-T. dulongii; I5-Anomura/Brachyura N.I.; I6-M. galloprovincialis; I7-Spirobranchus sp.; I8-cf. P. sivado; I9-Bryozoa N.I.
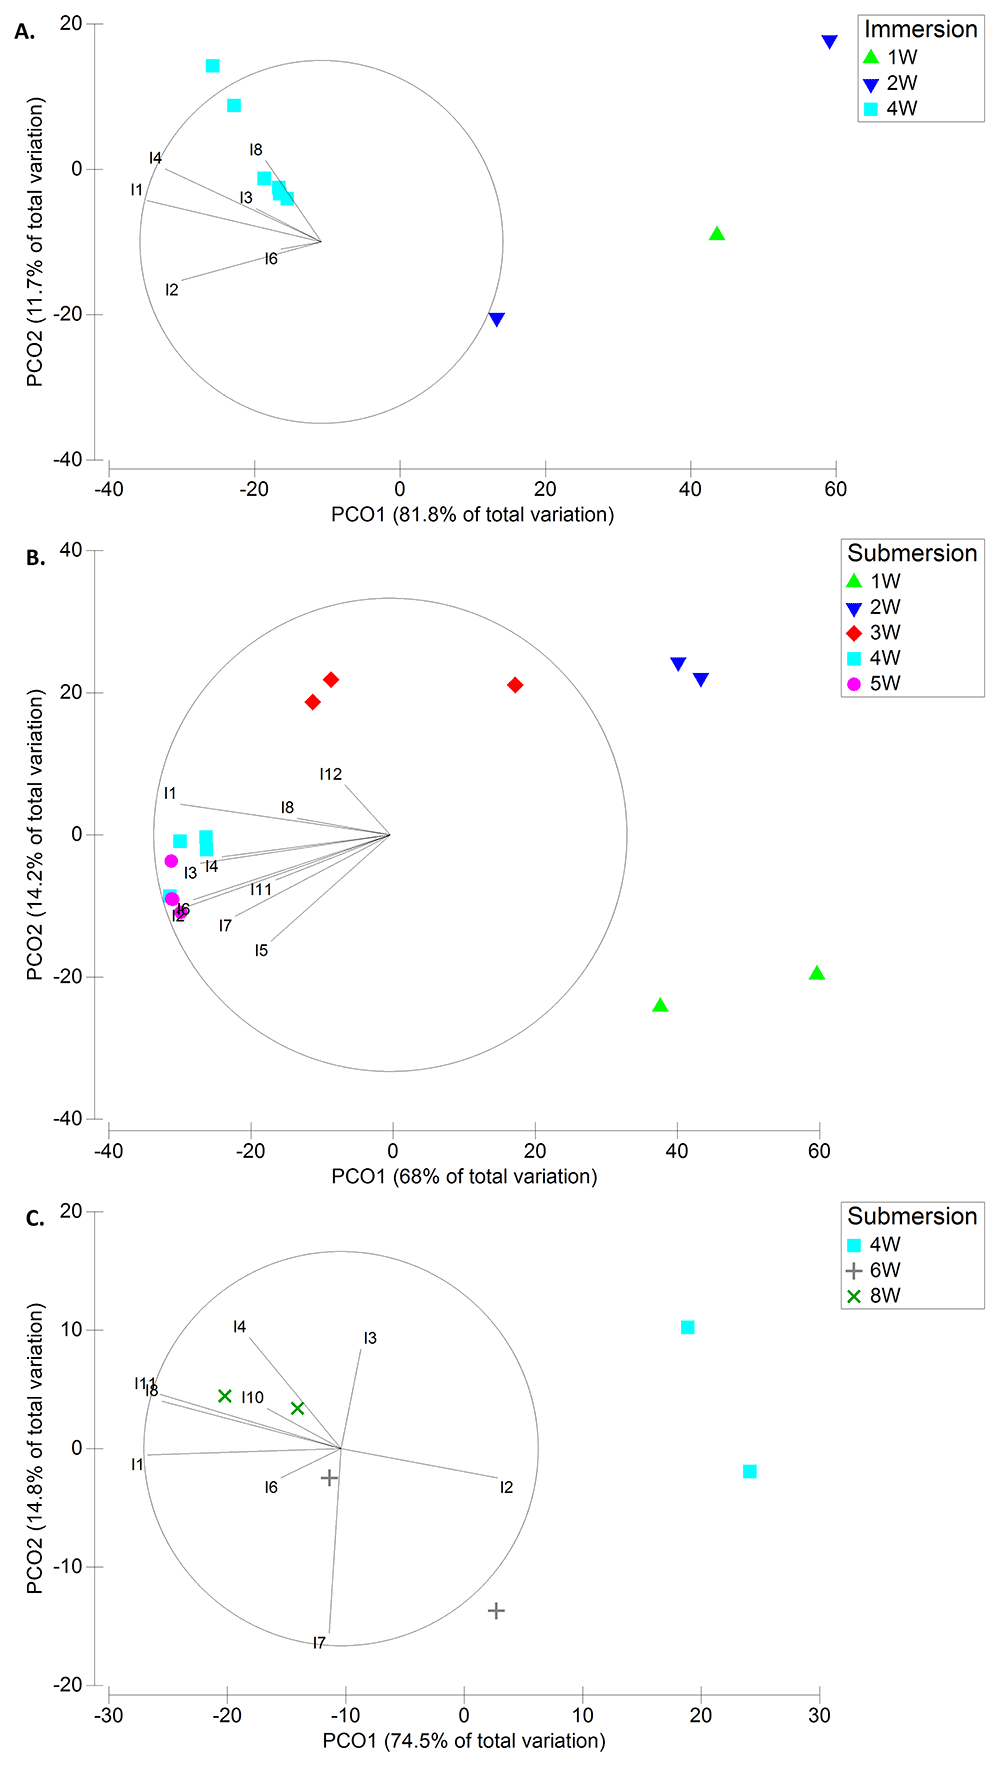
Figure 8. Principal Coordinates Ordination (PCO) plots of the taxa contributing the most to dissimilarities (from SIMPER) using density data (DENS) in Spring (A.), Summer (B.), and Autumn (C.).
Taxa key – Invertebrates: I1-Amphipoda N.I.; I2-Barnacles; I3-C. equilibra; I4-T. dulongii; I5-Anomura/Brachyura N.I.; I6-M. galloprovincialis; I7-Spirobranchus sp.; I8-cf. P. sivado; I10-A. semistriata; I11-Syllidae N.I.; I12-Gnathiidae N.I..
Table 5. Biomass (g FW m-2) (A.) and density (ind m-2) (B.) of the main taxa contributing to similarities within and dissimilarities among seasons and among submersion periods within the seasons (from SIMPER analysis).
Mean ± standard deviation values are presented. Grey colour identifies increasing values with increasing submersion period in each season.
| A1. Macroalgae biomass | Hincksia sp.
/Sphacelaria
sp. | Ulva sp.
(tubular-like
form) | Ulva sp.
(leaf-like
form) | cf.
Polysiphonia
sp. | cf. T. capitata | cf. H.
flosculosus / B.
secundiflora | Rhodophyta
N.I. | | | | |
|---|
| Spring | | 4.62 ± 5.43 | 15.55 ± 11.86 | 3.45 ± 2.91 | 0.009 ± 0.006 | 0.002 ± 0.004 | 0.009±0.007 | 0.008 ± 0.007 | | | | |
| Summer | | 1.46 ± 1.19 | 6.58 ± 6.97 | 1.20 ± 1.79 | 0.019 ± 0.024 | 0.069 ± 0.138 | 0.012±0.018 | 0.044 ± 0.067 | | | | |
| Autumn | | 11.79 ± 8.28 | 14.61 ± 5.64 | 2.71 ± 2.10 | 2.63 ± 2.74 | 0.005 ± 0.008 | 0.016±0 | 0.162 ± 0.126 | | | | |
| Spring | 1W | 0 ± 0 | 0.014 ± 0 | 0±0 | 0 ± 0 | 0 ± 0 | 0±0 | 0 ± 0 | | | | |
| 2W | 0.014 ± 0 | 0.65 ± 0.33 | 0.031 ± 0.031 | 0 ± 0 | 0 ± 0 | 0±0 | 0 ± 0 | | | | |
| 4W | 6.92 ± 5.32 | 23.11 ± 6.30 | 5.17 ± 1.96 | 0.014 ± 0 | 0.002 ± 0.005 | 0.014±0 | 0.011 ± 0.005 | | | | |
| Summer | 1W | 0 ± 0 | 0 ± 0 | 0.005 ± 0.008 | 0 ± 0 | 0 ± 0 | 0±0 | 0 ± 0 | | | | |
| 2W | 0.15 ± 0.03 | 0.32 ± 0.05 | 0.008 ± 0.008 | 0.008 ± 0.008 | 0.016 ± 0 | 0±0 | 0.008 ± 0.008 | | | | |
| 3W | 1.16 ± 0.67 | 3.95 ± 2.93 | 0.066 ± 0.035 | 0.030 ± 0.031 | 0.016 ± 0 | 0.005±0.009 | 0.016 ± 0 | | | | |
| 4W | 2.75 ± 0.67 | 8.58 ± 2.69 | 0.500 ± 0.579 | 0.005 ± 0.030 | 0.035 ± 0.027 | 0.026±0.032 | 0.035 ± 0.024 | | | | |
| 5W | 2.15 ± 0.40 | 15.37 ± 6.65 | 3.92 ± 1.46 | 0.026 ± 0.016 | 0.23 ± 0.20 | 0.016±0 | 0.13 ± 0.08 | | | | |
| Autumn | 4W | 6.14 ± 0.53 | 14.59 ± 0.79 | 0.154 ± 0.009 | 0.14 ± 0.03 | 0.008 ±0.008 | 0.016±0 | 0.016 ± 0 | | | | |
| 6W | 8.87 ± 2.43 | 18.29 ± 7.75 | 5.09 ± 0.93 | 1.38 ± 0.10 | 0 ± 0 | 0.016±0 | 0.27 ± 0.09 | | | | |
| 8W | 20.37 ± 9.25 | 10.94 ± 2.80 | 2.89 ± 0.18 | 6.37 ± 0.87 | 0.008 ± 0.008 | 0.016±0 | 0.20 ± 0.07 | | | | |
| A2. Macroinvertebrates biomass | Amphipoda
N.I. | Barnacles | C. equilibra | T. dulongii | Anomura /
Brachyura N.I. | M.
galloprovincialis | Spirobranchus
sp. | cf. P. sivado | Bryozoa
N.I. | | |
|---|
| Spring | | 0.20 ± 0.16 | 0.033 ± 0.045 | 0.003±0.006 | 0.013±0.014 | 0±0 | 0±0 | 0.002±0.005 | 0.007±0.020 | 0 ± 0 | | |
| Summer | | 0.26 ± 0.25 | 0.401 ± 0.469 | 0.012±0.014 | 0.014±0.027 | 0.013±0.027 | 0.007±0.008 | 0.008±0.008 | 0.004±0.007 | 0.26 ± 0.34 | | |
| Autumn | | 0.80 ± 0.42 | 0.014 ± 0.006 | 0.024±0.034 | 0.042±0.061 | 0±0 | 0±0 | 0.092±0.139 | 0.014±0.021 | 0.93 ± 1.02 | | |
| Spring | 1W | 0 ± 0 | 0.014 ± 0 | 0±0 | 0±0 | 0±0 | 0±0 | 0±0 | 0±0 | 0 ± 0 | | |
| 2W | 0.007 ± 0.007 | 0.007 ± 0.007 | 0±0 | 0±0 | 0±0 | 0±0 | 0±0 | 0±0 | 0 ± 0 | | |
| 4W | 0.30 ± 0.09 | 0.045 ± 0.051 | 0.005±0.008 | 0.020±0.013 | 0±0 | 0±0 | 0.002±0.006 | 0.010±0.025 | 0 ± 0 | | |
| Summer | 1W | 0 ± 0 | 0.005 ± 0.008 | 0±0 | 0±0 | 0.005±0.009 | 0±0 | 0±0 | 0±0 | 0.08 ± 0.11 | | |
| 2W | 0.063 ± 0.009 | 0 ± 0 | 0±0 | 0±0 | 0±0 | 0±0 | 0±0 | 0±0 | 0.008 ± 0.008 | | |
| 3W | 0.22 ± 0.17 | 0.11 ± 0.12 | 0.011±0.009 | 0.011±0.009 | 0±0 | 0±0 | 0.005±0.009 | 0.005±0.009 | 0.09 ± 0.07 | | |
| 4W | 0.50 ± 0.25 | 0.61 ± 0.36 | 0.017±0.015 | 0.008±0.009 | 0.035±0.049 | 0.016±0 | 0.012±0.008 | 0.012±0.008 | 0.33 ± 0.38 | | |
| 5W | 0.27 ± 0.07 | 1.04 ± 0.26 | 0.030±0.010 | 0.054±0.049 | 0.011±0.009 | 0.011±0.009 | 0.016±0 | 0±0 | 0.46 ± 0.40 | | |
| Autumn | 4W | 0.32 ± 0.05 | 0.016 ± 0 | 0.018±0.001 | 0.008±0.012 | 0±0 | 0±0 | 0.016±0 | 0±0 | 0.16 ± 0 | | |
| 6W | 0.78 ± 0.13 | 0.016 ± 0 | 0.008±0.012 | 0.018±0.026 | 0±0 | 0±0 | 0.071±0.078 | 0.027±0.038 | 0.73 ± 0.55 | | |
| 8W | 1.31 ± 0.06 | 0.008 ± 0.008 | 0.045±0.064 | 0.099±0.090 | 0±0 | 0±0 | 0.189±0.244 | 0.016±0 | 1.88 ± 1.12 | | |
| B. Macroinvertebrates density | Amphipoda
N.I | Barnacles | C. equilibra | T. dulongii | Anomura /
Brachyura N.I. | M.
galloprovincialis | Spirobranchus
sp. | cf. P. sivado | A.
semistriata | Syllidae
N.I. | Gnathiidae
N.I. |
|---|
| Spring | | 297.6 ± 228.6 | 17.0 ± 8.7 | 10.2 ± 20.4 | 23.8 ± 24.0 | 0 ± 0 | 1.7 ± 4.8 | 0 ± 0 | 1.7±5.1 | 0±0 | 0±0 | 0±0 |
| Summer | | 410.3 ± 387.3 | 747.2 ± 833.8 | 31.7 ± 39.2 | 26.0 ± 43.4 | 12.4 ± 18.9 | 55.4 ± 71.9 | 35.0 ± 63.8 | 4.5±8.1 | 0±0 | 4.5±8.1 | 3.4±9.8 |
| Autumn | | 2592.3 ± 1512.0 | 21.1 ± 16.2 | 27.1 ± 30.9 | 217.0 ± 170.0 | 0 ± 0 | 6.0 ± 13.5 | 72.3 ± 66.0 | 9.0±9.9 | 3.0±7.4 | 12.1±14.8 | 0±0 |
| Spring | 1W | 0 ± 0 | 15.3 ± 0 | 0 ± 0 | 0±0 | 0 ± 0 | 0 ± 0 | 0 ± 0 | 0±0 | 0±0 | 0±0 | 0±0 |
| 2W | 30.6 ± 30.6 | 7.7 ± 7.7 | 0 ± 0 | 0±0 | 0 ± 0 | 0 ± 0 | 0 ± 0 | 0±0 | 0±0 | 0±0 | 0±0 |
| 4W | 436.1 ± 142.7 | 20.4 ± 7.2 | 15.3 ± 23.4 | 35.7 ± 21.0 | 0 ± 0 | 2.6 ± 5.7 | 0 ± 0 | 2.6±6.2 | 0±0 | 0±0 | 0±0 |
| Summer | 1W | 0 ± 0 | 6.0 ± 8.5 | 0 ± 0 | 0±0 | 6.0 ± 8.5 | 0 ± 0 | 0 ± 0 | 0±0 | 0±0 | 0±0 | 0±0 |
| 2W | 63.3 ± 9.0 | 0 ± 0 | 0 ± 0 | 0 ± 0 | 0 ± 0 | 0 ± 0 | 0 ± 0 | 0±0 | 0±0 | 0±0 | 0±0 |
| 3W | 343.6 ± 227.3 | 78.4 ± 30.7 | 12.1 ± 8.5 | 18.1 ± 14.8 | 0 ± 0 | 12.1 ± 17.1 | 0 ± 0 | 6.0±10.4 | 0±0 | 0±0 | 12.1±20.9 |
| 4W | 729.5 ± 343.4 | 1386.6 ± 559.3 | 30.1 ± 27.1 | 12.1 ± 12.8 | 36.2 ± 26.7 | 102.5 ± 44.3 | 18.1 ± 20.2 | 13.6±9.0 | 0±0 | 9.0±10.4 | 0±0 |
| 5W | 447.6 ± 89.9 | 1840.2 ± 362.7 | 72.3 ± 44.3 | 72.3 ± 63.9 | 13.6 ± 7.8 | 122.1 ± 87.1 | 113.0 ± 85.2 | 0±0 | 0±0 | 9.0±10.4 | 4.5±9.0 |
| Autumn | 4W | 759.6 ± 18.1 | 36.2 ± 0 | 27.1 ± 9.0 | 180.9 ± 144.7 | 0 ± 0 | 0 ± 0 | 36.2 ± 18.1 | 0±0 | 0±0 | 0±0 | 0±0 |
| 6W | 2595.3 ± 388.8 | 18.1 ± 18.1 | 9.0 ± 9.0 | 135.6 ± 27.1 | 0 ± 0 | 18.1 ± 18.1 | 135.6 ± 81.4 | 9.0±12.8 | 0±0 | 9.0±12.8 | 0±0 |
| 8W | 4422.0 ± 27.1 | 9.0 ± 9.0 | 45.2 ± 45.2 | 334.6 ± 208.0 | 0 ± 0 | 0 ± 0 | 45.2 ± 9.0 | 18.1±0 | 9.0±12.8 | 27.1±12.8 | 0±0 |