Introduction
Nowadays, polyethylene terephthalate (PET)-based waste streams are mainly treated by means of mechanical processes. Nevertheless, only single-polymer plastic solid waste (PSW) can be properly recycled and these processes result in their progressive degradation, while the unrecyclable polymers are burnt or disposed of in landfills. However, the life cycle of PSW finishes when, after excessive degradation and contamination, wastes are not recyclable anymore and they can just be burned or disposed of with the other plastics in landfills. This disposal process doesn’t allow the base material that has been used to produce PET-base plastics, to be recovered. Therefore, recovery of these parent materials is at this moment not possible due to time, cost and energy efficiency problems. Chemical processing could be considered for complete recovery of the molecules constituting the polymer, which would then be ready to be used to produce virgin PET or other material topologies based on previous molecules.
In the context of the European Union’s DEM3TO project, an innovative technology is proposed to chemically process the PET. In a specific reactor, microwave radiation is used with a temperature controller to quickly depolymerise the initial polymer (PET) into its composing elements Ethylene Glycol [EG] and terephthalic acid [TPA]) without burning it1.
In order to produce the desired molecules, once the depolymerisation has been terminated, a filtration and drying system must be adopted. Filtration and drying processes are critical operations in a variety of industrial processes such as DEM3TO that require the separation of solid matter from liquid. Due to high temperatures and use of dangerous substances, isolation, reduced product handling and environmental protection, agitated Nutsche filter (ANF) filtration and drying techniques are employed (Figure 1).
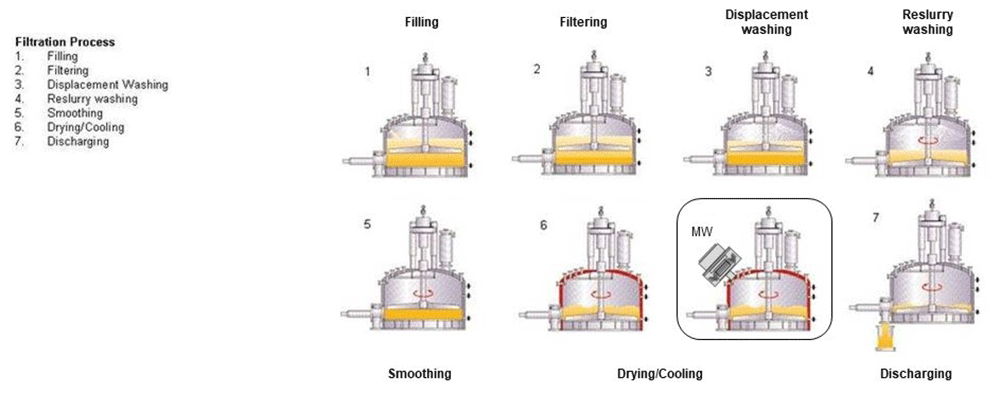
Figure 1. The traditional Agitated Nutsche Filter (ANF) phases (7) with the additional high frequency (HF) component.
Copyright permissions granted. © De Dietrich Process Systems, Inc5.
ANF allows a very high drying ratio (~1% of moisture), but the entire process is time-consuming. Additionally, ANF systems aren’t able to homogeneously and quickly dry the mixture, because the heating power is performed by the vessel walls or in some cases from the agitator, but this still doesn’t allow for an excellent homogeneity of humidity. Therefore, it is necessary to agitate the mixture many times to homogenise and evacuate the vapours, especially when the re-slurry process is needed, because wash quality requirements are not sufficient or long contact time is needed2. Therefore, standard ANF procedure is slow3. It can take hours to finish the drying process, but with the use of microwaves it is possible to accelerate it. This is an additional vantage of the using of electromagnetic waves, but the main objective is to heat the whole substances homogeneously thanks to the microwaves that spread out into all the mixture and not only in perimetry like electric heaters inside vessel/blades walls. For these reasons a novel cavity microwave dryer component has also been developed to address above problems and accelerate the drying process.
The purpose of the research was:
- to speed up the drying process through microwaves and increase the homogeneity of heat distribution
- to analyse the trend of the S parameters (this parameter allows to calculate the efficiency of the HF system)4, to evaluate if a dynamic controlling of the microwave impedance is needed
- to study how the power efficiency and the distribution of the humidity inside the mixture is influenced by the heating/evaporation of the liquid as a function of the concentration of the mixture and the presence of the mixer blades
The research can be summarized in:
- study the behaviour of a microwave cavity inside a ANF during the preheating phase and the drying phase (water evaporation)
- laboratory characterisation of the dielectric behaviour of the chemical substances (TPA, EG) dissolved in water in function of temperature, water concentration and microwave (MW) frequency of the HF source (magnetron)6
- electromagnetic simulation of the pre-heating of the chemical substances and water up to the boiling temperature and analysis of the power efficiency of the HF source,
- electromagnetics simulation of the water evaporation (drying phase) (TPA/EG drying) and analysis of the power efficiency of the HF source and the distribution of the humidity into the mixture
Microwave dryer cavity analysis
To speed up the drying/evaporation process of the substance inside the ANF, it is necessary to create an MW cavity that allows microwaves to penetrate homogeneously and heat the mixture. Before we start discussing the use of cavities it is necessary to understand some fundamental principles and models that govern their behaviour7. Cavities usually work in resonant modes, however in the present case, due to the continuous variations in volume, the evaporation effect and temperature changes, it is not possible to keep the cavity in permanent resonance condition.
The first simulations (Figure 2) that have been performed in our study shows that working in resonance mode for this specific application is impractical, because of the resonance frequencies variations due to the resonator (ANF geometry) behaviours changes. In fact, as can be seen from the simulation, the resonant frequency is strongly influenced not only by the size of the resonant cavity but also by its characteristics such as for example, in this specific case, the amount of material presents as well as its composition (dielectric proprieties).
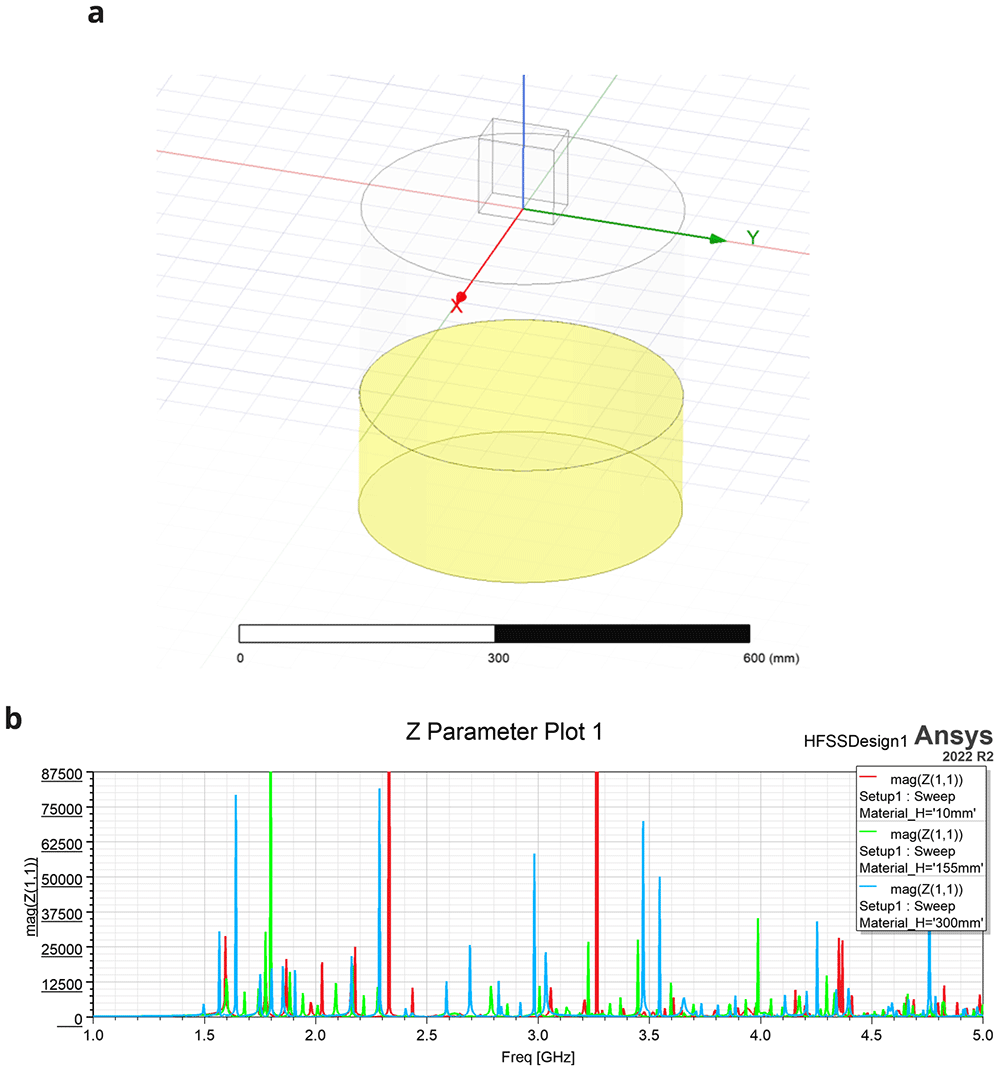
Figure 2. Ansys - 3D High Frequency Electromagnetic Simulation Software (HFSS).
(a) Cylindrical cavity model (resonator) with variable mixture volume (yellow) from 10mm to 300mm (red, green and blue plots), cavity height of 400 mm, cavity diameter of 385 mm, mixture dielectric constant (Ɛr) = 4. (b) Resonant mode – resonant frequencies (impedance change) vs mixture content (cavity height, material_H variable). All permissions granted, author’s own figure.
When the water into the cavity changes its concentration, the equivalent permittivity constant decreases the quality factor that is related to the heating efficiency of the system. Therefore, to maintain an acceptable efficiency, it is necessary to adapt the excitation frequency to the new resonant frequency of the cavity. Generally, resonant mode is used to measure permittivity constant of material and not for this kind of application8.
In conclusion, the cavity will be used to allow microwave penetration inside the medium.
In general, when a microwave penetrates a material, its propagation speed changes in function of the material's dielectric proprieties. The following formula describes this speed reduction9:
Where:
- C = Speed of the light = ~300'000
- εr = Relative permettivity of the material [–]
- f0 = Frequency of the wave into the vacuum [Hz]
- λ0 = Wave-lenght of the wave into the vacuum [m]
- λdiel = Wave-lenght of the wave into the medium [m]
Another important parameter that must be taken into account during the development of the dryer is the penetration depth10. This parameter determines the attenuation of an electromagnetic (EM) wave within a given dielectric substance. The penetration depth is defined as the length with a signal attenuation of 1/e (37%) (Eq. 2)11:
Where:
- C0 = Speed of the light
- = Real component of the relative permettivity of the material [–]
- fdiel = Frequency of the wave into the medium [Hz]
- = Penetration depth for a signal attenuation of 37% [m]
In some case it is also possible to use the penetration depth for an attenuation of the 50% (Eq. 3)12:
Where:
- = Real component of the relative permettivity of the material [–]
- fdiel = Frequency of the wave into the medium [Hz]
- Dp @ 0.5 = Penetration depth for a signal attenuation of 50% [m]
Theoretically, the dielectric height must be infinite to absorb all the microwave signals; however, an absorption equal to 99% is sufficient to estimate the theoretical height. Through some rearrangements it is possible to evaluate minimum material depth in order to quasi-absorb (99%) the microwave signal(Eq 4–Eq 5):
Where:
Therefore, assuming a total absorbed power of 99%:
According to this value it still possible to choose the correct cavity diameter for the model.
Once the size of the reactor has been determined, it is possible to calculate the total power absorbed in the dielectric material (Vloss) by integrating the Volume Loss Density (Vloss density) with the mixture volume using the Electromagnetic simulator AnsysTM HFSSTM (Ansys Electromagnetics version R2020 – R2) . An alternative freely available Finite Element Method (FEM) electromagnetic simulator is Elmer FEM. The simulators allow users to compute the surface loss density (W/m2) (Eq. 6) which comes from metallic losses, and the volume loss density (W/m3) which comes from dielectric losses. This simulation results can be used to simulate the total absorbed power on metals and dielectrics13.
Where:
TPA/H2O mixture dielectric proprieties
The dryer simulations and analysis were carried out with water and TPA (terephtalic acid) that emulate the industrial mixture that needs to be dried in the industrial process. Table 1 shows the initial concentrations and characteristics of the mixture at 30°C according to the specifications provided by the partners of the DEMETO project14.
Table 1. Mixture characteristics.
TPA, terephtalic acid.
| Parameter | Water | TPA |
|---|
| Mixing concentration | 80% | 20% |
| Mass density [kg/m3] | 997.00 | 1520.00 |
| Dielectric constant | ~75 | ~1.5 |
| Tangent loss factor | ~0.13 | ~0.07 |
In order to simulate the heating and evaporation effect with MW (Microwave) energy fed into the dryer, the dielectric constant and the loss tangent factor of the mixture must be estimated. Unfortunately, this constant estimation depends on many factors15, such as:
- Concentration (percentage between water and TPA acid)
- Physical state (liquid, solids, vapours)
- Miscibility or stratification
- Temperature
- Microwave frequency
For these reasons, it was necessary to carry out a characterization of the substance, prior to running process simulations16. More specifically, in the intended application, the reactor in the drying phase will:
heat the mixture up to the boiling temperature of the water (temperature variation - preheating phase),
evaporate the mixture based on the mass of water (variation of the volumetric concentration of the mixture - evaporation phase).
Therefore, for these phases it will be necessary to know the dielectric properties as a function of temperature and volume (concentration of water in the mixture). For this research project it was decided to use a microwave frequency of 2.45GHz, because it is a frequency allowed for radio-frequency process heating that is included on ISM radio bands17.
Mathematical model design
Using the following formulas, the relative theoretical dielectric constant and loss factor can be calculated18:
Where:
The resulting parameters ( , ) of the material “mix” can be obtained by using a weighted mean of the complex representation of dielectric permittivity of the two substances that compose the mixture:
Where:
Finally, the theoretical polar representation (magnitude, angle) of the mixture can be expressed as:
The behaviour of the dielectric proprieties of the mixture as a function of the water content is represented in Figure 3.
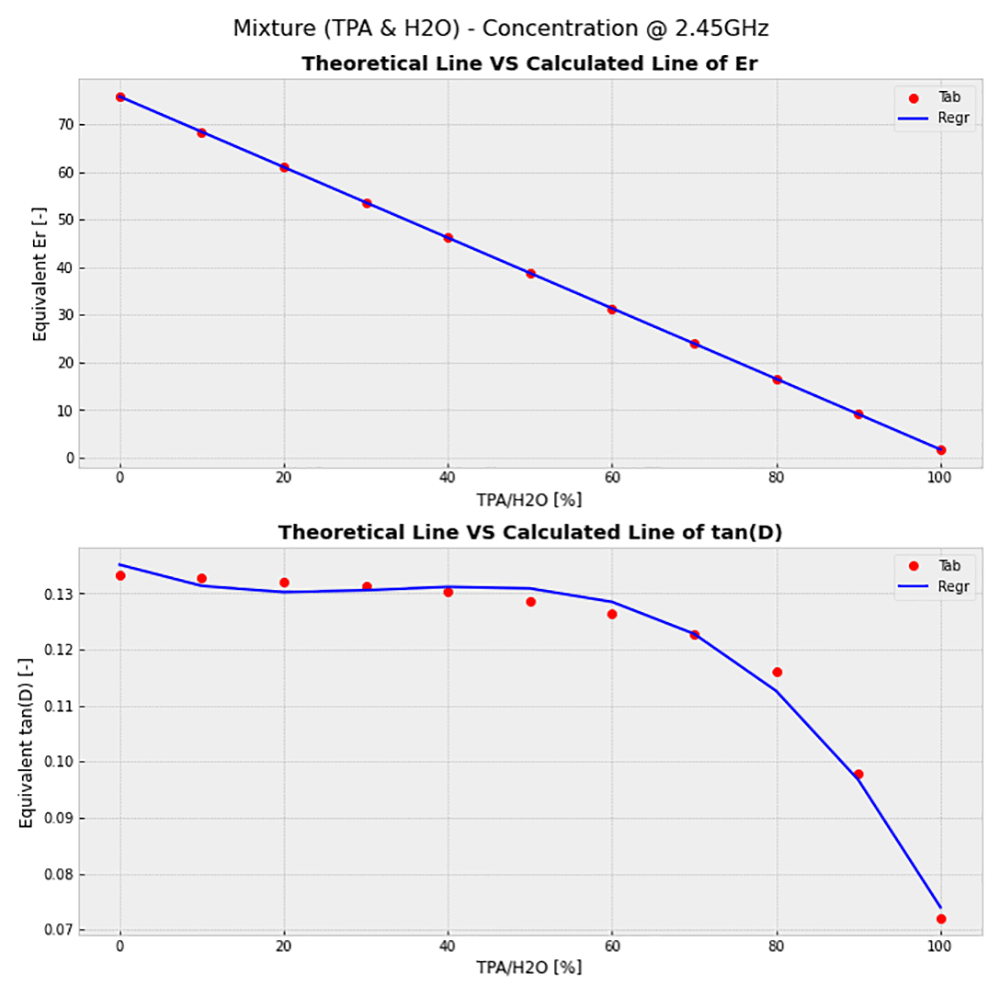
Figure 3. Theoretical permittivity curve of the mixture.
Upper: Dielectric behaviour in function of terephtalic acid (TPA) concentration. Lower: Loss tangent behaviour in in function of TPA concentration.
Once the mathematical model of the mixture has been obtained, through a linear regression for εr and a polynomial regression of the third order for tan(δ), it is possible to define how the dielectric parameters of the mixture will vary by knowing only the characteristics of the substances of which it is composed (Eq 14 – Eq 15).
Where:
- tan(δ)mix = Dielectric loss factor of the comosed mixture [–]
- Acc2 = Accuracy of the mathematical regression [–]
- R = Volumetric concentration of TPA in H2O [%]
- VolTPA = Volume of TPA [L]
- VolH2O = Volume of H2O [L]
Mathematical model validation at different concentrations
The dielectric characterization was performed firstly by preparing some samples of tap water and TPA (Sigma Aldrich - TPA 185361-500G – 98%) at different concentrations starting from 0% to 100% (different concentrations starting form 0% and working up in increments of 10% until reaching 100% TPA in the water) of TPA into water and secondly by measuring its dielectric properties with the Agilent’s 85070E Dielectric Probe Kit and the N5230A vector analyser (Figure 4).
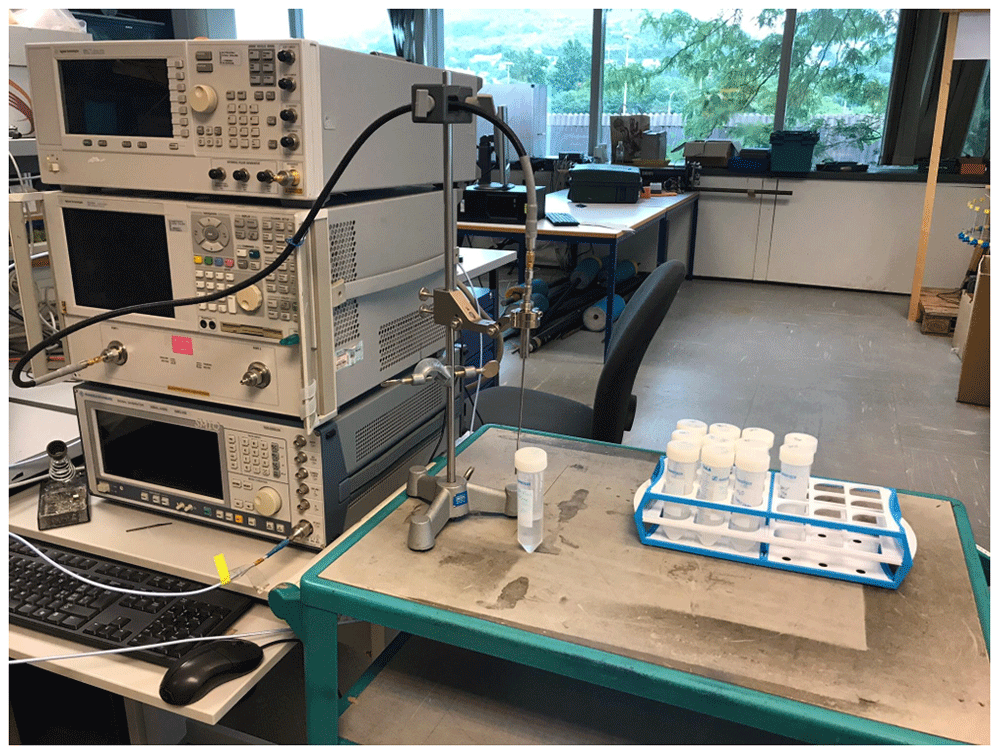
Figure 4. Dielectric proprieties - measurement setup.
The TPA is a powdered substance that is not soluble in water, therefore it tends to drop and sediment on the bottom side of the test tube. Given this phenomenon and since the dryer will continuously mix the chemical substance during the drying process, the mixtures have been measured after stirring them with a vortex machine (Fisherbrand – F202A0176FI). This measurement process should guarantee a better material homogeneity during the tests with the described setup afore.
Comparing the data measured with the mathematical model (Figure 5) it is possible to note a good correspondence. The mathematical model is therefore able to approximate the dielectric characteristics of the mixture at various concentrations of H2O and TPA.
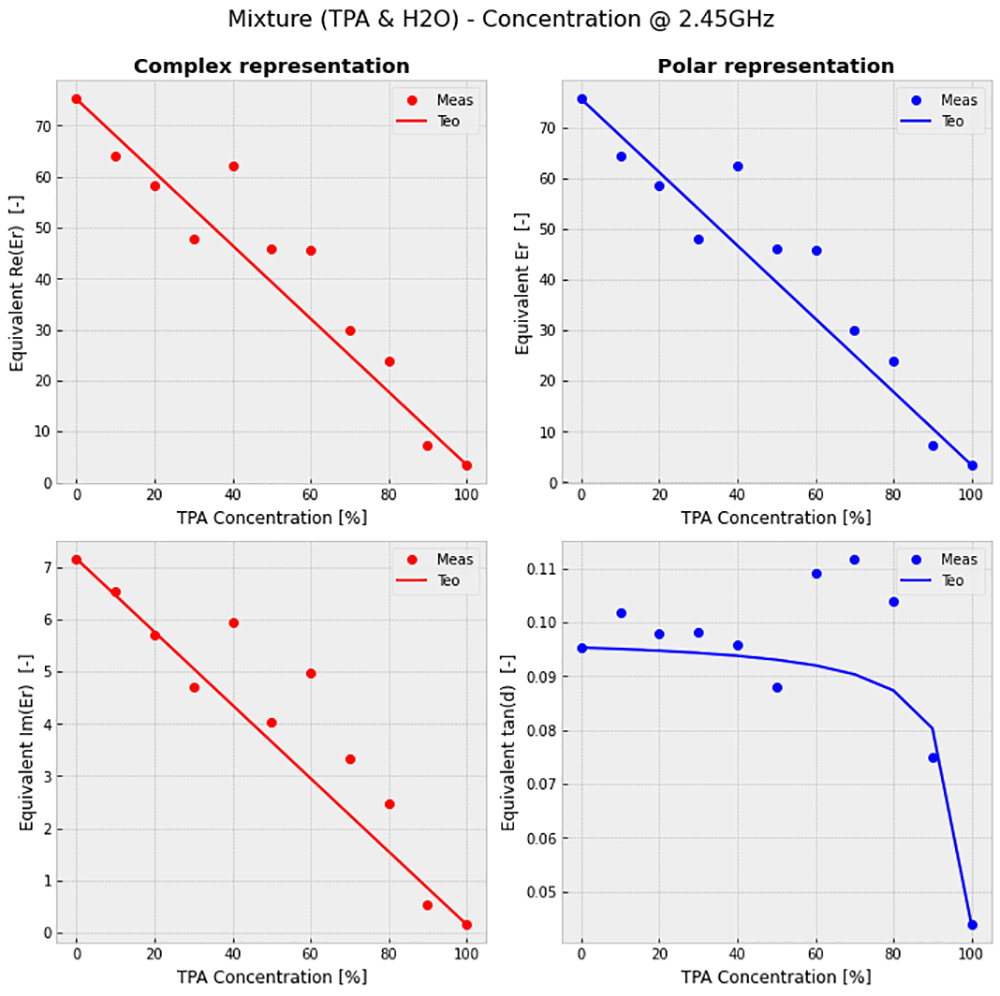
Figure 5. Mixture behaviour @30°C and 2.45 GHz.
Figure 5a (top left): Real part of the equivalent dielectric proprieties of the mixture in function of TPA concentration. Figure 5b (top right): Imaginary part of the equivalent dielectric proprieties of the mixture in function of terephtalic acid (TPA) concentration. Figure 5c (bottom left): Equivalent dielectric proprieties of the mixture in function of TPA concentration. Figure 5d (bottom right): Loss tangent of the equivalent dielectric proprieties of the mixture in function of TPA concentration.
Mathematical model validation at different temperatures
By further characterizing the two substances composing the mixture at various temperatures to which the reactor will be subjected, it is possible to model their properties as a function of concentration and temperature. Therefore, previous procedure was repeated throughout the temperature range between 30 ° C and 100 ° C, in increments of 20 ° C (Figure 6). The previous samples were preheated and maintained at the desired temperature (30°C, 50°C, 70°C, 90°C) through a water bath with controlled temperature. The hypothesized model can then be introduced in the EM simulation model (Ansys Electromagnetics version R2020 – R2) to model the final reactor. As previously stated, an alternative freely available Finite Element Method electromagnetic simulator is Elmer FEM.
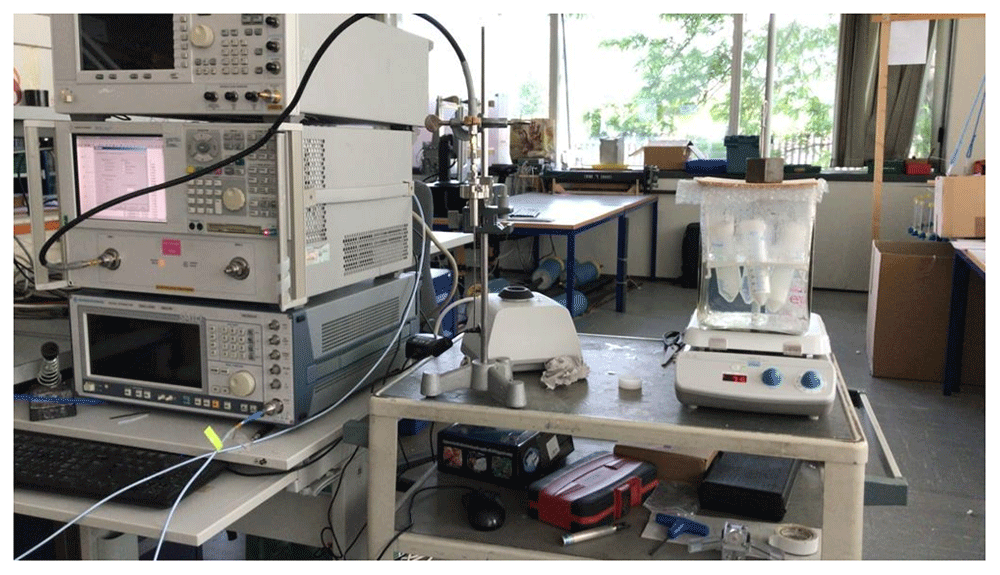
Figure 6. Measurement setup at different temperatures.
By knowing the variation in dielectric properties of the mixture as a function of temperature of the two main constituent substances, it was possible to model the mixture's behaviour so that it can be used in the electromagnetic simulator (in our case the study of the preheating process only contemplated a simulation at 4 different temperatures, therefore a precise regression curve was not necessary). Obviously, for simulations with many intermediate temperatures it would be possible to repeat a linear regression for the loss factor and a third order polynomial regression for the dielectric constant (Figure 7).
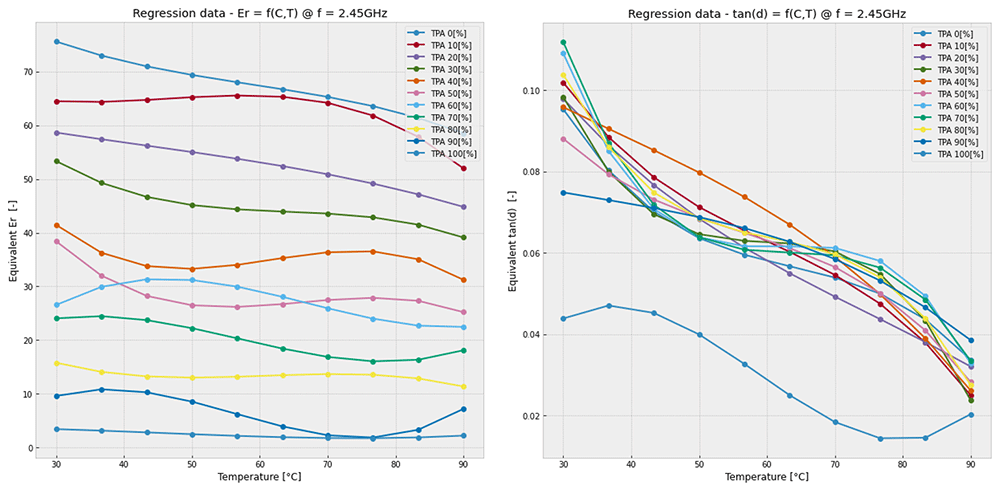
Figure 7. Mixture behaviour at different temperatures.
Left: Equivalent dielectric constant in function of temperature and terephtalic acid (TPA) concentration; right: Equivalent loss tangent constant in function of temperature and TPA concentration.
The graph in Figure 6 was obtained through polynomial regression of the measured data. Due to the miscibility and the potential for error in the data, a compensation was applied to eliminate measurements affected by an error greater than 10%. This correction was necessary because limited data were available and therefore, they could not be discarded. When the percentage of water in the mixture is dominant, the curve behaves as the water (mix 0%), as the percentage of TPA increases, the mixture tends to follow the temperature behaviour of the acid alone (mix 100%).
Comparison
The characterization of the substances that compose the mixture through these mathematical models allowed to obtain an excellent approximation of the dielectric constants without the need of a complete characterization for each concentration, therefore avoiding time-consuming problems and inaccuracies due measurement or handling errors. The same model could also be used for the approximation of the dielectric characteristics of the mixture at any temperature by knowing only the dielectric parameters of the substances at some specific temperatures. With the regression formulas it is possible to calculate the variation of dielectric properties in function of the temperature and TPA concentration and finally obtain the dielectric constants at a given temperature and concentration.
This modelling approach speeds up the characterization of a mixture, but primarily it permitted the implementation of a fully parametrizable EM model for the simulator which in turn was of great support for the study of the substance under the effect of microwaves and to simulate phenomena such as evaporation and heating.
EM simulation models
The EM simulations were performed to study the impact of the MW during the preheating and evaporation phase of the substance and to assess the need of a “dynamical matching adaptation” of the magnetron impedance to optimize the efficiency of the reactor. In addition, a study on the effect that the mechanical mixing process has on the absorption of MW in the mixture was conducted.
Pre-heating and evaporation model
For the "thermal" study, two models were created to study the efficiency of the reactor during:
heating of the mixture at constant volume, until it reaches the water boiling temperature,
evaporation of the water and the consequent decrease of the mixture’s volume in the cavity.
To simulate the change in volume due to the evaporation of the water component in the mixture, the following mathematical model was elaborated (Figure 8).
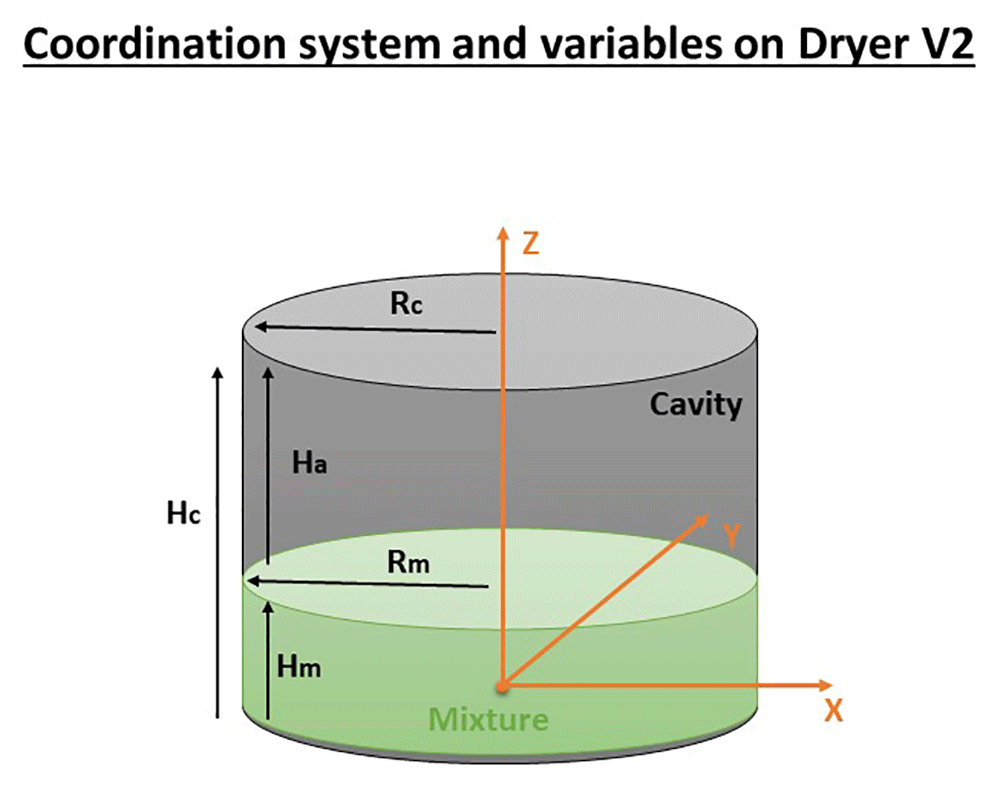
Figure 8. Thermal model.
Height of the mixture (Hm), Height of the cavity (Hc), Height of the air (Ha), Radius of the mixture (Rm), Radius of the cavity/mixture (Rm).
The volume of TPA and water can be expressed as a percentage of the mix volume:
Where:
- Vm = Volume of the mixture inside the reactor [L]
- VTPA = Volume of the TPA inside the reactor [L]
- VH2O = Volume of the water inside the reactor [L]
- αTPA = Percentage of TPA in Vm [–]
- αH2O = Percentage of H2O Vm [–]
- Am = Reactor section [m2]
- Hm = Mixture height [m]
- Rm = Mixture radius
The cavity diameter will be chosen according to the maximum penetration depth according to the formulas of the previous section (Eq. 4–Eq. 5) “Microwave dryer cavity analysis”. In order to relate the height of the cavity to the height of the mixture, a volumetric ratio between the mixture and the initial cavity height has been defined (the cavity is filled up with ~30% of mixture). During the pre-heating analysis, the volume of the mixture is maintained constant because the evaporation is neglectable therefore also the volume of air won’t change during the process. So, the cavity height can be expressed as:
Where:
For the evaporation analysis the behaviour is different, the height of the mixture at the initial state (t = 0) will begin to decrease due to evaporation according to the following formula:
Where:
- Hm(t + 1) = Next height of the mixture due to the water evaporation
- Hm(0) = Initial height of the mixture
- HH2O(t + 1) = Height loss due to water evaporation
Through this parameterization it is possible to adapt the residual volume based on the presence of water in the mixture.
Geometry dimensioning: According to the manufacturing specifications provided by DEMETO partners14, the reactor had to be as symmetrical as possible (D / H ≈ 1) and accommodate approximately 15kg of mixture. According to the theoretical calculation of the maximum penetration, the reactor had to have a height close to the maximum penetration of the MW to favour the field homogeneity and the total power absorption. Based on these criteria, initial dimensions were estimated and then refined via parametric analysis with the simulator by changing the geometrical parameters in order to reach the best power performance and a best homogeneous E-field distribution into the mixture. Table 2 compares the theoretical calculations and the simulations of the cavity size under consideration of the penetration of the MW.
Table 2. Cavity dimensions comparison with 80% of H2O.
Manufacturing constraints provided by DEMETO partners14.
| Parameter | Manufacturing
Constraint | Theoretical
calculation results
(99% absorption) | Simulator
results |
|---|
| Cavity radius | ~357mm | ~472mm | ~500mm |
| Cavity height | ~350mm | ~200mm | ~178mm |
| Symmetry ratio | ~1.02 | ~2.36 | ~2.81 |
| Working frequency | 2.45GHz | 2.45GHz | 2.45GHz |
Figure 9 shows the geometry used during the simulations for the optimization of the pre-heating and evaporation and process. Initially, the theoretical dimensions taken from Table 2 were transferred to the following model (Figure 9) and after the simulation the dimensions were adapted to optimize the pre-heating and evaporation.
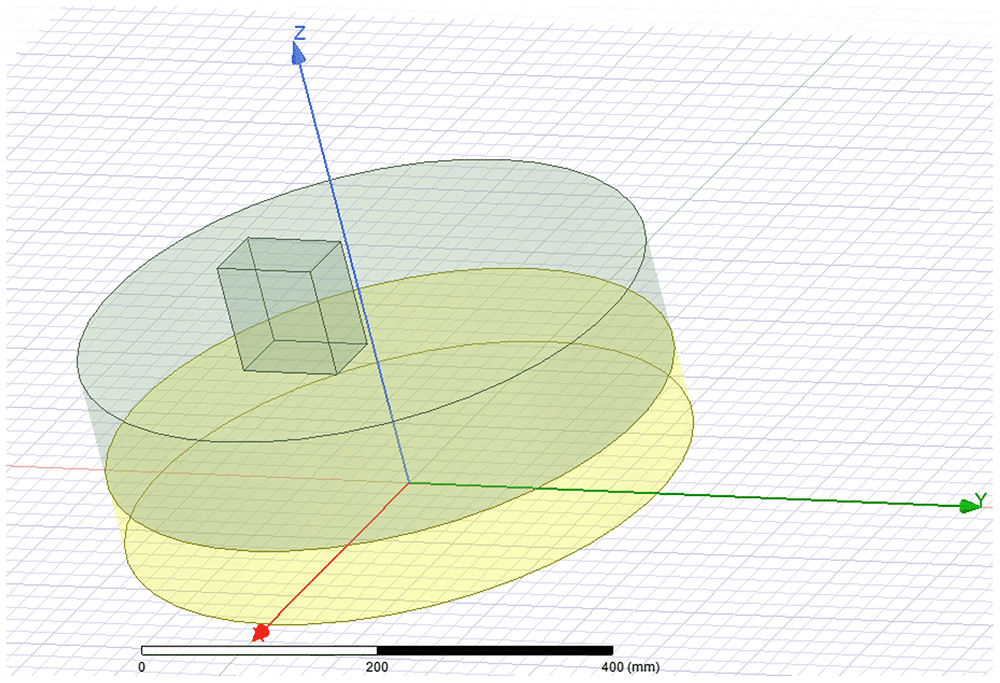
Figure 9. Ansys High Frequency Simulation Software (HFSS) – model used to optimize the dimension of the cavity according to the previous defined criteria (yellow – mixture; green – cavity air volume, green rectangle – microwave source port).
All permissions granted, author’s own figure.
Mechanical blender model
The mechanical effect of mixing (agitator effect) was simulated by creating a model that is able to vary the surface19 (based on a specific shape of the blade and its speed) of the mixture to study its impact on the power efficiency and humidity distribution. To simulate the change in surface due to the blades' shape and velocity, the following mathematical model was created (Figure 10).
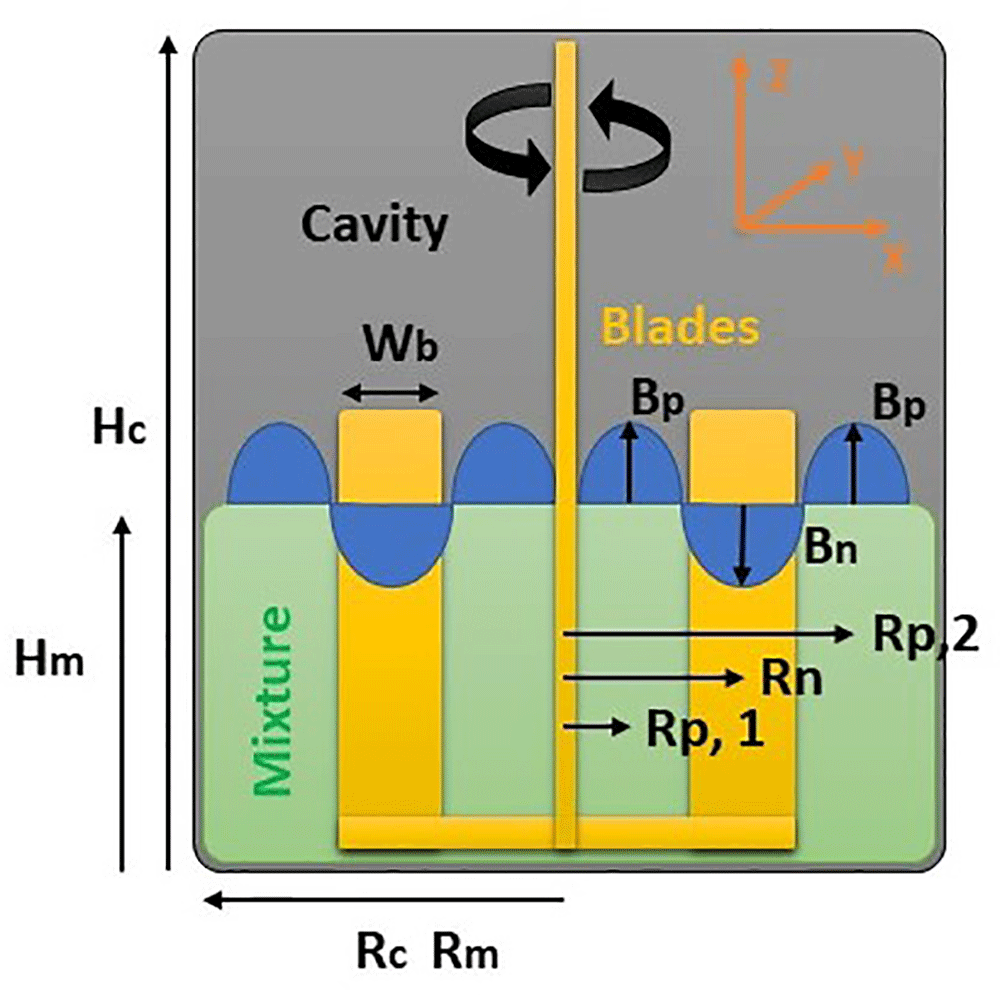
Figure 10. Blender model – Yellow cross section of the blades – Blue are the cross section of the two toroid generated by the displacement of blades.
The symbols on Figure 10 are defined as: Hc = Cavity height, Hm = Mixture height, Rc = Rm = Cavity and Mixture radius, Wb = Blades width, Rp,1 = Internal pile radius, Rp,2 = External pile radius, Rn = Blades radius, Bp,1 = Internal pile height, Bp,2 = External pile height, Bn = Dig height.
In particular, due to the motion of the mixer blades the mixture tends to form waves which tends to increase the total surface to be dried while always maintaining a constant volume.
To model the waves, three concentric toroidal geometries were used:
- Two toroids extending into the positive direction of the z-axis ("up"), to represent the wave peaks
- One toroid extending into the negative direction of the z-axis ("down"), to represent the wave trough
If the speed of the blades or its width is larger, the mixture tends to squeeze on the edges of the cavity.
This change in position of the mixture (squeezing on walls and generation of waves on surface) probably gets worse the power efficiency and the humidity distribution, because the distribution of the mixture along the circumference will change the eletric-field (E-field) distribution (the position of maximums and minimums of the E-field will change). Since the E-field variation is related to the power absorbed into the dielectric, this consequently reduces the power efficiency of the microwave source. However, only an EM simulation can confirm this assumption.
The volumes of the toroid are:
In order to maintain the same volume of the mixture the toroidal geometry must respect the following condition.
Which can be translated into the following relationship between Bn and Bp:
Results
Reactor efficiency - preheating phase
The model can emulate the effect of the pre-heating of the mixture until the evaporation occurs.
Figure 11 shows the simulation of the power efficiency during the pre-heating phase of the ANF as a function of the mixture dielectric characteristics and temperature change according to the regression curve that has been previously calculated. The relative variation of the equivalent dielectric constant of the mixture is carried out according to the previously explained mathematical model based on laboratory measurements (Figure 11).
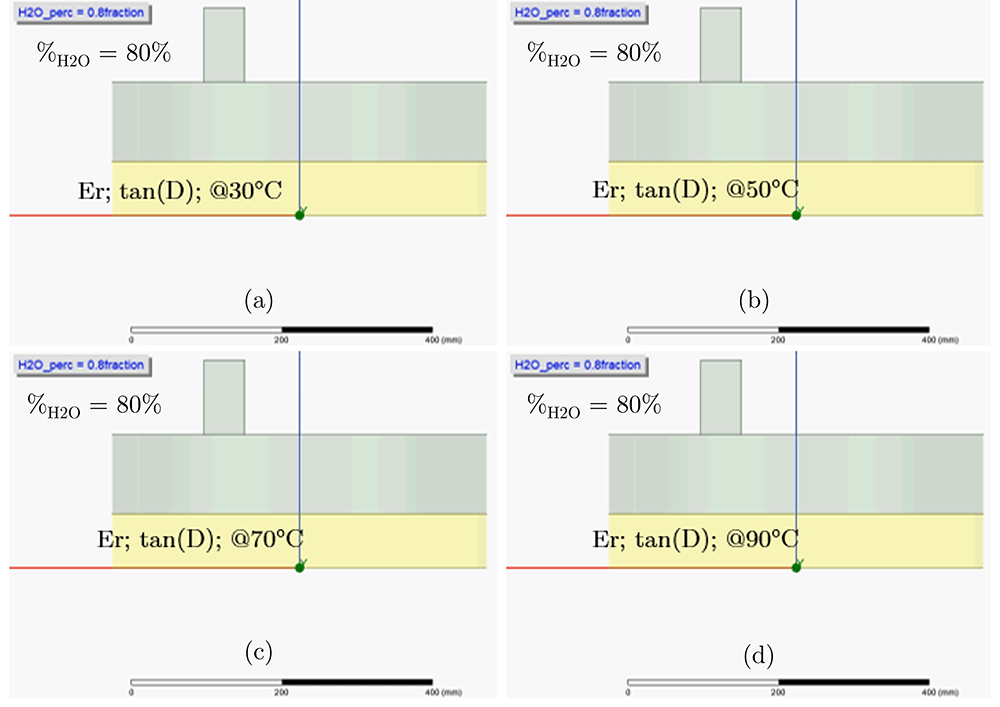
Figure 11. Ansys - 3D High Frequency Electromagnetic Simulation Software (HFSS) – pre-heating effect model from 30°C to 90°C with the mixture composed by 80% of water.
Mixture with dielectric constant proprieties calculated at 30°C (a), 50°C (b), 70°C (c), 90°C (d). All permissions granted, author’s own figure.
Since the initial concentration of water in the mixture can change according to the production parameters and the efficiency of the preceding process, a simulation of the pre-heating of the mixture was designed for each concentration (0% to 100% of the volumetric ratio between the H2O and the mixture). The obtained simulation results (Figure 12) of the VLoss (Volume loss inside the mixture) were imported into Python (see Extended data20. Every Underlying data20 are directly elaborated by the dedicated Python code. Python code for data processing was provided. The Python code is present inside the measurement folder together with measurements, “XX_YYYp_mix.prn”).
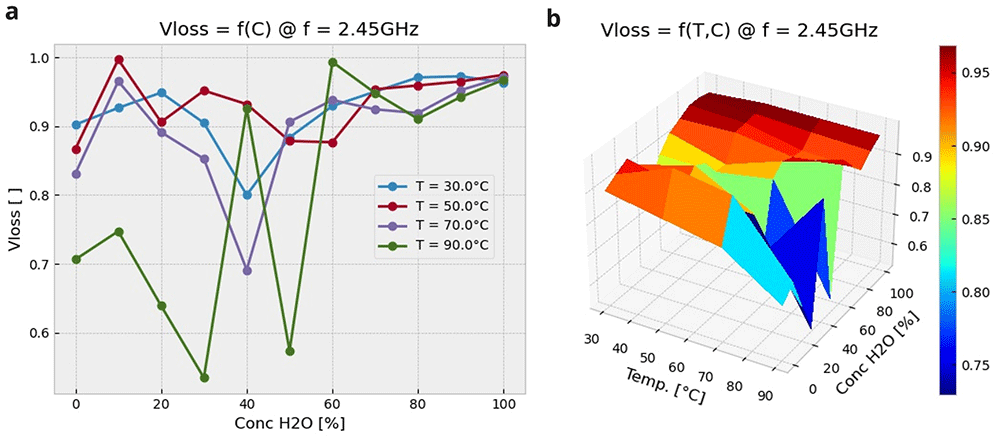
Figure 12. Preheating effect results as a function of Temperature (T) and %H2O.
(a): Vloss versus water volume concentration and temperature (2D representation); (b): Vloss versus water volume concentration and temperature (3D representation). All permissions granted, author’s own figure.
They Python code was used to obtain the variation of the reactor efficiency as a function of the temperature and of the H2O concentration.
It can be observed that heating with microwave is a very efficient approach, especially when the initial water content is greater than 50%, which is very often the case.
Generally, combining the heat generated through MW (see the HF component in Figure 1) with that which is delivered traditionally through thermal conduction from electrical resistors applied to the reactor walls, allows for drastic reduction in the drying time, and more importantly obtains a better heat distribution; this in turn will lead to a better homogeneity of the end product.
Reactor efficiency – evaporation phase
Based on the mathematical EM model described in the previous sections (see the section “Pre-heating and evaporation model”), a simulation for analysis of the microwave energy distribution has been set up in Ansys HFSS (Ansys Electromagnetics version R2020 – R2). An alternative freely available Finite Element Method (FEM) electromagnetic simulator is Elmer FEM. The simulated model is able to demonstrate the effect of evaporation of water once the process has reached its nominal operating temperature (in our simulation we used the 90°C because the dielectric proprieties at 100°C were not available). Figure 13 shows the simulation of the power efficiency and humidity distribution as a function of the mixture's volume change due to the evaporation of the water. In addition to the geometric variation due to the evaporation of water,
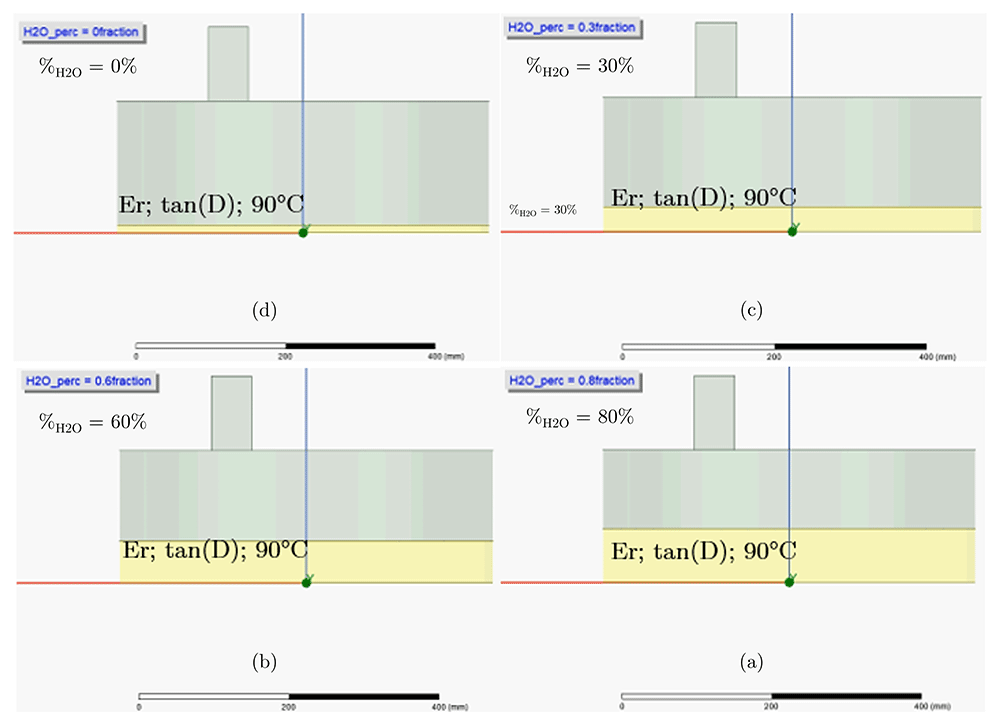
Figure 13. Ansys - 3D High Frequency Electromagnetic Simulation Software HFSS - Evaporation effect (starting from a = “wet” to d = “dry”), model at boiling temperature ~100°C.
Mixture volume calculated for 80% of water (a), 60% of water (b), 30% of water (c), 0% of water (d). All permissions granted, author’s own figure.
the simulation is also able to calculate the relative variation of the equivalent dielectric constant of the mixture by using the mathematical model previously explained.
The simulation result (Figure 14) shows how the absorption of the MW inside the mixture varies in function of the water content. This plot approximates the behaviour of evaporation over time (the time to pass from one concentration to another is unknown but it is not needed for this simulation; see blue line in plot), which in this simulation is discretized with the variation of the height of the mixture as a function of the concentration. The efficiency of the reactor never drops below 80% and averages around 90%; a dynamic matching adaptation of the impedance (between the cavity and the microwave source) is therefore not necessary for this phase of the process.
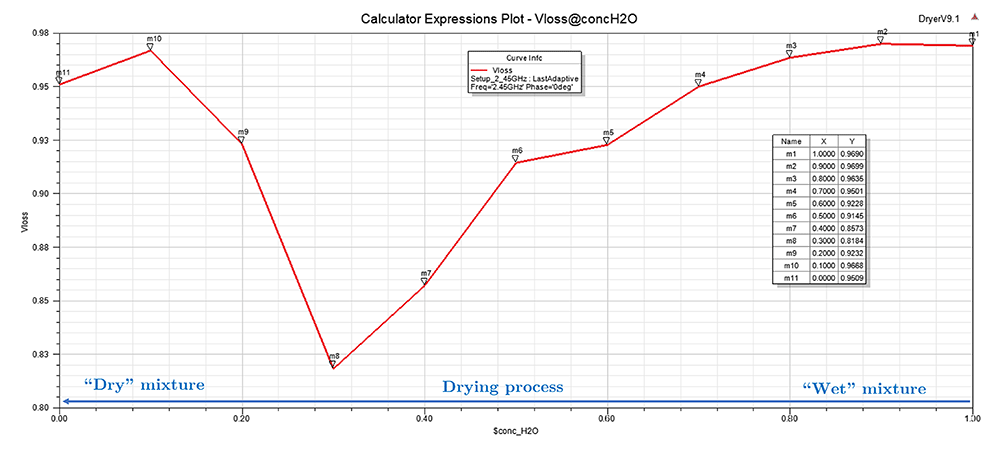
Figure 14. Ansys - 3D High Frequency Electromagnetic Simulation Software HFSS - Total absorption power (volume loss, VLoss) versus the mixture's water content at the boiling temperature (~100°C).
The variation of the electric field inside the cavity is shown in Figure 15. The field intensity increases with decreasing amounts of water. By decreasing the amount of water, the electric field is more and more homogeneous and allows the TPA to dry homogeneously.
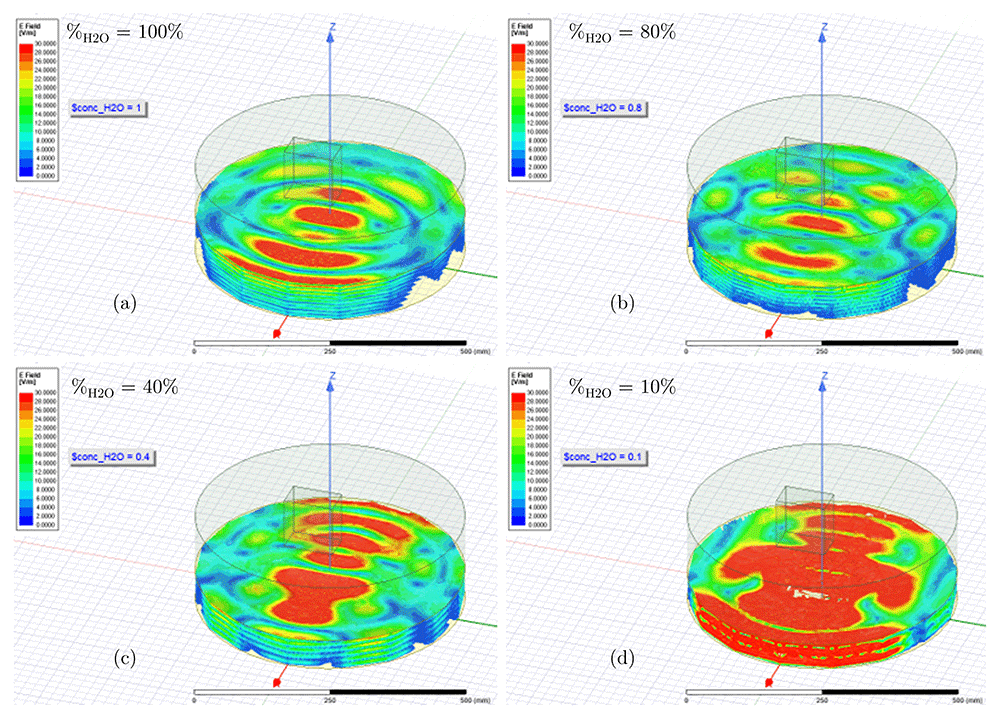
Figure 15.
Ansys - 3D High Frequency Electromagnetic Simulation Software HFSS - E-Field intensity for 100% H2O (a), 80% H2O (b), 40% H2O (c) and 10% H2O (d). All permissions granted, author’s own figure.
Reactor efficiency – mechanical blender
Based on the mathematical EM model (see section “Mechanical blender model”) described in the previous sections, a simulation for analysis the power efficiency and the humidity distribution inside the mixture has been set up in Ansys HFSS (Ansys Electromagnetics version R2020 – R2). An alternative freely available Finite Element Method (FEM) electromagnetic simulator is Elmer FEM. The model is able to demonstrate the effect of blades geometry/velocity1 on the power efficiency and humidity distribution of the mixture (this model will only take into account the displacement of the blades without considering the influence due to the metallic blades). Figure 16 shows the simulation of the blender movement as a function of the blades effect. The three toroids explained in section ”Mechanical blender model” allow to model the volume displaced by the blades and consequently the influence on the total absorption in the mixture.
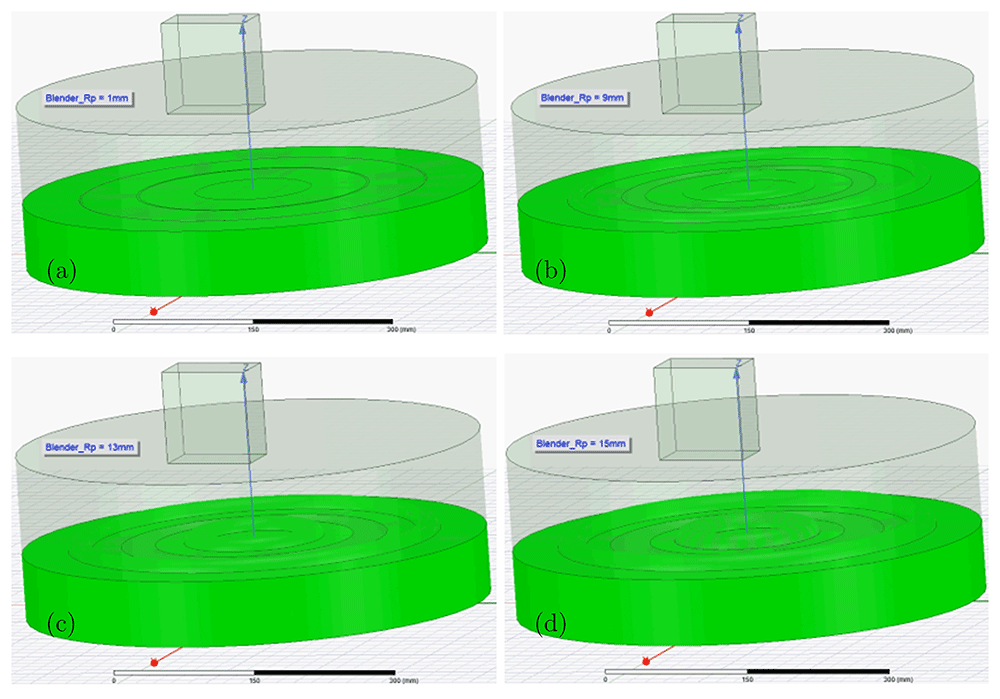
Figure 16. Ansys - 3D High Frequency Electromagnetic Simulation Software HFSS - Blender effect model.
Displacement (wave peak and wave trough) generated with different blade width/velocity: (a) 1mm, (b) 9mm, (c) 13mm and (d) 15mm. All permissions granted, author’s own figure.
In general, the use of the blades to improve the efficiency of the reactor (in terms of microwave absorption) seems of limited interest, due to the low influence on efficiency (in Figure 17, the Y axis varies from 0.97% to 0.93%). In addition, the size of the blades for this study is too complicated and depends on too many factors that cannot be taken accurately into account in the simulation model. Therefore, in this application, the mixing blades will be used only for thermal homogeneity reasons. And to prevent possible reductions in the efficiency of the reactor that have not been modelled, the blades should mix the substance very gently by minimizing their size and speed.
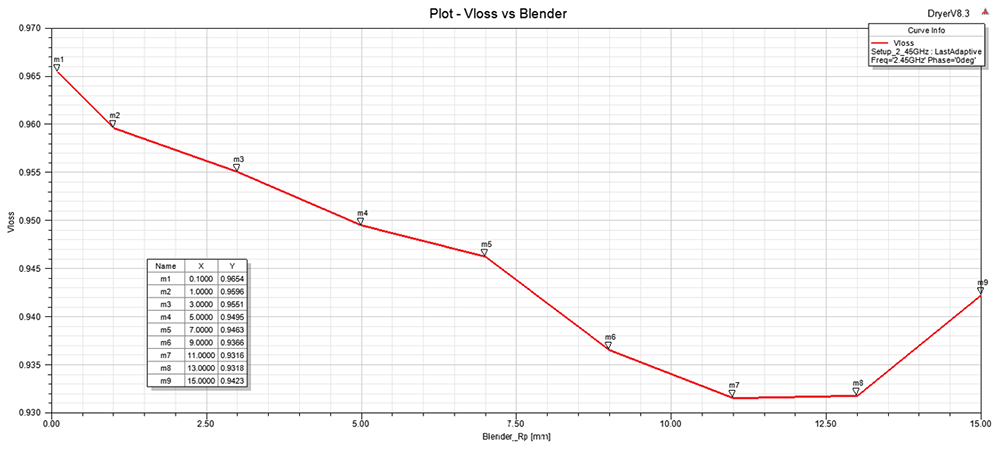
Figure 17. Ansys - 3D High Frequency Electromagnetic Simulation Software HFSS - Total power absorption (volume loss, VLoss) versus blade geometry/velocity.
All permissions granted, author’s own figure.
Conclusions
The careful modelling of certain aspects (normally not available in electromagnetic field simulators) such as the variable geometries, the mixing effect, the heating, the evaporation, as well as the dielectric proprieties characterization process has proven to be a critical, but indispensable step to be undertaken in order to obtain acceptable simulation results.
Through the study, analysis and characterization of "mixture substances" it has been possible to create mathematical models for an excellent estimation of the dielectric variations in temperature and concentration. These parametrizable models replicate the thermal properties of the whole mixture and require a minimum of tuning effort, typically consisting of a few measures or a priori knowledge of the mixture composition.
The combination of real measurements of the components of the mixture with the mathematical modelling of the dielectric material properties based on concentration and temperature, allowed for optimization of an industrial reactor (ANF) by decreasing the drying times, improving efficiency, and obtaining a better drying homogeneity, without needing costly dynamic impedance matching adaptations into the microwave circuit.
Ethics and consent
Ethical approval and consent were not required.