Plain language summary
Coastal cities are increasingly affected by climate change: flooding, summer heat, high river levels and rising sea levels. The trend is that these changes will continue and that means that these cities must increase their resilience by taking adaptive measures in addition to their contribution to reversing climate change through mitigation measures. In practice, it appears that many of these cities run into blockades against the implementation of their planned measures. That is why it makes sense for these cities to talk to each other to learn from each other about which measures are sensible and how to prevent blockades. A diagram has been developed and tested to help cities reflect their own situation and to enter into dialogue with comparable cities.
1. Background: how local circumstance can block measure
In January 2019, the H2020 ‘SOS Climate Waterfront’ project started with the following six founding cities across Europe: Lisbon (Portugal), Venice (Italy), Thessaloniki (Greece), Gdansk (Poland), Stockholm (Sweden), and Amsterdam (Netherlands) (SOS climate waterfront|H2020-MSCA-RISE-2018|823901). Over the past five years, these cities have been visited simultaneously by groups of secondees from various backgrounds. The first reports and scientific publications are available with the results of scientific multidisciplinary workshops focusing on coastal cities and climate change adaptation measures (http://sosclimatewaterfront.eu).
Given the results, the project therefore makes an interesting contribution to solving local climate problems for these cities. However, with their necessary involvement, many participants also noted that there are also blockages in each of the cities visited, which means that many of the elaborated measures are unlikely to be implemented. Unfortunately, further research into these blockages does not fit into the ‘SOS Climate Waterfront’ research project. Therefore, an exploratory study on such blockades was carried out in 2020, choosing three sites that were not part of the EU research project, as presented at the WSBE Stockholm conference and published in the conference book (Sanders & Oliveira, 2020), with the desire to implement the results in the final phase of the ‘SOS Climate Waterfront’ project.
For this spin-off research of the 'SOS Climate Waterfront' project, three locations were investigated at an early stage which were not part of the project and so not yet completed at that time: the island of Texel in the Netherlands, Madeira in Portugal, and Malta in the Mediterranean Sea. This was because comparable situations across Europe were sought, with the following objectives: 1. to develop a diagram with which the measures against climate change could be compared with each other, and 2. to further investigate whether these locations also suffer from blockades that affect the implementation of these measures, also to investigate whether this could be an underexposed, more common situation.
The results of developing and testing this diagram were: 1. the diagram with the types of measures and actors included was established as an effective tool to compare local situations, and 2. the diagram could be simpler by only using mitigation and adaptation measures. It also became clear that the blockages that hinder the implementation of measures should be included in the diagram.
Now that the 'SOS Climate Waterfront' project has almost been completed, this study can be combined with the results of the project. That is why it was developed, to create an improved diagram for application in the six cities of the project. For this purpose, the schedule has been simplified and the aforementioned blockages added. The associated research question then becomes: can the modified diagram help cities to be matched with similar cities to learn from each other for the removal of blockages, if the linking of cities is done by comparing their set of measures and using the same profiles as a basis for matching?
To this end, the following will be undertaken in sequence: explaining the research methodology, including the updating of the diagram based on a simplification of the already developed diagram and adding characterization of blockades based on the previous research (Section 2), giving an overview of the context of the scientific research the research is positioned in (Section 3), exploring its application to the six cities of the project as the results of the completed spin-off research (Section 4), and comparing the results of these cities with each other, with analysis, conclusions, data availability and grant information (Section 5).
2. Methods, and the former diagram improved
Based on the diagram developed for the 2020 WSBE conference (Sanders & Oliveira, 2020), the conclusions of this study have been used to compile an improved diagram by reflection upon group discussions within the group of Dutch researchers that participated in the ‘SOS Climate Waterfront’ project, which means that they went to one of the cities involved for multi-disciplinary workshops for a month. The improved diagram was then tested by completing it for the six cities involved in the programme, based on the research results and data of these researchers: reports, vlogs, blogs and social media announcements, all recorded under FAIR conditions. Methodologically, these research results were used to fill in the improved diagram, for which the results were then discussed in the group, checked and adjusted where necessary. After which, the analyses and conclusions were immediately worked out in the group during the same meeting. Methodically, the group members were invited to respond to each other in order to arrive at robust conclusions. Outsiders were not invited because knowledge of the cities involved and experience with the Marie Curie program were considered more important, and a mix of attendees could cloud the result.
Based on these conversations, the diagram was updated as a first step. Thereby the following improvements have been made, resulting in the diagram in Figure 1.

Figure 1. Schematic representation of climate change measures and blockages for a graded location.
1. The Measures/Actors diagram has been simplified by reducing the number of columns from three to two, whereby the combination column between 'mitigation' and 'adaptation' has been deleted. This is because combined measures in the diagram can be placed on the boundary between the two columns, which is a better choice as shown by the preliminary study (Sanders & Oliveira, 2020). Based on the DCBA model (a commonly used model in the Netherlands to rank the sustainability value of measures: D is the situation encountered, C is the improved situation, B is the almost sustainable situation, and A is the maximum sustainable situation that can be achieved, https://www.boomdelft.nl/index.php?id=116), measures with an indication of their impact are shown by using this DCBA scale in the diagram using these four rankings: shown in four shades of red, from light to dark.
2. The diagram has also been expanded to include a blockage identification section. This can be used to indicate whether an identified blockage is of a financial, physical, or social nature (horizontal axis), as well as of a local, regional, or national scale (vertical axis). The blockage is identified by placing a dot on the diagram with its impact level also following the DCBA model.
Explanation of the diagram and use: after a good description of the city and its situation, including which mitigation and adaptation measures are being taken against climate change and which blockages are observed, these can be placed in the diagram. This by using their impact scale of occurrence following the DCBA scale.
3. The context: international related scientific research
The overall picture of the impact of climate change and its increasing urgency is becoming clearer from IPCC's sequential reports since its inception in 1988. The 2019 report makes it clear that the accumulation of water-related threats to coastal cities, such as clustered rainfall, droughts, and the increasing danger of sea level rise makes cities more vulnerable (IPCC 2019, https://www.ipcc.ch/srocc/). As The Economist wrote in response to this report: “The water is coming, the world is not ready” (Economist, 2019). An annoying circumstance here is that it proves difficult to accurately predict all changes, such as sea level rise, considering all trends and local differences between cities, as elaborated for the Dutch situation, for example, in the annual climate report of the Dutch KNMI institute (KNMI 2021, https://cdn.knmi.nl/knmi/asc/klimaatsignaal21/KNMI_Klimaatsignaal21.pdf). It has also become clear that cities on the coast are experiencing the most problems from climate change, with the largest cities in the world located on the coast, and that these cities are also growing fastest in terms of population, a development that seems to continue to strengthen. This situation of large cities, and with it the situation of most of our planet's growing population, makes the effects of climate change the main concern of coastal cities (McKinseyGI, 2021). According to the six IPCC reports, from the first report from 1990 and including the most recent report from 2022, it is becoming clear that the initial focus on mitigation measures should be broadened to include adaptation measures, with the vulnerability of coastal cities logically receiving increasing attention (GCA2020 2020, https://gca.org/wp-content/uploads/2021/03/GCA-State-and-Trends-Report-2020-Online-3.pdf) (IPCC 2022, https://www.ipcc.ch/report/ar6/wg3/downloads/report/IPCC_AR6_WGIII_FullReport.pdf).
Despite the fact that it is a global development, and that many coastal city administrations are planning adaptation measures (Measham et al. 2011, Valente & Velo-so-Gomes, 2020), with local citizens' initiatives also having their own small-scale projects, separate from urban planning (Sanders, 2014), few tools have been developed to support these cities in analysing their situation and making their choices. One of the first tools is for example the ‘coastal hazard wheel' developed by Deltares, the Dutch government institute for ocean research (Deltares report 2013 and update in 2022: https://coastalhazardwheel.org/media/1388/executive-summary_coastal-hazard-wheel.pdf), that helps coastal cities to generate their hazard situation to consider adaptation measures for better resilience. Since then, cities seem to be considering more and more adaptive measures, for which more and more instruments are becoming available for finding suitable measures and making choices.
With the focus on adaptation measures, according to the various reports of the past few decades, plans are constantly being developed to reduce the vulnerability of coasts and coastal cities, for places all over the world and not least in the Netherlands, with as examples: the drawings of the Das brothers (Das & Das, 1999), urban design for cities against inner-city flooding and heat stress (TUE, 2019), strategies to make the delta’s adapt to the predicted sea level rise by giving rivers more space, strengthening the sea defences and giving cities extra situational protection (Deltares 2019: https://publications.deltares.nl/11203724_004.pdf) (WUR 2019, https://www.wur.nl/en/dossiers/file/the-netherlands-in-2120-1.htm) (TUD 2020, https://www.tudelft.nl/2022/tu-delft/vijf-toekomststrategieen-voor-de-nederlandse-delta-in-2120) and applied to the Dutch situation (Deltares 2021: https://publications.deltares.nl/11206890.pdf).
The first practice of adaptation measures by coastal municipalities shows that they encounter practical obstacles that slow down or block implementation (McKinseyGI, 2020), making comparison important for learning (Sanders & Oliveira, 2020). It is therefore important and instrumental to compare the situation of cities, including their plans for measures and possible blockades, in order to make progress in reducing the vulnerability of cities. This is not only because most people live in these cities, but also because most capital is invested in these coastal cities (McKinseyGI, 2020). An exploration of comparable scientific research yielded little, the exploration of obstacles to the implementation of adaptation measures is apparently still in its infancy, which is why beside the research presented, further research is desirable.
4. Results: the resilience of the six EU ‘SOS Climate Waterfront’ cities
The participating cities in the 'SOS Climate Waterfront' project are Lisbon in Portugal, Rome in Italy, Thessaloniki in Greece, Gdansk in Poland, Stockholm in Sweden, and Amsterdam in the Netherlands, and for each the diagram has been filled in for an initial comparison and the testing its usability.
Lisbon in Portugal
Lisbon, located on the Atlantic Ocean in the delta of the Tagus River, is an old city (1200 CE) with about 550,000 inhabitants in the city and 2.72 million inhabitants in the region. The city is affected by climate change, such as by flooding of the city centre due to overloading of the sewage system with the increasing number of heavy rain showers, increased risk for the expensive apartment complexes on the ocean side in the event of sea level rise and also the resulting threat to bird diversity, also quantitatively in the river area south of the Tagus. The draining of water from the river on the Spanish side of the border for the irrigation of the southern Spanish provinces results in extra low water levels in the summer, which puts southern Portugal’s own irrigation at extra risk and makes the riverbed a foraging area for the birds and the fresh water is endangered in the Lisbon region.
The earthquake and tsunami of 1755 reminds the inhabitants of Lisbon that the sea is close by and can strike. That is why the municipality has made the contour line up to the place where the tsunami struck visible with a line in the city centre, to alert residents to their vulnerability to climate change. According to the municipality, this visual reminder should also encourage residents to cooperate in the necessary measures to be taken. In the meantime, physical measures have already been taken to improve the drainage of the city centre, for which new underground sewage pipes have been installed to the sea. For the drainage of the city's surroundings, the plan has been developed to make old rivers that are completely dry in summer wider and deeper, so that the drainage is secured again. These interventions also create accessible recreational zones, for support among local residents. The most far-reaching measure is that the municipality has decided that no more homes may be built below this tsunami limit, and that the homes that are there will gradually be replaced by less vulnerable buildings. In this way, the municipality wants to reduce the financially negative effect of the sea level rise in coming decades. Homes will then be replaced by public buildings of a more temporary nature, such as schools and hospitals, because practice shows that such buildings have to be replaced regularly. The drinking water company is also constructing water depots upstream of the Tagus for dry periods. Due to the heat in the summer in the city, which especially affects the elderly, green zones are already being created to counteract the heat build-up in the summer. The city of Lisbon is not very active in taking measures against greenhouse gas emissions. For example, there are no solar panels in the city or in the surrounding countryside, and the number of wind turbines is scarce. The reason is that energy consumption is low in winter due to the mild climate and the coolness of the ocean in summer.
The municipality does not experience any particular obstacles in implementing the aforementioned inner-city measures, because the measures immediately reduce the negative effects of climate change. The planned transformation of the city by the sea below the tsunami line is experiencing a lot of resistance, because the residents don't want to change the historical image of the downtown area and because they don't understand their vulnerability. Consultations with Spain about the unilateral draining of the river are also progressing badly. These blockades hinder efforts to make the city and the region resilient to the effects of climate change [source: interview with research institutes and municipal representatives by F. Sanders] (Sanders, 2020a). This situation characterizes the city of Lisbon, with the measures taken against the effects of climate change and the blockages that occur, with its measures and impact and blockage levels, as elaborated in the diagram of Section 2, see Figure 2.

Figure 2. The completed diagram for Lisbon in Portugal.
Rome in Italy
The Rome of 753 BCE, located on seven hills along the Tiber River with about 3,000,000 inhabitants, is located on the sea thanks to its sister city Ostia. Over the centuries, the city has been expanded on both sides of the river and is still expanding. Land for the urban expansion is scarce, so it has to be built close together. Only the old centre is spared because the historic city is largely protected as a UNESCO world heritage site. As a result, climate change has a major impact on life in the city, partly because the river is getting increasing water levels due to the upstream canalisation, and in summer the heat in the city lingers for a long time, which especially affects the elderly. A start has therefore been made with greening the city, parks are being refurbished, facades are clad with new architecture, and the buildings along the riverbed are being pushed back. However, effective measures are not forthcoming due to monumental limitations. Despite the fact that Rome is not on the Mediterranean Sea, it is predicted that the sea level rise will still cause problems, because the river will experience more backwater at a higher sea level. That makes the situation more critical. Nevertheless, the population does not sit still and shows its involvement in the sustainable task by participating in many small-scale initiatives: increasing purchases of sustainable products in the field of food, clothing, and participation in recycling projects such as repair cafes, and an accelerated increase in electric driving. In the field of 'mitigation', on the other hand, the city still has few solar panels and wind turbines, because that is only possible to a very limited extent due to the protection of the cityscape’s monuments. As based on the information of the blogs of Karel Mulder and the drawings of Germaine Sanders (Mulder, 2022), both secondees from CPONH NGO who participated in the spring 2022 Rome event of the 'SOS Climate Waterfront' project. For the characterization of these climate-related measures and local blockades of the city of Rome, see Figure 3.

Figure 3. The completed diagram for Rome in Italy.
Thessaloniki in Greece
Thessalonica of 315 B.C. is on the river Vardar and has about 350,000 inhabitants, located along the rivers Axios and Vardar on the Thermaic Gulf in the north-western corner of the Aegean Sea in open connection with the Mediterranean Sea. Sea level rise in the Mediterranean is still small and the prospects are not alarming. However, due to the wind, the water level in the Aegean Sea occasionally rises to higher levels, leading to flooding situations in the city in case of simultaneous high river level due to increasing occurrences of days of heavy rainfall. In addition, the population suffers increasingly from heat stress during the long summers because the heat lingers in the city. A plan of measures has been made to address these problems, unfortunately not only the aboveground city but also the underground city falls under the status of UNESCO world heritage. In fact, the city has been built on the historic remains of former cities. As a result, the implementation of necessary measures is almost impossible. As based on the information of the blogs of Jelle-Jochem Duits, secondee from CPOH NGO (Duits, 2019). Recently, the municipality of Thessaloniki started planning mitigation measures that should not be blocked by heritage regulations. It started reducing the city's carbon footprint by participating in the EU-wide '2050 Climate-friendly Mobility in Cities' project to encourage residents to purchase more e-cars, and despite local restrictive UNESCO terms, it began adaptation planning through the 'Strategic Plan for Sustainable Urban Development of the Metropolitan Area of Thessaloniki'. As a result, citizen adaptation initiatives have been started around green architecture. For the characterization of the climate-related measures and local blockades of the city of Thessaloniki, see Figure 4.

Figure 4. The completed diagram for Thessaloniki in Greece.
Gdansk in Poland
The city of Gdansk, with a population of 500,000 inhabitants, is located at the eastern end of the Baltic Sea, west of the wide Vistula delta. The western tributary of the Vistula River that flows through the city of Gdansk, called Martla-Wistla, has been cut in the past to reduce the river height downstream in the city. Nevertheless, the water level in the river is higher during the rainy season due to the inflow of small tributaries. The second river Motlawa also has a considerable rise in level during periods of heavy rainfall because it is also fed upstream by many small rivers. As a result, the inner city of Gdansk regularly experiences major flooding, past and present, the effect of which is amplified when the water level in the Baltic Sea is raised by backwater in the eastern funnel-shaped outlet on which the city is located. The expectation is that the sea level rise resulting from climate change will exacerbate this situation. To reduce the inflow of river water, flood plains have been constructed upstream of the Motlawa River to mitigate high water levels. Unfortunately, the effect of this is still too limited for the time being, as a result of which, flooding occurs regularly, especially in the city centre (Sanders et al., 2021). The floods of 2001 opened the eyes of the local population and the municipality, but effective solutions are not yet in sight. The major blocking circumstance is that Gdansk as a city receives little or no financial contribution from the national government because of differences in political views. Meanwhile, the expansion of the city and renovation of large-scale housing facilities restoring the old warehouses are in development along the riverbank. The harbour port in the delta on the Baltic Sea is also in development due to new economic prospects. Mitigation measures, on the other hand, receive relatively little attention. As based on the information of the blogs of Hugo Sanders, secondee of CPONH NGO (Sanders, 2020b). For the characterization of these climate-related measures and local blockades of the city of Gdansk, see Figure 5.

Figure 5. The completed diagram for Gdansk in Poland.
Stockholm in Sweden
Stockholm on the Baltic Sea, which is located on an archipelago of islands, has a population of 900,000 residents in the city and 2 million in the region. Even though the city is active with regard to sustainability issues, it will not be affected by sea level rise because the Scandinavian soil rises faster by bouncing back after the melting of the kilometre-thick ice pack of the last ice age. Stockholm became a European green capital in 2010 and has been free of carbon energy sources since 2020. which has resulted in a huge reduction in greenhouse gas emissions, bringing the target of net zero emissions by 2040 in sight. The higher temperatures in the city in the summer are also not a real problem because they are still relatively low. The population takes responsibility for city sustainability on its own, which is evident from the enormous increase in shared cars. The task that remains is to make the buildings and apartment complexes more sustainable and to realize green new construction to keeps the green area in the city up to standard. Partly in view of the fact that Stockholm has many green energy resources, and is a relatively rich country, there are actually no special obstacles to the measures taken. Based on report by Karen Jonkers, secondee of CPONH NGO (Jonkers & Bregman, 2022). For the characterization of these climate-related measures and local blockades of the city of Stockholm, see Figure 6.

Figure 6. The completed diagram for Stockholm in Sweden.
Amsterdam in the Netherlands
The Amsterdam region with about 1,500,000 inhabitants, and the same number of tourists every year, faces all the problems associated with climate change (sea level rise, heavy rainfall, heat stress in the summer, and subsidence of 0.01 metres per decade). This subsidence is the effect of the settlement of the 10 meters of peat on which the city is built. Nevertheless, the city is working on the enormous housing need (of a more than 50% increase) because, with the tourists, the city quickly becomes overcrowded in the summer. The nuisance caused by the rising summer temperature in the city is therefore all the greater. In the Netherlands, a national project is underway to significantly reduce greenhouse gas emissions, which is mainly due to the many hundreds of wind turbines that are being installed in the North Sea. Possibilities for fields of solar panels and the installation of wind turbines on land are met with a lot of resistance due to the lack of available space. Individual households and companies, on the other hand, invest in solar panels and heat pumps, partly thanks to a national subsidy project. The Netherlands has a relatively large population for a small country and also has a large agricultural sector. Every square meter of soil can be given multiple uses due to the great need of land. Due to the increasing rainfall in the winter period, water collection must also be ensured in the city, for which there is little space. In the region around Amsterdam, collection, and storage (of fresh drinking water) is going better, but the lack of free space is also an obstacle to satisfactory results there. Measures due to the rise in sea levels have not yet been taken, mainly because, since the flood disaster of 1953, there has been every confidence that the Netherlands would be protected against any danger from the sea for the time being. It is slowly becoming clear among the population that the sea level will continue to rise and that with the added subsidence it will be necessary to intervene in coastal defences. Dutch universities have presented plans for this, but the relevance has not yet been embraced by the government adviser, the Delta Commissioner. Meanwhile, the agricultural sector has to contend with salinization and the country is struggling with flooding due to the increase in rainfall in short periods and with longer periods of drought in the summer. Based on the EU paper (Sanders et al., 2021). For the characterization of these climate-related measures and local blockades of the city of Amsterdam, see Figure 7.

Figure 7. The completed diagram for Amsterdam in the Netherlands.
5. Conclusions, the analysis of the research results included
According to the 'UN Atlas of the World', eight of the world's ten largest cities are located on the coast and 44% of the world's population lives in vulnerable coastal areas. This means that the resilience of coastal cities and their inhabitants to climate change is becoming increasingly important. The importance of adaptation measures is also implicitly becoming more important, especially now that the IPCC has recently issued a signal that the 1.5C standard of the Paris Agreement (CoP2015 2015, https://unfccc.int/sites/default/files/english_paris_agreement.pdf) will not be met (KNMI 2021, IPCC 2023, https://www.ipcc.ch/report/ar6/syr/downloads/report/IPCC_AR6_SYR_LongerReport.pdf). It is therefore implicitly important that adaptive measures are taken in the most vulnerable coasts and coastal cities to increase resilience.
The need to pay more attention to the resilience of coastal cities is the main reason why the H2020 Marie Curie project 'SOS Climate Waterfront' was started in 2019. Now that the project has largely been completed, it seems logical to use the observations from the cities researched as a basis for the further development and testing of the diagram instrument that maps local measures, and to do it in such a way that cities can be matched with each other with the intention of comparing any obstacles to implementation of these measures. This will give cities the opportunity to learn from each other in dealing with these obstacles. This will be mainly to test whether the diagram is sufficient on the basis of these six cities. Secondly, it will give the cities participating in the project the opportunity to immediately learn from the results.
For this purpose the diagrams (as they have been worked out for the six above-mentioned cities and regarding measures taken locally) have, by analysing these in the group of program participants (read ‘methods’ Section 2), been placed in relation to each other, resulting in matches which are the most obvious as explained in ‘analyses’, see Figure 8.
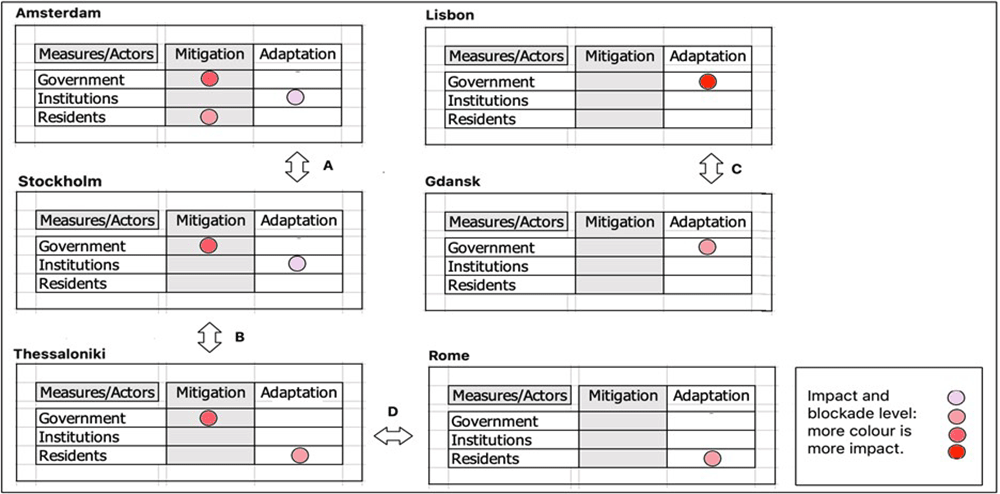
Figure 8. The combinations of cities according to their comparable mitigation and adaptation measures.
Analysis
By comparing the six elaborated diagrams for the six cities of the EU project 'SOS Climate Waterfront', four obvious combinations can be made of comparable cities based on the cities' mitigation measures and their adaptation measures. Amsterdam and Stockholm are both (1) in a phase where adaptation measures are being presented by research institutions, including universities, and both have mitigation measures taken by the government, including the municipality. Only in Amsterdam do the residents take their own mitigation initiatives. Second (2), Stockholm and Thessaloniki are similar because in both situations the municipality is the initiator of mitigation measures, although the adaptation measures initiatives do not match. Third (3) Lisbon and Gdansk have, in fact, a very similar situation where the government is the only one taking adaptation measures and mitigation measures are lacking. For Rome and Thessaloniki (4), it is the residents who take adaptation measures. These combinations can be used by the cities to learn from each other about their approaches to stimulating mitigation and adaptation measures and to achieving local goals. The blocking factors can then also be exchanged and discussed in order to learn from each other how to deal with them.
Based on these combinations, the situational reasons for the identified blockades may become clear or can be effectively investigated. For instance: 1. Amsterdam and Thessaloniki can learn from Stockholm’s adaptation and mitigation measures, already developed without blockades, 2. Thessaloniki and Rome run into similar serious blockages, which would be a good reason to discuss these in relation to each other to find solutions and mobilize adaptation measures more successfully, and 3. Lisbon and Gdansk should learn from each other by comparing their mitigation and adaptation measure combinations, but their blockades are so different that it is to be doubted whether a comparison would make sense.
As the results show, by observing the cities that were part of the ‘SOS Climate Waterfront’ project, a conclusion could be that many blockages could have been identified and resolved (possibly) earlier through communication with other cities in comparable situations. This could also have led to more well-prepared measures being implemented faster and more easily, thereby making these cities more resilient.
Conclusions
It can be cautiously concluded that the improved diagram helps to connect comparable cities on climate measures and start a process of mutual learning. Learning from each other to remove obstacles to the development and implementation of mitigation and adaptation measures, and to implement the measures themselves, becomes faster and better. With the limiting factor (and therefore the caveat) that the diagram has only been tested on the basis of these six cities, and the number of combinations being limited. It is therefore advisable to further test the diagram as an instrument on other groups of cities to develop it further and not overvalue it as a tool in the short term. Nevertheless, as a tool it can already be helpful to cities because it can help them enter into a selective conversation with each other. These conversations themselves can lead to a deeper understanding of the climate challenges facing them but also better ways of finding solutions to them.
Data availability
The data used to test the diagram from Section 3 is the result from the Dutch participants in the ‘SOS Climate Waterfront’ project, being deliveries as there are created reports and blogs. In all these deliveries names of the interviewed, if this was the case, are de-identified following the Safe Harbour guidelines. Researchgate has been used as a database because it is easily accessible to researchers and a DOI can be added, and only a few documents have to be stored. To improve the diagram itself, scientific peer-reviewed publications, including publications of our own hand, were used and these are mentioned in the list of references. Reports from institutions used for the background information, methods and context explanation (Section 1, Section 2 and Section 3) are placed with a hyperlink in the text.
Faculty Opinions recommendedReferences
- Das R, Das R:
Visions of the future, a new golden age for the low countries. Tirion-Baarn, 1999.
- Duits JJ:
Thessaloniki Secondment report. CPONH NGO - in Research-Gate: 2019.
- Economist: Briefing rising seas, August 17th 2019. 2019.
- Jonkers K, Bregman M:
Stockholm climate-proof for the next 100 years. CPONH NGO report - - in Research-Gate: 2022. Reference Source
- McKinseyGI: Can coastal cities turn the tide on rising flood risk. McKinsey Global Institute, report, 2020. Reference Source
- McKinseyGI: Protecting people from a changing global climate, the case for resilience. McKinsey Global Institute, report, 2021. Reference Source
- Measham TG, Preston BL, Smith TF, et al.:
Adapting to climate change through local municipal planning: barriers and challenges.
Mitig Adapt Strateg Glob Chang.
2011; 16: 889-909. Publisher Full Text
- Mulder K:
Blog-collection on climate change in Rome. CPONH NGO report. 2022. Reference Source
- Sanders FC:
Duurzame ontwikkeling door collectief bewonersinitiatief (English: Sustainable Development through Resident’s Collective Initiatives). Delft Un. of Techn. PhD-dissertation. 2014. Reference Source
- Sanders FC:
Secondment report of visiting Lisbon in 2019. CPONH NGO 2020a. Reference Source
- Sanders FC, Oliveira AC:
Resilience of coastal cities with accumulating climate change coupled threats; depends on the cooperation of government, experts and the citizens. BEYOND22 WSBE conference in Stockholm. 2020. Publisher Full Text
- Sanders FC, Sanders HHC, Jonkers K:
Crossover comparison of climate-change adaptation measures taken in the Gdansk (Baltic-sea) and Rotterdam (Nord-sea) deltas [version 2; peer review: 3 approved].
ORE.
2021; 1(9): 9. Publisher Full Text
- Sanders HHC:
Climate change impact on Finland. CPONH NGO report. 2020b.
- TUE: Meebewegende flexibele Stad (English: Participation flexible city), Eindhoven University of Technology, report. 2019.
- Valente S, Veloso-Gomes F:
Coastal climate adaptation in port-cities: adaptation deficits, barriers, and challenges ahead.
J Environ Plann Man.
2020; 63(3): 389–414. Publisher Full Text