Introduction
Imagine you are faced with a difficult choice such as moving to a new place, quitting your current job, investing in a new hedge funds or getting a neck tattoo. What can make these decisions so difficult is not only the individual responsibility you will bear for the potential consequences, but also the desire to be in control of your choices. Many people would probably not want to flip a coin or let someone else choose for them. Previous studies have shown that people prefer to be autonomous and have control over their decisions and actions from a very early age (Leotti et al., 2010; Murayama et al., 2015; Murayama et al., 2016), even when this autonomy comes with emotional costs (Botti & Lyengar, 2004; Botti & McGill, 2006). Autonomy may look more or less attractive across cultures (Nanakdewa et al., 2021), but accepting to decide with a small group of friends or neighbors seems ubiquitous across times and cultures (Blunden, 2017). While previous studies have compared how people make collective or individual choices by putting them in either situation, we know less about why and when people prefer to join groups or decide alone, when they are given the choice (El Zein et al., 2019a). Collective decisions may result in better decisions when the appropriate conditions are met (Bahrami, 2018). They may also reduce the stress and burden of individual responsibility, especially when faced with possible losses. Empirical evidence here confirmed that, during risky decisions, people’s feelings of regret and responsibility encourage them to turn to collective decisions (El Zein & Bahrami, 2020). But what explains the variability in such choices?
A first explanation would be that humans have different stable inclinations towards collective or individual decisions depending on how much they value social bonding over their personal control. A second prudential explanation could, particularly for those with no or weak fixed preference towards collective or individual decisions, have to do with lack of confidence and prospects of facing losses. Here, we assess whether tendencies to decide alone or in groups are stable, and whether personality traits could explain these tendencies. We then examine the impact of two motives on people sometimes deciding alone, and sometimes joining a group: how sure they are that they got things right on their own, and whether they are faced with gains or losses.
To arbitrate between these explanations, we ask participants to first solve a perceptual problem, by telling whether a set of moving dots were moving left or right, knowing that their correct answer would either allow them to win money, or avoid losing money. After entering their response and level of confidence, they can choose either to face the consequences of their individual decisions, or pool their answer with four other people’s answers, and let the collective decision determine the outcome. After this, they indicate how much responsibility they feel they add in the outcome. Even though non-interactive, pooled answers are considered as a form of collective decision, similar to voting and choice aggregations, as the final choice reflects the contribution of several individuals constituting a group.
The first aim of the study is to identify whether and which individual differences play a role in the tendency to make a decision alone or as a group. While there is literature on people’s behaviour once placed in a social context (Bahrami et al., 2010; Bahrami et al., 2012; Koriat, 2012; Kurvers et al., 2016; Mahmoodi et al., 2015; Molleman et al., 2019; Navajas et al., 2018; Prelec et al., 2017), participants are seldom asked whether they prefer to decide alone or as a group. As an exception, one study that did, revealed that humans differ in their preferences: approximately half of the participants prefer to choose either option (alone or group) more than 80% of the time, suggesting a fixed preference, while the other half showed a more flexible behavior (El Zein & Bahrami, 2020). To examine if these preferences are stable, and reflect a dispositional trait of the individual, we will conduct a test-retest study and collect relevant measures to see whether individual traits explain the tendency to be individualistic, collectivistic or flexible (see Figure 1 and Table 1, Hypothesis 1a–e). We selected individual measures related to self-assessment on one hand: self-efficacy (Schwarzer & Jerusalem, 1995) and self-esteem (Rosenberg, 1965); and measures related to social motives on the other hand: social conformity (Mehrabian & Stefl, 1995), closeness to others in the group (Aron et al., 1992) and proneness to reduce responsibility in a group (measured as described in Methods).
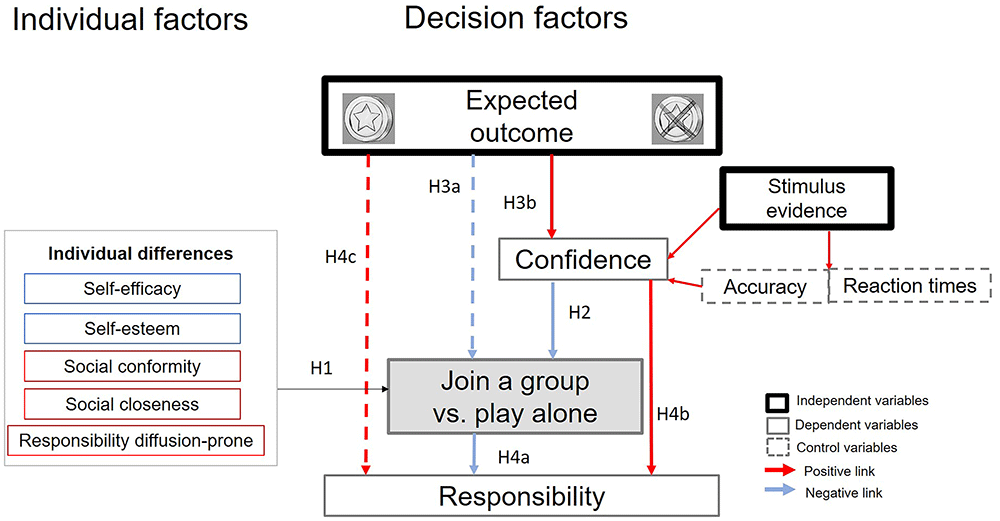
Figure 1. Summary figure of hypotheses showing the predicted influence of individual and decision factors on the choice to play alone or as a group.
Arrows indicate the directions of relationships with the hypotheses that will be tested. Full arrows indicate hypotheses that were validated by the pilot study (H2, H3b, H4a-b) allowing us to calculate the required sample sizes while dotted arrows indicate the hypotheses that were not validated in the pilot study and therefore not used to calculate sample size. Rectangles around individual differences are coloured based on the predicted positive (red) or negative (blue) influence on joining groups. Individual factors refer to between-participant analyses (trait), whereas decision factors refer to contextual/state manipulations.
Table 1. Design table.
| Question | Hypothesis | Sampling plan (e.g.
power analysis) | Analysis plan | Interpretation given to different outcomes |
|---|
Which individual
trait differences
explain the
tendency to decide
alone or as a group? | H1a The higher reported self-efficacy, the
less joining groups. | Between 525 and 640
participants included
based on exclusion
criteria | GLM with all individual measures
as predictors of the proportion to
join the group in each participant. | If significant negative parameter estimate, then high self-
efficacy trait is associated with the tendency to decide
alone and lower group joining. |
H1b The higher reported self-esteem, the
less joining group. | If significant negative parameter estimate, then high self-
esteem trait is associated with the tendency to decide
alone and lower group joining. |
H1c The higher reported social conformity,
the more joining groups. | If significant positive parameter estimate, then high
social conformity trait is associated with the tendency to
join a group. |
H1d The higher fusion with other
participants, the more joining groups. | If significant positive parameter estimate, then fusion
with group members is associated with the tendency to
join a group. |
H1e The more responsibility dilution prone,
the more joining groups. | If significant positive parameter estimate, then dilution
proneness is associated with more group joining,
showing that reducing responsibility may be an
important motive to join the group. |
What predicts
deciding alone or
joining the group
on a trial by trial
basis? | H2 The lower people’s decision confidence
in the perceptual task (dissociated from
their accuracy, decision evidence and
reaction times), the more often they will join
a group. | Power analysis based
on pilot: 72 participants
required to achieve 99%
power | 1) Logistic regression within
each participant: outcome=join
a group, predictors= expected
outcome and confidence rating,
control predictors: Accuracy, dots
coherence and reaction times.
2) For H3b, GLM within each
participant: outcome=confidence,
predictor=expected outcome,
control predictors: Accuracy, dots
coherence and reaction times. | Significant mean negative parameter estimates of
confidence variable against zero would indicate that
the higher confidence, the more deciding alone and the
lower confidence the more joining groups. |
H3 A loss vs a win expected outcome will
lead people to join groups more often:
- H3a: Directly influencing the decision to
join a group.
- H3b: Indirectly: Negatively valenced
context (avoiding a loss) will decrease
confidence when compared to positively
valenced contexts (Seeking a gain)
Decreased confidence will then increase
joining groups (H2). | H3a Not confirmed in
the pilot study – no
sample size calculated.
H3b Power analysis
based on pilot: 210
participants required to
achieve 99% power | Significant mean negative parameter estimates of
expected outcome in the first regression against zero
would indicate that negative expected outcomes directly
increase joining groups independently of confidence.
Significant mean positive parameter estimates of
expected outcome against zero in the second GLM
would indicate that positive expected outcomes increase
confidence and negative expected outcomes decrease
confidence. Then, low confidence increases joining
groups (if H2 validated). |
What predicts
responsibility
ratings on a trial by
trial basis? | H4a Joining a group will decrease feelings
of responsibility over potential outcomes as
compared to deciding alone. | Power analysis based
on pilot: 32 participants
required to achieve 99%
power. | GLM with outcome=
responsibility ratings, and
predictors=join a group, expected
outcome and confidence rating,
control predictors= Accuracy,
dots coherence and reaction
times | Significant mean negative parameter estimates of join a
group regressor against zero would indicate that joining
a group decreases responsibility ratings. |
H4b The higher the confidence on a specific
trial, the higher the responsibility ratings
whether playing alone or in group. | Power analysis based
on pilot: 31 participants
required to achieve 99%
power. | Significant mean positive parameter estimates of
confidence regressor against zero would indicate that
confidence increases responsibility ratings. |
H4c A loss vs a win expected outcome will
decrease feelings of responsibility (change
in responsibility for the expectation –rather
than reception - of an outcome) whether
playing alone or in group. | Not confirmed in the
pilot study – no sample
size calculated. | Significant mean positive parameter estimates of
expected outcome regressor against zero would indicate
that a positive vs negative expected outcome increases
responsibility ratings. |
Having established how much preferences for collective or individual decisions reflect a personal trait, we examine which contextual factors can make those with no or weak such preferences flexibly choose one or the other (see Figure 1). Here we propose to compare the motive of accuracy to that of sharing responsibility. If flexible individuals accept collective decisions because they can improve their accuracy, they should do so when they realize their own decision could be wrong. In the absence of immediate feedback—which is the case in many real-life decisions—how one assesses their own accuracy can be measured by trial-by-trial confidence ratings (Fleming et al., 2012). Thus, we predict that in socially flexible individuals, low confidence should be associated with increased decisions to join a group (Hypothesis 2). Importantly, this strategy would highlight another “social” component of metacognition (Shea et al., 2014), as people with better insight in the reliability of their own decisions could be more strategic in deciding when joining a group could improve their chances of being right. If individuals are also motivated to join a group to share responsibility when they anticipate a negative outcome (El Zein et al., 2019a; El Zein et al., 2019b; El Zein & Bahrami, 2020), they should do so more often when having to avoiding a loss rather than expect a gain (Hypothesis 3). This effect may occur through two possible mechanisms: expecting a loss or a gain could directly influence the decision to join a group (Hypothesis 3a). Yet, as expecting loss or gain changes confidence judgements in perceptual and learning tasks (Lebreton et al., 2018; Lebreton et al., 2019), expected outcomes may indirectly influence the decision to join the group, by changing confidence, which in turn will predict subjects’ decision to join a group (Hypothesis 3b).
Finally, we investigate whether the decision to join a group is reflected in changes in responsibility for the decision outcome. We predict that individuals will feel less responsible for outcomes when they are part of a group (Forsyth et al., 2002; Jaquiery & El Zein, 2021; Jaquiery & Zein, 2021), confirming that group decisions allow to reduce reported responsibility over outcomes (El Zein et al., 2019a) (Hypothesis 4). Together, the findings of our study will give insight into both personal and contextual influences on the motivation to choose alone or with others.
Methods
Participants will be recruited on the online platform Prolific (www.prolific.co). They will provide informed online consent as described in the ‘Ethics and consent’ section below. Participants will do so by clicking on one of the two buttons ‘Agree’ or ‘Disagree’ after reading the consent form. Participants will be rewarded GBP 4 for their participation. They can earn up to GBP 2 as a bonus payment (see ‘Incentive and structure bonus’ below).
Design
Perceptual task. We will rely on perceptual decision-making as a model system, for which the decision formation process and confidence have been precisely characterized. Specifically, we will use a random dot kinematogram (RDK) task that has been adapted for online experiments (Rajananda et al., 2018). The RDK will be presented for 700 milliseconds. Following this, participants will be asked to estimate the direction of the dots (left or right) and their confidence in their response, on a rating scale going from 100% sure left to 100% sure right. This scale allows to simultaneously record the perceptual decision and confidence. Participants will have to move the cursor away from the middle and therefore necessarily make a left/right choice in addition to their confidence. The choice is considered ‘Left’ if they move to any place on the scale on the left and considered ‘Right’ if they move to any place on the scale on the right. These choices (independently of confidence) are used to calculate the percentage of correct responses. A 1-up 2-down staircase procedure with equal step size will be used to adjust accuracy across participants (expected range of performance: around 70% correct) (García-Pérez, 1998). Participants will start with a training of 24 trials in which they will only perform the RDK judgements, for initializing the staircase procedure. Across these 24 trials, the steps of the staircase will decrease progressively. The step of the staircase will then be kept constant during the 64 trials of the experiment.
Trial and block structure. The experiment is a within-subject design. Data collection and analysis will not be performed blind to the conditions of the experiments. In a blocked design, participants will either be able to win GBP 1 if they are accurate (expected outcome win) or lose GBP 1 if they are inaccurate (expected outcome loss). There will be two blocks of 16 trials per participant with expectation of win, and 2 blocks of 16 trials with expectation of loss, presented in a random order.
At the beginning of each trial, participants will be shown whether the current trial is a ‘win one pound’ or ‘lose one pound’ trial (Figure 2). Participants will then be presented with the RDK and asked to give their left/right response and rate their confidence. Afterwards, participants will have to choose whether to play alone or join a group within five seconds. Finally, they rate how responsible they feel about the outcome of the trial. Participants do not see the outcome of the trial and receive no feedback on their or their group accuracy. The reason why outcomes are withheld is so as not to influence subsequent decisions and isolate an effect of expected outcomes only.
Decision between group and alone. Participants will be explained that if they choose to join the group their response and confidence rating will be pooled with four other previous participants’ ratings. Below are the exact instructions that will be given:
‘After your confidence estimate about the dots, you will have the choice to join a group.
- If you join the group, your estimate will be pooled with the other group members' estimates. The average of yours and others’ responses on the scale will determine the win or loss you receive.
- If you decide to play alone, win or loss will depend on your choice only. It is up to you, whether you decide alone or join a group.
You have 5 seconds to decide if you join or not. If you don't answer in time, you get the most negative outcome (losing in a losing round, and no win in a winning round).’
As described to the participant, in the group conditions, the five individual ratings on the confidence scale will be averaged, and the resulting rating will determine the group response (Left if the average is on the left of the scale, Right if the average is on the right of the scale.)
Expected outcome structure and bonus. Participants will be rewarded GBP 4 for their participation (~25–30 minutes task, ~9.5 GBP/hour). At the beginning of the experiment, they will be told that an additional GBP 1 bonus is at stake. They can lose or double this pound based on their outcome in one randomly selected trial. Below are the instructions they will be shown:
‘You will earn 4 pounds for participating in the study. In addition, you will be given a bonus of 1 pound. What happens with this bonus depends on your or your group's performance in the experiment.
In 2 blocks of the experiment, at each round, you can lose your 1 pound bonus and end up with no bonus. In 2 other blocks of the experiment, at each round, you can double that 1 pound bonus and therefore transform your bonus into 2 pounds.
At the end of the experiment, one random round will be picked and your bonus will depend on the accuracy of your or your group's decision. The table shows how it works for the randomly picked round.’ (Table 2)
Table 2. Incentive structure table shown to the participants.
| CORRECT
(you or your group) | INCORRECT
(you or your group) |
|---|
| Win rounds | 1 + 1 = £2 bonus
Total earning = £6 | 1 + 0= £1 bonus
Total earning = £5 |
| Lose rounds | 1 - 0 = £1 bonus
Total earning = £5 | 1 - 1 = £0 bonus
Total earning = £4 |
We will indeed reward participants as a function of whether they are correct or incorrect. If a group trial is picked, then we will use the participant’s response and the responses of four other participants for the same stimulus (same direction and coherence). No deception is used here since the four other participants’ responses will be based on actual collected data.
Self-reported measures for individual differences. At the end of the experiment, participants will have to complete four validated questionnaires.
To measure individual traits related to self-assessment and confidence:
-Self-efficacy (Schwarzer & Jerusalem, 1995): 10 items on a four point scale from ‘Not at all true’ to ‘Exactly true’ with items like : ‘I can always manage to solve difficult problems if I try hard enough’ and ‘I am confident that I could deal efficiently with unexpected events’
-Self-esteem (Rosenberg, 1965): 10 items on a four point scale from ‘Strongly Agree’ to ‘Strongly Disagree’ with items like ‘On the whole I am satisfied with myself’ and ‘I feel I have a good number of good qualities’
To measure traits related to social motives:
-Social conformity (Mehrabian & Stefl, 1995): 11 items on a nine point scale from ‘very strong disagreement’ to ‘very strong agreement’ with items like ‘I often rely on, and act upon, the advice of others’ and ‘Basically, my friends are the ones who decide what we do together’.
-Social closeness (Aron et al., 1992): the ‘Inclusion of the Other in the Self’ scale: participants are shown several pairs of circles, one circle representing them and the other circle representing ‘Others’ from no overlap to overlap increasing gradually to full overlap between the circles. They are asked to indicate which pair best describes their relationship with the others. The ‘others’ here will be the ‘other prolific participants’ with whom they can make the group decision.
We also introduce a new measure: the individual proneness to dilute responsibility in a group by asking participants to rate at the beginning of the experiment how responsible they would feel when they make decisions alone or as a part of a group. People more prone to dilute responsibility would indicate that they are more likely to feel reduced responsibility for decision outcomes when they are within a group versus on their own.
This is different from the reports of responsibility on a trial-by-trial basis that cannot give a trait-related measure as we predict they will depend on the different contextual factors throughout the task. Instead, we will ask participants how much they expect to feel responsible if deciding alone or deciding in a group in a future hypothetical scenario similar to the perceptual task they are currently doing, which allows us to have an individual measure as to how much they expect to reduce their responsibility as a group if indeed they were deciding in a group. Participants will provide ratings on the same scale as the one used in the experiment from ‘not at all’ to ‘partially’ to ‘very much’ to answer:
1) ‘If you make the decision alone, how responsible would you feel for the outcome of that decision?’
2) ‘If you make the decision as a part of a group of five with four other participants, how responsible would you feel for the outcome of that decision?’
Dilution proneness is computed by subtracting the rating of the second question to the rating of the first question.
Planned test-retest. In order to test our Hypotheses 1a–e linking specific personality traits with the propensity to decide alone or join groups in our perceptual task, we will aim to test (T1) and re-test (T2) the same participants two weeks following their first participation in our study. Self-efficacy, self-esteem, social conformity and social closeness that are already validated questionnaires will be filled only once at T1. The experimental task consisting of 64 trials will be repeated at T2.
As for the proneness to dilute responsibility trait measure, participants will complete it both at T1 and T2 to assess a test-retest reliability of this measure. At T2, participants will have more information about their performance at the perceptual task as they completed 64 trials of the task at T1, and this may influence their proneness to dilute responsibility at that task. To account for this, we will also take this measure at the end of the experiment at T1 (that will be comparable to the measure at the beginning of T2) and at the end of the experiment at T2 to assess the variability of this measure based on experience in the task.
We will also check whether the dilution-proneness trait measure correlates with participant’s actual dilution proneness within the experiment at both T1 and T2. The experiment may thus validate our measure of dilution-proneness as a self-reported trait for future experiments, although testing its reliability across domains will only be possible in future studies using different non-perceptual tasks.
Quality checks
We will verify that participants indeed reach a reasonable level of perceptual performance (>60%), and that the staircase has converged to be able to interpret their data. We will verify that stimulus evidence, confidence, accuracy and reaction times are related to one another other such as the higher the stimulus evidence, the higher confidence, the higher accuracy and the lower the reaction time (Kiani et al., 2014) (please see Analysis plan for more details).
Pilot data
We have conducted a pilot study including 195 participants from the Prolific platform (El Zein et al., 2023) to assess:
1. How subjects perform on the perceptual RDK in this context: what is the necessary exclusion rate based on low performance or the staircase not converging to the expected performance?
2. What is approximately the proportion of people that would mostly choose to decide alone or mostly join a group, thereby precluding us from analyzing the influence of trial-by-trial predictors such as confidence and the valence of expected outcomes on joining a group?
3. What is the sample size needed to test our hypotheses?
In this pilot, no gradual step for initializing the staircase was done, and the expected outcome (win/loss trials) was framed in terms of ‘points’ that would be converted into actual money.
The results of the pilot showed that about 18% of participants had an accuracy <60% or >85% correct (El Zein et al., 2023). This consisted of 35/195 participants leaving 160/195 for analyses. In order to reduce this exclusion rate based on performance, we add a training phase of 24 trials for initializing the staircase procedure, where participants will only perform the RDK judgements. This should lead more participants to converge on the expected level of performance and thereby reduce exclusion rate. On the 160 included pilot participants, 56% (89/160) varied their response to play alone or in group less than 20% of the time, suggesting a basic preference in the choice to play alone or in a group that is not influenced by the factors of interest on a trial-by-trial basis such as confidence and expected outcome. These participants, thereafter, ‘the socially fixed group’ will be kept for testing the individual differences predictions (Hypothesis 1a–e) of these baseline preferences to play alone or in group, because this distribution of preferences replicates previous observations (El Zein & Bahrami, 2020) but not yet linked to self-reported questionnaires.
As for hypotheses 2–4, they will be examined on the ‘Socially flexible group’, i.e., the remaining 44%. To test Hypotheses 2 and 3, we entered in a logistic regression for each participant expected outcome, confidence, accuracy, RDK coherence and RT as predictors of joining a group (65 instead of 71/160 participants were retained for these analyses as this trial-by-trial model to predict the choice to join a group did not converge for six participants). Then, we tested the individual betas of the predictors (regression coefficients) against zero. Hypothesis 2 was confirmed as confidence significantly negatively predicted joining a group over and above accuracy, reaction times and coherence (T64=-4.15, p=0.0001, effect size d=0.51, mean ß=-1.51, 95%ci= [-2.24, -0.78]). The evidence for Hypothesis 3a predicting that expected outcome will directly influence joining a group was inconclusive (T64=-0.24, p=0.80, effect size d=0.02, mean ß=-0.02, 95%ci= [-0.23, 0.18]). On the contrary, expected outcome had a positive effect on confidence (Hypothesis 3b), while including expected outcome, accuracy, coherence and RT as predictors of confidence (T64=2.42, p=0.0184, effect size d=0.30, mean ß=0.69, 95%ci= [0.12,1.27]). For Hypothesis 4, expected outcome, confidence, accuracy, dot coherence and confidence RT and joining the group were entered as predictor of responsibility ratings. Hypothesis 4a was confirmed as joining the group negatively predicted responsibility, i.e, decreased responsibility in a group (T64=-6.38, p=<0.0001, effect size d=0.79, mean ß=-8.54, 95%ci= [-11.21, -5.87]). Hypothesis 4b was confirmed as confidence had a positive influence on responsibility (T64=6.41, p<0.0001, effect size d=0.79, mean ß=4.98, 95%ci= [3.43, 6.53]). Evidence for Hypothesis 4c was inconclusive as there was no effect of expected outcome on responsibility (T64=-0.76, p=0.44, effect size d=0.093, mean ß=-0.36, 95%ci= [-1.31, 0.58).
Sampling plan
We will provide the samples needed for each of our confirmed hypotheses described above based on the pilot data to achieve 99% power (two tailed t-tests) and choose the highest required sample among all hypotheses. For Hypothesis 2, 72 participants are required. For Hypothesis 3b, 210 participants are required for the first path: expected outcome influence on confidence. For Hypothesis 4a, 32 participants and for Hypothesis 4b, 31 participants are required.
The largest sample size required is based on Hypothesis 3 (210 participants). However, this sample size concerns the Socially Flexible group which represented ~40% of the total sample in the pilot study. Therefore, we aim to include 525 participants to achieve a sample of 210 socially flexible participants (40% of 525 would reach the 210 participants in the socially flexible group). We will also take into account the 18% exclusion rate for accuracy, which indicates that we should collect a total of 640 participants. This exclusion rate based on accuracy should be reduced with our new staircase initialization, but we prefer to calculate our sample taking it into account. Moreover, such a large sample will be statistically powerful for investigating for the first time individual differences in the choice to join a group. We will thus aim to recruit 640 participants for the study.
We will use the following exclusion criteria:
-Participants who have an accuracy of <60% or >85% correct, based on previous exclusion criteria (Rouault et al., 2018): since we use a staircase for perceptual performance, participants’ performance should converge around 70% and remain about constant throughout the experiment. Therefore, performance in the task beyond the 60% or 85% bounds indicates that the staircase has not worked well (not enough trials to converge for instance).
-Participants who select more than 95% of the time the same confidence rating or the same responsibility rating.
For the re-test at T2, all participants who meet the inclusion criteria at T1 will be re-invited to participate.
For Hypothesis 1, all participants after exclusion are included in the analysis. For Hypotheses 2–4 that concern predicting people’s flexible behaviour on a trial-by-trial basis, analyses will be conducted on the socially flexible participants who vary their response to play alone or in group at least 20% of the time.
Analysis plan
We will use Matlab R2020b (open-access alternative: RStudio 2023.03.1) and JASP 0.14.1 to carry out the analyses. We will verify as a positive control and data quality check that stimulus evidence, confidence, accuracy and reaction times are related to one another other such as the higher the stimulus evidence, the higher confidence, the higher accuracy and the lower reaction time, replicating previous perceptual task measuring confidence. A general linear model with confidence as output and stimulus evidence, accuracy and reaction times as regressors will allow us to test the expected directionality of these effects within each participant and at the group level by testing whether the average parameter estimates (regression coefficients) significantly differ from zero using one-sample t-tests.
All our hypotheses will be tested at both T1 and T2, which will allow to evaluate whether the results replicate at the group level.
For hypothesis 1, we will use a general linear model at the group level that includes the proportion joining group of each participant as an outcome and as regressors all the five measured individual differences variables: self-efficacy, self-esteem, social conformity, closeness to others in the group and proneness to dilute responsibility in a group. If the scores of these five measures happen to be too strongly correlated in our sample, we will run separate regressions. The regressors that significantly predict the proportion to join a group (p<0.05, negative parameter estimate expected for self-efficacy and self-esteem, positive parameter estimate expected for social conformity, social closeness and dilution proneness) will be considered as relevant individual characteristics explaining who prefers to decide alone or join a group.
For hypotheses 2–4, we will use General Linear Models to estimate within each participant how trial to trial contextual factors influence confidence, joining a group and responsibility ratings. Accuracy, RDK coherence and reaction times will be included in all the models as control variables to investigate the effects of the other predictors over and above these control variables (see Figure 1). All regressors will be z-scored to ensure comparability of regression coefficients. We will test significance at the group level by testing whether the average parameter estimates (regression coefficients) significantly differ from zero using one-sample t-tests.
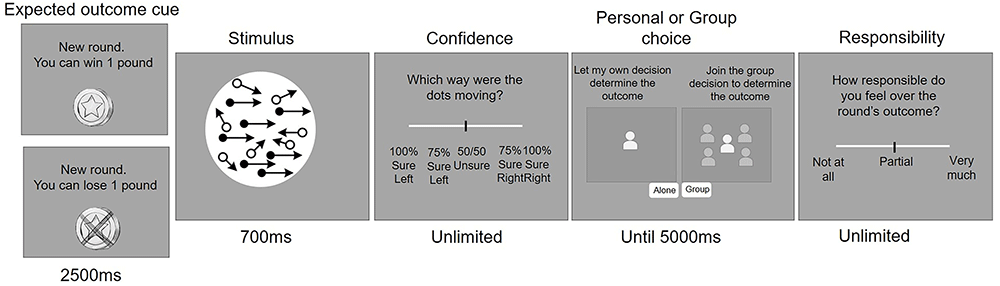
Figure 2. Trial structure.
In each trial, participants first see whether they can ‘win’ or ‘lose 1 pound’ The expected outcome remains constant during a block. Then, they are shown a perceptual stimulus consisting of a cloud of moving dots among which a proportion of the dots are moving to the right or to the left, and the rest of the dots is moving randomly. Participants are asked to indicate which way they think the dots are moving while also providing their confidence in their response. Next, they choose whether they keep their decision individual or join a group decision for the outcome of the trial. Finally, they rate how responsible they feel for that outcome.
For hypothesis 2 and 3, for each participant, we will run a logistic regression with the decision to decide alone or join the group as an outcome and expected outcome and confidence rating (absolute value of confidence regardless of the left or right choice) as regressors.
For hypothesis 3b, we will run an additional general linear model to predict trial by trial confidence rating with expected outcome as a regressor.
For hypothesis 4, we will run a general linear model with responsibility ratings as the outcome and expected outcome, confidence rating and the decision to join the group as regressors (to capture the effect of the decision to join the group independently of these other task factors but see below our additional planned analyses).
If our hypotheses are inconclusive, we will conduct Bayesian statistics in order to test evidence in favor of the null hypothesis.
To compare the propensity to decide alone or as a group from T1 to T2 within-participants, we will compare this variable at the two timepoints using Pearson correlations. We will also compare the strength of the links between the questionnaires and this propensity from T1 to T2.
Additional planned analyses:
In addition to the influence of joining a group on responsibility, we investigate how trial-by-trial reported responsibility over outcomes is influenced by expected outcomes and confidence through the general linear model described above for Hypothesis 4. Individuals tend to credit themselves with more responsibility after a positive outcome, rather than a negative one, (‘the self-serving bias’ (Forsyth & Schlenker, 1977; Jaquiery & El Zein, 2021; Jaquiery & Zein, 2021; Leary & Forsyth, 1987; Yoshie & Haggard, 2013). Here, as each trial consists of a potential gain or loss but the actual outcomes are not shown at the end of the trial, we test whether this bias also applies when anticipating a positive versus negative outcome, both when deciding alone or as a group (Hypothesis 4b). As for the link between confidence and responsibility, we predict higher confidence to be associated with higher responsibility reports both when participants decide alone or as a group (Hypothesis 4c); importantly, we will check that this link is specifically with subjective decision confidence and not other task factors that contribute to it such as objective accuracy, response times or decision evidence (Rouault et al., 2019; Sanders et al., 2016).
All raw data and materials of the main experiment will be shared on the OSF repository in case of acceptance of the Stage 2 manuscript. All code used to analyze the main experiment will be shared on the OSF repository in case of acceptance of the Stage 2 manuscript. The results of the study will be presented in internal lab meetings and international conferences.
Study status
The study has received ethics approval and will only be conducted online after peer-review and publication of the Stage 1 registered report.
Ethics and consent
The research complies with all relevant ethical regulation. The experiment will be conducted online on the Prolific platform (www.prolific.co). Participants will provide informed online consent according to regulations approved by the Max-Planck for Human Development Ethics Committee (project Group Choice A-2022-02). They will do so by clicking on one of the two buttons ‘Agree’ or ‘Disagree’ after reading the consent form and the following statements:
- I have read and understood the conditions outlined above, and had the opportunity to clarify open questions.
- I consent to participate in the study and agree to the collection, storage, and use of my data as described in the previous pages.
- I agree to be re-contacted in 2 weeks’ time to participate to the second part of the study.
Please say whether you agree or disagree with the 3 above statements:
2 buttons: Agree/Disagree.
For the included pilot study results, participants provided informed online consent according to regulations approved by the UCL Research Ethics Committee (project ID number 5375/001) by checking fours boxes associated with the different consent statements and clicking on a button to proceed:
By checking the boxes below, I agree that:
1) I have carefully read the information page
2) I have been given contact details of the researcher to ask any question or discuss the study.
3) I understand that I am free to withdraw at any time, without giving a reason, and without incurring any penalty.
4) I am over 18 years of age)
1 button: Proceed to study instructions.