Introduction
Vanillin is a versatile compound with a plethora of feasible applications in different industries like (1) the food industry (as flavouring), (2) the cosmetic industry (as fragrance), (3) the chemical industry (as an antifoaming agent), and (4) pharmaceutical industry (as odour-masking agent)1. The foreseen global production in 2024 is expected to be close to 60,000 t (a growth of 8% from 2019)2.
There are several routes to produce synthetic vanillin, but the most prominent option is the petroleum-based route, specifically from guaiacol (80% of the world's supply)3–5 while natural vanillin accounts for just 1% of the total market6. The rest is mainly obtained by a bio-based pathway through oxidative depolymerisation of lignin/lignosulfonates7. Borregaard (Norway) is the main active vanillin producer from lignosulfonates, operating for the last 20 years using this approach3. Borregaard obtains vanillin inside a multiproduct biorefinery with spruce wood as feedstock. Focusing on the vanillin process, it is fed by the liquor generated as waste during the sulfite process of wood pulp. Lignin depolymerisation into vanillin consists of oxidant treatments at alkaline conditions, high temperatures and high pressures. The first stage generates concentrated lignosulfonates using ultrafiltration, precipitation and evaporation. After the reaction phase, the product mixture is separated by liquid-liquid extraction. During the depolymerisation of lignin, a heterogeneous mixture of compounds is produced, containing aldehydes, acids and phenolics, among other subproducts. High-purity vanillin can be obtained when this mixture is treated by a sequence of separation and purification stages. Furthermore, to promote vanillin production, copper-based catalysts are used8. Although the previous process focused on lignosulfonates, Kraft-lignin valorisation can be performed by a similar process, which is highly interesting since its production is larger and more cost efficient than the one for lignosulfonates3,9. Valorisation by acidic oxidation seems to be also feasible, but the development of this approach is still on-going with a low TRL10. In conclusion, vanillin production from biomass or lignin requires several purification steps due to the formation of a complex mixture of organics during depolymerization. A profitable conversion of biomass requires the production of multiple products based on all three main compounds of woody biomass cellulose, hemicellulose and lignin, like in Borregaard’s case. Moreover, profitability will be more complex in the case of Kraft-lignin as the vanillin yield is lower than the one found for lignosulfonates11. Several studies have been performed with the objective to optimise the separation train, involving the use of membrane-based units and ion-exchange recovery systems12,13. Nevertheless, it is not obvious if these modifications in the separation train would be enough to ensure a positive cash flow of the operation. Therefore, improvements in the conversion steps are required to increase the vanillin yield. State of the art copper catalysts are used, which increases the complexity of the reactor since a three-phase reactor is needed.
For these reasons, a completely new approach was proposed in the H2020 project LIBERATE (grant agreement No 820735) where the depolymerisation is performed in a monophasic system (working at high temperature and pressure) and using PODIC® (Na2CO6) as oxidiser to promote vanillin production14–16. Moreover, focusing on the Kraft-lignin, the proposed process directly dissolved the lignin powder into the PODIC® solution, which is produced from sodium carbonate and electricity in an electrochemical reactor. This way, the use of NaOH is prevented, being substituted by a cheaper chemical (sodium carbonate) and electricity that can be obtained from renewable energy sources. Nevertheless, although the LIBERATE solution was promising, it required a deep assessment in terms of economic and environmental performance, which is the main aim of the research gathered in this work. So, a comprehensive calibrated process model of the solution is presented, followed by a complete Techno-Economic Analysis (TEA) and Life Cycle Assessment (LCA). Further, the potential benefits in environmental impact terms can be considered by avoiding the current state of the art for lignin processing, which is combustion as biomass17. This would reduce CO2 emissions, extracting value-added products from the lignin.
Proposed solution
Developed process
The process consists of three main sections: 1) PODIC® reactor converting sodium carbonate to peroxy dicarbonic acid and sodium hydroxide by applying an electric current over boron doped electrodes, 2) a heated reactor section where PODIC® is mixed with lignin dissolved in aqueous sodium hydroxide to oxidize and depolymerize lignin and produce the phenolic aldehydes, phenolic acids and guaiacol, 3) a product separation sequence where vanillin and light phenols are separated by an adsorbent system and subsequent membrane section where the eluate from the adsorber section containing mixed phenolics and partially converted lignin is dewatered. Caustic and sodium carbonate follows the water in the membrane section and is recirculated to the PODIC reactor. Sodium carbonate is required to produce the PODIC®, and caustic and CO2 are side products of this reaction. By sparging the produced CO2 in the caustic solution the sodium carbonate can be regenerated. An alternative process with the addition of sodium carbonate regeneration was also established, which also includes the use of additional CO2 to enhance the regeneration. A schematic of the process is given in Figure 1.
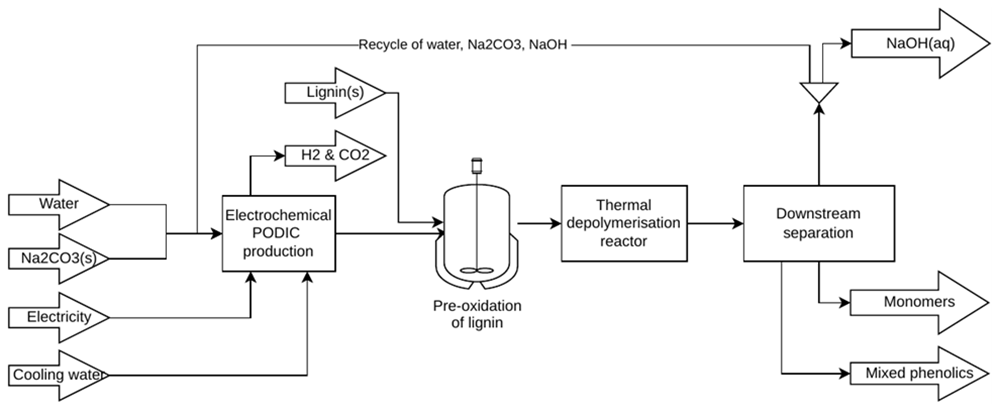
Figure 1. Process scheme.
The process was modelled in the COCO-simulator (https://www.cocosimulator.org/) and using the CAPE-OPEN Python unit operation add-on, both by Amsterchem. The Python unit operation add-on was used with custom program code to describe the membrane section. The following Figure 2 shows the main process flowsheet view of the simulator.
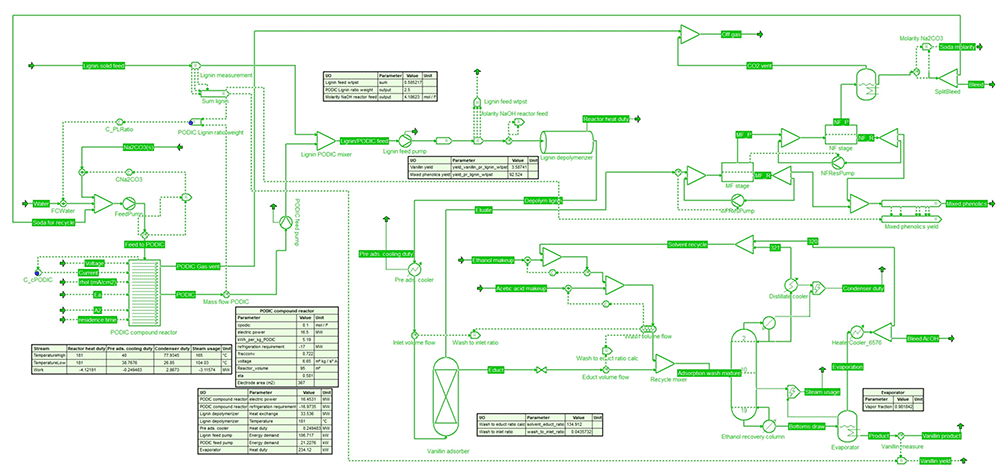
Figure 2. Process flowsheet in COCO-simulator.
The complete set of simulator input files and auxiliary codes are given at (https://doi.org/10.5281/zenodo.8424715)1.
PODIC® production pathway
As previously mentioned, the process concept developed inside the LIBERATE project to maximize vanillin production is based on the use of PODIC® (Na2CO6). In this sense, to include it in the assessment, its production form sodium carbonate had to be modelled. The net reaction from sodium carbonate to sodium peroxydicarbonate (PODIC®) is given by:
2 Na2CO3 + 2 H2O → Na2C2O6 + 2 NaOH + H2 (g)
The PODIC will also decompose, and a plausible mechanism for the decomposition is given by:
2 Na2C2O6 + 4 H2O → 2 H2O2 + 4 NaHCO3
with the peroxide eventually decomposing by:
2 H2O2 → 2H2O + O2(g)
So, the net overall reaction becomes:
2 Na2C2O6 + 2 H2O → 4 NaHCO3 + O2 (g)
The formation of bicarbonate will affect the carbonate equilibrium in the electrolyte and may lead to the release of carbon dioxide if the electrolyte is saturated with CO2 according to the following reactions
NaHCO3 + H2O ⇄ H2CO3 + NaOH
H2CO3 → H2O + CO2(g)
Thus, based on the assumption of CO2 saturation in the electrolyte, the overall reaction for PODIC® decomposition is formulated as:
2 Na2C2O6 + 2 H2O → 4 NaOH + 4 CO2 + O2(g)
Lignin depolymerisation mechanism
In order to represent a possible varying lignin composition the lignin was parameterized as the lignin monomers in their alcohol representation: p-coumary alcohol, coniferyl alcohol, and sinapyl alcohol. Of primary interest are the phenolic aldehydes, phenols and quinones that can be derived from these:
Hydroxy-benzaldehyde, vanillin and syringaldehyde, acetovanillone, and acetosyringnone
Various phenols
Ring-oxidated compounds of the above.
Thus, the reaction mechanism was based on simplified reactions (monomer to product + residue), defining the required stoichiometries to close the mass balance. Note, naturally this is a simplified description of the complex substrate, the reactions, and its product mixture, though it is a sufficiently accurate description and with respect to the purpose of modeling the full process, utility systems, and separation system. The overall aim is to develop a simplified but closed mass balance for the main classes of products, the energy costs, and for the sizing and definition of equipment. The different reactions can be found in the developed flowsheet (available at https://doi.org/10.5281/zenodo.8424715).
Kinetics and thermodynamics
For PODIC® production, the forward reaction rate to sodium peroxydicarbonate can be calculated by knowing the number of electron transfer and, the current and an efficiency factor:
Where I is the current, η is the current efficiency, ν is the charge count and F is the Faraday constant. The reverse reaction of sodium peroxydicarbonate decomposition can be represented by a standard Arrhenius expression and as a first order reaction
where V is the reaction volume and C is concentration of PODIC®, and the remaining expression is the classical Arhenius equation.
The degradation reactions for lignin are modeled by specifying the degree of conversion. Since the temperature effect of the lignin degradation is negligible, the focus when defining the thermo-dynamic properties of the chosen components and the mixture of these is to get proper description of the heat capacity and the vapour-liquid and liquid-liquid equilibrium for the main separation operations. The process includes an adsorption system using acetic acid and alcohols to strip the adsorbent and the thermodynamic description was chosen to be the Non-random Two-Liquid (NRTL)-model, using the Hayden O’Connel model for better describing the association effects in the gas phase caused by acids. The model parameters have been used as available in the ChemSep package database. Where the components were not already defined, parameters as given by NIST database have been used. Where no data was available in NIST the compounds have been given the correct gross molecular formula and otherwise been set to the same values as for vanillin.
Process assessment
Techno-economic assessment (TEA)
The process TEA was based on the process model described in the section Developed process, also assessing the two different working modes (with CO2 supply for NaOH conversion and without the feeding of extra CO2). The evaluated case is the same as the one used in the process model: a plant that treats 1,268 kg/h of lignin to produce vanillin, phenols, and partially depolymerized lignin.
Concerning the economic model, the bare module costing method18 is used. This method estimates both capital (CAPEX) and operational (OPEX) costs based on average values for the chemical industry. To evaluate the purchase price of equipment components, the methodology considers both direct and indirect costs, as well as contingencies and fees. Additionally, when there is limited information, the method also includes correlations based on industrial equipment to compute the base purchase cost in base conditions (common materials and near-ambient pressures) and its correction by correlation factors to incorporate the equipment material and operational conditions (mainly pressure and chemical resistance). These correlations are based on the main characteristics feature of the evaluated device. The assumption to estimate these features are listed in ANNEX 1, where the equations to compute the CAPEX and the OPEX are also included. The computed investment cost for each involved device can be also seen in ANNEX 1. To compute the OPEX contributions, energy and mass balances were needed. These balances were obtained from the process model and the information retrieved can be found in ANNEX 1.
Finally, once the CAPEX and OPEX are known, the process's economic performance can be evaluated by several economic indicators, mainly the Net Present Value (NPV), the Internal Return Rate (IRR), and the Return on Investment (ROI). A detailed description of them is done in ANNEX 1.
TEA tool
The TEA was performed by a tailored tool developed in Python that can be found at https://doi.org/10.5281/zenodo.8424715.
Life cycle analysis (LCA)
This study aimed to evaluate the environmental impact of the production process for vanillin and phenolic compounds. This calculation was carried out using SimaPro 9.3.0.3 software, the ReCiPe 2016 method (midpoint with hierarchical perspective), limiting the impact categories to be analyzed to 5 (energy consumption, human health, greenhouse gas emissions, water consumption and human toxicity) and secondary data obtained and adapted from Ecoinvent 3.8 database. The inventory is available at https://doi.org/10.5281/zenodo.8424715.
The study has a cradle-to-gate scope, the functional unit was defined as 1 kg of desired product and the geographic and technological scope is the European one.
Life cycle analysis starts from the environmental impact associated with dry Kraft-lignin powder production19,20. For this environmental analysis, 3 subsystems were identified:
Lignin Feed, using lignin derived from the Kraft process.
PODIC® process considering the input of sodium carbonate and water, as well as the energy consumption of the reactor and the pumps (PODIC® and feed).
Thermal Depolymerization + Separation: this subsystem considers the rest of the process.
Consumptions involved (varying between the case with CO2, WCO2, and without CO2, NoCO2), taking as an avoided product the production of low concentration acetic acid. Also, for this subsystem a mass allocation was applied between the two products obtained: vanillin and phenolic compounds. More detailed information is provided in ANNEX 2.
Process CAPEX and OPEX
Analysis of the process with CO2 supply
CAPEX
The investment cost for each unit is listed in ANNEX 1, while the total CAPEX (once the corresponding multipliers to include piping, instrumentation, and other additional investment costs were included) was 145 M€, which is relatively high, with a distribution between the reaction and separation sections is close to 50%. A high CAPEX was not unexpected since the involved stream has a high dilution rate (water content >70 wt%). Indeed, the dilution effect is clear in the CAPE of the adsorption processX, which was nearly three times larger than the thermal reactor cost. Moreover, other devices contributing to the total CAPEX: the PODIC® reactor and the nanofiltration unit (NF). The power consumption of the PODIC® reactor is considerable (5.19 kWh/kgPODIC®) for this process. Concerning NF, the high salt concentration leads to high osmotic pressures that meant low fluxes through the membrane, which implies large surfaces to treat the involved streams, increasing the total CAPEX.
OPEX
The OPEX for this case can be seen in Table 1 and Figure 3, where it can be observed that the main contributor is the direct cost and, inside it, the raw materials, energy and maintenance have the main roles. As for raw materials breakdown, sodium carbonates account for 69%, while electricity and cooling are the main energy consumed (59% and 33%, respectively). In both cases, PODIC® production is the main reason for their consumption. Finally, maintenance implies circa 30% of the direct cost, which is explained by the high total CAPEX, which is principally due to the dilution and the investment required for the PODIC® production.
Table 1. Process OPEX when CO2 is supplied.
| Cost | OPEX, €/kgLignin | OPEX, % |
|---|
| Fixed | 0.99 | 19.46 |
| Direct | 3.21 | 62.93 |
| Indirect | 0.96 | 18.71 |
| Total | 5.16 | - |
| Direct OPEX breakdown | OPEX, €/kgLignin | OPEX, % |
|---|
| Labour | 0.11 | 3.39 |
| Energy | 0.77 | 24.09 |
| Raw material | 1.00 | 31.25 |
| Waste treatment | 0.00 | 0.06 |
| Maintenance | 0.95 | 29.54 |
| Patents | 0.15 | 4.77 |
Membrane cleaning, smart
grid, and H2 recovery | 0.22 | 6.90 |
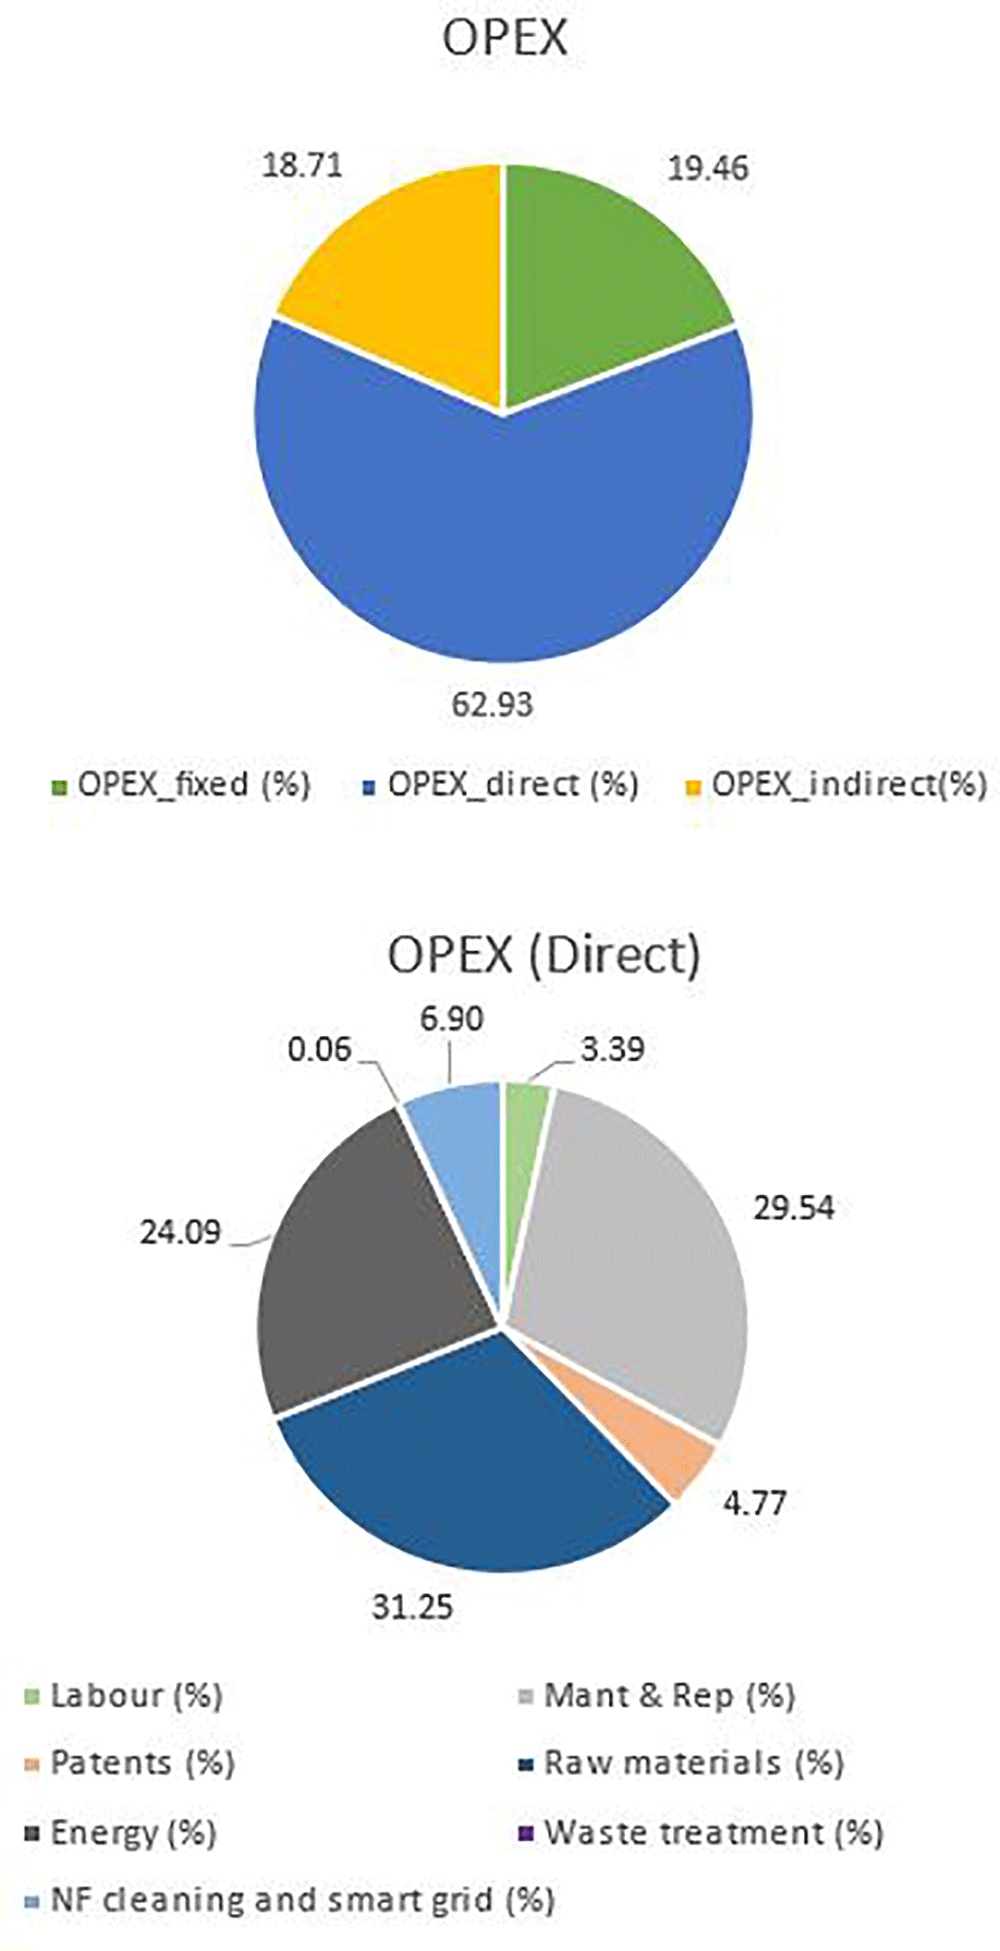
Figure 3. OPEX breakdown when CO2 is supplied.
Analysis of the process without CO2 supply
CAPEX
The evaluation of the investment required for the case when CO2 is not fed is presented in ANNEX 1. This approach was included to assess what happens if the permeate obtained from the NF is directly recirculated without an additional reactor to transform the NaOH into carbonate (NaOH reactor). Thus, it was expected to observe a reduction of the CAPEX that could compensate for the expected increase in the OPEX due to the extra carbonate to balance the one that would come from the NaOH. However, the total CAPEX for this approach without CO2 supply was similar, even a little higher, to the one with CO2 (146 vs 145 M€). This result was because recycling the NaOH implies larger streams at the steady state operation, increasing the size of the equipment, thus the CAPEX. Regarding cost distribution between reaction and separation, both were again balanced. Finally, similarly to the previous case, the high costs are related to dilution, large PODIC® reactor and NF system.
OPEX
The values related to the OPEX for this case are listed in Table 2 and Figure 4. As expected, the total OPEX was higher due to the need for more carbonate to produce PODIC®, also explaining the increase in the role of the raw materials in the direct OPEX (carbonate implies 80%). This increase in the raw materials requirements reduced the energy contribution up to 17% being the PODIC® reactor responsible for circa 64% of the total energy cost. Finally, maintenance contribution is still high due to the dilution.
Table 2. Process OPEX when CO2 is not supplied.
| Cost | OPEX, €/kgLignin | OPEX, % |
|---|
| Fixed | 1.00 | 16.15 |
| Direct | 4.13 | 66.56 |
| Indirect | 1.13 | 18.25 |
| Total | 6.27 | - |
| Direct OPEX breakdown | OPEX, €/kgLignin | OPEX, % |
|---|
| Labour | 0.11 | 2.63 |
| Energy | 0.71 | 17.09 |
| Raw material | 1.95 | 47.16 |
| Waste treatment | 0.00 | 0.05 |
| Maintenance | 0.96 | 23.19 |
| Patents | 0.19 | 4.51 |
NF cleaning and smart
grid | 0.22 | 5.36 |
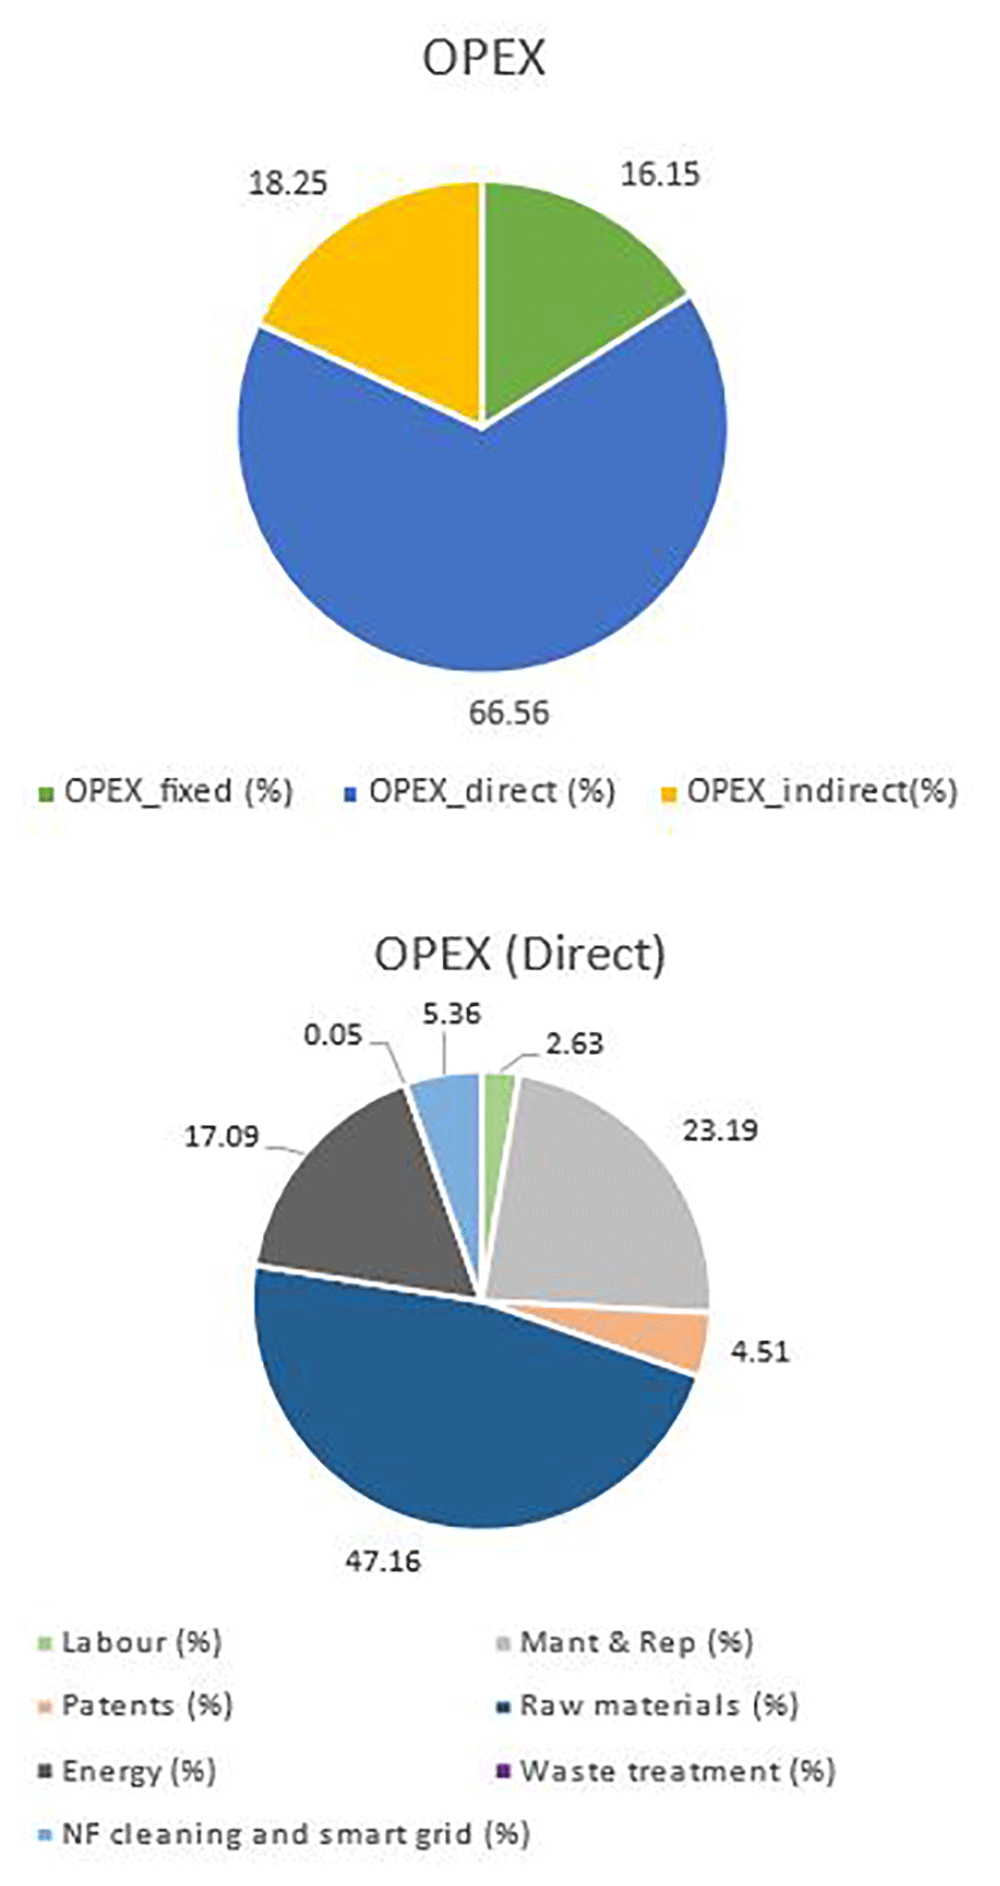
Figure 4. OPEX breakdown when CO2 is not supplied.
Comparison with literature
Once the CAPEX and the OPEX were computed, a comparison with other processes (Cases 1-3) where lignin was transformed into vanillin was performed. Vanillin was selected as a reference since it is the key compound delivered by the process and complete more information has been available in the literature. The three cases involve “conventional” approaches, where lignin is thermally degraded by the action of a catalyst, caustic conditions, and oxygen supply. However, while cases 1 and 3 are theoretical studies, case 2 is based on values from a real multiproduct biorefinery when the original raw material is woody biomass. More details can be found in ANNEX 1.
The contrast of all the considered cases in the deliverable can be seen in Table 3, where it can be checked that the best option for the evaluated process is when CO2 is supplied. However, the costs for this option are still higher than the ones found in the literature.
Table 3. CAPEX and OPEX in comparison to literature-based cases.
| Value | Process with
CO2 supply | Process without
CO2 supply | Case-1 | Case-2 | Case-3 |
|---|
| CAPEX, €/kgVanillin | 388.57 | 392.54 | 120.71 | 87.7 | 34.90 |
| CAPEX, €/kgLignin | 13.76 | 13.90 | 0.66 | 0.58 | 1.81 |
| OPEX,€/kgVanillin | 144.22 | 175.50 | 24.56 | 17.67 | 15.19 |
| OPEX, €/kgLignin | 5.16 | 6.27 | 0.13 | 0.12 | 0.79 |
| (Vanillin) Yield, % | 3.58 | 3.58 | 0.55 | 0.30 | 5.20 |
This higher costs are related to the high dilution in the system2 (in addition to PODIC® reactor and NF costs), as previously explained. For this reason, “corrections” to these bottlenecks were applied in the economic model3 to evaluate how much the cost can be reduced. The corrections were:
a) Assume that the MF/NF is located before the adsorption to reduce the dilution in the separation train. The need for dilution in the thermal reactor to obtain high vanillin yields was experimentally confirmed inside the LIBERATE project. However, it has a detrimental effect on the downstream separation. In principle, water removal by membrane-based4 operations could be performed up-stream the adsorption to avoid losing vanillin, but this could not be experimentally verified. Thus, the effect of this approach (assuming no vanillin losses and a final feasible water content of 35wt%) on the economics was verfied by simulation.
b) Free electricity due to national grid green surplus. The process is powered using renewable energies. However, the evaluation involves realistic profiles, meaning that the renewable energy sources' production depends on the weather conditions and, so, they will not be able to produce all the energy required for every hour. Thus, despite having this connection to renewable energy sources, there are hours when energy from the grid is required. For this reason, it was assumed that only during these favourable periods there will be a surplus in the national grid grid resulting in free renewable energy.
c) Reduce the Thermal reactor residence time to 1 hour to be in line with the ones used in the literature.
d) Better NF performance. The reported flux for the NF at the working salt concentration was 5 LMH. Nonetheless, this value was measured at a temperature lower than the real one considered in the process (40 oC vs 20 oC). Thus, the real flux could be better and, for this reason, an more optimistic flux of 10 LMH was imposed.
The effect of applying all these corrections can be seen in Table 4 and Figure 5, even when all of these improvements are considered, the process costs are closer but still above the ones found in the literature. Furthermore, the main contribution to the OPEX is, still, the raw materials, where the carbonate required for PODIC® production implies 69% of the total direct OPEX. Similarly, PODIC® production represents 28% of the total CAPEX. Therefore, it is obvious that PODIC® is a bottleneck in reducing the process costs to approach the reference cases. Despite this, it is worth highlighting that reference cases 1 and 2 include assumptions not realistic for the operational conditions used in the evaluated process. And, if these assumptions are included in the economic model5, the vanillin production cost for LIBERATE was: 42.5 €/kgVanillin (CAPEX) and 23.2 €/kgVanillin (OPEX), which is similar to those from the reference cases. To sum up, the evaluated process would lead to similar costs to those found in the literature once near an ideal performance is assumed (even with the high cost due to the PODIC® production). However, when a more realistic approach is followed, the costs are in the expected range, but with higher values.
Table 4. CAPEX and OPEX for different scenarios in comparison to literature-based cases.
| Value | Process with
CO2 supply | a* | a&b* | a&b&c&d* | Case-1 | Case-2 | Case-3 |
|---|
| CAPEX, €/kgVanillin | 388.57 | 234.93 | 234.93 | 175.10 | 120.71 | 87.7 | 34.90 |
| CAPEX, €/kgLignin | 13.76 | 8.32 | 8.32 | 6.20 | 0.66 | 0.58 | 1.81 |
| OPEX,€/kgVanillin | 144.22 | 116.56 | 91.87 | 78.67 | 24.56 | 17.67 | 15.19 |
| OPEX, €/kgLignin | 5.16 | 4.13 | 3.25 | 2.78 | 0.13 | 0.12 | 0.79 |
| (Vanillin) Yield, % | 3.58 | 3.58 | 3.58 | 3.58 | 0.55 | 0.30 | 5.20 |
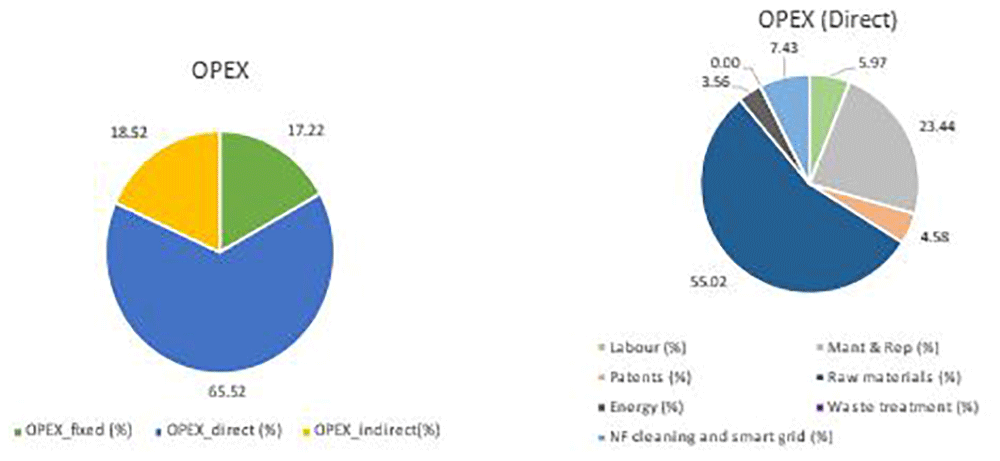
Figure 5. OPEX breakdown when scenarios a, b, c, and d are applied.
Economic indicators
The next step for the analysis consists of computing the economic indicators previously mentioned. This calculation was only done for the best one (the one where CO2 is fed) since it is the most probable to imply positive incomes, also including the effect of the different corrections explained in the previous subsection (Table 5). Considering the results obtained, it can be concluded that the process is not profitable even under ideal conditions due to the high dilution of the final products, which reduces the selling price. Further up-grading costs will be imposed to achieve identical product specifications.
Table 5. Economic indicators for different scenarios.
| Indicator | Process with
CO2 supply | a&b&c&d* | a&b&c&d*
& ideal
performance |
|---|
| NPV (€/kgLignin) | -74 | -36 | -23 |
| IRR (%) | - | - | - |
| ROI (%) | - | - | - |
| Payback (years) | >30 | >30 | >30 |
The presented calculations were performed with a Kraft-lignin price of 250 $/t and considering the price index of 2019 to compare with the literature. However, the current Kraft-lignin price should be higher (near 1,000 $/t)21,22. Further, an estimate using an updated index cost (near 820 for 2022)23 should be evaluated. These re-evaluations and the following calculations will focus on the case without any correction since it represents the “real” process (Table 6).
Table 6. Eonomic performance with a Kraft-lignin price of 1,000 $/t and an updated index cost.
| Value | Process with
CO2 supply | Process with CO2
supply- 1,000 | Process with CO2
supply -1,000-2022 |
|---|
| CAPEX, €/kgVanillin | 388.57 | 388.57 | 497.70 |
| CAPEX, €/kgLignin | 13.76 | 13.76 | 17.62 |
| OPEX,€/kgVanillin | 144.22 | 167.10 | 186.72 |
| OPEX, €/kgLignin | 5.16 | 5.91 | 6.61 |
| NPV, €//kgVanillin | -74 | -83 | -98 |
| (Vanillin) Yield, % | 3.58 | 3.58 | 3.58 |
Parametric analysis in terms of the economic indicators
Asenstivity analysis was performed considering a variation of ±20% in the CAPEX and OPEX contributors. However, since no positive incomes were obtained, only the NPV could be assessed (Figure 6). Focusing on the results, the main factor of cost is the investment cost, whereas raw materials and energy have a less pronounced role. This is in line with the result obtained in the OPEX breakdown for the considered case (Figure 3), where energy and raw materials had similar contributions to the direct OPEX.
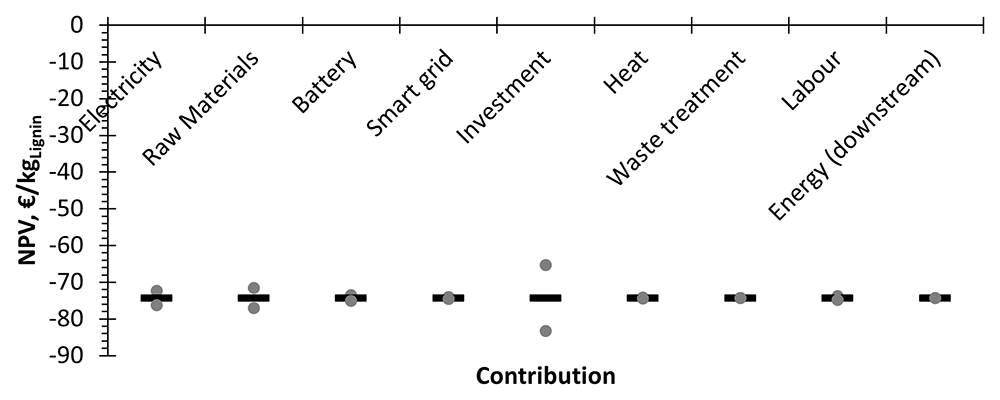
Figure 6. Parametric study of the NPV.
Process minimum selling prices
Another important indicator of economic performance is the minimum selling price of products (vanillin, phenols, and partially degraded lignin). For a more realistic result, a lignin price of 1,000 $/t was used. An initial screening of five different scenarios was executed to try to explore if positive values are feasible including a change in the scale (the treated lignin flow was increased up to 50 times). Moreover, values for the vanillin selling price close to the maximum feasible value found in the literature (circa 25 $/kg) were used. Similarly, the selling price for the phenols and the partially degraded lignin were set to values in line with the ones found in the literature (see ANNEX 1)6. The results are listed in Table 7, concluding that only when the scale-up of the process is performed, positive values can be obtained for a realistic evaluation of the process at “feasible” selling prices (scenario (IV)). Note that all the set prices for this scenario are at high values and, for phenols and partially depolymerized lignin an average of the prices for pure compounds had to be used since lower values would mean a not profitable solution. Similarly, a vanillin selling price much lower than the maximum would also lead to an unprofitable situation. Thus, the values used in scenario IV are the minimum selling prices.
Table 7. Initial screening of the minimum selling price(s).
| Value | Process with CO2 supply- 1,000 |
|---|
| (I) | (II) | (III) | (IV) | (V) |
|---|
| Selling price, $/kg (VAN/PHEN/OLIG)* | 7.6/0.76/0.3 | 25**/0.76/0.3 | 25**/0.76/0.3 | 25**/6.7/6.7 | 7.7/6.7/6.7 |
| Scale (lignin flow), kg/h | 1,268.54 | 1,268.54 | 50·1,268.54*** | 50·1,268.54*** | 50·1,268.54*** |
| NPV, €/kg | -83 | -77 | -56 | 2.4 | -4 |
| IRR, % | - | - | - | 4.13 | - |
| ROI, % | - | - | - | 28 | - |
| Payback period, y | - | - | - | 29 | - |
Environmental analysis of the process with and without CO2
The analysis of the processes with CO2 and without CO2 was carried out, evaluating it in the environmental impact categories previously highlighted.
The impacts were determined for the 3 sub-systems referred to the generation of 1 kg of linked product. In the case of the PODIC® Process, it was observed that the case without CO2 generated a higher impact than that with CO2 in 5 out of 6 impact categories analyzed, being equivalent to that obtained with CO2 in the impact category of fossil resources scarcity.
Being Lignin Feed subsystem an identical input in both case studies, in the case without CO2 the impact of the PODIC® process generated a higher downstream impact on the production of vanillin and phenolic compounds than the case study with CO2. This is equivalent to an increase in the impact of vanillin production of 2 to 4 % in 4 of 5 environmental impact categories and a decrease of 3 % in case of fossil resource scarcity.
For the case of production of 1 kg of vanillin or phenolic compounds, the lowest environmental impact is for the case with CO2, being 1.37 and 1.38 kg CO2 eq respectively in the case of global warming, compared to 1.43 and 1.41 kg CO2 eq obtained for the case without CO2.
Evaluating both processes to produce 1 kg of vanillin (Figure 7), it was observed that the PODIC® process generated the highest environmental impact in 4 of 6 environmental impact categories analyzed and the second highest impact in the two Human toxicity environmental impact categories behind wastewater, keeping the same impact ratios for the production of phenolic compounds.
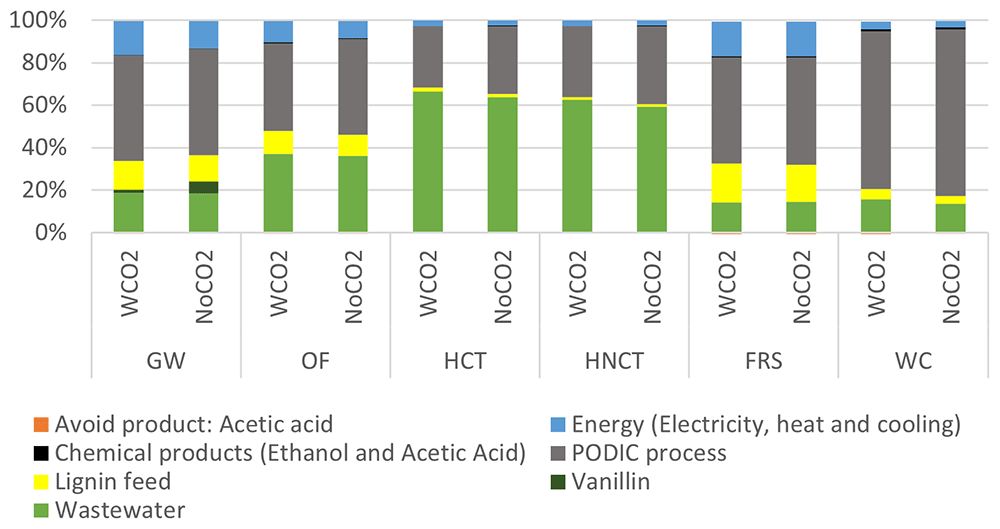
Figure 7. Relative environmental impact analysis of the vanillin production process.
Causes of the environmental impact
In both cases it was found that the electrical consumption of the PODIC® reactor has the largest impact. In the case with CO2, the largest impact of all categories assessed was due to this electrical consumption. However, in the case without CO2, it was observed that the electricity consumption of the reactor had the second highest impact in the environmental impact associated to the water consumption category, after sodium carbonate (see Figure 8).
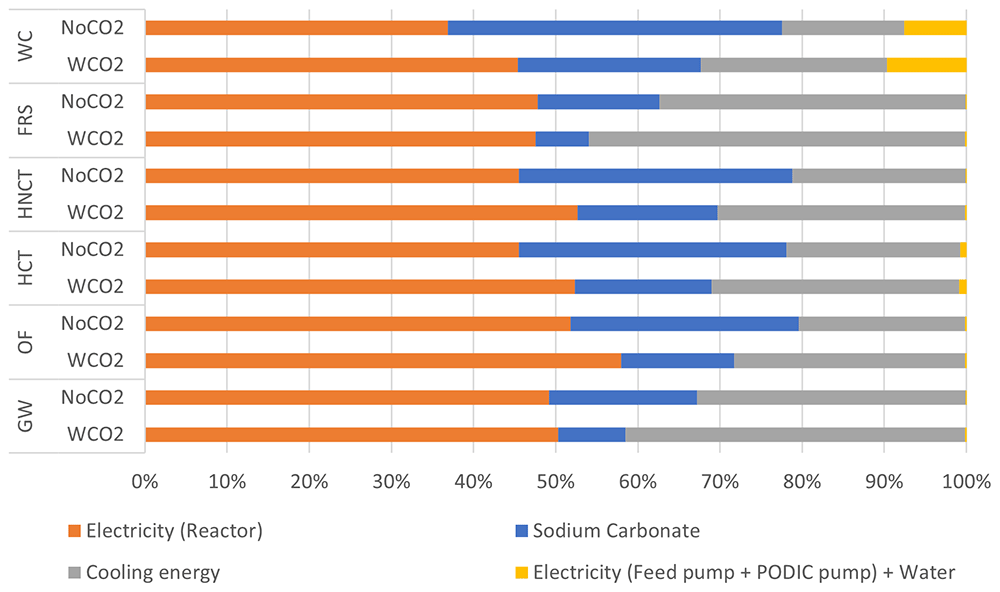
Figure 8. Relative environmental impact analysis of PODIC® production process.
Comparison with the literature
The result obtained for the carbon footprint of producing 1 kg of vanillin was estimated at 1.37-1.43 kg CO2 eq. This result is similar to the one reported by LCA on the Borregaard process (1.34 kg CO2 eq./kg vanillin)24 and significantly lower than the Kraft-lignin scenario analyzed by Wongtanyawat et al.: 137 kg CO2 eq./kg vanillin13.
Conclusions
The proposed process for vanillin production from lignin was successfully modelled and simulated using COCO-simulator, also including the most relevant kinetics and reaction mechanisms (e.g., PODIC® formation and degradation). Moreover, a complete techno-economic analysis of the proposed process to depolymerize lignin into added-value compounds (e.g, vanillin) was done. During this analysis, the main bottlenecks were identified, namely the high dilution rate and the production of a chemical (PODIC®) to promote the conversion of lignin into vanillin. As an overall conclusion, it can be established that the process can be hardly profitable at the current conditions even at a larger scale due to the high costs (CAPEX and OPEX of 13.76 and 5.91 €/kgLignin, respectively) and lowr concentration of the final products compared to the reference cases. However, if these issues could be solved, an economic performance similar to other cases reported in the literature would be obtained.
Finally, based on the results of the environmental analysis, in both cases, PODIC© process was the major factor; the highest environmental impact is due to the power consumption of the reactor, giving the option to further reduce this impact by switching to renewable energy based electricity consumption. The CO2 emissions evaluated were similar to those obtained by the Borregaard process.
Nomenclature
Acronyms
CAPEX: capital expenditure
IRR: internal rate of return
LCA: life cycle assessment
OPEX: operational expenditure
NPV: net present value
ROI: return on investment
TEA: techno-economic analysis
Symbols
A: pre-exponential factor, 1/s
C: concentration of PODIC®, mol/m3
Ea: activation energy, J
F: Faraday constant, 96,485 s·A/mol
I: the current, A
r1: PODIC® production rate, mol/s
r2: PODIC® decomposition rate, mol/s
V: reaction volume, m3
R: ideal gas constant, 8.31 J/(K·mol)
T: temperature, K
Greek letters
η: the current efficiency, dimensionless
ν: the charge count, dimensionless
Acknowledgements
The work done in this paper was a collaboration done by researchers from three different institutions (IDENEr, SINTEF and ENSO INNOVATION) inside the framework of the LIBERATE project. In this sense, the work here presented is the result of the interaction an efforts of all of them. However, it can be specified where each of them had a major contribution:
• Olaf Trygve Berglihn, Eloy Ottaviano, and Álvaro Cabeza were in charge of the process modelling, LCA, and, TEA, respectively. Furthermore, they were involved in the writing process and, so, they are marked as corresponding authors.
• Theresa Rücker and Torbjørn Pettersen were responsible for the experimental part, gathering and treating the data that were used in the model. Similarly, they collaborated on the technical analysis of the process bottlenecks.
• Abraham Aliko and Lucía Gálvez worked on the development of the Python files to perform the TEA.
• Bernd Wittgens and María López were in charge of the concept development and review of the whole work.
Faculty Opinions recommendedReferences
- 1.
Pacek AW, Ding P, Garrett M, et al.:
Catalytic Conversion of Sodium Lignosulfonate to Vanillin: Engineering Aspects. Part 1. Effects of Processing Conditions on Vanillin Yield and Selectivity.
Ind Eng Chem Res.
2013; 52(25): 8361–8372. Publisher Full Text
- 2.
Global Vanilla and Vanillin Market Trends, Share, Size, Growth, Opportunity and Forecast Report 2019-2024. [cited 2023 Mar 1]. Reference Source
- 3.
Fache M, Boutevin B, Caillol S:
Vanillin Production from Lignin and Its Use as a Renewable Chemical.
ACS Sustain Chem Eng.
2016; 4(1): 35–46. Publisher Full Text
- 4.
Araújo JDP, Grande CA, Rodrigues AE:
Vanillin production from lignin oxidation in a batch reactor.
Chem Eng Res Des.
2010; 88(8): 1024–32. Publisher Full Text
- 5.
Ponnusamy VK, Nguyen DD, Dharmaraja J, et al.:
A review on lignin structure, pretreatments, fermentation reactions and biorefinery potential.
Bioresour Technol.
2019; 271: 462–72. PubMed Abstract
| Publisher Full Text
- 6.
Bomgardner MM:
Following many routes to naturally derived vanillin.
Chem Eng News.
2014; 92(6): 14. Reference Source
- 7.
Wong SS, Shu R, Zhang J, et al.:
Downstream processing of lignin derived feedstock into end products.
Chem Soc Rev.
2020; 49(15): 5510–60. PubMed Abstract
| Publisher Full Text
- 8.
Tarabanko VE, Vigul DO, Kaygorodov KL, et al.:
Catalytic Oxidation of Flax Shives into Vanillin and Pulp.
Catalysts.
2022; 12(9): 1003. Publisher Full Text
- 9.
Zhang R, Maltari R, Guo M, et al.:
Facile synthesis of vanillin from fractionated Kraft lignin.
Ind Crops Prod.
2020; 145: 112095. Publisher Full Text
- 10.
Wu Z, Hu L, Jiang Y, et al.:
Recent advances in the acid-catalyzed conversion of lignin.
Biomass Conv Bioref.
2020; 13(1): 519–39. Publisher Full Text
- 11.
Pinto PCR, Costa CE, Rodrigues AE:
Oxidation of Lignin from Eucalyptus globulus Pulping Liquors to Produce Syringaldehyde and Vanillin.
Ind Eng Chem Res.
2013; 52(12): 4421–8. Publisher Full Text
- 12.
Žabková M, da Silva EAB, Rodrigues AE:
Recovery of vanillin from lignin/vanillin mixture by using tubular ceramic ultrafiltration membranes.
J Memb Sci.
2007; 301(1–2): 221–37. Publisher Full Text
- 13.
Wongtanyawat N, Lusanandana P, Khwanjaisakun N, et al.:
Comparison of different kraft lignin-based vanillin production processes.
Comput Chem Eng.
2018; 117: 159–70. Publisher Full Text
- 14.
Zirbes M, Graßl T, Neuber R, et al.:
Peroxodicarbonate as a Green Oxidizer for the Selective Degradation of Kraft Lignin into Vanillin.
Angew Chem Int Ed Engl.
2023; 62(14): e202219217. PubMed Abstract
| Publisher Full Text
- 15.
Process for the oxidation of carbon-containing organic compounds with electrochemically produced oxidizing agents and arrangement for carrying out the process. Nov 12, 2018. Reference Source
- 16.
Seitz AK, Kohlpaintner PJ, van Lingen T, et al.:
Concentrated Aqueous Peroxodicarbonate: Efficient Electrosyn- thesis and Use as Oxidizer in Epoxidations, S-, and N-Oxidations.
Angew Chem Int Ed Engl.
2022; 61(25): e202117563. PubMed Abstract
| Publisher Full Text
| Free Full Text
- 17.
Di Francesco D, Dahlstrand C, Löfstedt J, et al.:
Debottlenecking a Pulp Mill by Producing Biofuels from Black Liquor in Three Steps.
ChemSusChem.
2021; 14(11): 2414–25. PubMed Abstract
| Publisher Full Text
| Free Full Text
- 18.
Turton R, Shaeiwitz JA, Bhattacharyya D, et al.:
Analysis, synthesis, and design of chemical processes.
- 19.
Bernier E, Lavigne C, Robidoux PY:
Life cycle assessment of kraft lignin for polymer applications.
- 20.
Brinkmann T, Giner Santonja G, Schorcht F, et al.:
Best Available Techniques Reference Document for the Production of Chlor-alkali. 2014; [cited 2021 Apr 27]. Publisher Full Text
- 21.
Abdelaziz OY, Al-Rabiah AA, El-Halwagi MM, et al.:
Conceptual Design of a Kraft Lignin Biorefinery for the Production of Valuable Chemicals via Oxidative Depolymerization.
ACS Sustain Chem Eng.
2020; 8(23): 8823–9. Publisher Full Text
- 22.
Wholesale Kraft Lignin For All Your Storage Demands. Alibaba.com. [cited 2023 Mar 1]. Reference Source
- 23.
Cost Indices. Towering Skills. [cited 2023 Mar 1]. Reference Source
- 24.
Modahl IS, Brekke A, Raadal HL:
Life cycle assessment of cellulose, ethanol, lignin and vanillin from Borregaard, Sarpsborg. 2009. Reference Source