Fuzzy logic controller (FLC)
Fuzzy logic controller (FLC) as a fundamental part of intelligent control, can deal with complex systems with relative ease. The basic architecture of an FLC is shown in Figure 2.1 It comprises of four fundamental elements: 1) fuzzification, 2) knowledge base/rule base, 3) the inference engine and 4) defuzzification.
Fuzzification. The first step of the FLC is the fuzzification of the controller inputs. In here, the crisp output data measured from the sensor is converted to some fuzzy values. These fuzzy values take the degree of memberships using a lookup table filled with linguistic rules that are written based on the system designer’s understanding of the performance of the system under test (Khan & Rapal, 2006; Pratumsuwa et al., 2010).
Knowledge base / rule base. Knowledge base is a repository of control rules written in the form of If-Then statements. The control rules are then applied on fuzzy values/sets to find their appropriate degree of membership (Mamdani & Assilian, 1975; Yamakawa, 1992).
The control algorithm has been developed throughout and implemented using LabVIEW 2017 Real-time (RT) graphical programming environment LabVIEW (RRID:SCR_014325), it may be possible to perform similar functions using the open source PyLab WORKS. Within the GUI, case structures were developed to enable rapid selection of joint simulation environment (spine or hip), controller choice (PI or Fuzzy-PI), as well as input profile to test on the HiL simulation over a defined range of frequencies that are usually experienced in real life by a human doing various daily-life activities.
A fuzzy membership function serves as a visual representation that quantifies the degree of membership for a given value within a defined fuzzy set. To create these membership functions, the Fuzzy System Designer tool within LabVIEW 2017 was employed. This tool facilitated the development of these functions through iterative trial-and-error processes, aiming to achieve optimal performance for the Fuzzy-PI controller.
Figure 2.2, Figure 2.3 Figure 2.4 illustrate the fuzzy triangular membership function. In this representation, the X-axis corresponds to the universe of discourse, which is the numerical range of fuzzy values established by the system designer based on controller specifications and requirements.
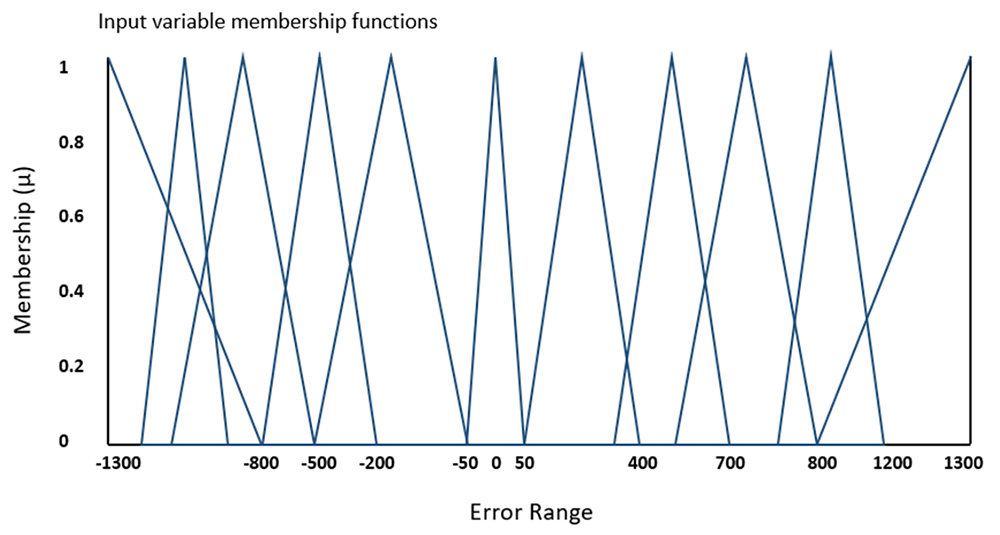
Figure 2.2. Fuzzy membership function for error (e) for proportional-integral (PI) controller.
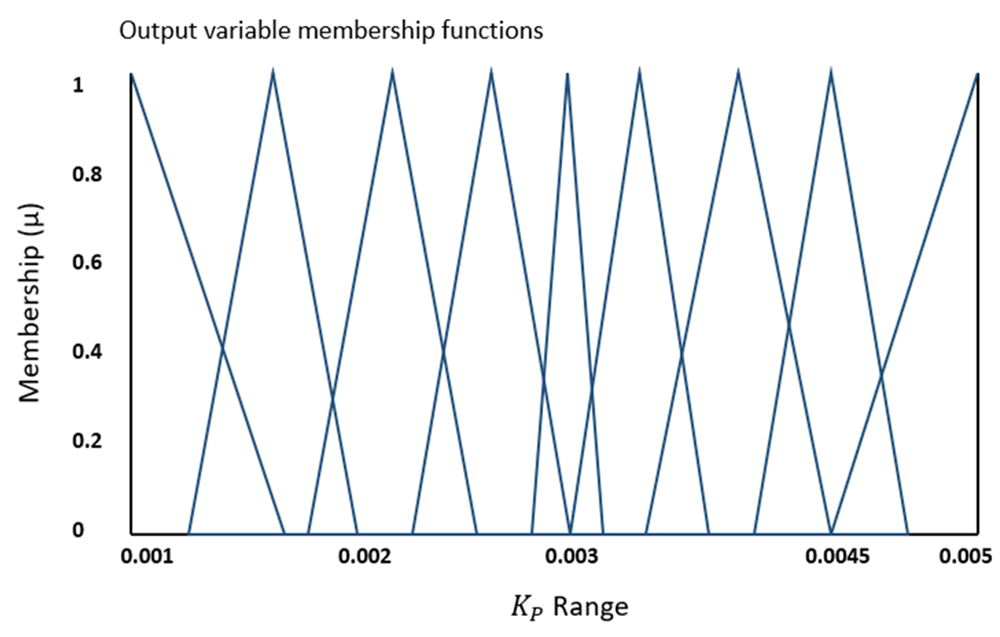
Figure 2.3. Fuzzy membership function for proportional (Kp) gain.
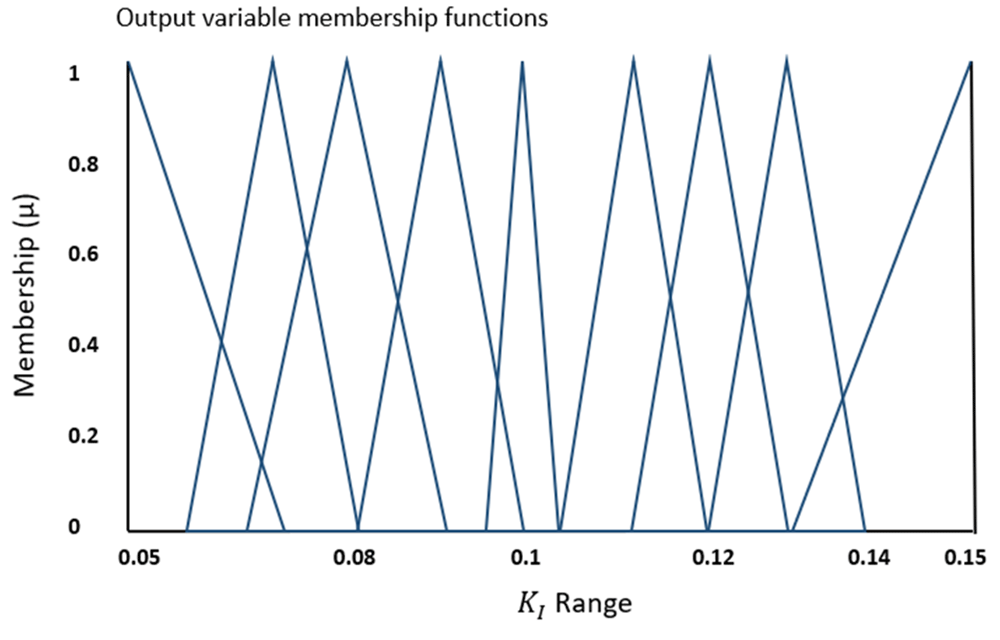
Figure 2.4. Fuzzy membership function for Integral (Ki) gain.
For Figure 2.2, the X-axis range was deliberately selected to encompass the maximum and minimum values of all profiles tested in this study. Similarly, the X axes of Figure 2.3 and Figure 2.4 encompass the complete range of proportional gain (Kp) and integral gain (Ki) values for all error values within the range indicated in Figure 2.2. However, the X axes ranges for Figure 2.3 and Figure 2.4 underwent numerous iterative adjustments. This process involved rigorous testing of each input profile until the Fuzzy-PI controller achieved optimal performance at 1 Hz and 2 Hz, respectively. On the Y-axis, values are represented on a scale from 0 to 1, indicating the degree of membership within this range.
The fuzzy membership functions were created using the fuzzy system designer feature within LabVIEW 2017 software, and the corresponding file has been uploaded to the GitHub repository with a .fs extension. (Iyer, 2023).
The inference engine. The inference engine is responsible for applying the decision rules to a fuzzy input from the feedback sensor in order to generate a fuzzy output. The decision rules are made using If-Then statements that contain the antecedents, for e.g., error and change in error resulting out of the PI controller and the PI gains Kp and Ki are the consequent outputs based on the input.
Defuzzification. In defuzzification, the fuzzy output from the inference engine is mapped to a crisp value that provides the most accurate representation of the fuzzy set (Ebrahimnejad & Verdegay, 2018). Table 2-1 illustrates fuzzy rules which are linguistic expressions of the membership functions expressed in a bounded range for each variable that is used in the fuzzy system. The 11 fuzzy rules indicate 11 input triangular membership functions of Error illustrated in Figure 2.2.
Table 2-1. Fuzzy rules to evaluate error (e) using proportional (Kp), Integral (Ki) using linguistic form.
| Sr no | Fuzzy rules |
|---|
| 1 | If Error is "Extremely Large Neg" THEN Kp is "Very Large" ALSO Ki is "Extremely Small" |
| 2 | If Error is "Very Large Neg" THEN Kp is "Large" ALSO Ki is "Very Small" |
| 3 | If Error is "Large Neg" THEN Kp is "Large" ALSO Ki is "Small" |
| 4 | If Error is "Medium Neg" THEN Kp is "Medium" ALSO Ki is "Medium" |
| 5 | If Error is "Small Neg" THEN Kp is "Medium-1" ALSO Ki is "Medium-1" |
| 6 | If Error is "Near Zero" THEN Kp is "Medium-2" ALSO Ki is "Medium-2" |
| 7 | If Error is "Small Pos" THEN Kp is "Medium-2" ALSO Ki is "Medium-3" |
| 8 | If Error is "Medium Pos" THEN Kp is "Medium" ALSO Ki is "Medium-3" |
| 9 | If Error is "Large Pos" THEN Kp is "Small" ALSO Ki is "Large" |
| 10 | If Error is "Very Large Pos" THEN Kp is "Very Small" ALSO Ki is "Large" |
| 11 | If Error is "Extremely Large Pos" THEN Kp is "Extremely Small" ALSO Ki is "Very Large" |
In this application, the crisp output obtained in the fuzzy controller is by using the center of area method, also commonly referred as the centroid method which is defined below:
It is represented as x, in a fuzzy output distribution to determine a single scalar value. The membership of the fuzzy sets is presented in µc, whereas the value of the membership is represented as xi. Finally, the crisp output from the defuzzifier is an approximation that is used to state the PI gains Kp and Ki (Rizvi et al., 2020). In this application, the derivative gain (Kd) is not used due to its aggressive reaction to the rate of change of the controlled process. Consequently, only a PI controller was tested on the HiL simulation as a comparison to a Fuzzy-PI controller.
A comparison between the PI and Fuzzy-PI controllers was conducted through simulations encompassing 100 cycles of the FE profile derived from the ISO-18192-1 standard and the hip ADL walking profile. The assessment of both controllers' robustness and flexibility involved evaluating their standard deviation. This evaluation was performed with fixed PI gains for the PI controller and a consistent fuzzy membership function for the Fuzzy-PI controller, as depicted in Figure 2.3 and Figure 2.4. These configurations were established after tuning for optimal performance, maintaining constant Kp and Ki gains.
The feedback data from the profiles employed in the HiL simulation was subject to analysis, involving the computation of both the mean and standard deviation over a span of 100 cycles using LabVIEW 2017. The outcome of this analysis produced an averaged waveform representing a single cycle. This averaged waveform was subsequently employed to evaluate the performance of both the PI and Fuzzy-PI controllers, with reference to the specified tolerances delineated in Table 1-1 and Table 1-2.
In the case of the PI controller, the experiment involved extensive trial and error testing of profiles for the spine FE and for the hip ADL profile. After thorough evaluation, the experiment selected the optimal Kp and Ki values of 0.003 and 0.11, which remained consistent throughout the testing process.
For the Fuzzy-PI controller, the range of Kp and Ki gains, represented as fuzzy membership functions in Figure 2.3 and Figure 2.4, was estimated based on the gains obtained for the PI controller. Consequently, the values of 0.03 for Kp and 0.1 for Ki were chosen as the central values within the range depicted in Figure 2.3 and Figure 2.4.
Within the LabVIEW GUI, case structures were established to provide users with the option to select either ISO or ADL profiles for differentiation and utilize it as a set-point for the controller.









