Introduction
Cobalt does not occur naturally in its pure form, but only in the form of minerals containing cobalt. In general, it is not mined directly, but occurs largely as a by-product from copper and nickel production. Global land-based cobalt resources are estimated at 25 million tons. Another 120 million tons are assumed to be found at the bottom of the world’s oceans. The largest reserves are in the Democratic Republic of the Congo (3.5 million tons) and Australia (1.4 million tons)1. The Democratic Republic of the Congo not only has the largest deposits of cobalt ore but is also the leader in cobalt mining. Around 69% of cobalt mined globally in the form of ore in 2020 (142 kt) came from the Congo (98 kt)1. Considerably smaller volumes were produced in Russia (9 kt) and Australia (5.6 kt)2. China is the largest producer of refined cobalt with a market share of around 72% in 20213. More than 80% of China’s cobalt production is used in the country’s own production of lithium-ion batteries2.
Cobalt is a target Critical Raw Material and as reported in the "Supply chain analysis and material demand forecast in strategic technologies and sectors in the EU – A foresight study" report it has an order of Supply Risk as calculated from European Community (2023) equal to 1,7. Actually, this element is used for the following technologies: li-ion batteries, fuel cells, electrolysers, data transmission networks, smartphones, tablets and laptops, additive manufacturing, robotics, drones and space launchers and satellites4.
From an updated market analysis, it was found that many worthy sources report an increase in the capacity of the batteries market and as consequence, the batteries recycling market5.
The JRC Science for policy report, Li-ion batteries for mobility and stationary storage applications (EU, 2018)5 reports that a substantial growth is expected in the near future, ranging from an additional 240 to 450 GWh. With both electric vehicles sales and the global manufacturing capacity for Li-ion battery cells rapidly increasing, the market situation is expected to come into better balance in the near future. By 2028, due to additional capacity and plant expansions in Europe total Li-ion cell manufacturing capacity may reach about 105 GWh, if all current plans and announcements materialize. In the coming decade, depending on the year that the new production lines become operational and near-term market projections, Europe may serve between 7 and 25% of global demand5.
Another updated analysis carried out by Avicenne Energy about the Lithium-Ion Battery (LiB) worldwide market and main trends 2018–2030 reports that the expected growth is about 20% per year in volume. The Li-ion battery sales market is expected to increase up to 2030 exponentially.
The increasing of the batteries on the market results in an increasing of the spent batteries available for their recycling treatment. This upward trend means that the implementation of the technology described in this article makes more sense.
As there are three companies with high production capacities, the market concentration is elevated. The metal industry was the main field of application for cobalt until a few years ago. Rechargeable batteries, in which cobalt is used as a component of the cathode materials, are the largest growth driver on the demand side. A 75 kWh battery consisting of NMC622 cells contains around 13 kg of cobalt which means that producing one GWh of this cell type requires about 177 t of cobalt. According to Adamas Intelligence6, approximately 19 kt of cobalt was used worldwide for batteries installed in new electric vehicles which were sold for passenger transport in the first half of 2022. This corresponds to a considerable 44% increase compared to the prior year6.
The cobalt demand for battery cell manufacturing will be up to 15 times higher by the end of the decade compared to 2021. In this case, the demand for cell manufacturing alone would equal approximately 3.6 times the total global cobalt supply of 2020.
The increase in its industrial demand makes its recovery process from profitable sources, like spent batteries, very attractive to investors who want to put a stable supply of feedstock in the market. It would be advantageous to the European economy, if Europe were to adopt a supply chain model similar to that of China, where intermediaries, battery producers and auto manufacturers are in regional proximity. This ensures timely deliveries, reduced costs, closeness to the consumer and less risk of disruption to supply.
COVID-19 did not stop the overall growth in the Electric Vehicle (EV) market in Europe, but it did expose the risks and dependencies in the current supply chain. The recovery of cobalt as a secondary raw material proposed aims to drastically reduce the very high supply risk of cobalt for Europe. This supply risk arises from the fact that Europe is unable to self-sustain, cobalt consumption is greater than that deriving from mining. For this reason, Europe is heavily dependent on the following markets, Russia and Australia, China which for various reasons could decide to interrupt supply. Recovering cobalt from batteries with this technology can contribute to reducing this dependence.
Currently no cobalt recovery plants realized by direct competitors carry out the CROCODILE process to recover cobalt from spent batteries. The existing technologies are based on pyrometallurgical treatment for the recovery of a mixture of metals which usually appear to be present in the slag. Their main problems consist of high investment costs (furnaces) and high energy consumption despite the energy recovering from plastic materials and other organic components of the spent batteries. Other types of treatments used for the recycling of lithium-ion batteries consist of hydrometallurgical or mechanical treatments or a combination thereof. Table 1 below shows the reported comparative study of current competitors recycling processes for the treatment of lithium-ion batteries that have reached the end of their life in Europe and outside Europe7. In particular, the Table 1 compares the various existing technologies, indicating both the technological level, the type of treatment and the materials recovered.
Table 1. Comparative study of Li-ion battery recycling processes.
NOTE: M: mechanical treatment; H: hydrometallurgical treatment; P: pyrometallurgical treatment; T: thermal pre-treatment.
| Scale | Company/State | Type of treatment | Recovered materials |
|---|
Industrial scale
(>1000 t/a) | Umicore (BE) | P + H | Metal alloy (containing Ni, Co, Cu, Fe) and slug
(containing Al, Li, Mn). |
| Accurec (DE) | T + M + P + H | Steel fraction, Cu/Al fraction and electrode powder (rich
in Co and Ni). |
| Nickelhütte Aue (DE) | T + P + H | Ni, Cu, Co chemicals and building material for roads and
highways (more info are not disponible). |
| SungEel HiTech(KR) | M + T + H | Magnetic and not magnetic fraction (Cu, Al) and metal-
salts (Co, Mn, Ni, Li). |
| Kyoei Seiko (JP) | P | Steel and slug (containing Ni, Co, Cu, Al and Li). |
| Dowa (JP) | T + P + H | Ni, Co, Cu. |
| Brunp (CN) | T + M + H | Ni-Mn-Co hydroxide, cobalt sulfate, nickel sulfate, cobalt
chloride. |
| GEM (CN) | M + H | Co/Ni-salts. |
| Huayou Cobalt (CN) | M + H | - |
Ganzhou Highpower
(CN) | M + P + H | - |
Pilot scale (<1000
t/a) | SNAM (FR) | T + P + H | - |
| EDI (FR) | M
(aqueous shred + unknown) | Iron scraps, papers with plastics, and nonferrous metals
and slag (containing Co, Ni, and Cu). |
| TES-AMM (“Recupyl”) (FR) | M (inert gas) | Plastics, Al, Cu, Steel and electrode powder. |
| AkkuSer (FI) | M + unknown | Iron flakes and metal concentrate powder. |
| Duesenfeld (DE) | M + H | Co salts, Li salts, Ni salts, Mn salts, graphite, electrolyte,
Al, steel and plastics. |
| Promesa (DE) | M (aqueous shred) +
unknown | Co/Ni materials (not specified the form). |
| Redux (DE) | T + M + unknown | Steel, Al, Cu, plastic and black mass. |
| Retriev (US) | M (aqueous) + H | Metal solids (containing various amounts of copper,
aluminum, and cobalt, not specified the form). |
| Kobar (KR) | M+ H | Fe-Ni-alloys and Cd-metal, cobalt oxalate and filtrate
containing Li, Fe, Al and Cu. |
| JX Nippon (JP) | T + M + H | Lithium carbonate, metallic Co and metallic Ni. |
| Telerecycle (CN) | M + H | Co-sulfate and lithium carbonate. |
| Guanghua (CN) | M + H | Black mass (rich in Co, Ni and Mn). |
| Lab scale | Erlos (DE) | M + reconditioning (direct
recycling) | Cu foil, Al foil, graphite and cathode material. |
Table 2 shows the current European competitors for the technology described in this paper, which, starting from the electrode powder coming from the lithium-ion batteries, recover Cobalt with their recycling processes.
Table 2. Current competitors who recover Cobalt from electrode powder of lithium batteries.
| Company | State | Capacity | Type of process and recovered materials |
|---|
Industrial plant
(currently
existing) | Volkswagen Group | Salzgitter
(Germany) | 1500 tons/y | Mechanical separation which would be followed by a pyro-
metallurgical process. The product is a “black powder” rich
in Li, Ni, Mn, Co and graphite. |
| UMICORE | Hoboken
(Belgium) | 7.000
tons/y | Chemical processes (calcination, extraction/ leaching). It is
possible to recover Li, Co, Ni, Cu and REE. |
| Fortum | Harjavalta (Finland) | > 3.000
tons/y | Mechanical and hydrometallurgical treatments. The
materials recovered can be used in new battery products. |
Stena Nordic
Recycling Center | Halmstad
(Sweden) | 10.000
tons/y | Treatment focused on the recovery of Li, Co, Ni, Cu and
REE. |
| Northvolt | Skellefteå
(Sweden) | 125.000
tons/y | Treatment focused on the recovery of Ni, Mn and Co. |
| MORMOR ECOSTOR | (Norway) | 10.000
tons/y | - |
GLENCORE
BRITISHVOLT | Northfleet (Great
Britain) | 10.000
tons/y | - |
GROUP RENAULT
VEOLIA | Amneville (France) | 4.000
tons/y | Mechanical and hydrometallurgical treatments. The
materials recovered can be used in new battery products. |
| Librec | Switzerland | 8.000
tons/y | Mechanical and hydrometallurgical treatments. The
materials recovered can be used in new battery products. |
| Mercedes | Kuppenheim
(Germany) | 2.500
tons/y | Treatment focused on the recovery of Li, Co, Ni, Al. |
| ACCUREC | Krefeld (Germany) | 3.250
tons/y | Treatment focused on the recovery of Fe, Li, Mn, Co, Ni, Cu
and Al. |
In this publication the results of the demonstration campaign realized on the first economically and environmentally viable mobile commercial metallurgical plant based on advanced hydrometallurgical and electrochemical technologies able to produce cobalt metal from black mass containing cobalt from different sources of waste streams such as spent batteries are described. The process validated in the pilot scale is made up of three different sections: leaching, liquid-liquid extraction and electrolysis. The first has the purpose of carrying out a selective leaching of the cobalt, the second aims removing the impurities from the lye and concentrating it into cobalt and the third concerns the deposition and therefore recovery of metallic cobalt. During the intense demonstration campaign carried out on the pilot plant, the optimization of the operating parameters of the process was carried out. Based on this optimization, both the material balance and the energy balance for the process as a whole were calculated. These data were subsequently used to carry out the life cycle analysis and the life cost analysis.
Methods
Materials
Demonstration activities were performed using the black mass provided by ACCUREC. During all the demonstration activities, a total amount of 1100 kg of black mass was used. End Of Life (EOL) Lithium batteries have been manually sorted by ACCUREC staff and subsequently they underwent a heat treatment aimed both at deactivating batteries and at the same time removing the solvents and plastics present in them. The material obtained, in turn, underwent a series of physical treatments necessary to obtain the electrode powder (black mass) low in impurities such as aluminum and copper and rich in cobalt. From this analysis realized on the black mass used in the demonstration campaign, it emerged that the following EWC code was to be attributed to this waste: 191212 (Other wastes (including mixed materials) from mechanical treatment of waste other than those mentioned in 19 12 11). This waste did not fall into the class of hazardous waste.
In addition, Eco Recycling previously obtained from the competent bodies the environmental authorization necessary for the receipt of this waste and the implementation of the related treatment aimed at recovering metallic Cobalt.
Process Demonstration and Product Characterization
The proposed process included three main sections: leaching developed by TECNALIA, liquid-liquid extraction developed by KU Leuven and electrowinning developed by SINTEF. Eco Recycling provided support during the design phase, and was the responsible of the pilot construction, the start-up and the demonstration activity. Figure 1 shows the block diagram of the process performed with the pilot plant.
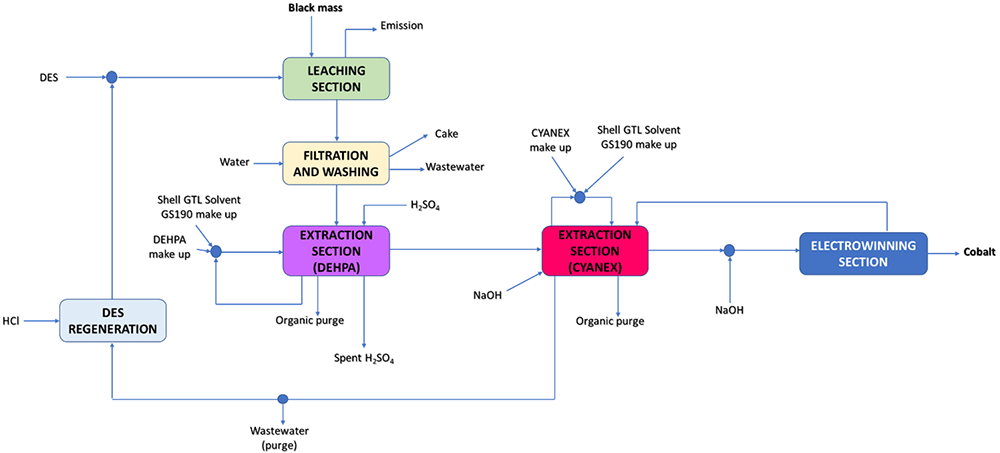
Figure 1. Process flow diagram for the innovative recycling process divided by sections.
The leaching section is composed of the leaching reactor and the solid-liquid separation unit. In particular, in the reactor before feeding the Black Mass (BM), the preparation of the Deep Eutectic Solvents solution (composed of a mixture of lactic acid, citric acid, choline chloride and water) is carried out which is selective for the leaching of the Cobalt present in the BM. After loading the BM, through the boiler serving the leaching reactor, the heating of the mass took place until the operating temperature was reached. At the end of the leaching treatment, the suspension underwent a filtration treatment. This operation took place by recirculating this suspension between the reactor and the filter press. From this treatment are thus obtained, the liquid process stream (lye) and a solid phase referred to as cake (able to be valorized due to its carbon content).
The lye coming from the solid-liquid separation treatment, is fed to the solvent extraction section.
Specifically, this section is made up of its own sections: the first is that relating to DEHPA treatment while the second is that relating to CYANEX treatment. The first is aimed to remove impurities (as Al, Cu, Mn) from the DES lye. In this section, the regeneration of the DEHPA + Shell GTL Solvent GS190 solution also takes place using a sulfuric acid solution. The second section, on the other hand, has the purpose of extracting the Co from the DES lye (defined in this publication as refined) by first using an organic solution of CYANEX + Shell GTL Solvent GS190 and then by stripping it with a sulfuric acid solution. The stream of refined DES leaving the CYANEX section, before being recirculated at the next leaching, undergoes a regeneration treatment using a hydrochloric acid solution.
The sulfuric solution, rich in Cobalt, coming from the CYANEX section is then the feed to the electrolysis section so as to realize the deposition of the metallic Cobalt inside the electrolysis cell.
Eco Recycling took randomly three representative samples from the BM fed to the process, for each batch performed, on which chemical characterization analyzes were carried out aimed at identifying the concentration of the different metals present in the feedstock and so to define the yields of the leaching treatment. In order to perform the mineralization tests microwave assisted digestion (Ethos Milestone srl) has been used. Table 3 shown the operative condition used to perform the tests.
Table 3. Mineralization tests conditions.
| OPERATIVE CONDITION |
|---|
| SAMPLE | Reagent | Temperature (°C) | Time (min) |
|---|
| Black mass | 4 mL HNO3 + 4mL HCL + 2mL H2O2 | 200 | 30 |
After mineralizations, the resulting solutions were appropriately diluted and analyzed using an Atomic Absorption Spectrophotometer (AAS-ContrAA300 Analytic Jena GBH).
All process streams were periodically analyzed and characterized with regards to their chemical composition. These characterizations were essential to have a quantitative flow of cobalt in the different streams and at the same time to verify and define the yields associated with each treatment and the analysis if the metal in solution have been realized using the atomic absorption spectrophotometer (ContrAA 300 Analitik-jena) or the spectrophotometer (DR3900). All the solid compounds (Cobalt and cake) have been periodically sampled and characterized for their chemical composition by digestion and analytical determination of metal in solution by atomic absorption spectrophotometer (ContrAA 300 Analitik-jena). Figure 2 shows a view of the pilot plant used to carry out the demonstration campaign aimed at validating the innovative process developed.
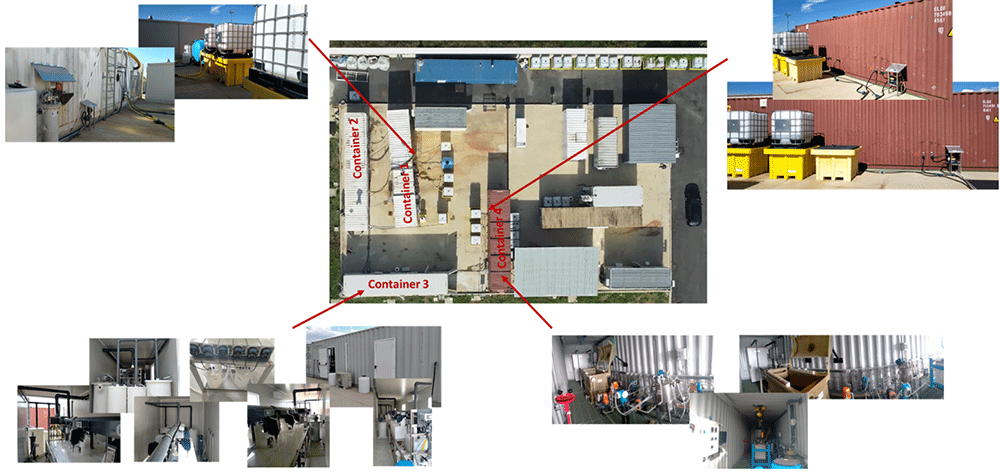
Figure 2. Pilot plant used to carry out the demonstration campaign.
In particular the CROCODLE plant is composed respectively of three distinct sections:
leaching section (container 1 and container 2): in container 1 there is a reactor equipped with a boiler to carry out the leaching treatment, a filter press for solid-liquid separation, an intermediate storage tank and a compressor. In the second container, however, there are three reactors used for the storage of chemicals and an abatement system for acid emissions.
extraction section (container 3): in this container are present ten mixer settlers each equipped with local pH control and the possibility of locally varying the stirring speed thus improving the contact of the phases; ten pumps for pH adjustment; four coalescers; six intermediate tanks for the storage of feeds to the process and products; each equipment is equipped with the capture of the vapors (acids and organic produced in the process) involved in treatment with activated carbon after emission into the atmosphere; two basket filters; four tanks for the storage of the organic reagents used in the extractions; thirteen pumps for handling fluids; four tanks for the storage of the reagents used for pH adjustment; four tanks for the intermediate storage.
electrolysis section (container 4): in this container are present a tank inside which both the pH adjustment and the heating take place, an electrolysis cell, a current rectifier, a tank inside which both the pH adjustment and the cooling take place, six pumps used for handling of process streams, two pumps used for pH adjustment, an emergency tank and a scrubber. Each equipment is equipped with the capture of the vapors (acids produced in the process) which are broken down in the scrubber before being released into the atmosphere.
Life Cycle Assessment and Life Cycle Cost Analysis
The purpose of this LCA and LCC is to deliver an assessment of the technologies developed in the CROCODILE project to identify hotspots. The definition of the life cycle assessment methodology was carried out following the ISO 14040:2006 and 14044:2006 standards. On the other hand, the life cycle costing methodology was defined following the same guidelines as in the environmental analysis case, but also taking the ISO 15686-5 and ISO 15663 standards into account. The LCA methodology consists in the application of four interrelated stages: goal and scope definition, inventory analysis, impact assessment and interpretation of the results. A cradle-to-gate is the chosen system boundaries approach to be employed. This approach implies that the impacts (e.g. environmental and economic) are calculated from the extraction of raw materials until the metal is obtained. More specifically, the system includes the production of the required raw materials (chemicals, water, etc.), the energy used during the manufacturing process, the emissions generated due to the chemicals reactions as well as the treatment and disposal of any waste generated.
On the base of mass and energy balances obtained during demonstration activities, environmental impact of the developed process has been assessed by life cycle impact assessment (LCIA), which includes both the classification and characterization steps and the normalization and weighting phases. It was chosen to carry out this study using SimaPro Software-System, as it is among the leading LCA software, in fact can be used for various applications: sustainability reporting, carbon, environmental, social and water foot printing, biodiversity assessments, sustainable product design, and blackberries. This study can also be replicated using open-source software such as OpenLCA and background data (energy and consumables production, emission and waste generation) and inventory data for benchmark technologies (Relion, Fisher-pyro, fisher-hydro, duarte, ecoinvent-pyro, ecoinvent-hydro) were obtained from specific LCA databases (e.g., Ecoinvent) and from bibliographic literature research. The data collected were representative for Europe and an attempt was made to obtain the most up-to-date inventory data possible. The impact categories and the related characterization methods were selected in agreement with the Product Environmental Footprint (PEF) guidelines (environmental categories, recommended models at midpoint, together with their indicators, characterization factors, units and sources) and in accordance with the nomenclature and properties of the International Reference Life Cycle Data System ILCD recommendation. In this regard, the ILCD Handbook represents the basis of the EF method. The analysis considered the impacts on the categories of acidification terrestrial and freshwater, climate change, ecotoxicity freshwater, eutrophication (freshwater, marine, terrestrial), ionizing radiation (human health), land use, cancer/non cancer human health effects, ozone depletion, photochemical ozone formation (human health), resource use, energy carriers, resource use minerals and metals, respiratory inorganics and water scarcity. The normalization and weighting step allowed the determination of the relevance of the different environmental impact categories.
In the case of the Life Cycle Costing, the following cost categories have been selected:
Capital expenditure (CAPEX): are the funds used by a company to acquire, upgrade, and maintain physical assets such as property, plants, buildings, technology, or equipment. In this assessment. CAPEX has been calculated considering only the main equipment and some costs related to the assembly and starting up of the plant. The expected lifetime plan considered is 8 years with an idle time of 10 %.
Operational expenditure (OPEX): are the costs that a company has to assume on an ongoing day-to-day basis to run a business or system. These costs are sorted in the following categories:
– Raw material cost: this category includes those costs that represent the purchase/collection of the essential raw material, in this case the black mass.
– Ancillary material cost: includes the direct costs concerning the chemical products, gases, general facilities as water and compressed air and any other materials involved in the operation, maintenance, control, and supervision of the technology developed. Thus, the economic evaluation focuses exclusively on the technology and allows a more objective comprehension of the technologies analyzed.
– Energy cost: represents the purchase of the energy required in the analysed technologies.
– Personnel cost refers to the direct costs concerning the operation, maintenance, control and supervision of the facilities involved in the technology that was developed.
– Maintenance cost: this category of costs includes the maintenance (personnel, materials, and subcontracting) of the facilities involved in the technology. Only the personnel costs were considered.
– Waste treatment cost: includes the direct costs such as residual flue gases, wastewater, air emissions, etc., involved in the operation, maintenance, control, and supervision of the technology developed.
– Waste disposal cost: this category includes the direct costs concerning the waste disposal costs (solid and especial wastes requiring disposal facilities), involved in the operation, maintenance, control, and supervision of the technology developed.
– Packaging cost: this category includes the direct costs concerning the packaging and final product conditioning and manipulation required to its shipment.
– Transport cost: this category includes the direct costs concerning the transport of the final valuable product to the customer.
Both, packaging and transport costs were not included in the LCC plant assessment as it was conceived to be used as a mobile plant.
A specific customized tool was developed considering the process specificities. The overview of its structure is described in the following Figure 3:
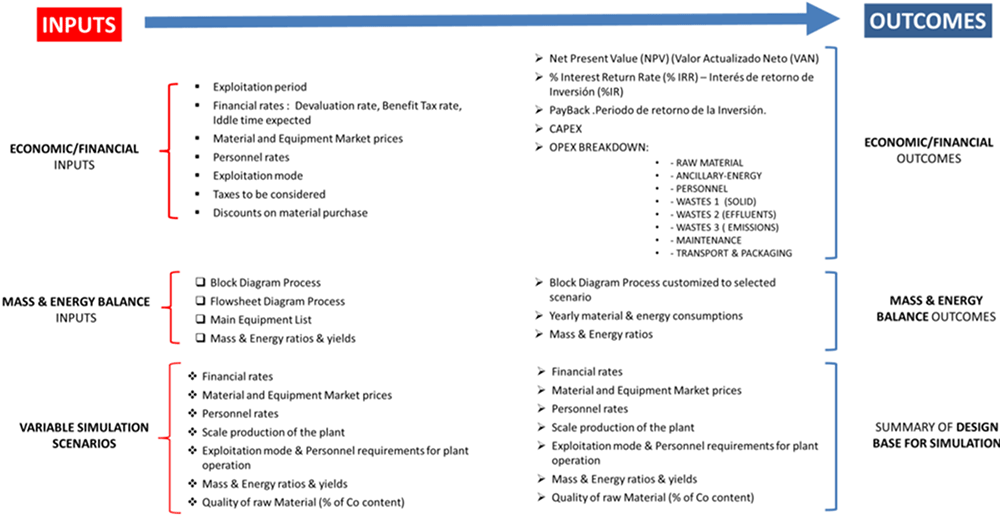
Figure 3. Overview of the customized tool developed to evaluate the LCC for pilot plant.
Valuable nickel derivates have been included as a complementary potential income of the process. As the refining process of valuable nickel derivates was not in the initial scope, assumptions in terms of yields and prices for this outcome stream, as well as the final purity of the product, were approached both theoretically and based on preliminary lab scale results. The high variability of the metal cobalt price observed throughout the development of the project, suggested as a reasonable measure to include it in the calculations as it could be essential to validate the profitability of the process.
Six economic parameters have been selected to assess the validation of the technology tested in the pilot:
– CAPEX (€/Tn Co produced);
– OPEX (€/ Tn Co produced);
– TOTAL BENEFITS OVER 8 YEARS FOR ONE PLANT;
– NPV (Net Present Value) (€);
– IRR (Internal Rate of Return) (%);
– Payback period (Years).
In the cases were the information was available, these considerations were used to compare the novel technology developed with the current existing State Of Art (SoA) technologies.
Results
Process Demonstration and Product Characterization
Leaching treatment. The values obtained by averaging the concentrations measured for the different black mass samples fed to the process are reported in Table 4.
Table 4. Metal concentrations (%wt) found in the samples used to perform the leaching treatments.
| Metal | Black mass | Black mass | Black mass | Black mass | Black mass | Black mass |
|---|
| Average (%wt) | Average (%wt) | Average (%wt) | Average (%wt) | Average (%wt) | Average (%wt) |
|---|
| Aluminium (Al) | 3.7 ± 1.6 | 3.0 ± 0.3 | 3.1 ± 0.3 | 3.5 ± 0.4 | 3.5 ± 0.4 | 3.7 ± 0.2 |
| Cobalt (Co) | 27.5 ± 3.0 | 19.7 ± 0.2 | 17.3 ± 0.1 | 26.3 ± 0.1 | 26.2 ± 0.1 | 27.6 ± 0.2 |
| Copper (Cu) | 1.3 ± 0.3 | 1.7 ± 0.3 | 1.6 ± 0.1 | 1.5 ± 0 | 1.6 ± 0 | 1.2 ± 0 |
| Lithium (Li) | 3.6 ± 0.4 | 4.3 ± 0.1 | 4.3 ± 0.1 | 3.2 ± 0.1 | 3.2 ±0.2 | 3.5 ± 0.4 |
| Manganese (Mn) | 4.1 ± 0.2 | 6.4 ± 0.1 | 6.4 ± 0.1 | 3.5 ± 0.1 | 3.5 ±0.1 | 4.0 ± 0.2 |
| Nickel (Ni) | 4.6 ± 0.3 | 6.2 ± 0.5 | 6.2 ± 0.7 | 4.1 ± 0.2 | 4.1 ± 0.2 | 4.2 ± 0 |
| Molibdenum (Mo) | 0.04 ±0 | - | - | - | - | - |
The leaching tests were carried out using the optimal operating conditions defined by TECNALIA in lab scale but based on the results of each test Eco Recycling carried out an optimization on a prototype scale. In fact, it should be emphasized that in the passage of scale for the leaching treatment, the important fact is the fluodynamic inside the reactor. Overall, 1000 kg of black mass were used to perform 10 leaching treatments using fresh reagents and 100 kg of black mass were devoted to performing one leaching treatment with regenerated Deep Eutectic Solvent. Table 5 reports the leaching yield obtained for each test performed.
Table 5. Leaching yields for each test performed during the demonstration campaign.
| Fresh DES | Regenerated DES |
|---|
| Test | 1st | 2nd | 3rd | 4th | 5th | 6th | 7th | 8th | 9th | 10th | 11th |
|---|
| Al | 92.6% | 47.9% | ** | ** | 81.8% | 90.2% | ** | 95.6% | 99.7% | 99.8% | - |
| Co | 64.4% | 56.1% | 88.2% | 88.7% | 84.1% | 87.2% | 92.0% | 91.1% | 88.4% | 87.9% | 75% |
| Cu | 72.5% | ** | ** | ** | ** | ** | ** | 96.2% | 99.9% | 99.7% | - |
| Li | 99.4% | 61.1% | 99.1% | 90.9% | 88.4% | 92.3% | ** | 94.9% | 98.1% | 97.1% | - |
| Mn | 99.5% | ** | 96.4% | 67.9% | 95.8% | 92.4% | 84.3% | 79.6% | 95.4% | 95.3% | - |
| Ni | 53.7% | 44.4% | 51.2% | 65.0% | 52.5% | 51.7% | 66.2% | 66.7% | 50.5% | 51.1% | 44% |
| Mo | 91.1% | 90% | - | - | - | - | - | - | - | - | - |
These trials were sufficient to obtain yields similar to those determined as in the laboratory. In the ten tests carried out, the stirring speed was modified and optimized by increasing it due to issues related to the fluid dynamics in the reactor. In fact by optimizing the stirring speed in the reactor it was possible to increase the resulting yield, obtaining the achievement of a maximum leaching extraction yield for cobalt equal to 92.0% for fresh reagents and 75% for regenerated Deep Eutectic Solvent. broadly confirming the results obtained on previous laboratory scale by TECNALIA.
Extraction treatment. Following the implementation of the 1st leaching, Eco Recycling has also started the extraction section (both the DEHPA section and the CYANEX section). The running of the extraction sections were carried out using the optimal operating conditions defined by KU Leuven in lab scale, but based on the results of each test, Eco Recycling carried out an optimization on a prototype scale. In fact, it should be emphasized that in the passage of scale some operating parameters need to be optimized (such as the quantity of reagent used for pH adjustment). Specifically, Eco Recycling for the DEHPA section verified whether it was necessary to make a pH adjustment both in the extractors and in the strippings. From the campaigns carried out it emerged that by not making this adjustment the impurity removal yields were in line with those expected, in addition should be possible a considerable saving in terms of reagent consumption (OPEX). Thus, confirming the need to have this section in the process. As regards the section for the extraction of cobalt from lye, i.e. that of CYANEX, an intense activity was carried out during the demonstration campaigns to optimize the parameters related to the extraction of cobalt (pH and saponification). In the following Table 6 are reported the extraction yield obtained from each test performed. Specifically, this table shows the extraction yields of the DEHPA section (aimed at the removal of impurities) and those of the CYANEX section (aimed at the extraction of cobalt).
Table 6. Extraction yields for each test performed during the demonstration campaign.
| Test | 1st | 2nd | 3rd | 4th | 5th |
|---|
| DEHPA
sec. | CYANEXV sec. | DEHPA
sec. | CYANEX
sec. | DEHPA
sec. | CYANEX
sec. | DEHPA
sec. | CYANEX
sec. | DEHPA
sec. | CYANEX
sec. |
|---|
| Al | 50.9% | ** | 63.2% | 33.7% | 52.8% | 33.2% | 50.60% | ** | 50.40% | 33.2% |
| Co | 3.6% | 16.5% | 2.1% | 59.3% | 2.2% | 59.8% | 3.10% | 60% | 3.61% | 45.9% |
| Cu | ** | ** | ** | ** | ** | ** | ** | ** | ** | ** |
| Li | 2.9% | ** | 3.1% | 1.8% | 3.1% | 1.7% | 3.10% | 2.9% | 3.20% | 1.7% |
| Mn | ** | 81.5% | 99.4% | ** | 99.1% | 99.9% | 96.00% | ** | 93.10% | ** |
| Ni | 0.8% | 2.9% | 23.8% | 0.2% | 7.0% | 0.2% | 6.00% | 0.2% | 5.10% | 0.2% |
| Mo | 94% | - | - | - | - | - | - | - | - | - |
In addition, in both sections Eco Recycling also took care of optimizing the stirring speed in all settler mixers. In fact, this parameter turned out to be fundamental since the contact surface of the phases depended on it. Following the optimization of the process on a prototype scale, the following impurity removal yields were achieved in the DEHPA section equal to 53.6% for Al and 97.5% for Mn (these values were considered as the average of the yields obtained from the tests) while the maximum extraction of cobalt in the CYANEX section about equal to 60%.
Electrowinning treatment. Once the extraction section was started, it was possible to collect the sulfuric rich in Cobalt, which was used to fill the equipment present in the electrolysis section. The running of the electrowinning section was carried out using the optimal operating conditions defined by SINTEF in lab scale, but based on the results of each test, Eco Recycling carried out an optimization on a prototype scale.
In the following Table 7 are reported the total content of the metals present in the cathodic deposition and the current efficiency are reported for the different tests performed.
Table 7. Total content of the metals presents in the cathodic deposition in the different tests performed and the current efficiency.
| Test | 1st | 2nd |
|---|
| Current efficiency | 48% | 61% |
| MATERIAL DEPOSITED
ON THE CATHODE | MATERIAL DEPOSITED
ON THE CATHODE | MATERIAL DEPOSITED
ON THE CATHODE |
|---|
| Al | 0.9% | 0.5% | 1.1% |
| Co | 97.1% | 97.4% | 97.2% |
| Mn | 1.0% | 1.4% | 1.0% |
| Ni | 0.4% | 0.04% | Traces |
| Fe | 0.6% | 0.7% | 0.7% |
Following the optimization of the process on a prototype scale, were reached a current efficiency equal to 61% and a deposition yield of 63%wt with a cobalt content within the cathode deposit equal to 97.4% and an impurities content equal to 2.6%.
Figure 4 shows an overview of the demonstration campaign carried out on the pilot plant.
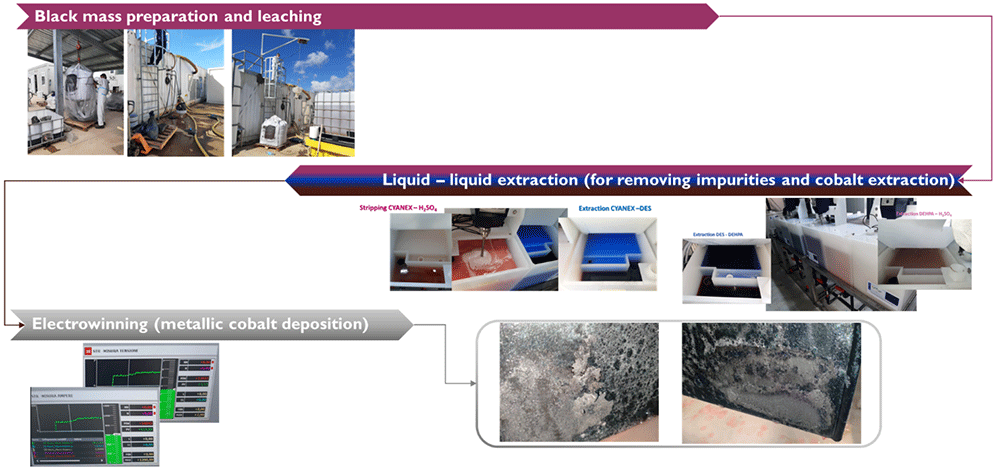
Figure 4. Overview of the demonstration campaign carried out.
Life Cycle Assessment
Figure 5 shows the main hotspots of the pilot plant. Material use is the main source of impact in 11 of the 17 categories analysed. Its average contribution is 46% and it reaches the maximum in the “Resource use, minerals and metals” and “Human toxicity noncancerous” categories with 74% and the minimum in the “climate change” category with 15%.
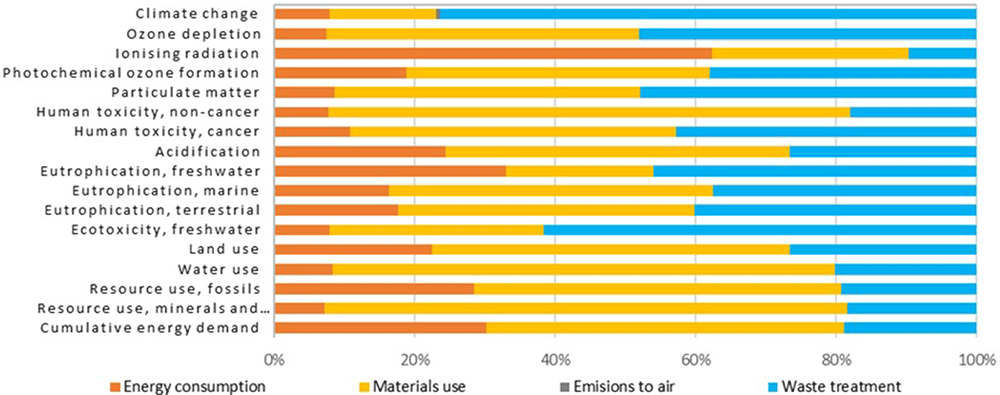
Figure 5. CROCODILE LCA results per category analysed.
All impact categories except “cumulative energy demand” were normalized and weighted following the PEF methodology to achieve a single score (see Figure 6). Results show that treating the expent solvent mixture produces 54% of the impact, followed by lactic acid (15%) and electricity (14%). Chlorine chloride is responsible for 6% of the total impact and citric acid 4%. Therefore, the rest of the materials are practically negligible.
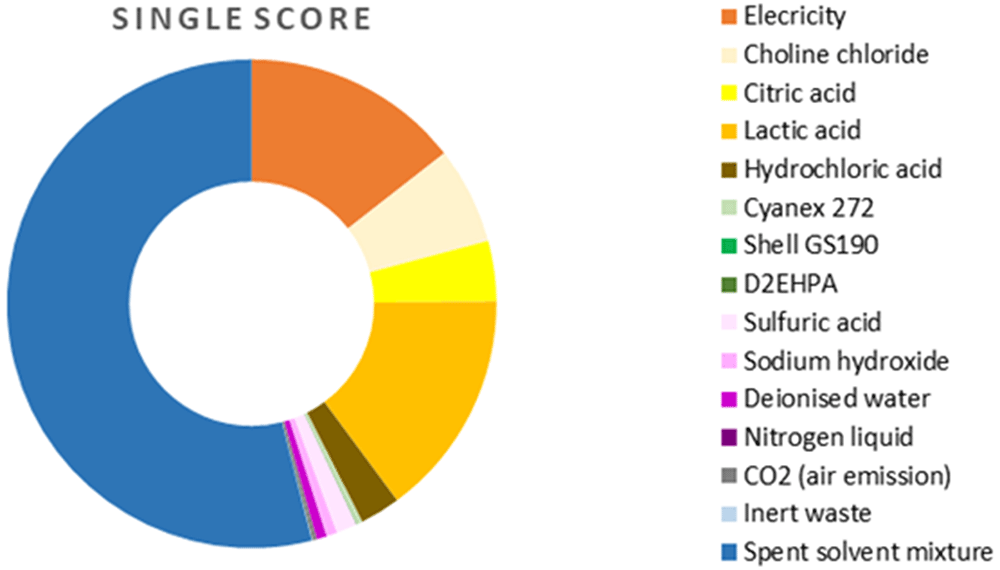
Figure 6. CROCODILE LCA results per dataset analysed.
Single score.
Regarding the SoA, the information found in the literature was limited and ensuring a proper comparability would imply applying the same hypothesis to all the references. Therefore, only those references which were already adapted were employed. As it can be observed in Figure 7, In certain impact categories, the validated pilot, not yet fully optimized, already performs better than the SoA processes: in the ionising radiation (IR) category, CROCODILE produces an impact like Relion process; particulate matter (PM) and human toxicity (non-cancer (HT-NC) categories, where the performance of CROCODILE is much better, especially with respect to the human toxicity (non-cancer) (HT-NC) impact; human toxicity (cancer) (HT-C) and freshwater ecotoxicity (ETF) categories, where CROCODILE is better than the Fisher pyrometallurgical process.
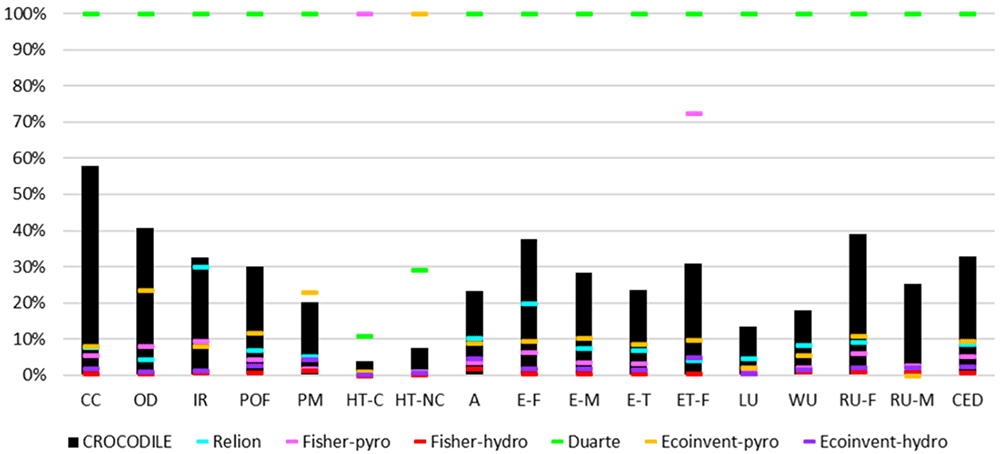
Figure 7. Novel technologies based Pilot and SoA LCA results comparison.
Life Cycle Cost
CAPEX
The CAPEX of the CROCODILE pilot plant was calculated considering the supply of the main equipment and was estimated in 621 K€ for a plant with a production capacity of 11 Tn Co metal/year.
OPEX
The breakdown of OPEX costs is detailed in Figure 8.
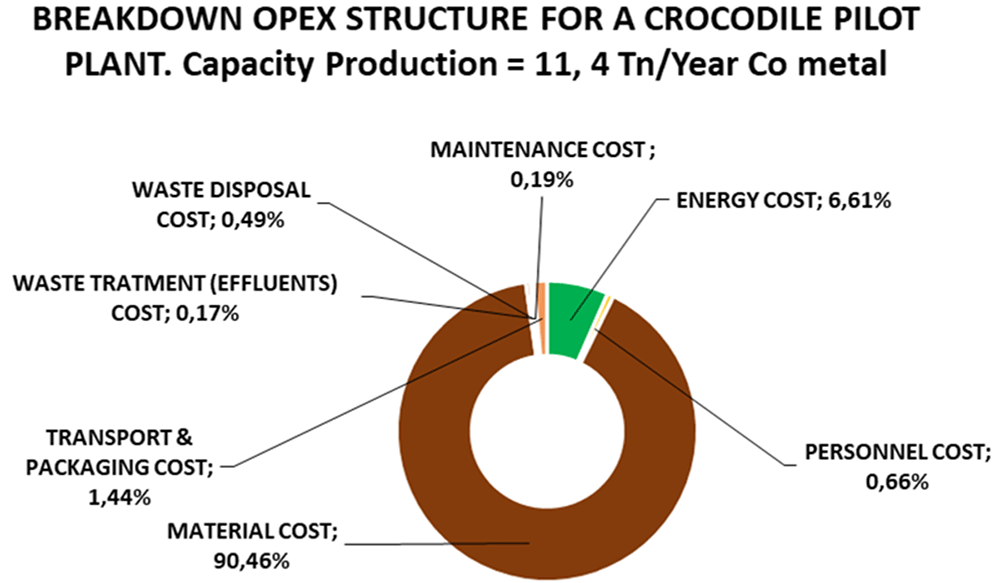
Figure 8. Detailed Breakdown Estimated OPEX CROCODILE Pilot Plant.
| TOTAL OPEX / Tn Co produced (€/Tn Co) | 69,632.70 € |
The high figure for raw material’s cost is a consequence of the price for the black mass, as it was calculated as a linear ratio of the cobalt content of the black mass and the market LME reference price for cobalt metal. This ratio also includes an estimation for the losses during the recovery process for Co metal.
To evaluate the conditions for profitability of the CROCODILE process at a pilot plant scale four different scenarios were proposed. The Table 8 summarizes the economic results obtained concerning the four options that were proposed. As it can be observed, if the incomes of the pilot plant were based only on the cobalt metal sales (Scenario 1) or on the combination of the cobalt metal and nickel derivates obtained as subproducts of the process (Scenario 2), the profitability of the process is not possible: net present value (NPV) negative in both cases and thus, no payback period possible. If we consider the incomes of the process at a pilot plant scale increased by the sales of the rest of existing valuable products, lithium, manganese and graphite (Scenario 3), the plant turns on to a profitable horizon showing NPV results >1M€ in a 8 years exploitation expected period and a payback < 5 years. This situation becomes more profitable in Scenario 4, where the incomes come from the sales of the whole valuable products obtained and the global yield for the Co recovery increases to 90% of the Co present in the Black Mass. This represents a reasonable scenario considering that the upscaling of the pilot plant to an industrial scale will perform better results in terms of mass and energy balances. Thus, this scenario 4 would represent NPV > 1,46 M€ for an exploitation period of 8 years and a payback period < 5 years at a pilot plant scale.
Table 8. Scenarios proposed to evaluate the profitability of the CROCODILE technology at a pilot plant scale.
| Pilot Plant Scenarios Description |
|---|
SCENARIO 1:
• Selling price for Co metal: 39,000 €/Tn (according to LME information of 03/02/2023)
• No extra incomes from Ni valuable derivates selling
• Black Mass Flat Rate = 750 €/Tn
• Co content in BM = 27.5%
• CROCODILE Co production Yield = 67.2%
• Maximal capacity plant available = 55.7 Tn BM/year
• Co metal production in simulation: 12.75 kg Co metal/day = 4.19 Tn Co metal/year |
Estimated Plant capacity
(kg Co metal/day) | Payback period (years) | CAPEX (€) | OPEX (€/Tn Co metal) | Black Mass estimated
Flat rate (€/kg) | NPV (€) |
|---|
| 12.75 | No PBT possible | 621,192 | 144,560 | 0.75 | -2,307,940 |
SCENARIO 2:
• Selling price for Co metal: 39,000 €/Tn (according to LME information of 03/02/2023)
• Incomes from Ni valuable derivates: selling Price = 1,248 €/Tn. Estimation based on Ni content of wastes (7% and a recovery of
90% with a loss of 40% of the Ni selling price of 27,500 €/Tn (according to LME information of 03/02/2023)
• Co content in BM = 27.5%
• CROCODILE Co production Yield = 67.2%
• Black Mass Flat Rate = 750 €/Tn
• Maximal capacity plant available = 55.7 Tn BM/year
• Co metal production in simulation: 12.75 kg Co metal/day = 4.19 Tn Co metal/year |
Estimated Plant capacity
(kg Co metal/day) | Payback period (years) | CAPEX (€) | OPEX (€/Tn Co metal) | Black Mass estimated
Flat rate (€/kg) | NPV (€) |
|---|
| 12.75 | No PBT possible | 621,192 | 144,560 | 0.75 | -2,070,698 |
SCENARIO 3:
• Selling price for Co metal: 39,000 €/Tn (according to LME information of 03/02/2023)
• Incomes from Ni, Li, Mn and graphite valuable derivates: selling Price = Ni derivates:1,248 €/Tn. Estimation based on Ni content
of wastes (7% and a recovery of 90% with a loss of 40 % of the Ni selling price of 26,500 €/Tn,-Mn derivates : Estimation based on
Mn content of wastes (12% and a recovery of 90% with a loss of 40% of the Mn selling price of 1.600 €/Tn, Li derivates (as Lithium
carbonate), Estimation based on Ni content of wastes (9% and a recovery of 90% with a loss of 40% of the Ni selling price of
80,500 €/Tn graphite derivates: Estimation based on graphite content of BM (97% and a recovery of 90% with a loss of 40% of the
graphite selling price of 1,500 €/Tn (rates of VN according to LME information of 03/02/2023)
• Black Mass Flat Rate = 750 €/Tn
• Co content in BM = 27.5%
• CROCODILE Co production Yield = 67.2%
• Maximal capacity plant available = 55.7 Tn BM/year
• Co metal production in simulation: 12.75 kg Co metal/day = 4.19 Tn Co metal/year |
Estimated Plant capacity
(kg Co metal/day) | Payback period (years) | CAPEX (€) | OPEX (€/Tn Co metal) | Black Mass estimated
Flat rate (€/kg) | NPV (€) |
|---|
| 12.75 | <5 | 621,192 | 144,560 | 0.75 | 1,199,122 |
SCENARIO 4:
• Selling price for Co metal: 39,000 €/Tn (according to LME information of 03/02/2023)
• Incomes from Ni, Li, Mn and graphite valuable derivates: selling Price = Ni derivates: 1,248 €/Tn. Estimation based on Ni content
of wastes (7% and a recovery of 90% with a loss of 40% of the Ni selling price of 26,500 €/Tn,-Mn derivates: Estimation based on
Mn content of wastes (12% and a recovery of 90% with a loss of 40% of the Mn selling price of 1.600 €/Tn, Li derivates (as Lithium
carbonate), Estimation based on Ni content of wastes (9% and a recovery of 90% with a loss of 40% of the Ni selling price of
80,500 €/Tn graphite derivates: Estimation based on graphite content of BM (97% and a recovery of 90% with a loss of 40% of the
graphite selling price of 1,500 €/Tn (rates of VN according to LME information of 03/02/2023)
• Black Mass Flat Rate = 750 €/Tn
• Co content in BM = 27.5%
• CROCODILE Co production Yield = 90.0%
• Maximal capacity plant available = 55.7 Tn BM/year
• Co metal production in simulation: 17.01 kg Co metal/day = 5.61 Tn Co metal/year |
Estimated Plant capacity
(kg Co metal/day) | Payback period (years) | CAPEX (€) | OPEX (€/Tn Co metal) | Black Mass estimated
Flat rate (€/kg) | NPV (€) |
|---|
| 13.78 | <5 | 621,192 | 69,402 | 0.75 | 1,464,972 |
Based on the best results of the analysis of the profitability of the pilot plant (scenario 4), four additional simulations were performed according to the market survey and exploitation opportunities carried out in the project. These simulations aimed to detect if the combination of the Black Mass treatment capacity and the Co content in the Black mass would define limits in the profitability of the process at industrial scale capacities. CAPEX and OPEX were calculated considering a prize reducing scale up factor in terms of main equipment dimensioning and material supply. The results are summarized in Table 9.
Table 9. Results of the simulation of the industrial scale CROCODILE Process.
| Industrial Plant Scenarios Description |
|---|
| Case: 1000 Tn/y - Co content BM = 35% - BM Fixed Flat Rate - CAPEX scale up reduction effect included |
| Estimated Plant capacity (Kg Co metal/day) | Payback period (years) | CAPEX (€) | OPEX (€/Tn Co metal) | Black Mass estimated Flat rate (€/Kg) | NPV (€) | IRR (%) |
|---|
| 1,000 | 6.20 | 36,911,847 | 35,848 | 0.75 | 37,032,724 | 246 |
| Case = 2000 Tn/y - Co content BM = 35% - Black Mass Fixed Flat Rate - CAPEX Scale up reduction effect included |
Estimated Plant capacity
(Kg Co metal/day) | Payback period
(years) | CAPEX (€) | OPEX (€/Tn
Co metal) | Black Mass estimated
Flat rate (€/Kg) | NPV (€) | IRR (%) |
|---|
| 2,000 | 5.28 | 64,270,039 | 35,848 | 0.75 | 83,625,645 | 298 |
| Case = 5000 Tn/y - Co content = 15% - BM Fixed Flat Rate - CAPEX scale up reduction factor included |
Estimated Plant capacity
(Kg Co metal/day) | Payback period
(years) | CAPEX (€) | OPEX (€/Tn
Co metal) | Black Mass estimated
Flat rate (€/Kg) | NPV (€) | IRR (%) |
|---|
| 5,000 | No PBT possible | 130,277,106 | 49,143 | 0.75 | -64,897,991 | - |
| Case 5000 Tn/y - Co content = 15% - BM Fixed Rate - CAPEX scale up reduction factor included - OPEX major scale purchase amount included (Affecting reduction purchase costs for materials and energy) |
Estimated Plant capacity
(Kg Co metal/day) | Payback period
(years) | CAPEX (€) | OPEX (€/Tn
Co metal) | Black Mass estimated
Flat rate (€/Kg) | NPV (€) | IRR (%) |
|---|
| 5,000 | 5.05 | 130,277,106 | 37,184 | 0.75 | 208,865,463 | 352 |
As it can be observed, if the Co content is 35% plants with a capacity production up to 2000 Tn/year Co metal result in positive NPV and Payback period < 5 years (Case 2). If the Co content in Black mass decreases to 15%, larger production capacities are necessary to compensate it and to become a profitable process.
Conclusions
During the whole demonstration activity, a total amount of 1100 kg of black mass was treated to validate the process for the recovery of metallic cobalt. After optimization, the results obtained are summarized in Table 10.
Table 10. Summary results.
| SUMMARY RESULTS |
|---|
| %Co in BM | 27.5%wt |
| Co leaching yield | 92.0% |
| Impurity removal yields | 53.6% for Al and 97.5% for Mn |
Maximum yield of
Cobalt extraction | 60% |
| Deposition yields | 63% |
Cobalt content within
the cathode deposit | 97.4% |
Concerning the LCA performed based on the experimental data obtained in the run of the CROCODILE pilot plant, material production and waste treatment followed by the energy consumption are the main causes of the Environmental Impact of the developed process.
When comparing LCA results with the SoA, the uncertainty in the analysis system boundaries and the difference in the reference scale make drawing firm conclusions difficult. However, the results seem promising for the CROCODILE pilot since in certain impact categories, such as human toxicity (non-cancer (HT-NC) categories, CROCODILE already performs better than the SoA processes even when there is place for improvement/optimization of the process.
The technologies for recycling lithium-ion batteries are still relatively young (still need development and optimization potential). This is likely the main reason of the lack of detailed economic information available in the literature, which is required to perform the LCC benchmarking analysis. However, a LCC variable sensitivity analysis was performed, and the following aspects showed essential influence on the profitability of the CROCODILE pilot plant: the cobalt content in the black mass, the market price for the cobalt metal; the cost of the black mass and the potential valorization of other valuable products such as nickel, lithium, manganese and graphite derivates existing as subproducts in the process.
As a summary of the LCC economic assessment of the CROCODILE pilot plant, the best result is obtained for Scenario 3 with a NPV > 1,2 M€ and a payback period >5 years. The additional study for the potential exploitation of the industrial plants based on these conditions to evaluate the influence of the production capacity of the plant and the Cobalt content in the black mass, lead to the conclusion that Co contents in the black mass >30% (Case 3: 35%) could make profitable production capacity plants up to 2.000 Tn Co metal/year with NPV > 80 M€ and payback period around 5 years. For larger production capacities (Case 4: (5.000 Tn Co/year) even a reduction in the Cobalt content to 15% in the black mass could lead to profitable results with NPV > 220M€ and paybacks around 5 years.
The novel and innovative process developed for the recovery of cobalt from spent lithium-ion batteries has been validated in the purpose-built pilot showing its strong potential for its implementation at industrial scale. The cobalt recovered can be used as feed in several fields as catalysts, alloys and precursor for the production of lithium-ion batteries.








