Introduction
Comparative analysis of molecular measurements between different tissues, clinical conditions or treatment categories is among basic steps in understanding underlying molecular mechanisms and in considering different disease treatment alternatives. Analysis of genetic material, transcribed genes, metabolites, proteins, and other substances can lead to detection of various molecules with a differential behavior between the considered states. Such biomolecules, called biomarkers, have multiple potential usages like condition diagnosis, development of future therapeutic targets and tracking of treatment response1,2.
The common biomarker measurement and analysis flow consists of 3 major steps: (i) sample extraction; (ii) biomolecule identification and quantification; and (iii) bioinformatics analysis. There are many challenges to be addressed at every stage of the abovementioned flow – both separately and based on the decisions received at the previous stage. The first stage can result in samples obtained in a solid form, as in standard tissue biopsy, liquid form as in blood or urine samples, liquid biopsy or ebiopsy3–6, or in a gas form as in iKnife7,8 and in MasSpec Pen9,10 techniques. Each one of the sampling methods imposes different restrictions on the space of possibly identifiable biomarkers. This set is further constrained by the choice of biomolecule identification and quantification technology and its specific configurations. For example, in proteomics data analysis, shotgun proteomics approaches, suitable for screening the large proteome space, differ from immunohistochemistry staining methods, dedicated to analysis of a specific protein. Moreover, in many cases of shotgun proteomics, the ability to detect the presence of a certain protein is not absolute, but rather depends on its abundance level relative to other proteins it in the same sample and on the presence of this protein in the other samples of the same experiment. For example, highly abundant proteins can shadow from mass spectrometer proteins that appear in relatively small amounts. Moreover, absolute low quantities of molecules in the sample are also a limiting factor in many identification and quantification technologies. Therefore, obtained quantitative biomarker data received as an input to bioinformatics analysis stage should be addressed in the context of all the limitations of techniques used to collect it.
Differential expression analysis approaches comparing biomarker mean measured intensities between two groups of samples (samples obtained from test vs from control groups) can be limited in handling the method noisiness in the detection and in the quantification of the biomarker abundance. Specifically, differential expression approaches like Student Ttest, a parametric test that checks the similarity of means of two groups, or like its non-parametric counterpart – Wilcoxon rank-sum test, are working on quantitative measurements and are addressing all not-identified molecules in sample as those measured with zero intensity. Clearly this is a critical drawback of such approaches since the difference between identified and not-identified molecules is conceptually not the same as the difference between low- and high-expression molecules, even though numerically these differences can be comparable.
Here we suggest addressing the problem of differential expression analysis by comparing only the changes in biomolecule binary appearance patterns between the test and the control groups. This allows better handling of the biomolecules, that can disappear completely in some samples, which may happen either due to generally low (near the sensor detection limit) abundance levels of this molecule or due to an inherent change in the production rate of this molecule between two tested conditions. Also, this approach allows to partially reduce a potential noise resulting from the variability in intrasample relative expression levels between different biomolecules by replacing the quantitative measurements with the simple binary appearance indicator.
Results
First, we replace the received quantitative measurements with the binary indicator representing the presence or absence of a biomolecule in a tissue of interest (Methods).
To compare binary appearance patterns of a biomolecule in two separate independent groups we suggest the two following approaches: (i) proportion-based test and (ii) hypergeometric-distribution based test (Methods). The first leverages the fact that population proportion behaves according to the normal distribution, while the second reformulates the comparison problem as the significance of the intersection size of two groups. All the code used in article is freely available at GitHub: https://github.com/EdwardVitkin/binde.git11.
To assess the performance of the proposed tests we apply them on two types of molecular measurements of Basal Cell Carcinoma (BCC) and the Squamous Cell Carcinoma (SCC) patients: (i) proteomic profiles obtained from samples with ebiopsy6; and (ii) transcriptomic profiles obtained from samples with standard biopsy12.
Comparing BCC and SCC proteomics profiles
We compare the performance of both proposed tests to the standard non-parametric differential expression test (Wilcoxon rank-sum test) comparing proteomic profiles obtained with ebiopsy from 60 BCC and 63 SCC patients6. Useful property of ebiopsy-gathered samples is that the obtained liquid is collected from very small spatial region, thus keeping the sample highly homogeneous compared to ones collected with standard lysis-based biopsies, that cover much larger cellular volumes and, therefore, inherently aggregating the entire cellular heterogeneity of the tissue. Thus, almost all proteins (98.5% of 7087) identified by ebiopsy were observed in less than 50% of samples and many of them (53.2%) appear in less than 10% of samples.
Table 1 demonstrates the comparison of the relative performances of the 3 tests (Wilcoxon rank-sum test, Proportion test, HG test) on the top-6 most significant (i.e. rank ≤6 in at least one test) proteins. First, we observe that CRNN was identified as the most differentially expressed gene between both conditions by all 3 tests. Moreover, all tests agree on 3 out of Top-5 genes: CRNN (#1, #1, #1), SULT1E1 (#3, #2, #2) and TMSB15A/B (#5, #5, #5). For better readability here and in the following paragraphs, we refer to the tuple (#k1,#k2,#k3) as ranks of genes in Wilcoxon rank-sum, Proportion and HG tests respectively.
Table 1. Comparison of rankings of Top-6 most significant proteins among 3 different differential expression tests: (i) Wilcoxon rank-sum test on the raw data, acting as a reference point; (ii) Proportion Test and (iii) HG Test, working directly on the binary appearance patterns.
The table is sorted according to minimal gene rank among all tests.
Gene
names | Protein names | BCC
compared
to SCC | BCC | SCC | Wilcoxon
rank-sum
test | Proportion
test | HG test |
|---|
prop
in
data | mean | prop
in
data | mean | pval | rank | pval | rank | pval | rank |
|---|
| CRNN | Cornulin | UP | 82% | 5.E+08 | 35% | 5.E+07 | 1.9E-07 | 1 | 1.6E-07 | 1 | 1.2E-07 | 1 |
| PHGDH | D-3-phosphoglycerate
dehydrogenase | UP | 75% | 6.E+08 | 41% | 1.E+08 | 1.3E-05 | 2 | 1.5E-04 | 30 | 1.4E-04 | 32 |
| SULT1E1 | Sulfotransferase 1E1 | UP | 55% | 6.E+07 | 13% | 3.E+06 | 2.4E-05 | 3 | 6.5E-07 | 2 | 5.0E-07 | 2 |
| ITPK1 | Inositol-tetrakisphosphate
1-kinase | UP | 43% | 9.E+06 | 6% | 2.E+06 | 6.3E-04 | 40 | 1.8E-06 | 3 | 1.1E-06 | 3 |
| TGM3 | Protein-glutamine gamma-
glutamyltransferase E | UP | 95% | 1.E+09 | 89% | 9.E+07 | 4.1E-05 | 4 | 2.2E-01 | 3120 | 1.8E-01 | 3110 |
| FBLN5 | Fibulin-5 | UP | 37% | 3.E+06 | 3% | 3.E+04 | 9.9E-04 | 56 | 2.8E-06 | 4 | 1.4E-06 | 4 |
TMSB15B
TMSB15A | Thymosin beta-15B
Thymosin beta-15A | UP | 58% | 3.E+07 | 17% | 5.E+06 | 4.3E-05 | 5 | 2.8E-06 | 5 | 2.4E-06 | 5 |
| ASMTL | Probable bifunctional
dTTP/UTP
pyrophosphatase/
methyltransferase protein | UP | 40% | 8.E+06 | 6% | 3.E+05 | 1.1E-03 | 59 | 8.6E-06 | 6 | 6.1E-06 | 7 |
| ISYNA1 | Inositol-3-phosphate
synthase 1 | UP | 55% | 2.E+07 | 19% | 1.E+06 | 5.5E-05 | 6 | 3.5E-05 | 13 | 3.2E-05 | 13 |
| SERPINB13 | Serpin B13 | DOWN | 0% | 0.E+00 | 27% | 1.E+07 | 9.9E-03 | 246 | 1.5E-05 | 8 | 3.4E-06 | 6 |
Analyzing genes that were differently addressed between the proposed binarized tests and the Wilcoxon rank-sum test performed on the raw measurements, we observe PHGDH (#2,#30,#32) and TGM3 (#4, #3120, #3110). Indeed, albeit recognized as significantly different in raw data by Wilcoxon rank-sum test in both cases (p-values of 1.3E-05 and of 4.1E-05 respectively), appearance patterns don’t differ that much – 75% vs 41% for the first gene (p-values of 1.5E-04 and 1.4E-04) and 95% vs 89% for the second gene (p-values of 2.2E-01 and 1.8E-01). Both these cases, and especially TGM3, demonstrate the limitation of the proposed approaches in handling the differential expression of a molecule, that was observed in most of the samples.
We can also observe the opposite scenario for genes ITPK1 (#40,#3,#3) and FBLN5 (#56,#4,#4). Albeit the less significant difference in raw measurements (p-values of 6.3E-04 and of 9.9E-04 respectively), the difference in appearance patterns is evident – 43% vs 6% for the first gene (p-values of 6.5E-07 and 5.0E-07) and 37% vs 3% for the second gene (p-values of 2.8E-06 and 1.4E-06). Important to mention that such differences (with p-value around 5E-4) in an experiment of a smaller scale (i.e. ~30 samples per each group instead of ~60), may result in p-values above the significance threshold (of 5E-2) in the raw measurement-based test, thus leading to filtering out these gene from the list of potential biomarker candidates. Both ITPK1 and FBLN5 were previously shown to be associated with tumor-suppressor mechanisms13,14, that is consistent with the less aggressive nature of BCC cancer.
Comparative analysis between the results of proposed binary tests reveals high agreement on the assigned pvalues – PearsonR of 0.93, in contrast to lower, but still significant correlations of 0.76 and of 0.82 with Wilcoxon rank-sum test respectively for Proportion and HG tests. Moreover, both tests exactly agree on the selection and the order of Top-5 most significant genes. The first difference appears in rank #6. Proportion test selects ASMTL as such, which appear in 40% out of 60 BCC samples and only in 6% out of 63 SCC samples. On the contrary, HG test selects SERPINB13 as such, that was observed uniquely within SCC samples. Interestingly, the latter case demonstrates an example of one of the differences between the two proposed tests – the weight each one of them assigns to the group of genes observed uniquely in a single group. Figure 1 shows that in general, HG test prioritized such group-unique genes higher than a Proportion test, with the inflection point around 12–15% appearance frequency within this group.
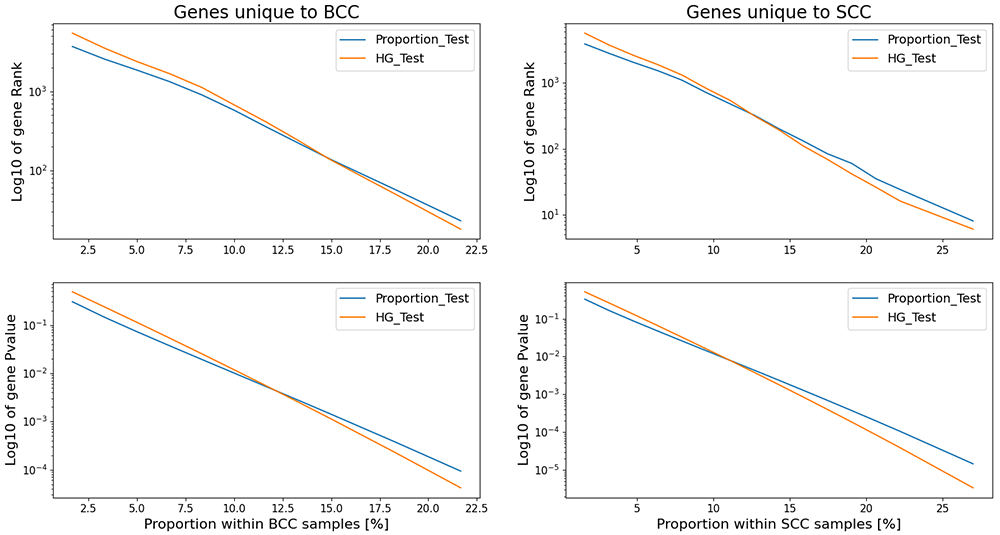
Figure 1. Comparison of how Proportion and HG tests address genes that uniquely appear in a single group.
Comparing BCC and SCC transcriptomics profiles
We evaluate the performance of both proposed tests with the performance of the standard parametric differential expression test (Student T-test on log-transformed data) comparing transcriptomic profiles of 25 BCC and 10 SCC patients12. This data, being quite sparse, also fits for analysis by the proposed appearance tests. Specifically, 28.0% of 26569 genes appear in less than 50% of samples, and many of them (18.8%) appear in less than 10% of samples.
Table 2 demonstrates the comparison of the relative performances of the 3 tests (Student T-test, Proportion test, HG test) on the top-5 most significant (i.e. rank ≤5 in at least one test) gene. One can notice that all the genes in Table 2 have significant Student Ttest pvalues. However, the discrepancy in rankings between the StudentT test and both appearance tests is evident. We observe that 4 out of 5 rank #1 appearance tests-selected genes, that all were identified in 100% of BCC samples and in 0% of SCC samples, being ranked relatively low by Student Ttest, would be ignored by many data-driven follow-up studies with focus only on a top-rank candidates. For example, it is widely observed that genes with zinc finger domains may act like as tumor suppressors15–17, therefore a downregulation of such genes aligns with more severe nature of SCC, making genes like ZNF98 (ranked #2034) and ZBTB8B (ranked #786) interesting candidates for the follow-up studies.
Table 2. Comparison of rankings of Top-5 most significant genes among 3 different differential expression tests: (i) Student T-test on the log-transformed raw data, acting as a reference point; (ii) Proportion Test and (iii) HG Test, working directly on the binary appearance patterns.
The table is sorted according to minimal gene rank among all tests.
Gene
Symbol | Protein names | BCC
compared
to SCC | BCC | SCC | Student
T-test | Proportion
test | HG test |
|---|
prop in
data | Log2
mean | prop in
data | Log2
mean | pval | rank | pval | rank | pval | rank |
|---|
| SORL1-AS1 | SORL1 antisense RNA 1 | UP | 100% | 2.97 | 0% | 0.00 | 1.3E-16 | 67 | 3.3E-09 | 1 | 5.4E-09 | 1 |
| ZNF98 | zinc finger protein 98 | UP | 100% | 2.98 | 0% | 0.00 | 2.2E-08 | 2034 | 3.3E-09 | 1 | 5.4E-09 | 1 |
| ZBTB8B | zinc finger and BTB
domain containing 8B | UP | 100% | 3.20 | 0% | 0.00 | 8.9E-11 | 786 | 3.3E-09 | 1 | 5.4E-09 | 1 |
| KIF26A-DT | KIF26A divergent
transcript | UP | 100% | 3.71 | 0% | 0.00 | 2.9E-12 | 402 | 3.3E-09 | 1 | 5.4E-09 | 1 |
| IRS4-AS1 | IRS4 antisense RNA 1 | UP | 100% | 6.18 | 0% | 0.00 | 4.7E-23 | 5 | 3.3E-09 | 1 | 5.4E-09 | 1 |
| PTCH2 | patched 2 | DOWN | 100% | 11.12 | 100% | 3.19 | 1.1E-28 | 1 | 1.0 | 8415 | 1.0 | 8520 |
| FOXI3 | forkhead box I3 | UP | 100% | 9.23 | 80% | 1.18 | 1.8E-27 | 2 | 2.1E-02 | 1508 | 7.6E-02 | 2077 |
| LGR5 | leucine rich repeat
containing G protein-
coupled receptor 5 | DOWN | 100% | 10.19 | 100% | 2.71 | 4.1E-24 | 3 | 1.0 | 8415 | 1.0 | 8520 |
| FBN3 | fibrillin 3 | UP | 100% | 9.92 | 50% | 0.96 | 9.7E-24 | 4 | 1.3E-04 | 292 | 7.8E-04 | 365 |
Conclusion
Here we address the problem of the differential expression analysis of binary appearance patterns of biomolecules, that is important in scenarios when the biomarker of interest can disappear completely in some of the tested samples. We suggest two possible approaches to handle this problem – proportion-based test and hypergeometric-distribution based test. Usage of these approaches on proteomic profiles obtained from samples extracted with ebiopsy technique and on transcriptomic profiles from samples extracted with standard biopsies from BCC and SCC patients demonstrated high agreement in handling various appearance scenarios and the ability to identify potentially interesting cases missed by the commonly used analyses of raw non-binary measurement data.
All the code used in this article is freely available at GitHub: https://github.com/EdwardVitkin/binde.git11.
Methods
Appearance encoding
We encode the presence/absence of a biomolecule in a tissue of interest with a binary indicator function:
Proportion-based test
The general probability p to detect a biomolecule of interest in x out of N measurements can be modeled as a sample proportion of successes . For sufficiently large N this variable follows normal distribution where q=1-p.
Let and be two independent sample proportions based on N1 and N2 trials respectively. Then the difference between and follows normal distribution (Equation 1):
Therefore, the following hypothesis testing can be performed:
H0 – measurements in both trials have the same underlying distribution, i.e. μ = 0
H1 – alternative hypothesis, i.e. μ ≠ 0 (two-sided case)
Since under H0 both trials are derived from the same distribution (i.e. p1 = p2 = p), the standard deviation under H0 is transformed as in Equation 2:
Next, z-score can be calculated by converting the sample data to the standard normal distribution N(0,1), as presented in Equation 3:
Leading to the calculation of the test p-value based on Equation 4:
Essentially, the proposed two-sided test (Equation 4a) estimates the random probability of receiving the absolute z-score z or higher, assuming the lack of differentially expression (H0).
The change in H1 to its one-sided alternative is straightforward, as in Equation 4b for p1 < p2 and as in Equation 4c for p1 > p2 hypotheses.
Hypergeometric-based test
The problem of biomolecule differential appearance pattern between two groups can be reframed as follows. Let on C1 and C2 be the count of appearances of biomolecule in two groups sized N1 and N2 trials respectively. Then, the probability to receive C1 appearances within group sized N1 follows hypergeometric distribution (Equation 5):
Where N corresponds to the population size; K to the number of successes in population; n to the number of draws; and k to the number of observed successes.
It is important to note that this test is not symmetrical with respect to both groups.
Acknowledgments
I specifically thank Zohar Yakhini and Alex Golberg for initial discussions and useful comments.
Faculty Opinions recommendedReferences
- 1.
Jones SF, McKenzie AJ:
Molecular Profiling in Drug Development: Paving a Way Forward.
Am Soc Clin Oncol Educ Book.
2020; 40: 309–318. PubMed Abstract
| Publisher Full Text
- 2.
Levy-Jurgenson A, Tekpli X, Kristensen VN, et al.:
Spatial transcriptomics inferred from pathology whole-slide images links tumor heterogeneity to survival in breast and lung cancer.
Sci Rep.
2020; 10(1): 18802. PubMed Abstract
| Publisher Full Text
| Free Full Text
- 3.
Genish I, Gabay B, Ruban A, et al.:
Electroporation-based proteome sampling ex vivo enables the detection of brain melanoma protein signatures in a location proximate to visible tumor margins.
PLoS One.
2022; 17(5): e0265866. PubMed Abstract
| Publisher Full Text
| Free Full Text
- 4.
Vitkin E, Singh A, Wise J, et al.:
Nondestructive protein sampling with electroporation facilitates profiling of spatial differential protein expression in breast tumors in vivo.
Sci Rep.
2022; 12(1): 15835. PubMed Abstract
| Publisher Full Text
| Free Full Text
- 5.
Golberg A, Sheviryov J, Solomon O, et al.:
Molecular harvesting with electroporation for tissue profiling.
Sci Rep.
2019; 9(1): 15750. PubMed Abstract
| Publisher Full Text
| Free Full Text
- 6.
Vitkin E, Wise J, Berl A, et al.:
Proteome sampling with e-biopsy enables differentiation between cutaneous squamous cell carcinoma and basal cell carcinoma.
medRxiv.
2022; 2022.12.22.22283845. Publisher Full Text
- 7.
Tzafetas M, Mitra A, Paraskevaidi M, et al.:
The intelligent knife (iKnife) and its intraoperative diagnostic advantage for the treatment of cervical disease.
Proc Natl Acad Sci U S A.
2020; 117(13): 7338–7346. PubMed Abstract
| Publisher Full Text
| Free Full Text
- 8.
Balog J, Sasi-Szabó L, Kinross J, et al.:
Intraoperative tissue identification using rapid evaporative ionization mass spectrometry.
Sci Transl Med.
2013; 5(194): 194ra93. PubMed Abstract
| Publisher Full Text
- 9.
Sans M, Zhang J, Lin JQ, et al.:
Performance of the MasSpec Pen for Rapid Diagnosis of Ovarian Cancer.
Clin Chem.
2019; 65(5): 674–683. PubMed Abstract
| Publisher Full Text
| Free Full Text
- 10.
Zhang J, Rector J, Lin JQ, et al.:
Nondestructive tissue analysis for ex vivo and in vivo cancer diagnosis using a handheld mass spectrometry system.
Sci Transl Med.
2017; 9(406): eaan3968. PubMed Abstract
| Publisher Full Text
| Free Full Text
- 11.
Vitkin E:
Code and Data for “Differential expression analysis of binary appearance patterns” manuscript. 2014. Publisher Full Text
- 12.
Wan J, Dai H, Zhang X, et al.:
Distinct transcriptomic landscapes of cutaneous basal cell carcinomas and squamous cell carcinomas.
Genes Dis.
2019; 8(2): 181–192. PubMed Abstract
| Publisher Full Text
| Free Full Text
- 13.
Cho SB:
Uncovering Oncogenic Mechanisms of Tumor Suppressor Genes in Breast Cancer Multi-Omics Data.
Int J Mol Sci.
2022; 23(17): 9624. PubMed Abstract
| Publisher Full Text
| Free Full Text
- 14.
Xie ZM, Xiao YS, Central Hospital S, et al.:
FBLN5 Is an Underlying Common Tumor Suppressor in Breast Cancer and Thyroid Cancer. 2022. Publisher Full Text
- 15.
Dong S, Zhang P, Liang S, et al.:
The role of the retinoblastoma protein-interacting zinc finger gene 1 tumor suppressor gene in human esophageal squamous cell carcinoma cells.
Oncol Lett.
2013; 6(6): 1656–1662. PubMed Abstract
| Publisher Full Text
| Free Full Text
- 16.
Zhang J, Luo J, Jiang H, et al.:
The Tumor Suppressor Role of Zinc Finger Protein 671 (ZNF671) in Multiple Tumors Based on Cancer Single-Cell Sequencing.
Front Oncol.
2019; 9: 1214. PubMed Abstract
| Publisher Full Text
| Free Full Text
- 17.
Zhang C, Xiang T, Li S, et al.:
The novel 19q13 KRAB zinc-finger tumour suppressor ZNF382 is frequently methylated in oesophageal squamous cell carcinoma and antagonises Wnt/β-catenin signalling.
Cell Death Dis.
2018; 9(5): 573. PubMed Abstract
| Publisher Full Text
| Free Full Text
- 18.
Vitkin E:
EdwardVitkin/binde: Code and Data for "Differential expression analysis of binary appearance patterns" manuscript (v1.0.0). [Code], Zenodo. 2024. http://www.doi.org/10.5281/zenodo.10554737