The sexual behavioural profile of the participants
Table 2 shows the sexual behavioral profile of the participants. The mean sexual debut age of the respondent is 17.51 (Standard deviation 2.25). The majority (91.70%) of the participants have ever had sexual relationship. Out of 232 sexually active participants, 69.40% had one partner in the last 12 months, 18.10% had two partners, 10.34% had more than two partners, and 2.16% of the sexually active had zero partners in the last 12 months.
Table 2. Sexual behavioural profile of the respondents aged 15–24 years old living with HIV, Nairobi Kenya.
| Variables | Category | Frequency | Percentage % |
|---|
| Ever had sexual relationship | No | 21 | 8.30 |
| Yes | 232 | 91.70 |
| Number of sexual partners in last 12 months | One | 166 | 71.55 |
| Two | 42 | 18.10 |
| More than two | 24 | 10.34 |
| Type of current partner | Casual | 206 | 81.42 |
| Regular | 37 | 14.62 |
| Married | 10 | 3.95 |
| Disclosure of HIV status | Partner knows | 92 | 39.66 |
| Partner doesn’t know | 140 | 60.34 |
| Partner ‘s HIV status | Unknown | 139 | 59.91 |
| Positive | 41 | 17.67 |
| Negative | 52 | 22.41 |
| HIV transmission concerns | Yes | 52 | 22.41 |
| No | 180 | 77.59 |
| Sexually transmitted infections in last 12 months | No | 203 | 87.50 |
| Yes | 29 | 12.50 |
| Obtained treatment for above STIs | Yes | 19 | 65.52 |
| No | 10 | 34.48 |
| Pregnancy history | Previous pregnancy | 45 | 19.40 |
| No previous pregnancy | 139 | 59.91 |
| Made someone pregnant | 8 | 3.45 |
| Never made anyone pregnant | 40 | 17.24 |
At the time of the interview, the majority (81.42%) stated they had a casual partner, 14.62% had a regular partner, and 3.95% were married to their partners. On disclosure of HIV status, 54.74% of the respondents stated their partners are not aware of their status. 42.24% stated they had disclosed their HIV status to their partners while 7 respondents (3.02%) did not have a partner at the time of the interview.
When it came to knowing the HIV status of the partner, 133 (58.85%) of the respondents stated partner’s status was unknown, 23.01% stated partner’s status was negative and 18.14 % knew of positive HIV status of their partners.
Participants were asked if they have HIV transmission concerns; 77.59% of the participants reported they had no transmission concerns while 22.41% had HIV transmission concerns. Regarding sexually transmitted infections in the last 12 months, 12.50% had an infection while 203 (87.50%) did not have an infection.
Utilization of sexual reproductive services
The outcome variable utilization was coded non utilization if one used 0-1 services in the last 6 months and utilization if one used more than 1 in the last 6 months.
52.96 % (134) of the participants did not utilize the services while 119 (47.04%) utilized the services. Table 3 shows the same information below.
Table 3. Level of utilization among participants aged 15–24 living with HIV in Nairobi Kenya.
| Variables | Category | Frequency | Percentage |
|---|
| Utilization | non utilization | 134 | 52.96 |
| utilization | 119 | 47.04 |
The types of sexual and reproductive services utilized
The utilization of sexual and reproductive services was validated by the type of sexual and reproductive services used. Sexual and reproductive health counselling services (42.5%) and collection of condoms (45.7%) were the most utilized while treatment of sexually transmitted infections (8.2%) was the least utilized. This is represented by Figure 1.
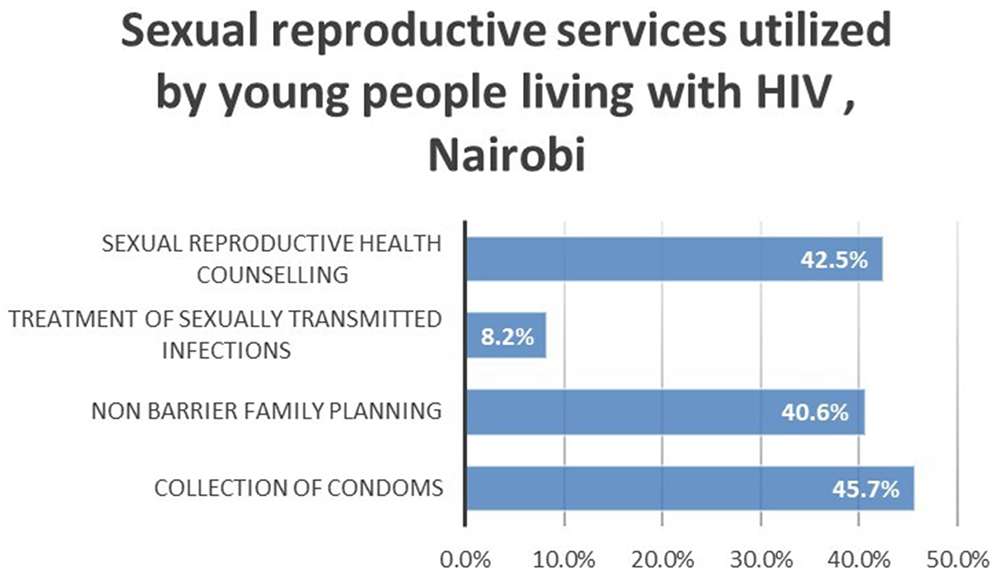
Figure 1. Sexual reproductive services utilized by young people living with HIV, Nairobi.
Factors associated with the Utilization of Sexual Reproductive Health Services
Utilization of sexual and reproductive services has significant association with independent sociodemographic variables; age, sex, marital status and current school status. This was evident in Table 4.
Table 4. Sociodemographic factors associated with the utilization of sexual and reproductive health services among young people living with HIV aged 15–24 years in Nairobi, Kenya (binary logistic regression).
| Variables | | P value | OR (95% Cl) |
|---|
| Age Category | 15–19 years | | ref |
| 20–24 years | 0.00* | 3.4(1.94-5.97) |
| Sex | Male | | ref |
| Female | 0.01* | 2.5(1.44-4.44) |
| Marital status | Single | | ref |
| Married | 0.00* | 3.16(1.48-6.75) |
| Separated | 0.65 | 1.34(0.38-4.77) |
| Education status attained | Never been to school | | (ref) |
| Primary | 0.74 | 0.83(0.28-2.47) |
| Secondary | 0.60 | 1.25(0.54-2.86) |
| Tertiary | 0.52 | 1.30(0.54-3.09) |
| Current school status | No | | ref |
| Yes | 0.03* | 0.60(0.34-0.94) |
| Religion | Catholic | 0.73 | 1.29(0.29-5.73) |
| Muslim | 0.18 | 2.94(0.60-14.38) |
| Protestant | 0.69 | 1.35(0.31-5.94) |
| Traditional | 0.62 | 1.67(0.23-12.21) |
| No religion | | ref |
| Employment status of parents | No | | Ref |
| Yes | 0.30 | 0.77(0.47-1.27) |
| Occupation of parents | Formal employment | 0.06 | 2.5(0.95-6.44) |
| Casual labourer | | ref |
| Self-employment/business | 0.21 | 1.70(0.74-3.92) |
| Farmer | 0.21 | 2.60(0.59-11.48) |
| Other | 0.97 | 1.04(0.09-12.65) |
| Employment Status of Respondents | No | | ref |
| Yes | 0.80 | 1.58(0.94-2.67) |
| Occupation of respondents | Formal employment | 0.74 | 1.2(0.41-3.48) |
| Casual labourer | ref | |
| Self-employment/business | 0.36 | 1.58(0.60-4.19) |
| Farmer | | 1 |
Older youth are more likely compared to younger youth to utilize sexual and reproductive services (Crude odds ratio 3.4, p value = 0.00). Married young people are 3 times more likely to utilize sexual and reproductive health services compared to their single youth peers (Crude odds ratio 3.16, p value = 0.00). Female youth have 2.5 higher odds of utilizing sexual and reproductive services compared to male youth (Crude odds Ratio 2.5, p value = 0.01).
The quantitative variables converge with the qualitative findings. It was expressed among the young participants that sexual and reproductive services were for married people and females only.
“Am not married to seek these reproductive services” Participant dh001
“Most services are targeted for females” – Participant dh034
“… girls come in more often than boys... girls even come in for condoms for their boyfriends…” key informant interview 03
Utilization of sexual and reproductive services has significant association with independent sexual behavioral variables; type of current sexual partner, disclosure of HIV status to sexual partner, HIV transmission concerns and use of family planning method. This was evident in Table 5.
Table 5. Analysis of sexual behavioral factors associated with the utilization of sexual and reproductive health services among young people living with HIV aged 15–24 years in Nairobi, Kenya (binary logistic regression).
| Variables | Category | P value | OR (95%Cl) |
|---|
| Number of sexual partners in last 12 months | One | | ref |
| Two | 0.73 | 1.12(0.57-2.21) |
| More than two | 0.23 | 1.70(0.70-4.11) |
| Type of current partner | Casual | | ref |
| Regular | 0.07 | 1.70(0.96-2.98) |
| Married | 0.00* | 3.42(1.51-7.74) |
| Disclosure of HIV status | Partner knows | 0.00* | 2.78(1.61-4.81) |
| Partner doesn’t know | | ref |
| Partner ‘s HIV status | Unknown | | ref |
Positive
Negative | 0.03*
0.17 | 2.20(1.06-4.58)
1.56(0.81-2.98) |
| HIV transmission concerns | Yes | 0.00* | 2.78(1.60-4.81) |
| No | | ref |
| Family planning method | Condom use | 0.00* | 3.34(1.85-6.04) |
| Non-barrier family planning method | 0.01* | 2.71(1.18-6.20) |
| No family planning method | | ref |
| Pregnancy history | Previous pregnancy | 0.19 | 1.5(0.79-3.13) |
| No previous pregnancy | | Ref |
| Made someone pregnant | 0.17 | 0.31(0.62-1.63) |
| Never made anyone pregnant | 0.50 | 0.78(0.38-1.58) |
Youth with regular partners are 70 % more likely to utilize sexual and reproductive health services compared to their single youth peers (Crude odds ratio 1.70, p-value = 0.07). Youth married to their sexual partners are 3 times more likely to utilize sexual and reproductive health services compared to their single youth peers (Crude odds ratio 3.42, p-value = 0.00). Youth who disclosed their HIV status to their sexual partner have 2.78 higher odds of utilizing sexual and reproductive services compared to the youth who did not disclose their HIV status. (Crude odds Ratio 2.78, p-value = 0.00). Youth who use non-barrier methods like hormonal pills are 2.71 more likely to utilize sexual and reproductive services compared to those who do not use methods. (Crude odds ratio 2.78, p value = 0.00). Youth who use condoms have 3.34 higher odds of utilizing sexual and reproductive services compared to the youth who do not. (Crude odds ratio 3.34, p-value = 0.00).
The health care workers had also stated that failure in disclosure of HIV status to the sexual partner is regarded as barrier to accessing sexual and reproductive health services.
“There is fear of disclosure among the young people and mingling with the opposite sex because they do not wish for their partners to know if they are infected so they wouldn’t come for the services together” – Key informant interview 07
Health care workers noted that there was a lack of safety transmission concerns among the young people living with HIV and the participants too reported that they had no sexual health concerns
“There are no sexual and reproductive concerns” – Participant ML005
“I [do] not [have] any concerns in the last 6 months” – Participant ML019
“There is fear of disclosure among the young people and mingling with the opposite sex because they do not wish for their partners to know if they are infected so they wouldn’t come for the services together” – Key informant interview 07
Utilization of sexual and reproductive services has a significant association with facility-level variables; privacy at the facility, the attitude of the healthcare staff, convenient location of facility and availability of commodities. This was evident in Table 6.
Table 6. Analysis of facility factors associated with the utilization of sexual and reproductive health services among young people living with HIV aged 15–24 years in Nairobi, Kenya (binary logistic regression).
| Variables | | OR (95%Cl) | P value |
|---|
| The facilities are conveniently located and available | Strongly agree/
Agree | 5.41(2.32-12.60) | 0.00* |
| Neutral | 2.00(0.79-5.08) | 0.14 |
| Strongly disagree / disagree | ref | |
| The sexual reproductive health services are in private | Strongly agree/
Agree | 5.87(3.01-11.54) | 0.00* |
| Disagree/strongly disagree | Ref | |
| Neutral | 1.67(0.78-3.60) | 0.19 |
The staff have a welcoming attitude towards youth
seeking sexual reproductive services | Strongly agree/
Agree | 3.5(1.45-8.47) | 0.00* |
| Disagree/strongly disagree | Ref | |
| Neutral | 1.25(0.49-3.20) | 0.64 |
Commodities for sexual reproductive services are
available | Strongly agree/
Agree | 2.70(1.41-5.20) | 0.00* |
| Neutral | 0.90(0.40-1.94) | 0.79 |
| Strongly disagree / disagree | ref | |
Youth who had positive attitudes (strongly agree/ agree) about the healthcare staff having a welcoming attitude and are more likely to utilize sexual and reproductive health services compared to their peers who had negative attitudes (strongly disagree/ disagree) (Crude Odds= 3.5, p-value = 0.00).
The findings from the key informant interview also support that the attitude of the health care workers affecting the utilization of sexual and reproductive health services.
“Initially, there was a lot of negativities especially for the adolescents to get the services but with continuous mentorship and health education there is much improvement among the health care providers and I can say there is a lot of positivity” - Key informant 05
Youth who positively felt that the facilities are conveniently located and available are 5.4 more likely to utilize the services compared to those who negatively felt about the location (Crude Odds ratio 5.41, p-value = 0.00).
Youth who had positive experiences (strongly agree/ agree) about commodities are available and are more likely to utilize sexual and reproductive health services compared to their peers who had negative attitudes (strongly disagree/disagree) (Crude Odds= 2.71, p-value = 0.00).
The qualitative findings also support the above findings. The key informants stated the presence or absence of commodities did influence the utilization of sexual and reproductive services among young people living with HIV. They also stated this problem is not a persistent problem.
“Of course, there have been stockouts… That’s what hinders services…. for instance, one wants to come for the family planning services… the implants are not available so they go home unattended to. But it happens once in a while… on and off.” - Key informant 03
Youth who positively felt that the facilities offer sexual and reproductive services in private are likely to utilize the services compared to those who negatively felt about the location (Crude Odds ratio 5.87, p-value = 0.00). Statements from the open-ended questions also have consistent findings on the same. Lack of privacy was among the reasons the young people living with HIV did not access the services.
“I do not use it because there is no space designed for youth in the facility to access the services”
- Participant PM024
Female sex (AOR: 3.26 95%Cl: 1.67-6.40), increase in age (AOR: 2.30 95%Cl: 1.11-4.65), HIV status disclosure to a sexual partner (AOR: 2.00 95%Cl: 1.11-3.80) and privacy for sexual reproductive health services at a health facility (AOR: 3.27 95%Cl: 1.42-7.60) were factors significantly associated with utilization in multivariate regression. This is evident in Table 7.
Table 7. Analysis of factors associated with the Utilization of Sexual Reproductive Health Services among young people living with HIV aged 15–24 years in Nairobi, Kenya (Stepwise binary logistic regression, best fit mode.
| Variables | Category | COR (95%Cl) | AOR | P value |
|---|
| Sex | Male | ref | ref | |
| Female | 2.50 (1.45-4.44) | 3.26(1.67-6.40) | 0.00* |
| Age groups | 20–24 years | 3.40(1.94-5.97) | 2.27(1.11-4.65) | 0.03* |
| 15–19 years | ref | | |
| Currently in school | No | ref | | |
| Yes | 1.10(.60-2.024) | | |
| Marriage status | Married | 3.16(1.48-6.75) | | |
| Single | Ref | | |
| Separated | 1.34(0.38-4.77) | | |
| Disclosure of HIV status | Partner knows | 2.78(1.61-4.81) | 2.00(1.11-3.80) | 0.04* |
| Partner doesn’t know | ref | ref | |
| HIV transmission concerns | Yes | 2.78(1.60-4.81) | | |
| No | ref | | |
| The facilities are conveniently located and available | Strongly agree/
Agree | 5.41(2.32-12.60) | 1.16(0.65-5.22) | 0.80 |
| Neutral | 2.00(0.79-5.08) | 1.20(0.36-3.83) | 0.80 |
Strongly disagree /
disagree | ref | | |
| The sexual reproductive health services are in private | Strongly agree
Agree | 5.87(3.12-11.54) | 3.27(1.42-7.60) | 0.01* |
Disagree/strongly
Disagree | Ref | | |
| Neutral | 1.67(0.78-3.60) | 1.40(0.98-5.60) | 0.48 |
The staff have a welcoming attitude towards youth
seeking sexual reproductive services | Strongly agree/
Agree | 3.5(1.45-8.47) | 2.35(0.83-6.60) | 0.11 |
| Disagree/strongly disagree | Ref | | |
| Neutral | 1.25(0.49-3.20) | 1.40(0.44-4.41) | 0.57 |
Commodities for sexual reproductive services are
Available | Strongly agree/
Agree | 2.70(1.41-5.20) | 2.20(0.76-6.38) | 0.05 |
| Neutral | 0.90(0.40-1.94) | 2.34(0.98-5.60) | 0.14 |
| Strongly disagree / disagree | ref | | |