Introduction
Potential evapotranspiration (PET) characterizes the atmosphere's capacity to remove water through evapotranspiration (ET). Evaporation and transpiration processes collectively transfer water from the Earth's surface to the atmosphere (Allen et al., 1998; Jensen & Allen, 2016) with rates determined by solar radiation, air temperature, relative humidity (specifically, vapor pressure deficit), wind speed (Pandey et al., 2017; Zotarelli et al., 2018), as well as the distinctive traits of vegetation, or crops and agricultural practices (Jensen & Allen, 2016). Estimates of PET have been widely used across diverse scientific fields and practical domains (Hargreaves, 1994a; Zomer et al., 2022), with PET estimates and related indices playing a crucial role in agricultural and natural resource management with demonstrated utility on scales from individual farms to regional and global (Anwar et al., 2021; Basarin et al., 2020; Itenfisu et al., 2003; Valipour et al., 2020). While potential evapotranspiration (PET) reflects potential atmospheric water demand across varied vegetation types, useful in broader ecosystem and hydrological studies, reference evapotranspiration (ET0) estimates the effective water use from a well-watered reference crop, and as such, is particularly useful for agriculture and irrigation management.
In an era of rapid environmental and climatic transformations, PET estimates, along with their related indices, assume a pivotal role as direct and critical measures, as well as predictive tools, for gauging the trajectory, direction, and extent of climatic variations and their ramifications for terrestrial, and particularly agricultural and natural ecosystems. As an example, indices relying on PET estimates include the Standardized Precipitation Evapotranspiration Index (SPEI), Palmer Drought Severity Index (PDSI), Crop Water Stress Index (CWSI), Water Deficit Index (WDI), Evaporative Stress Index (ESI), and the Aridity Index (AI) described in this paper, Indices like the SPEI, AI, PDSI, CWSI, WDI, ESI and the AI incorporate PET to understand and evaluate water availability, climate impacts, and drought. Given the current global climate emergency, as reported in recently released findings of the latest Intergovernmental Panel on Climate Change (IPCC) reports (IPCC, 2019; IPCC, 2021; IPCC, 2022), and other more dire, increasingly urgent assessments (Forster et al., 2023; Hansen et al., 2023), such estimates and the projection of their trajectory and future trends in the near- and medium-term, not only hold implications for agricultural production, food security, and sustainable development, biodiversity and conservation, but ultimately, the well-being of human civilization.
An established approach employed to evaluate aridity status and changes involves the use of the aridity index (AI), which describes the ratio of precipitation to PET. Aridity indices (Arora, 2002; Greve et al., 2019; Nastos et al., 2013) furnish a means to gauge moisture availability for plant growth, generally of specific reference crops or specific vegetation types (Allen et al., 1998; Itenfisu et al., 2003; Walter et al., 2001). By consolidating the complex concept of aridity into a single numerical value, the utilization of aridity indices enables both spatial and temporal comparisons. The AI serves as proxy for a comprehensive evaluation of a set of hydro-climatological and hydro-ecological variables to determine historical, recent conditions and projected changes in hydrological cycles at specified future times and time scales, notably soil moisture availability. Application of an AI to historical climate datasets can establish crucial baselines for monitoring and assessing the impact and consequences of climatic change on hydrological cycles. Both PET and AI regularly serve as inputs for various operational decision-making processes, including irrigation management, crop cultivation practices, and the anticipation of drought and flood, with great value for agricultural production and water resource governance (Zhou et al., 2020). These indices provide policy guidance across various sectors beyond agricultural and natural resource management, with significant implications for meeting the various Sustainable Development Goals, several of which are directly water related.
A previous initial version, the “Global Aridity Index and PET Database” (Global-AI_PET_v1) (Trabucco & Zomer, 2008), based on the historical global climatic dataset WorldClim v1.4 (Hijmans et al., 2005: available at http://WorldClim.org), and calculated using the Hargreaves equation (Hargreaves, 1994b) for the averaged time period 1960–1990, has been available online since 2009 (Trabucco & Zomer, 2008; Trabucco et al., 2008; Zomer et al., 2006; Zomer et al., 2008). A subsequent version, the “Global Aridity Index and Potential Evapotranspiration (ET0) Climate Database” - Global-AI_PET_v2 (Trabucco & Zomer, 2019) - implementing a Penman-Monteith equation and based on the WorldClim 2.0 (Hijmans et al., 2005) for the averaged period 1970–2000, has been available online since 2019, with an updated version - Global-AI_PET_v3 (Zomer et al., 2022) - based on the WorldClim v2.1 historical dataset available since 2022. These datasets have been shown to have wide utility across a wide range of disciplines and have been downloaded and cited numerous times, and are fully discussed in Zomer et al., 2022. Both have been used in this study as comparative references.
A set of future projections of global PET and AI (Figure 1) were produced to construct the Global-Future_AI_PET Database (Zomer & Trabucco, 2024) based on 22 Coupled Inter-Comparison Modeling Project – Phase 6 (CMIP6: (Eyring et al., 2016)) Earth System Models (ESM). Due to a continuing lack of high resolution downscaled CMIP6 future projection data for several climate variables needed to parameterize a full implementation of the Penman-Monteith equation, and a desire to maintain continuity with the previously used WorldClim (Fick & Hijmans, 2017) datasets (reportedly among the most widely used climatic datasets for environmental, biogeographical or ecological analysis (Bobrowski et al., 2021)), Hargreaves equation for calculating PET, was applied to the CMIP6 ESM data. This maintains a similar approach and methodology as used to develop the Global-AI_PET Database v1 (Trabucco & Zomer, 2008) Using bias-corrected downscaled climatic parameters (i.e., minimum / maximum temperature, and precipitation), derived from interpolation of weather station data (30 arc seconds resolution), and provided by WorldClim.org, each ESM model projection was evaluated across four emission scenarios, or Shared Socio-Economic Pathways (SSP 126; 245; 370; 585). In total there are 168 ESM/SSP scenario combinations in the database, as there are a few exceptions due to missing data (Table 1). Additionally, three multimodel ensemble averages have been calculated (for each of the respective SSP): an ensemble including all the available models, a majority consensus ensemble and an ensemble outlining a high risk (more extreme) scenario. In addition, PET and AI have been calculated as 30-years average for two historical time periods (1960–1990; 1970–2000). The Future_Global_AI_PET Database (Zomer & Trabucco, 2024) described in this paper is archived and available online from the Science Data Bank (ScienceDB) at: https://doi.org/10.57760/sciencedb.nbsdc.00086.
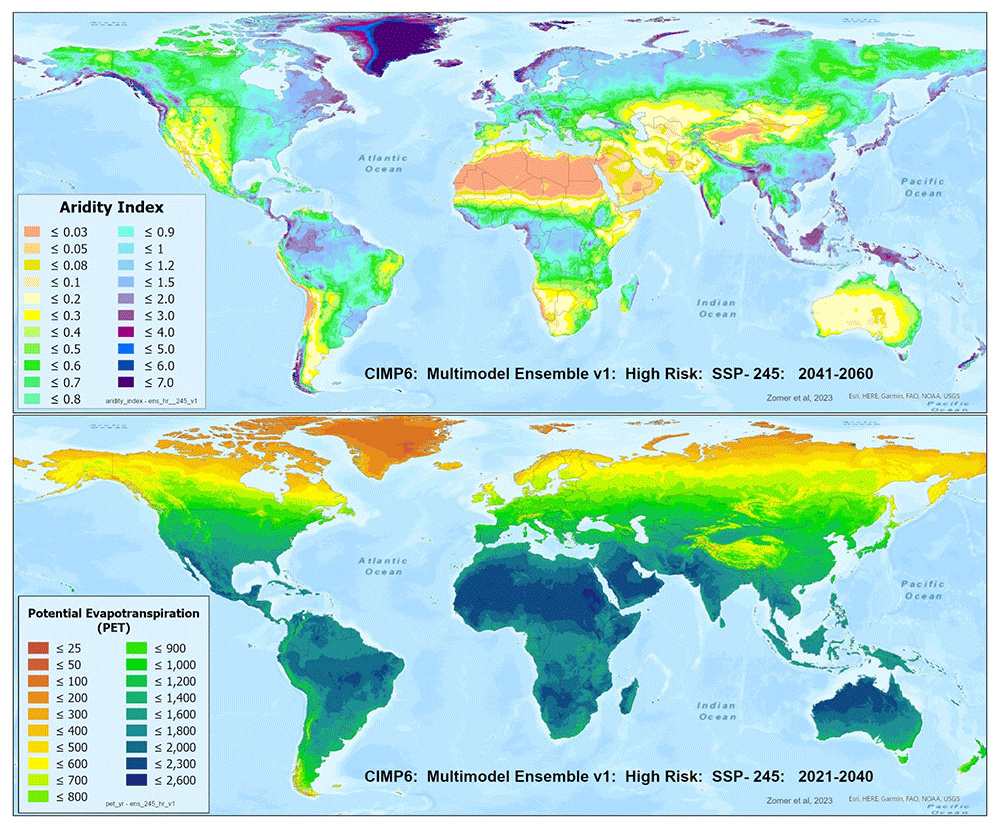
Figure 1. Global PET and Aridity Index.
Global PET and Aridity Index calculated using the Hargreaves equation for the entire globe at 1 km spatial resolution, showing an example using a averaged multimodel ensemble of future projections of CMIP6 ESM for two time periods.
Table 1. Available datasets in the Future_Global_AI_PET Database.
Available datasets in the Future_Global_AI_PET Database, including two historical datasets, 22 ESM models calculated for each of their respective SSP, for two time periods, and 3 averaged multimodel ensembles.
| Historical Datasets | | | | | | | | | |
|---|
| WorldClim 1.4 (1960–1990) | | | | | | | | | ESMs included within Ensemble |
|---|
| WorldClim 2.1 (1970–2000) | | | | | | | | | |
|---|
| Earth System Models (ESM) | Year: 2021–2040 | Year: 2041–2060 | MultiModel Ensemble |
|---|
| SSP Scenario: | 126 | 245 | 370 | 585 | 126 | 245 | 370 | 585 | All | Consensus | High-Risk |
|---|
| ACCESS-CM2 | X | X | X | X | X | X | X | X | X | | X |
| ACCESS-ESM1-5 | X | X | X | X | X | X | X | X | X | X | |
| CanESM5 | X | X | X | X | X | X | X | X | X | | X |
| CanESM5-CanOE | X | X | X | X | X | X | X | X | X | | X |
| CMCC-ESM2 | X | X | X | X | X | X | X | X | X | X | |
| CNRM-CM6-1 | X | X | X | X | X | X | X | X | X | X | |
| CNRM-CM6-1-HR | X | X | X | X | X | X | X | X | X | X | |
| CNRM-ESM2-1 | X | X | X | X | X | X | X | X | X | X | |
| FIO-ESM-2-0 | X | X | | X | X | X | | X | X | | |
| GFDL-ESM4 | X | | X | | X | | X | | X | | |
| GISS-E2-1-G | X | X | X | X | X | X | X | X | X | X | |
| GISS-E2-1-H | X | X | X | X | X | X | X | X | X | X | |
| HadGEM3-GC31-LL | X | X | | X | X | X | | X | X | | X |
| INM-CM4-8 | X | X | X | X | X | X | X | X | X | X | |
| INM-CM5-0 | X | X | X | X | X | X | X | X | X | X | |
| IPSL-CM6A-LR | X | X | X | X | X | X | X | X | X | X | |
| MIROC-ES2L | X | X | X | X | X | X | X | X | X | X | |
| MIROC6 | X | X | X | X | X | X | X | X | X | X | |
| MPI-ESM1-2-HR | X | X | X | X | X | X | X | X | X | X | |
| MPI-ESM1-2-LR | X | X | X | X | X | X | X | X | X | X | |
| MRI-ESM2-0 | X | X | X | X | X | X | X | X | X | X | |
| UKESM1-0-LL | X | X | X | X | X | X | X | X | X | | X |
| MultiModlel_Ensemble | | | | | | | | | No. of ESM in Ensemble |
| All | X | X | X | X | X | X | X | X | | | |
| Consensus | X | X | X | X | X | X | X | X | 20 – 22 | 15 | 4 – 5 |
| High-Risk | X | X | X | X | X | X | X | X | | | |
Methods
Estimating potential evapotranspiration
Among the various equations employed for estimating PET (Droogers & Allen, 2002; Hadria et al., 2021; Hargreaves, 1994a; Hargreaves & Samani, 1985; Itenfisu et al., 2003; Mchmahon et al., 2016; Srdić et al., 2023; Sutapa et al., 2020), the Penman-Monteith equation and methodology outlined in the Food and Agriculture Organization FAO-56 (Allen et al., 1998) guidelines is widely recognized as the standard method. FAO-56 defines and provides guidance on calculating reference evapotranspiration (ET0), that is, the evapotranspiration (ET) of a reference crop, rather than defining potential evapotranspiration (PET) directly. FAO-56 presents a standard method to estimate ET0, which is widely accepted as a reference standard, and often closely related to PET in practice. In FAO-56, the ET0 is calculated using the Penman-Monteith equation, which takes into account factors like temperature, relative humidity, wind speed, and solar radiation. While ET0 is a measure of the evapotranspiration rate from a reference crop under optimal conditions, PET generally represents the water demand of vegetation if water is freely available. Though not synonymous, ET0 from FAO-56 is widely used as an estimate for PET, particularly in agricultural and environmental applications.
FAO-56 defined the ET of a reference crop (ET0) under optimal conditions. Specifically, it assumes a reference crop characterized by well-watered grass with a uniform height of 12 centimeters, a fixed surface resistance of 70 seconds per meter, and an albedo of 0.231. More generally, ET0 quantifies the rate at which readily available soil water evaporates from specified vegetated surfaces comprised of dense, actively growing vegetation with prescribed height and surface resistance, not limited by soil water availability and encompassing an expanse of at least 100 sq. meters of similar or identical vegetation types. ET0 serves as a fundamental hydrological variable with utility in various research domains, notably related to hydrologic water balance, simulation of crop yield, management of irrigation systems, and water resources management. ET0 values obtained from different locations or seasons are comparable as they pertain to evapotranspiration from the same reference surface enabling researchers and practitioners to evaluate atmospheric evaporative demand independent of specific crop characteristics, crop development stages, management practices, or water availability (Itenfisu et al., 2003; Zotarelli et al., 2018). Climatic parameters and crop-specific resistance coefficients determined for the reference vegetation are the principal factors influencing ET0 estimation (Jensen & Allen, 2016). As such, additional crop-specific coefficients (Kc) and ET0 can, in turn, be employed to derive ET estimates for specific crops (ETc).
The International Commission for Irrigation and Drainage (ICID) (Doorebos & Pruitt, 1977; Hargreaves, 1994b) and the Food and Agriculture Organization of the United Nations - FAO (Allen et al., 1998) designated the Penman-Monteith (PM) method as a standard method of computing ET0 from climatic data and designated it as the reference for evaluating other methods. A study of ET0 equations using lysimeter ET and synoptic climatic data by European Commission’s Joint Research Centre (Choisnel et al., 1992) compared twelve equations using Penman-Monteith (Allen et al., 1998) as the reference standard. The results from the PM equation were compared with nine equations that are simpler and require less data than the data intensive requirements of the PM equations. The Hargreaves (Hargreaves, 1994b) equation demonstrated the nearest results to the classic PM (Droogers & Allen, 2002; Itenfisu et al., 2003). The Hargreaves method with substantially less data requirements, i.e., requiring only measured values of maximum and minimum temperatures and precipitation, was recommended for more general use and therefore is considered more appropriately applicable to data scarce regions and situations (Droogers & Allen, 2002). For the purposes of this paper, to maintain clarity, we refer to reference evapotranspiration calculated using the Penman-Monteith as “ET0” and calculations using the Hargreaves equation as “PET”.
To meet the objectives of a global spatial analysis at the desired very high spatial resolution (30 arc seconds or ~1 km) with available climate variables (temperature and precipitation), in the preparation of the previously released first version of the Global-AI_PET_v1 (Trabucco et al., 2008; Zomer et al., 2006), four different temperature-based methods of calculating PET were compared with the Penman-Monteith method for calculating ET0, and tested to determine which equation performed the best for the objectives of that analysis (Figure 2; Table 2): Thornthwaite (Thornthwaite, 1948), Thornthwaite modified by Holland (Holland, 1978), Hargreaves (Hargreaves, 1994a), Hargreaves Modified by Droogers and Allen (Droogers & Allen, 2002), and the FAO Global Penman–Monteith Spatial Dataset (Allen et al., 1998).
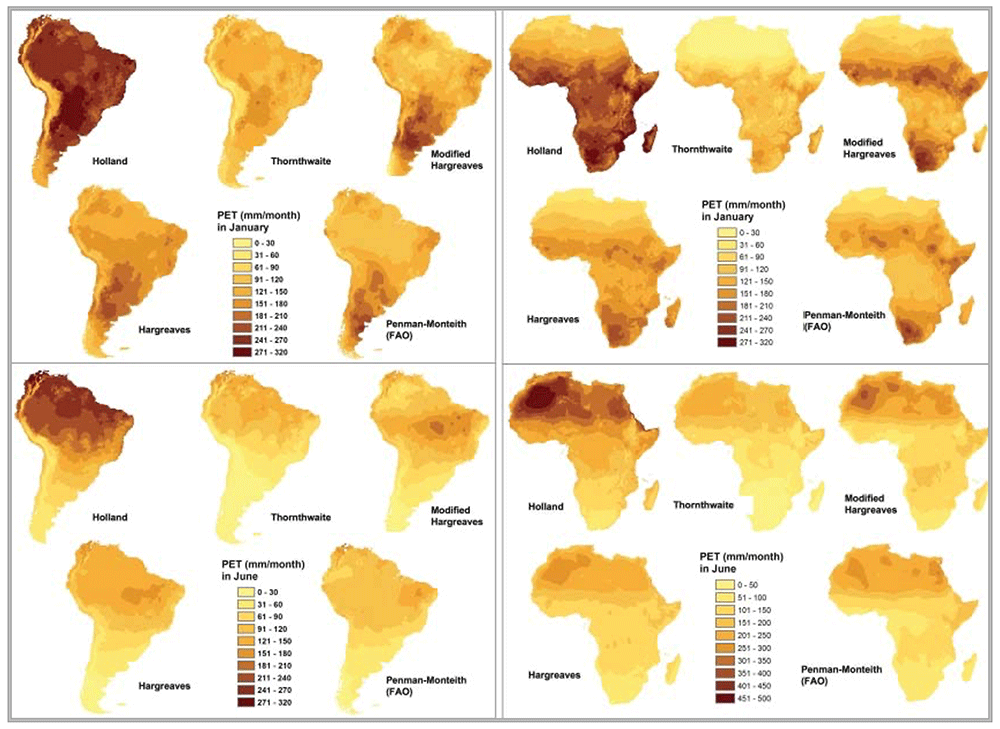
Figure 2. Comparison of five different methods of calculating PET.
Comparison of four different temperature-based methods of calculating PET (Thornthwaite, Thornthwaite modified by Holland, Hargreaves, Hargreaves Modified by Droogers and Allen), against the reference FAO Global Penman–Monteith.
Table 2. Comparison of four different temperature-based methods of calculating PET (Zomer et al., 2006).
Five different methods of calculating PET were tested to verify which performed the best for the objectives of this analysis: Thornthwaite (Thornthwaite, 1948), Thornthwaite modified by Holland (Holland, 1978), Hargreaves (Hargreaves et al., 1985), Hargreaves modified by Droogers (Droogers & Allen, 2002), and the FAO Global Penman-Monteith Dataset (Allen et al., 1998). Results of the comparison are given as the mean difference (Mean Diff) between Penman_Montieth estimates based on observed weather station data and predicted estimates using the various different methods, and their standard deviations (Std Dev). Source: (Trabucco et al., 2008).
| | Mean Difference (mm) and Standard Deviation (mm) between Observed and Predicted Values: |
|---|
| | Holland
(Thornthwaite) | Thornthwaite | Hargreaves | Modified
Hargreaves | Penman-Monteith
FAO |
|---|
| Region | Month | Mean Diff | Std Dev | Mean Diff | Std Dev | Mean Diff | Std Dev | Mean Diff | Std Dev | Mean Diff | Std Dev |
|---|
| Africa | | | | | | | | | | | |
| January | 71.8 | 40.2 | 41.6 | 33.3 | 22.3 | 16.1 | 24.8 | 20.1 | 11.1 | 12.6 |
| July | 84.4 | 41.7 | 32.1 | 23.7 | 20.0 | 19.3 | 21.1 | 19.3 | 12.7 | 16.0 |
| South America | | | | | | | | | | |
| January | 69.9 | 43.6 | 50.5 | 32.9 | 38.2 | 19.2 | 41.6 | 26.0 | 34.9 | 26.7 |
| July | 67.3 | 35.9 | 37.2 | 24.7 | 27.2 | 14 | 30.4 | 20.1 | 24.3 | 15.1 |
| Resolution | 1 km | 1 km | 1 km | 1 km | 20 km |
These are briefly described below:
Thornthwaite equation (Thornthwaite, 1948)
Where:
PET is the estimated potential evapotranspiration (mm/month)
Td is the average daily temperature (degrees Celsius; if this is negative, use 0) of the month being calculated
N is the number of days in the month being calculated
L is the average day length (hours) of the month being calculated
∝ = (6.75 * 10–7) I3 – (7.71 * 10–5) I2 + (1.792 * 10–2) I + 0.49239
is a heat index based on the 12 monthly mean temperatures.
Thornthwaite modified by Holland (Gordon et al., 2005; Holland, 1978):
This equation requires only one climatic input variable (Celsius temperature T) and it has been suggested that Thornthwaite-based methods are as good as more refined methods when dealing with monthly data as compared with more detailed daily data (27).
Modified Hargreaves (Droogers & Allen, 2002)
ET0 = 0.0013 · 0.408RA · (Tavg + 17.0) · (T D − 0.0123P)0.76
Where:
RA is extraterrestrial radiation expressed in (MJ m−2 d−1),
Tavg is average daily temperature (C°)
TD (C°) is the temperature range
P is precipitation in mm per month
FAO 56 Penman–Monteith equation (Allen et al., 1998)
The FAO-56 Penman-Monteith form of the combination equation to estimate ET0 is calculated as:
Where
ET0 is the evapotranspiration for reference crop, as mm day-1
Rn is the net radiation at the crop surface, as MJ m-2 day-1
G is the soil heat flux density, as MJ m-2 day-1
cp is the specific heat of dry air
pa is the air density at constant pressure
es is the saturation vapour pressure, as kPa
ea is the actual vapour pressure, as kPa
es - ea is the saturation vapour pressure deficit, as kPa
Δ is the slope vapour pressure curve, as kPa °C-1
γ is the psychrometric constant, as kPa °C-1
rs is the bulk surface resistance, as m s-1
ra is the aerodynamic resistance, as m s-1
Values for PET calculated using each of the above five methods were compared to PET values for specific weather stations calculated using historical weather station data (n = 2288). ET0 values were calculated using the more complex Penman–Montieth model applied on direct observations of the various climatic parameters obtained from the FAOCLIM (FAO and (SDRN), 2001) climate station dataset (covering the time period: 1960–1990). Based on the results of the comparative validation, the Hargreaves model was confirmed to be the best fit to model PET globally with the available data at the time and chosen for the implementation of the Global-AI_PET_v1. The Hargreaves method has been shown to perform well compared to the PM method, but required less parameterization, and had significantly lower sensitivity to error in climatic inputs (Allen et al., 1998; Droogers & Allen, 2002; Jensen et al., 1997; Pimentel et al., 2023). Although the release of the WorldClim v2.1 allowed for the implementation of the PM equation and the development of the Global-AI_PET_v3, the currently available downscaled CMIP6 projections (available from WorldClim.org) do not provide the full set of climate variables required to implement the PM equation at this resolution.
Hargreaves equation
The Hargreaves methodology (Hargreaves, 1994b; Hargreaves & Samani, 1985; Jensen & Allen, 2016; Jensen et al., 1997; Wang et al., 2018) uses only mean monthly temperature (Tmean), mean monthly temperature range (TD) and extraterrestrial radiation (RA, radiation on top of the atmosphere) to calculate PET, as shown below:
where Ra is extraterrestrial radiation at the top of the atmosphere, TD is the difference between mean maximum temperatures and mean minimum temperatures (Tmax - Tmin), and Tmean is equal to Tmax + Tmin divided by 2. PET is multiplied by number of days in each month to give the monthly total (mm/month).
Extraterrestrial radiation, Ra, is calculated as follows (Jensen et al., 1997; Jensen & Allen, 2016; Wang et al., 2018):
Where: Ra is in mm/day
Gsc is the solar constant [MJ m-2day-1] (117.5 MJ m-2day-1),
φ is the latitude [radians],
ωs is the sunset hour angle [radians],
dr is the relative distance between Earth and Sun
δ is the solar declination [rad].
The last three variables are calculated as follows:
Where: J is the Julian Day, or number of the day in the year.
The Hargreaves equation was implemented globally on a per grid cell basis at 30 arc seconds resolution (~ 1km2 at the equator), in ArcGIS (v11.1) using Python v3.2 (see code availability section) to estimate PET and derive an AI using an ensemble of future projections provided by the CMIP6 collaboration (Eyring et al., 2016). The data to parametrize the equation were obtained from the WorldClim.org online data repository (Fick & Hijmans, 2017), which provides bias-corrected downscaled monthly values of minimum temperature, maximum temperature, and precipitation for 22 CMIP6 Earth System Models (ESMs), for each of four SSP: 126, 245, 370 and 585.
PET and AI were estimated for two historical periods, WorldClim 1.4 (1960–1990) and WorldClim 2.1 (1970–2000), representing on average a decades’ change, by applying the Hargreaves methodology described above. Similarly, PET and AI were estimated for two future time periods, namely 2021–2040 and 2041–2060, for each of the 22 models across their respective four SSP scenarios (126, 245, 370,585).
Aridity Index
The aridity index (AI) is expressed as the ratio of precipitation over PET (or ET0). The AI quantifies water availability for plant growth based on the ratio of precipitation to PET (or ET0) and is a measure of available precipitation relative to water demand for plant growth (Arora, 2002; Derdous et al., 2020; Girvetz & Zganjar, 2014).
The AI for the averaged time periods has been calculated on a per grid cell basis, as:
where:
AI = Aridity Index
MA_Prec = Mean Annual Precipitation
MA_PET = Mean Annual PET
Using the mean annual precipitation (MA_Prec) values obtained from the CMIP6 downscaled climate projections, and the PET (MA_PET) datasets estimated as monthly averages by the method described above and aggregated at yearly scale. The AI algorithm was implemented on a per grid cell basis. Using this formulation, AI values are unitless, increasing with more humid condition and decreasing with more arid conditions.
As a general reference, the climate classification scheme for AI values provided by UNEP (UNEP, 1997) provides an insight into the climatic significance of the range of moisture availability conditions described by the AI (Table 3). Higher values of the AI, primarily evident in the colder and arctic regions, are considered not interpretable in terms of plant growth as per the original intent of the aridity index measure.
Table 3. Climate classification scheme for AI values.
Climate classification scheme for AI values (UNEP, 1997).
| Aridity Index Value | Climate Class |
|---|
| < 0.03 | Hyper-Arid |
| 0.03 – 0.2 | Arid |
| 0.2 – 0.5 | Semi-Arid |
| 0.5 – 0.65 | Dry Sub-Humid |
| > 0.65 | Humid |
Multi-model ensembles
Based upon the distribution of the various scenarios along their projected temperature and precipitation estimates for each of the two future time period (Figure 3 & Figure 4), three multi-model ensembles, each articulated by their four respective SSPs, were identified (Table 1).
All Models: includes all of the 22 ESM, as available within a particular SSP.
High Risk: includes 5 ESM identified as projecting the highest increases in temperature and precipitation and lying outside and significantly higher than the majority of estimates.
Majority Consensus: includes 15 ESM, that is, all available ESM excluding the ESM in the “High Risk” category, and those missing data across all of the 4 SSP. Further herein referred to as the “Consensus” category.
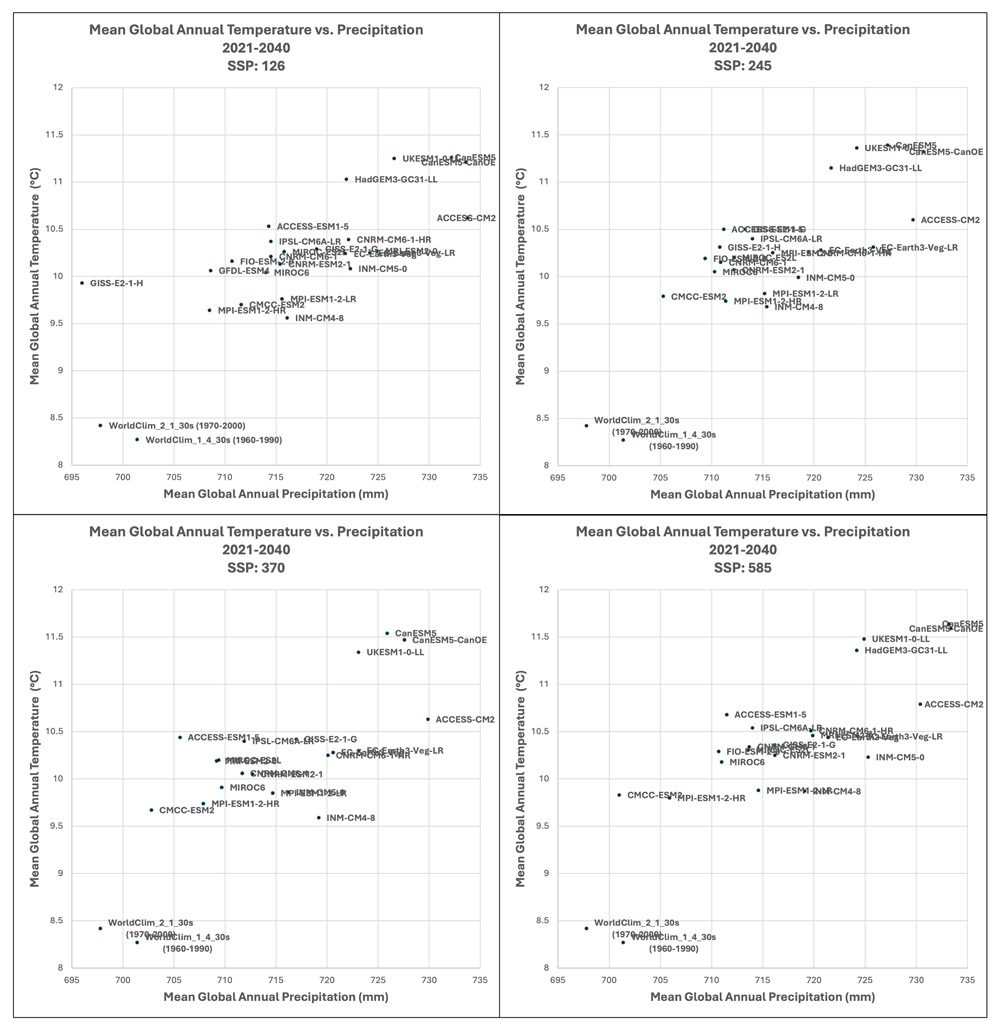
Figure 3. Distribution of 22 CMIP6 Earth System Models along temperature and precipitation gradients (2021–2040).
Distribution of average global mean annual temperature and mean annual precipitation of 22 CMIP6 ESM for four SSP for the time period 2021–2040.
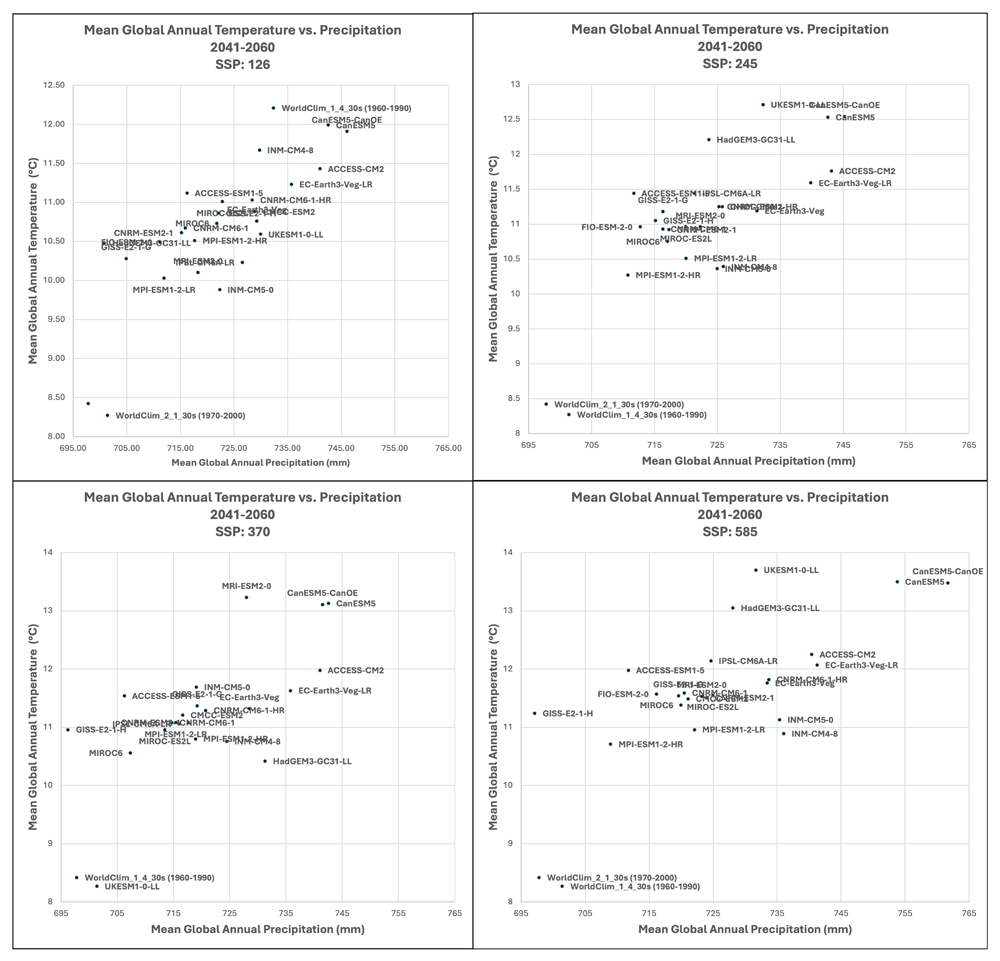
Figure 4. Distribution of 22 CMIP6 Earth System Models along temperature and precipitation gradients (2041–2060).
Distribution of average global mean annual temperature and mean annual precipitation of 22 CMIP6 ESM for four SSP for the time period 2041–2060.
The three parameters of monthly minimum temperature, monthly maximum temperature and monthly precipitation for ESM’s included within each of these ensembles were averaged for each of their respective SSPs. These averaged parameters were then used to calculate average PET and AI for each ensemble category as per the above methodology.
In general, there was found to be a high level of agreement amongst the ESM included within each of the respective averaged multimodel ensembles (Table 4), however, as illustrated in Figure 5, with significant variability across regions (See Extended Materials for regional results). Agreement was fairly high for the basic parameters of annual average temperature and annual average precipitation with all values below 5%, indicating very low variability relative to the mean, suggesting strong consistency or agreement. Somewhat less for annual averaged PET and AI, which is slightly increased in the 2041–2060 time period. To compensate for negative values, the coefficient of variation (CoV) for mean annual temperature was calculated by adding 33 degrees to the annual temperature value.
Table 4. Coefficient of variation of ensemble averages.
Coefficient of variation showing agreement amongst CMIP_6 Earth System Models (ESM) included with each of three averaged multimodel ensembles, as articulated for each of four shared socio-economic pathways (SSP: Scenario).
MultiModel
Ensemble | | Coefficient of Variation (%) |
|---|
| 2021–2040 |
|---|
| Scenario | tmean_yr | prec_yr | pet_yr | aridity_index |
|---|
| All | 126 | 2.08 | 4.24 | 2.95 | 5.30 |
| 245 | 2.21 | 4.42 | 3.19 | 5.68 |
| 370 | 2.49 | 4.96 | 3.48 | 6.36 |
| 585 | 2.56 | 5.32 | 3.85 | 7.07 |
| Ensemble average: | 2.34 | 4.74 | 3.37 | 6.10 |
| Consensus | 126 | 1.44 | 3.64 | 2.37 | 4.75 |
| 245 | 1.44 | 3.65 | 2.37 | 4.83 |
| 370 | 1.36 | 3.85 | 2.33 | 5.12 |
| 585 | 1.48 | 4.31 | 2.61 | 5.73 |
| Ensemble average: | 1.43 | 3.86 | 2.42 | 5.11 |
| High Risk | 126 | 1.09 | 2.63 | 1.71 | 3.72 |
| 245 | 1.17 | 2.68 | 1.75 | 3.80 |
| 370 | 1.30 | 2.61 | 1.69 | 3.58 |
| 585 | 1.22 | 2.88 | 1.71 | 3.91 |
| Ensemble average: | 1.20 | 2.70 | 1.72 | 3.75 |
| MultiModel | | 2041–2060 |
|---|
| Ensemble | Scenario | tmean_yr | prec_yr | pet_yr | aridity_index |
|---|
| All | 126 | 2.08 | 4.19 | 2.94 | 5.24 |
| 245 | 2.21 | 4.42 | 3.19 | 5.67 |
| 370 | 2.49 | 4.00 | 2.42 | 5.18 |
| 585 | 2.56 | 4.45 | 2.69 | 5.78 |
| Ensemble average: | 2.34 | 4.27 | 2.81 | 5.47 |
| Consensus | 126 | 1.44 | 3.70 | 2.41 | 4.70 |
| 245 | 1.44 | 3.82 | 2.46 | 4.90 |
| 370 | 1.36 | 4.03 | 2.44 | 5.19 |
| 585 | 1.48 | 4.49 | 2.71 | 5.79 |
| Ensemble average: | 1.43 | 4.01 | 2.51 | 5.15 |
| High_Risk | 126 | 1.25 | 3.18 | 2.17 | 4.67 |
| 245 | 1.34 | 3.47 | 2.40 | 5.14 |
| 370 | 1.72 | 3.78 | 2.80 | 5.66 |
| 585 | 1.76 | 4.32 | 3.04 | 6.42 |
| Ensemble average: | 1.52 | 3.69 | 2.60 | 5.47 |
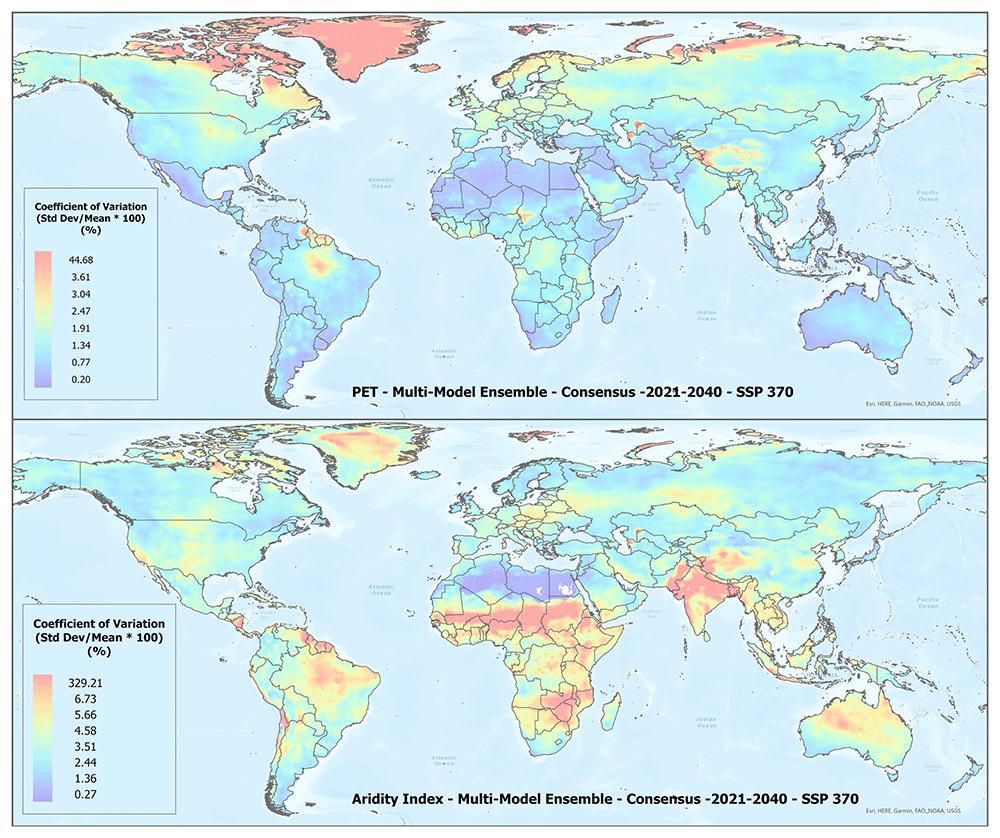
Figure 5. Example of spatial variation of Coefficient of Variation (CoV) of PET and Aridity Index.
Coefficient of variation of PET and Aridity Index as shown for the “Consensus” multimodel ensemble average, SPP 370 scenario, shown here to illustrate variation in agreement across the various global regions.
An overview of the distribution of the global average annual temperature and average annual precipitation projected by the various ensembles, as articulated to each SSP (Figure 6) illustrates that all models indicate global trends of increasing precipitation and increasing temperature in the near-term, more so by the 2041–2060 time period. However, when considering the projected global increase in PET (Figure 7), there emerges a distinct and significant drying trend indicated by decreasing AI values, both in the near-term, and again, more so by 2041–2060. There is, however, significant variability shown among regions (See Extended Data for tabular and regional descriptive statistics).
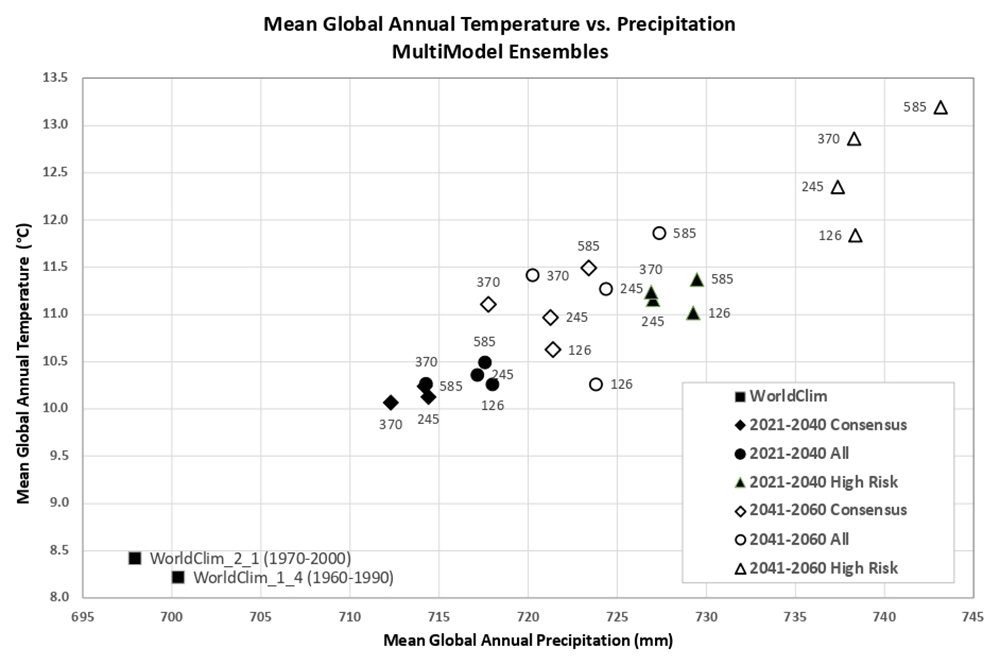
Figure 6. Distribution of historical and projected global averaged annual temperature and annual precipitation.
Distribution of historical and projected global averaged annual temperature (°C) and annual precipitation (mm) of three averaged multimodel ensembles, across four shared socio-economic pathways (SSP: 126; 245; 370; 585).
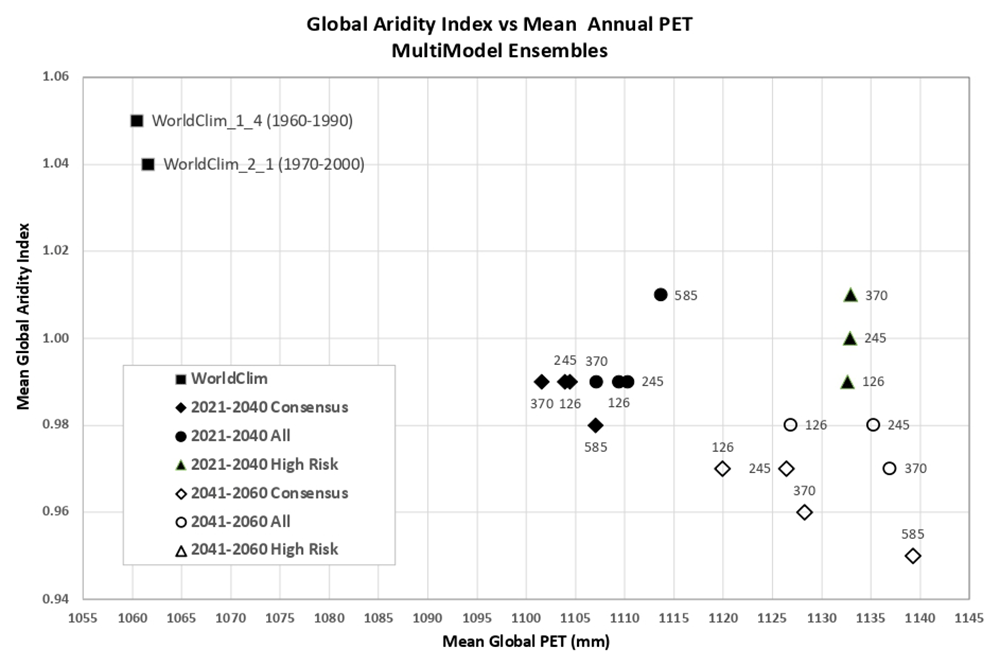
Figure 7. Distribution of historical and projected global averaged PET and Aridity Index.
Distribution of historical and projected global averaged PET (mm) and the aridity index (AI) of three averaged multimodel ensembles, across four shared socio-economic pathways (SSP: 126; 245; 370; 585). Higher AI values indicate wetter conditions, lower values indicate drier conditions.
Technical validation
The global estimations of PET (Hargreaves method) and ET0 (Penmen-Monteith), and their respective AI derived from these, were evaluated against the FAO “CLIMWAT 2.0 for CROPWAT” (Muñoz & Greiser, 2006) global climate database using long-term monthly mean values of climatic parameters derived from weather station data, roughly covering the period of 1971–2000, concurrent with the temporal coverage of the WorldClim version 2.1 database (Fick & Hijmans, 2017; Zomer et al., 2022). CLIMWAT 2.0 provides observed agroclimatic data of over 5000 stations distributed worldwide (Figure 8), including monthly averages for seven climatic parameters, namely maximum temperature, minimum temperature, relative humidity, wind speed, sunshine hours, radiation balance and ET0 calculated according to the Penman-Monteith method, as well as the coordinates and altitude of the station.
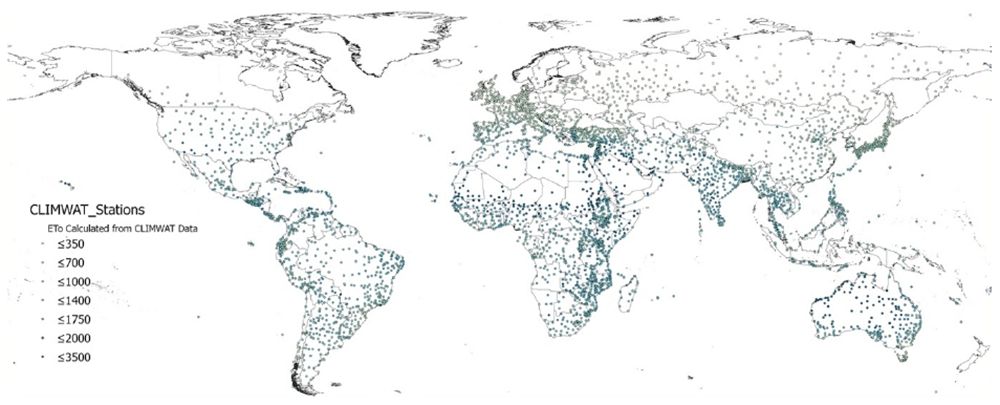
Figure 8. Location of weather stations included in the FAO CLIMWAT dataset.
Location of weather stations included in the FAO CLIMWAT dataset, showing ET0_CLIMWAT values for Penman-Monteith Reference Evapotranspiration (ET0) (Muñoz & Greiser, 2006).
Input parameters for validation were extracted from each of the two historical geospatial datasets by sampling of the gridded data at the weather station coordinates and were compared with the values from the weather station data to evaluate the accuracy and overlap of the CLIMWAT and WorldClim datasets, and the suitability of using the CLIMWAT to evaluate the performance of the PET spatial estimation. An assessment of the input parameters from the WorldClim datasets showed high levels of correspondence when compared to the CLIMWAT data ((Zomer et al., 2022) that the CLIMWAT was considered an appropriate dataset available for evaluating the accuracy of the PET and AI estimation algorithms.
The previously developed dataset, Global-AI_PET_v3 (Zomer et al., 2022), based upon WorldClim v. 2.1 and calculated using the Penman-Monteith equation was used as a comparative standard, with the assumption that the full implementation of the Penman-Monteith, it being the standard, would provide the more robust results. PET estimates were tested and compared both using the Hargreaves and the Penman-Monteith equations with CLIMWAT provided parameters from 4242 weather stations to parameterize the estimation algorithm (Table 5; Figure 9). The calculated values for the Hargreaves equation were shown to have a moderate level of correspondence (r2 = 0.68) with a fairly high standard error (346 mm). As expected, the Penman-Monteith results were highly accurate (r2 = 0.99; standard error = 36mm), as they replicated the CLIMWAT weather station reported results, i.e., using the same equation, confirming the relative accuracy of the dataset and its fitness for use as a comparative standard. The algorithm was then implemented geospatially on a per grid cell basis to produce global geospatial datasets calculated based upon the Hargreaves equation for the two historical time periods (WorldClim 1.4 – 1960-1990; WorldClim 2.1 – 1970-2000) and tested against the CLIMWAT ET0 estimates from 3842 weather stations (i.e. all weather stations with useable data across all of the compared datasets). Although the results showed a higher level of accuracy (r2 = 0.85) for the Penman-Monteith calculated dataset (Global_ET0_v3), the relatively (or moderately) high accuracy (r2 = 0.72) attained by the Hargreaves implementation of the algorithm maybe considered sufficient for use within many modeling and other efforts, however, with caveats in light of the variability associated with both the input data and accuracy of the estimation algorithm when applied globally. In particular, local estimates may have high variability associated with steep elevation gradients and heterogenous terrain, and/or low levels of accuracy at the grid cell level in certain regions due to interpolation of scattered or less dense weather station data. There is significant potential for error associated with both the interpolated and downscaled global input data and the application of the Hargreaves methodology (or Penman-Monteith for that matter) when implemented globally. It has been noted that the Hargreaves equation tends to under-estimate ETo under high wind conditions (> 3m/s) and to over-estimate under conditions of high relative humidity (Richards, 2015).
Table 5. Summary Table of Technical Validation Results.
| Regression | R Square | Standard Error | Bias |
|---|
Potential Evapotranspiration_ETo
PET_CLIMWAT_XLS vs ETo_CLIMWAT
ET0_CLIMWAT_XLS vs ET0_CLIMWAT
PET_WC_1.4 vs ETo_CLIMWAT
PET_WC_2.1 vs ET0_CLIMWAT
Global_ET0_v3 vs ET0_CLIMWAT
PET_WC_2.1 vs Global_ET0_v3
Global_ET0_v3 vs ET0_CRU_TS |
0.680
0.99
0.72
0.76
0.85
0.67
0.89 |
345
36
221
212
219
238
136 |
586.30
-53.71
-132.65
-128.90
-389.38
-262.12
-408.12 |
Aridity Index
AI_WC_1.4 vs AI_CLIMWAT
AI_WC_2.1 vs AI_CLIMWAT
Global_AI_v3 vs AI_CLIMWAT
AI_WC_2.1 vs Global_AI_v3
AI_CLIMWAT vs AI_CRU_TS
AI_WC_2.1 vs AI_CRU_TS
Global_AI_v3 vs AI_CRU_TS |
0.91
0.88
0.90
0.89
0.77
0.79
0.83 |
0.16
0.18
0.17
0.18
0.33
0.26
0.22 |
0.14
0.14
0.21
0.07
-0.02
-0.16
-0.23 |
| ** Evaluated datasets | Description |
|---|
PET (ET0)
ET0_ClimWat
ET0_ClimWat_XLS
ET0_CRU_TS
PET_WC_1.4
PET_WC_2.1
Global_ET0_v3 |
ET0 as reported by CLIMWAT station data
ET0 calculated using estimation algorithm parameterized with CLIMWAT station data
ET0 extracted from CRU_TS PET grid
PET calculated using WC_1.4 1960 - 1990 (Modified Hargreaves-Thornton)
PET calculated using WC_2.1 - 1970 - 2000 (Modified Hargreaves-Thornton)
ETo calculated using WC_2.1 - 1970 - 2000 (Penman-Monteith) |
Aridity Index (AI)
AI_ClimWat
AI_CRU_TS
AI_WC_1.4
AI_WC_2.1
Global_AI_v3 |
AI calculated using parameters from CLIMWAT station data - 1960-1990 (Penman-Monteith)
AI calculated using ET0_CRU_TS - 1970-2000 (Penman-Monteith)
AI calculated using WC_1.4 - 1990 - 2000 (Modified Hargreaves-Thornton)
AI calculated using WC_2.1 - 1970 - 2000 (Modified Hargreaves-Thornton)
AI calculated using WC_2.1 - 1970 - 2000 (Penman-Monteith) |
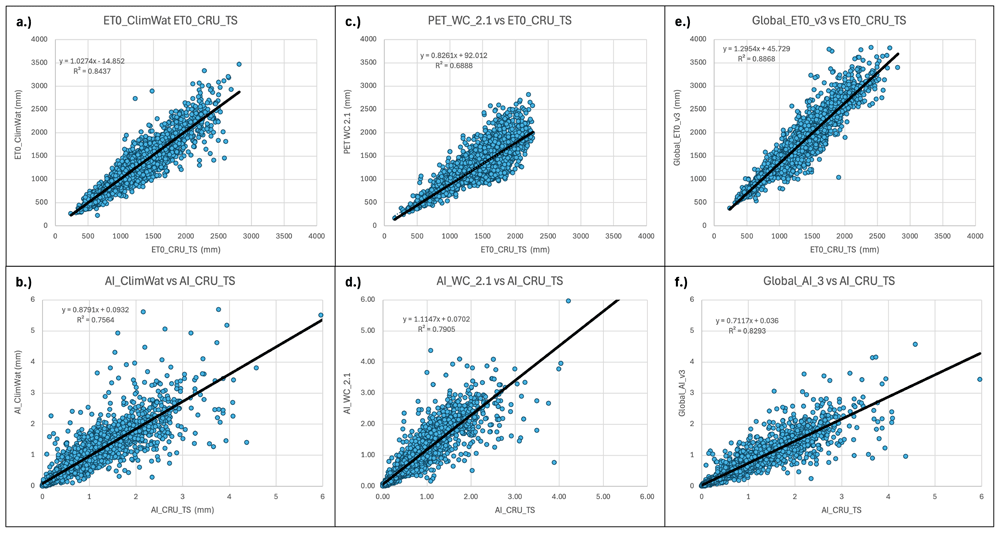
Figure 9. Validation and comparison of input data used in the analysis and results.
Validation and comparison of: a.) PET (Hargreaves) calculated from the CLIMWAT (Muñoz & Greiser, 2006) weather station data versus the CLIMWAT reported ET0 (Penman-Monteith); b.) ET0 (Penman-Monteith) calculated from the CLIMWAT weather station data versus the CLIMWAT reported ET0 (Penman-Monteith); c.) PET Hargreaves (WorldClim 2.1) versus CLIMWAT reported ET0 (Penman-Monteith); d.) Aridity Index ((WorldClim 2.1) versus Aridity Index calculated from CLIMWAT weather station data and reported ET0 (Penman-Monteith); e.) PET (Hargreaves) versus Global ET0 – Version 3 ET0 (Penman-Monteith).
There were significant differences between the Hargreaves (PET_WC_2.1) and Penman-Monteith (Global_ET0_v3) versions of the global implementation (r2 = 0.67). PET_WC_2.1 using the Hargreaves methodology appeared to systematically underestimate higher PET values. Most of these higher values were generally outside of the prescribed realm of validity for the PET estimates related to plant growth or agricultural activities, and mostly found in the higher latitudes and arctic regions. However, the AI estimates based on the AI_WC_2.1 analysis, when compared to AI estimates based on parameters provided by the CLIMWAT weather station data (Table 5; Figure 9e), showed a high level of correspondence (r2 = 0.91), statistically the same as that from the Global-AI_PET_v3 estimates (r2 = 0.90).
Similarly, the estimations of the Hargreaves PET (PET_WC_2.1) and ET 0 (Global_ET 0_v3) were evaluated against the ET 0 dataset provided by the CRU_TS (Climatic Research Unit gridded Time Series version 4.05) (Harris et al., 2020). The CRU_TS is a widely used climate dataset on a 0.5° latitude by 0.5° longitude grid over all land domains of the world except Antarctica. It is derived by the interpolation of monthly climate anomalies from extensive networks of weather station observations. PET values are provided in the CRU_TS dataset, calculated based upon the Penman-Monteith formula (Droogers & Allen, 2002; Zomer et al., 2022; Zotarelli et al., 2018), using the CRU_TS gridded values of mean temperature, vapour pressure, cloud cover and wind field. For our comparison, we averaged the CRU_TS monthly values for PET from 1971–2000 to obtain a global coverage of average annual PET for that time period. The same CLIMWAT meteorological stations used in previous comparisons were used as sample points for the comparison with both the PET and ET 0 datasets, and the CLIMWAT ET0 was also compared with the CRU_TS PET (ET 0_CRU_TS) dataset (r2 = 0.84) to assess general congruence among the datasets (Table 5; Figure 10). Results showed a moderate level of agreement (r2 = 0.68) between the ET0_CRU_TS and Hargreaves (PET_WC_2.1) data, with a significantly higher level of agreement, as expected, for the Penman-Monteith ((Global_ET 0_v3: r2 = 0.89)) results. However, both the Hargreaves and the Penman-Monteith calculated aridity indices showed high correspondence to each other and to the CLIMWAT and CRU_TS results. The CRU_TS precipitation data for the 1971–2000 time period was similarly averaged and used to calculate an AI based upon the CRU_TS dataset and compared to both the PET_WC_2.1 and the Global_AI_v3. The Hargreaves calculated geospatial aridity index dataset (AI_WC_2.1) showed high correspondence (r2= 0.88) with the aridity index results calculated from the CLIMWAT station data (AI_CLIMWAT), only slightly less than the Global_AI_v3 (r2 = 0.90). Both the AI_WC_2.1 and Global_AI_3 performed well (respectively r2 = 0.79 and r2 = 0.83) against the CRU_TS calculated AI (AI_CRU_TS).
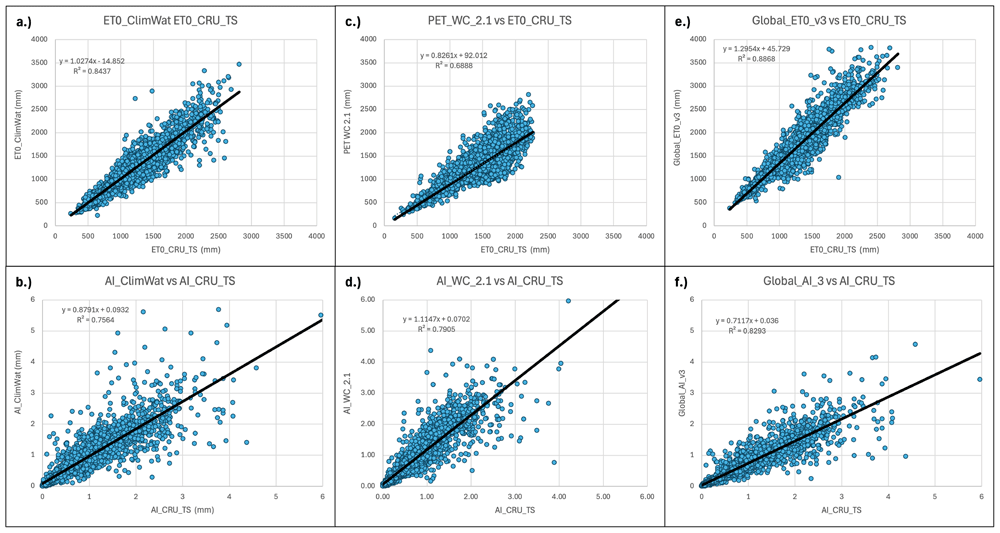
Figure 10. Validation and comparison of Hargreaves PET and Aridity Index vs. CRU_TS dataset.
Validation and comparison of results for the PET (Hargreaves) and the Aridity Index datasets with the CRU_TS (Harris et al., 2020) dataset.
Among other factors, the significant and specific influence of relative humidity and wind speed lead to particular deviations of results across broad climate regions between Hargreaves and Penman-Monteith model results (Allen et al., 1998). This uncertainty has led to several successful attempts (Aschonitis et al., 2017; Tegos et al., 2017) to provide calibration and correction factors map for Hargreaves estimates, based on parametric regression between Hargreaves PET and PM ET0 monthly values for historical condition, that can close the gap between results from Hargreaves and PM methods. While recognizing the value of such efforts, expansion on the use of these parametric corrections have still been quite limited on future projections, This would require at any site not basic changes in correlation between temperature (used in Hargreaves equations) with the others variables (RH, wind speed, solar radiation) additionally used in the Penman-Monteith equation, to maintain relative divergence between Hargreaves and Penman-Monteith values steady (and in turn correction coefficients) from historical to future conditions.
It is the authors conclusion given the high levels of uncertainty (Wang et al., 2015) and the variability associated with future projections and interpolated climate datasets in general, that these results can provide meaningful inputs and useful insights regarding both trends and magnitude of change, but of course, should be used keeping in mind this uncertainty.
Usage notes
The geospatial datasets are provided online in GeoTIFF (.tif) format, in geographic coordinates; datum and spheroid are WGS84; spatial units are decimal degrees. The spatial resolution is 30 arc-seconds or 0.008333 degrees (approximately 1 km2 at the equator). The PET values are defined as total mm of PET per month or per year. The Aridity Index values are unitless.
Although considered sufficient for use within many modeling and other scientific efforts, we highlight the earlier caveats showing the variability associated with both the input data and accuracy of the estimation algorithm when applied globally. As stated, local or even regional estimates may have high variability associated with steep elevation gradients and heterogenous terrain, and/or low levels of accuracy at the grid cell level due to interpolation of scattered or less dense weather station data, with significant potential for error associated with both the global input data (Navarro et al., 2024) and the application of the Hargreaves methodology (Wang et al., 2015) when implemented globally across a wide spectrum of environmental, geophysical, and bioclimatic conditions. As such, while useful for identifying and determining change, we urge caution in use of these datasets. Likewise, the aridity index, and the Hargreaves equation, are geared toward ascertaining moisture available for crop or other plant growth, and as such may not be designed for biomes and bioclimates beyond the reasonable temperature limits of seasonal agriculture. Aridity Index provides estimate on annual temporal scale, while other methods (e.g. SPEI, PSDI) can be further implemented using these PET and WorldClim datasets to derive other specific agrometeorological drought indicators at monthly and seasonal scale (Tegos et al., 2023; Vicente-Serrano et al., 2010). Some very high values of Aridity Index, primarily found in the highest latitudes and arctic regions, although remaining in the dataset, are considered uninterpretable.
Ethics and consent
Ethical approval and consent were not required.
Data availability
The Future_Global_AI_PET data layers have been processed and finalized for distribution online as GEO-TIFFs. These datasets have been zipped (.zip) into monthly series or their respective annual layers, by each combination of climate model and SSP scenario.
The Future_Global_AI_PET Database is archived and available online from the Science Data Bank (ScienceDB, at https://doi.org/10.57760/sciencedb.nbsdc.00086 (Zomer & Trabucco, 2024).
The “Future_Global_AI_PET Database” provides a set of high-resolution (30 arc-seconds) global raster datasets of average monthly and annual potential evapotransipation (PET) and annual aridity index (AI) for two historical (1960–1990; 1970–2000) and two future (2021–2040; 2041–2060) time periods for each of 25 CMIP6 Earth System Models across four emission scenarios (SSP: 126, 245, 370, 585). The database also includes three averaged multi-model ensembles produced for each of these four emission scenarios. There are a total of 389 files online, including a detailed Readme file, comprising 389 GB of data.
The Future_Global_AI_PET data layers have been processed and finalized for distribution online as GEO-TIFFs. These datasets have been zipped (.zip) into monthly series or their respective annual layers, by each combination of climate model and SSP scenario. The Future_Global_AI_PET Database is archived and available online from the Science Data Bank (ScienceDB), at https://doi.org/10.57760/sciencedb.nbsdc.00086 (Zomer & Trabucco, 2024).
Supplementary tables and figures are available online on the Figshare Data Repository as “Extended Data: CMIP6-Based Global Estimates of Future Aridity Index and Potential Evapotranspiration for 2021–2060” at https://doi.org/10.6084/m9.figshare.26095363 (Zomer et al., 2024). These are available under a CC-BY 4.0 license in one file (Global Future AI_PET - SM_Tables v1) containing supplementary tables and a figure including:
Global Mean Annual Climatic Parameters for All Included CMIP_6 ESM
Mean Annual Climatic Parameters for all Multi-model Ensembles by Region
Coefficient of Variation for all Multi-model Ensembles by Region
Map of Global Regions used in the Regional Analysis
Author contributions
Research design: R.Z.; A.T.; Equation development: A.T.; R.Z.; AML Programming: A.T.; Python programming: R.Z.; Statistical analysis: R.Z., J.X., A.T.; Writing: R.Z., J.X., A.T. DS; Tables and Figures: R.Z.; Financial Support: R.Z., A.T.; J.X.; D.S.
Acknowledgements
Research supported by the European Union's Horizon 2020 Research and Innovation Programme (Grant No. 101003881 NEXOGENESIS) and the National Recovery and Resilience Plan of Italian Ministry of University and Research funded by NextGenerationEU (Grant No. CN_00000033 NBFC). We would like to acknowledge the CMCC Foundation, the University of Sassari, the Center for Mountain Futures, Kunming Institute of Botany, and the Chinese Academy of Sciences Presidential Fellowship program for hosting, supporting, and facilitating this effort. We would very much thank and acknowledge the Science DataBank(ScienceDB) for hosting, archiving, and providing access to the Future_Global_PET_AI Database. We acknowledge and thank the World Climate Research Programme, which, through its Working Group on Coupled Modelling, coordinated and promoted CMIP6. We thank the climate modeling groups for producing and making available their model output, the Earth System Grid Federation (ESGF) for archiving the data and providing access, and the multiple funding agencies who support CMIP6 and ESGF. We also express our gratitude to Robert Hijmans and WorldClim.org for providing the high resolution downscaled CMIP6 Future Projections. Many thanks to Ed Grumbine for proof-reading.
Faculty Opinions recommendedReferences
- Allen RG, Pereira LS, Raes D, et al.:
Crop evapotranspiration —guidelines for computing crop water requirements. FAO irrigation and drainage paper 56. Food and Agriculture Organization, Rome, 1998. Reference Source
- Anwar SA, Mamadou O, Diallo I, et al.:
On the influence of vegetation cover changes and vegetation-runoff systems on the simulated summer potential evapotranspiration of tropical Africa using RegCM4.
Earth Syst Environ.
2021; 5: 883–897. Publisher Full Text
- Arora VK:
The use of the aridity index to assess climate change effect on annual runoff.
J Hydrol.
2002; 265(1–4): 164–177. Publisher Full Text
- Aschonitis VG, Papamichail D, Demertzi K, et al.:
High-resolution global grids of revised Priestley-Taylor and Hargreaves-Samani coefficients for assessing ASCE-standardized reference crop evapotranspiration and solar radiation.
Earth Syst Sci Data.
2017; 9: 615–638. Publisher Full Text
- Basarin B, Lukić T, Matzarakis A:
Review of biometeorology of heatwaves and warm extremes in Europe.
Atmosphere.
2020; 11(12): 1276. Publisher Full Text
- Bobrowski M, Weidinger J, Schickhoff U:
Is new always better? Frontiers in global climate datasets for modeling treeline species in the Himalayas.
Atmosphere.
2021; 12(5): 543. Publisher Full Text
- Choisnel E, Villele O de, Lacroze F:
Une approche uniformisee du calcul de l’evapotranspiration potentialle pour l’ensemble des pays de la communaute europeenne. Centre commun de Recherche, Commission des communautes europeennes. L 2920. Luxembourg, 1992. Reference Source
- Derdous O, Tachi SE, Bouguerra H:
Spatial distribution and evaluation of aridity indices in northern Algeria.
Arid Land Res Manag.
2020; 35(1): 1–14. Publisher Full Text
- Doorebos J, Pruitt WO:
Guidelines for predicting crop water requirements.
Irrigation and Drainage Paper 24
, Food and Agriculture Organization of the United Nations (FAO). Rome, Italy, 1977. Reference Source
- Droogers P, Allen RG:
Estimating reference evapotranspiration under inaccurate data conditions.
Irrigation Drainage Syst.
2002; 16: 33–45. Publisher Full Text
- Eyring V, Bony S, Meehl GA, et al.:
Overview of the Coupled Model Intercomparison Project phase 6 (CMIP6) experimental design and organization.
Geosci Model Dev.
2016; 9(5): 1937–1958. Publisher Full Text
- FAO and (SDRN), E. and NRS: World-wide agroclimatic data of FAO (FAOCLIM). Version 2, UN Food and Agriculture Organization (FAO, Rome). 2001. Reference Source
- Fick SE, Hijmans RJ:
WorldClim 2: new 1- km spatial resolution climate surfaces for global land areas.
Int J Climatol.
2017; 37(12): 4302–4315. Publisher Full Text
- Forster PM, Smith CJ, Walsh T, et al.:
Indicators of global climate change 2022: annual update of large-scale indicators of the state of the climate system and the human influence.
Earth Syst Sci Data.
2023; 15(6): 2295–2327. Publisher Full Text
- Girvetz EH, Zganjar C:
Dissecting indices of aridity for assessing the impacts of global climate change.
Clim Change.
2014; 126: 469–483. Publisher Full Text
- Gordon LJ, Steffen W, Jönsson BF, et al.:
Human modification of global water vapor flows from the land surface.
Proc Natl Acad Sci U S A.
2005; 102(21): 7612–7617. PubMed Abstract
| Publisher Full Text
| Free Full Text
- Greve P, Roderick ML, Ukkola AM, et al.:
The Aridity Index under global warming.
Environ Res Lett.
2019; 14(12): 124006. Publisher Full Text
- Hadria R, Benabdelouhab T, Lionboui H, et al.:
Comparative assessment of different reference evapotranspiration models towards a fit calibration for arid and semi-arid areas.
J Arid Environ.
2021; 184: 104318. PubMed Abstract
| Publisher Full Text
| Free Full Text
- Hansen JE, Sato M, Simons L, et al.:
Global warming in the pipeline.
Oxf Open Clim Chang.
2023; 3(1): kgad008. Publisher Full Text
- Hargreaves GH:
Defining and using reference evapotranspiration.
J Irrig Drain Eng.
1994a; 120(6): 1132–1139. Publisher Full Text
- Hargreaves GH:
Defining and using reference evapotranspiration.
J Irrig Drain Eng.
ASCE, 1994b; 120(6): 1132–1139. Publisher Full Text
- Hargreaves GL, Hargreaves GH, Riley JP:
Irrigation water requirements for Senegal River Basin.
J Irrig Drain Eng.
1985; 111(3): 265–275. Publisher Full Text
- Hargreaves GH, Samani ZA:
Reference crop evapotranspiration from temperature.
Appl Eng Agric.
1985; 1(2): 96–99. Publisher Full Text
- Harris I, Osborn TJ, Jones P, et al.:
Version 4 of the CRU TS monthly high-resolution gridded multivariate climate dataset.
Sci Data.
2020; 7(1): 109. PubMed Abstract
| Publisher Full Text
| Free Full Text
- Hijmans RJ, Cameron SE, Parra JL:
Very high resolution interpolated climate surfaces for global land areas.
Int J Climatol.
2005; 25(15): 1965–1978. PubMed Abstract
| Publisher Full Text
| Free Full Text
- Holland HD:
The ocean-atmosphere system: the chemistry of the atmosphere and oceans. Wiley-Interscience. New York, 1978; 352.
- IPCC: Summary for policymakers. In: Climate Change and Land: an IPCC special report on climate change, desertification, land degradation, sustainable land management, food security, and greenhouse gas fluxes in terrestrial ecosystems. 2019. Reference Source
- IPCC: Summary for Policymakers. In: Climate Change 2021: The Physical Science Basis. Contribution of Working Group I to the Sixth Assessment Report of the Intergovernmental Panel on Climate Change, edited by Masson-Delmotte, V., Zhai, P., Pirani, A., Connors, S. L., Péan, C., Berger, S., Caud, N., Chen, Y., Goldfarb, L., Gomis, M. I., Huang, M., Leitzell, K., Lonnoy, E., Matthews, J. B. R., Maycock, T. K., Waterfield, T., Yelekçi, O., Yu R., and Zhou, B., 2021. Publisher Full Text
- IPCC: Climate change 2022: mitigation of climate change - working group III contribution to the WGIII sixth assessment report of the intergovernmental panel on climate change. 2022. Reference Source
- Itenfisu D, Elliott RL, Allen RG, et al.:
Comparison of reference evapotranspiration calculations as part of the ASCE standardization effort.
J Irrig Drain Eng.
2003; 129(6): 440–448. Publisher Full Text
- Jensen DT, Hargreaves GH, Temesgen B, et al.:
Computation of ETo under nonideal conditions.
J Irrig Drain Eng.
1997; 123(5): 394–400. Publisher Full Text
- Jensen ME, Allen RG, (eds.):
Evaporation, evapotranspiration, and irrigation water requirements: task committee on revision of manual 70, second edition. edited by Jensen, M. E. and Allen, R. G., American Society of Civil Engineers (ASCE). 2016. Publisher Full Text
- Muñoz G, Greiser J:
CLIMWAT 2.0 for CROPWAT. FAO - Water Resources, Development and Management Service and the Environment and Natural Resources Service, 2006. Reference Source
- Nastos PT, Politi N, Kapsomenakis J, et al.:
Spatial and temporal variability of the Aridity Index in Greece.
Atmos Res.
2013; 119: 140–152. Publisher Full Text
- Navarro A, Lee G, Martín R, et al.:
Uncertainties in measuring precipitation hinders precise evaluation of loss of diversity in biomes and ecotones.
npj Clim Atmos Sci.
2024; 7: 35. Publisher Full Text
- Pandey PK, Nyori T, Pandey V:
Estimation of reference evapotranspiration using data driven techniques under limited data conditions.
Model Earth Syst Environ.
2017; 3: 1449–1461. Publisher Full Text
- Pimentel R, Arheimer B, Crochemore L, et al.:
Which potential evapotranspiration formula to use in hydrological modeling world-wide?
Water Resour Res.
2023; 59(5): e2022WR033447. Publisher Full Text
- Richards M:
PyETo.
Github.
2015. Reference Source
- Srdić S, Srđević Z, Stričević R, et al.:
Assessment of empirical methods for estimating reference evapotranspiration in different climatic zones of Bosnia and Herzegovina.
Water.
2023; 15(17): 3065. Publisher Full Text
- Sutapa IW, Saparuddin, Wicana S:
Sensitivity of methods for estimating potential evapotranspiration to climate change.
Iop Conf Ser Earth Environ Sci.
2020; 437: 012039. Publisher Full Text
- Tegos A, Malamos N, Efstratiadis A, et al.:
Parametric modelling of potential evapotranspiration: a global survey.
Water.
2017; 9: 795. Publisher Full Text
- Tegos A, Stefanidis S, Cody J, et al.:
On the sensitivity of standardized-precipitation-evapotranspiration and aridity indexes using alternative potential evapotranspiration models.
Hydrology.
2023; 10(3): 64. Publisher Full Text
- Thornthwaite CW:
An approach toward a rational classification of climate.
Geogr Rev.
1948; 38: 55–94. Publisher Full Text
- Trabucco A, Zomer RJ:
Global Aridity Index and PET database v1 (Global_AI_PET_v1). 2008. Reference Source
- Trabucco A, Zomer RJ:
Global Aridity Index and Potential Evapotranspiration (ET0) climate database v2 (Global_AI_PET_v2). 2019. Publisher Full Text
- Trabucco A, Zomer RJ, Bossio DA, et al.:
Climate change mitigation through afforestation/reforestation: a global analysis of hydrologic impacts with four case studies.
Agric Ecosyst Environ.
2008; 126(1–2): 81–97. Publisher Full Text
- UNEP: World atlas of desertification. Second Edition, edited by: Middleton, Nick, Thomas, and David, United Nations Environment Program, 1997; 182. Reference Source
- Valipour M, Bateni SM, Sefidkouhi MAG, et al.:
Complexity of forces driving trend of reference evapotranspiration and signals of climate change.
Atmosphere.
2020; 11(10): 1081. Publisher Full Text
- Vicente-Serrano SM, Beguería S, López-Moreno JI:
A multiscalar drought index sensitive to global warming: the standardized precipitation evapotranspiration index.
J Clim.
2010; 23: 1696–1718. Publisher Full Text
- Walter IA, Allen RG, Elliott R, et al.:
ASCE's standardized reference evapotranspiration equation.
Watershed Management and Operations Management 2000.
2001; 1–11. Publisher Full Text
- Wang W, Xing W, Shao Q:
How large are uncertainties in future projection of reference evapotranspiration through different approaches?
J Hydrol.
2015; 524: 696–700. Publisher Full Text
- Wang X, Li Y, Wang Y, et al.:
Performance of HYDRUS-1D for simulating water movement in water-repellent soils.
Can J Soil Sci.
2018; 98(3): 407–420. Publisher Full Text
- Zhou J, Jiang T, Wang Y, et al.:
Spatiotemporal variations of aridity index over the belt and road region under the 1.5°C and 2.0°C warming scenarios.
J Geogr Sci.
2020; 30: 37–52. Publisher Full Text
- Zomer R, Trabucco A, Straaten OV:
Carbon, land and water: a global analysis of the hydrologic dimensions of climate change mitigation through afforestation/reforestation. 2006. Publisher Full Text
- Zomer RJ, Trabucco A, Bossio D, et al.:
Climate change mitigation: a spatial analysis of global land suitability for clean development mechanism afforestation and reforestation.
Agric Ecosyst Environ.
2008; 126(1–2): 67–80. Publisher Full Text
- Zomer RJ, Trabucco A:
Future global Aridity Index and PET database (CIMP_ 6). Science Data Bank. 2024. http://www.doi.org/10.57760/sciencedb.nbsdc.00086
- Zomer RJ, Xu J, Spano D, et al.:
Extended Data: CMIP6-based global estimates of future aridity index and potential evapotranspiration for 2021–2060. figshare. Journal contribution. 2024.
http://www.doi.org/10.6084/m9.figshare.26095363.v1
- Zomer RJ, Xu J, Trabucco A:
Version 3 of the global Aridity Index and potential evapotranspiration database.
Sci Data.
Dataset, 2022; 9(1): 409. PubMed Abstract
| Publisher Full Text
| Free Full Text
- Zotarelli L, Dukes MD, Romero CC, et al.:
Step by step calculation of the penman-monteith evapotranspiration (FAO-56 Method). University of Florida / IFAS Extension, 2018. Reference Source








