1 Introduction
A lithium battery bursting into flames is probably the first image one has in mind when thinking of battery safety1,2. Such thermal runaway is not limited to Li-ion cells, but can of course take place in other chemistries, such as Ni-Cd or lead acid batteries, too3. While fire and explosion are the most obvious consequences, invisible toxic gases such as CO, NO, HF, SO2 and HCl for Li-ion cells, or HS, arsine and stibine for lead acid batteries, might also be released3.
High-temperature batteries, which operate above 100 °C by definition4, are only partly susceptible to thermal runaway. A failure in the solid electrolyte of ZEBRA5,6 or Na-S cells7 will lead to short-circuit and mixing of the anodei and cathode compartments. Luckily, this is safe for ZEBRA batteries, as the reaction of Na (anode) with the catholyte (NaAlCl4) leads to the formation of solid aluminium, cell freezing and a low-impedance permanent short-circuit8–13. However, shorting a Na-S cell will lead to the formation of strongly corrosive sodium polysulphides and fast temperature increase, which can easily destroy the cell housing or seal. Much work in the past has therefore been invested to design Na-S cells inherently safe to prevent propagation of one cell’s failure to others14,15.
While safety analysis has been performed for all battery chemistries mentioned above, to our best knowledge no risk assessment has been published for Liquid Metal Batteries (LMBs)16. Such cells employ a molten salt electrolyte, which has motivated much fluid dynamic research with the idea in mind that strong flow could easily short-circuit thin electrolyte layers17,18. Short-circuits have repeatedly been observed in LMB experiments19–25 leading even to salt evaporation20. It is therefore the aim of this work to perform a thorough risk assessment of a liquid metal battery using the example of a Na-Zn cell operating at 600 °C26–28.
With regards to risk assessments, safety standards are very important as they provide guidance to identify and avoid possible risks. Of course, they depend on the country and many different standards exist. In our opinion the following are most relevant for designing safe batteries (see also Table 13):
UL 9540 provides safety requirements as well as safety tests for complete energy storage systems – including thermal, mechanical and chemical storage29
IEC 62984-2 describes safety rules as well as safety tests specifically for high-temperature batteries from an electrotechnical perspective30
UL 1973 is the safety standard for stationary batteries – including rules for construction, battery design, software, communication systems, fire protection as well as safety tests including abuse31
UL 9540A provides tests for thermal runaway of battery energy storage systems – from cell to module to unit – including extreme abuse32
While the standards UL 9540, IEC 62984-2 and UL 1973 must be met by any high-temperature stationary energy storage systems, the UL 9540A thermal runaway certification is harder to achieve. ZEBRA batteries sold by FZSoNick and Na-S cells from NGK comply with the latter, while Li-ion batteries usually do not33. This additional certification is the reason that ZEBRA batteries are especially popular in applications for which fire safety is critical.
2 Methods
This risk assessment follows the method defined by ISO 12100 and ISO/TR 14121-234,35. Where applicable, the following standards and regulations are considered:
ISO standards (International Organisation for Standardisation)
EN standards (European Standards)
IEC standards (International Electrotechnical Commission)
UL standards (Underwriters Laboratories)
IEEE standards (Institute of Electrical and Electronics Engineers)
Directives of the European Parliament and of the Council
As illustrated in Figure 1, the risk assessment starts with a hazard identification. Using a bottom-up approach, i.e. considering all possible ways that something can go wrong, and following the systematic methodology suggested in ISO 1210034, possible hazards are identified and listed in an Excel spreadsheet.
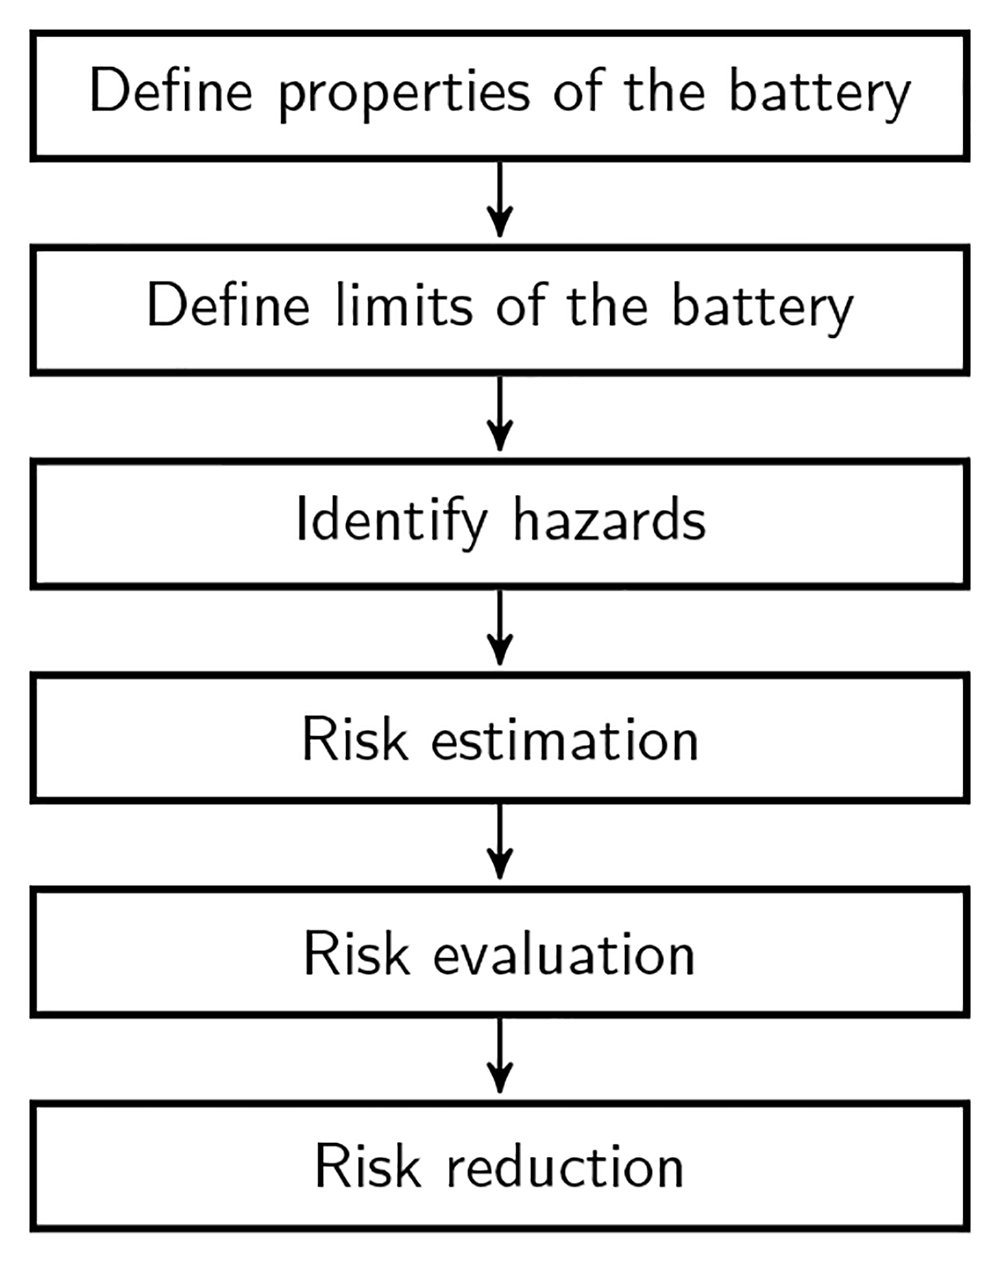
Figure 1. Steps of the risk assessment.
The associated risk is estimated using a numerical approach by evaluating the severity score (SS), which describes the severity and extent of harm, and the probability score (PS) which accounts for the duration and frequency of harm, the probability of an event occurring and the possibility of avoiding it35. The sum of both gives the risk score (RS) – for the definitions, see Table 1.
Table 1. Definitions for risk estimation, following ISO/TR 14121-235.
| severity score (SS) | probability score (PS) | risk score (RS = SS + PS) |
|---|
| % | definition | % | definition | % | definition |
|---|
| SS ≤ 29 | minor | PS ≤ 29 | remote | RS ≤ 89 | negligible |
| 30 ≤ SS ≤ 89 | moderate | 30 ≤ PS ≤ 69 | unlikely | 90 ≤ RS ≤ 119 | low |
| 90 ≤ SS ≤ 99 | serious | 70 ≤ PS ≤ 99 | likely | 120 ≤ RS ≤ 159 | medium |
| SS = 100 | catastrophic | PS = 100 | very likely | RS ≥ 160 | high |
After evaluating each individual risk, suitable risk reduction methods are identified34,35. Generally, inherently safe designs are always preferred. Only if this is not possible, safeguarding measures are suggested, or if unfeasible, information for safe use is provided. The Excel table containing the overview of the risk assessment can be found in Section 6.2; the details are discussed in the following.
3 Scope of the study
The life of a battery involves many phases, starting from mining of the raw materials and ending with recycling – as illustrated in Figure 2. Considering that – with the exception of AMBRIii – LMBs are not commercially available, but were mostly investigated in the laboratory, we limit the risk assessment to the use phase of experimental batteries. The cells are typically assembled in a glovebox and operated in a simple laboratory furnace.
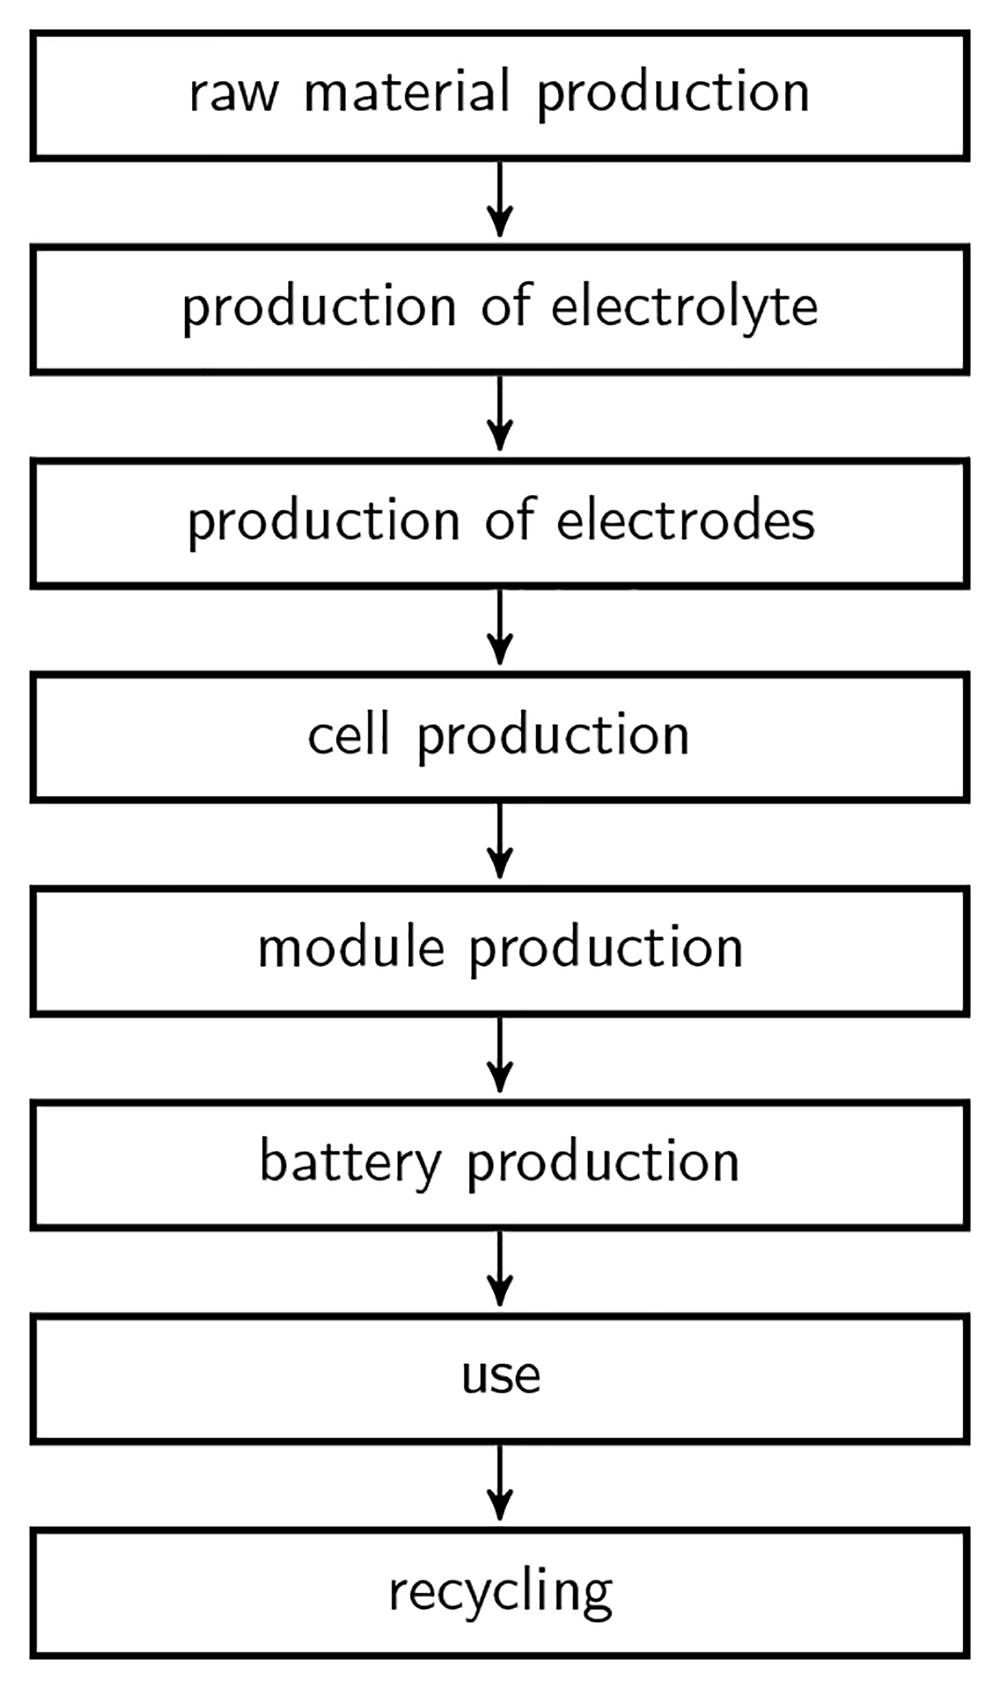
Figure 2. Phases of life of a battery.
3.1 Battery design and operation
Figure 3 shows the cell assembly, Table 2 describes the single parts28 and Section 6 provides all details of the cell design. The housing is made of welded standard components, and is closed using a CF40 vacuum flange with Cu sealing. A tube in the lid allows connecting a pressure sensor and introducing thermocouples into the cell. Current is supplied via two feedthroughs, which are connected via barrel connectors to the Mo (or W) current collectors. The active material is contained in an alumina crucible, with a ceramic sheath insulating anode and cathode. The molten salt consists usually of CaCl2-NaCl, but BaCl2, KCl, LiCl and SrCl2 might be added, too, in order to improve the electrolyte’s properties. In order to reduce self-discharge, it is split into an upper and lower compartment using a porous diaphragm, which is hold in place by a thin alumina cylinder. The cell is filled in discharged state with Zn metal and CaCl2-NaCl, which reacts according to the equation
to Na metal and ZnCl2 at charge.
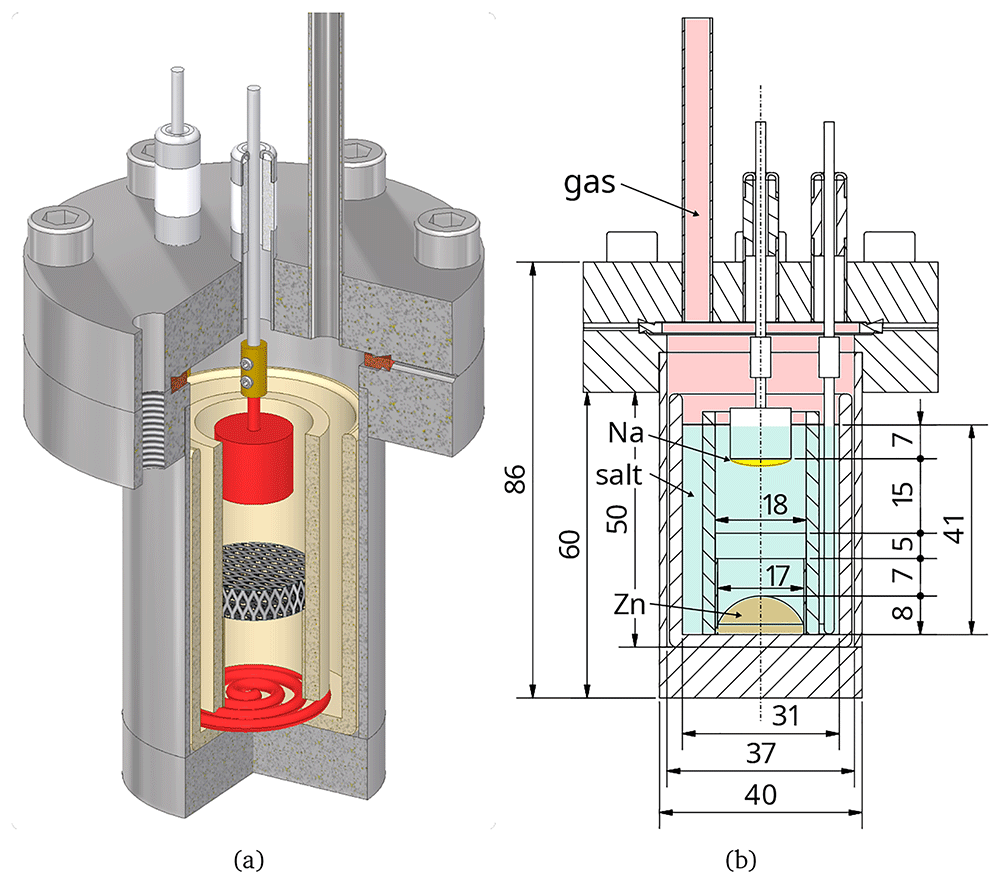
Figure 3. Cell design and main dimensions28.
Table 2. Parts of the ALB and their properties28.
Densities are given for room temperature, and heat capacities for 600 °C.
| part | quantity | specification | density | mass | cp | comment |
|---|
| g/cm3 | g | J/(kg K) |
|---|
| housing | 1 | 1.4306 (X2CrNi19-11) | 7.939 | 320 | 60039 | values for 1.4301 |
| lid | 1 | 1.4306 (X2CrNi19-11) | 7.939 | 335 | 60039 | values for 1.4301 |
| screws | 6 | 1.4980 | 7.939 | 7 | 60039 | values for 1.4301 |
| tube | 1 | 1.4306 (X2CrNi19-11) | 7.939 | 19 | 60039 | values for 1.4301 |
| bottom plate | 1 | 1.4306 (X2CrNi19-11) | 7.939 | 107 | 60039 | values for 1.4301 |
| sealing ring | 1 | Cu | 9.040 | 11 | 43841 | |
| diaphragm | 1 | alumina foam | 3.842 | 1 | 120043 | porosity 0.944 |
| crucible | 1 | Al2O3 > 99.5 % | 3.842 | 59 | 120043 | |
| sleeve | 1 | Al2O3 > 99.5 % | 3.842 | 28 | 120043 | |
| diaphragm support | 1 | Al2O3 > 99.5 % | 3.842 | 2 | 120043 | |
| barrel connector | 2 | Mo | 10.240 | 2 | 29041 | |
| screws barrel connector | 4 | A4 (1.4401) | 7.939 | 0.1 | 60039 | values for 1.4301 |
| anode current collector | 1 | Mo | 10.240 | 12 | 29041 | |
| cathode current collector | 1 | Mo | 10.240 | 5 | 29041 | |
| Zn | | Zn | 6.445 | 25 | 48146 | |
| salt (CaCl2:NaCl) | | 44:56 mol%
60:40 wt% | 1.947 | 32 | 86441 | weighted by mass
σ = 1.38 S/cm47 |
| feedthrough (2 pieces) | | | | | | |
| ceramic ring | 1 | alumina | 3.842 | 2 | 120043 | |
| lower collar | 1 | Invar 42, 1.3917 | 8.148 | 1 | 68941 | cp weighted by mass |
| upper collar | 1 | Invar 42, 1.3917 | 8.148 | 1 | 68941 | cp weighted by mass |
| wire | 1 | Invar 42, 1.3917 | 8.148 | 1 | 68941 | cp weighted by mass |
| braze 1 | 1 | Ni | - | 0.1 | 53541 | |
| braze 2 | 1 | Au | - | 0.4 | 14141 | |
| sum/mean | | | | 1013 | 653 | cp weighted by mass |
3.2 Operational limits
The cell needs to be operated within certain limits, which are summarised in Table 3 and are explained in the following.
Table 3. Operation parameters and limits of a Na-Zn LMB based on the Zn and salt amounts given in Table 2.
The values are mostly estimates, based on the experience of the authors.
| property | unit | typical
value | min | max | comment |
|---|
| Temperature | °C | 600 | 550 | 600 | |
| OCV | V | 1.6-1.7 | 1.2 | 1.8 | depends on exact salt |
| Current density | mA/cm2 | 100 | 0 | 350 | |
| Cell current | A | 0.25 | 0 | 1 | |
| Overall efficiency | % | 75 | 60 | 90 | estimated |
| Depth of discharge | % | | | 45 | until salt solidifies |
| Capacity | Ah | 0.5 | | | depends on catholyte volume |
| Discharge rate | | C/2 | C/16 | 1C | |
| Energy content | Wh | 0.9 | | | |
Temperature: the minimum temperature is defined by solidification of the salt; the maximum temperature by the stability of the feedthroughs.
Open-circuit potential (OCV): Discharged cells in experiments typically exhibit 1.2 V, while the maximum predicted cell potential is 1.8 V when using the standard potentials from Hamer et al.36 and Temkin’s model for the ZnCl2 concentration in the molten salt37,38. Experimentally observed OCVs are typically in the range 1.6–1.7 V.
Depth of discharge (DoD): the depth of discharge can be calculated from the phase diagram, shown in Figure 4. The enrichment in CaCl2 upon charging arises because two moles of NaCl are required to produce one mole of ZnCl2. Assuming that all of the NaCl in the discharged cell (salt composition 44:56 mol% CaCl2-NaCl) reacts to form ZnCl2, a composition of 61:39 mol% CaCl2-ZnCl2 would result (0.5 * 56/(0.5 * 56 + 44) mol% ZnCl2). At an operating temperature of 600 °C, the solidus line is encountered at a salt composition of 50:35:15 mol% CaCl2-NaCl-ZnCl2. As two moles of NaCl react to one mole of ZnCl2 during discharge, the total amount of substance does not stay constant, when following the discharge line in the phase diagram. Assuming that the cell is filled with 100 mol salt, 44 mol thereof being CaCl2, 44/50 = 88 mol of salt will remain upon solidification. This results in 0.35 · 88 = 31 mol NaCl left, or 31/56 = 55 mol% left and therefore in a DoD of 45 %.
Operation potential window: at potentials above 2.5 V the cathode current collector could corrode, and at potentials below -0.6 V the anode current collector, see Table 16.
Energy density: the charge released when producing one mole of Zn is Q = 2F = 53.6 Ah because two electrons are involved in the reaction. The cell voltage is assumed to be 1.8 V as this is the maximum possible value. The mass necessary to produce one mole of Zn is given by molar masses of Na and ZnCl2 as m = 2·23 g + 136.3 g = 182.3 g. The theoretical energy density is then w = Q · U/m = 529 Wh/kg.
Capacity: capacity is computed such that all NaCl is consumed until solidification (see DoD) and that only the volume below the diaphragm and within the diaphragm support is taken – see Figure 3. This gives 2.65 cm3.
Current density: the typical current density is calculated such that it allows for operating at a voltage efficiency of 75 % – for the salt conductivity, see Table 2. The Zn surface area is used to compute the current density.
Operators: the cell is only operated by trained and skilled persons.
Mode of operation: the operation can be divided into heat-up, open circuit, charge, discharge and cool-down, further maintenance (putting cell in furnace, taking it out, connecting it), malfunctions (short-circuit, failure of housing, potentiostat failure, heating system failure) and misuse (short-circuit, overcharge, ...).
Environment: the cell will be operated indoors at normal air humidity, without exposure to water. The temperature of the surrounding laboratory environment will remain between 0 and 40 °C.
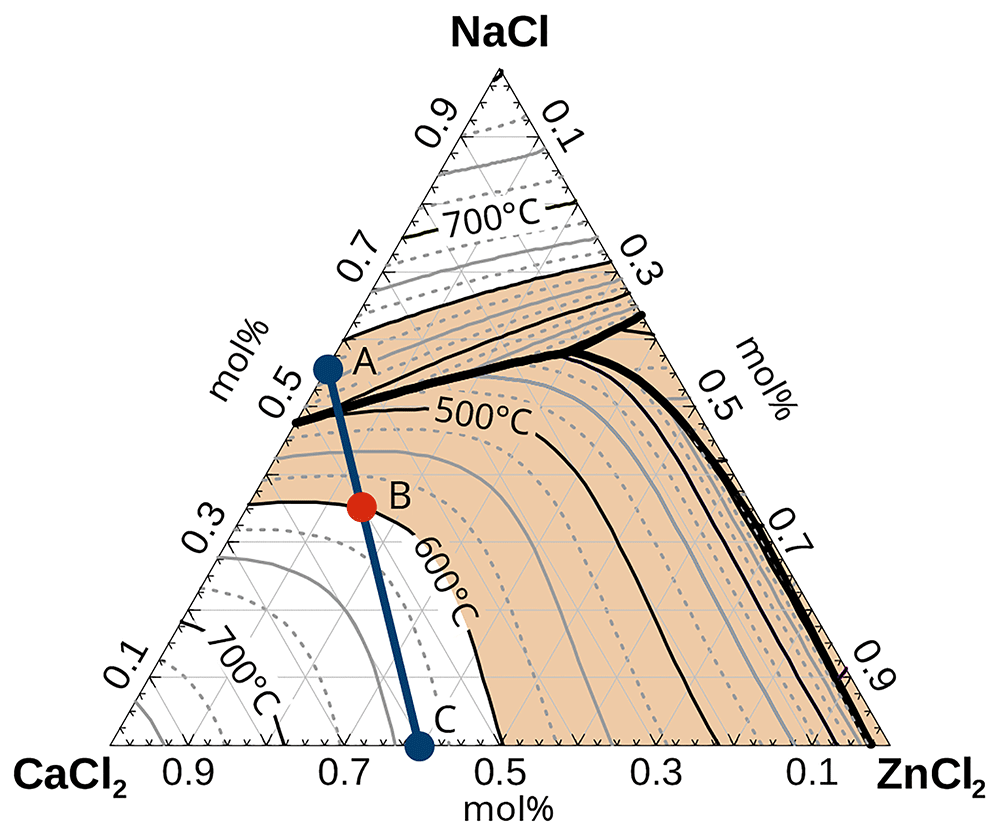
Figure 4. Phase diagram of CaCl2-NaCl-ZnCl2 and discharge line49.
The concentration at point A (discharged) is 44:56 mol% CaCl2:NaCl, at point B (solidification) 50:35:15 mol% CaCl2:NaCl:ZnCl2 and at C (fully charged) 61:39 CaCl2:ZnCl2. The shaded area shows the compositions where the electrolyte is liquid below 600 °C.
4 Results
4.1 Intrinsic material hazards
Na-Zn LMBs employ molten metals, various salts and ceramics which may, together with their corrosion products, present certain intrinsic material hazards. Table 4 gives an overview.
Table 4. Hazards of materials and corrosion products.
The numbers in the table specify the GHS hazard category61 and are taken from GESTIS50 and various material data sheets.
| irritating | corrosive | sensitisation | irritating | damage | respiratory sensitisation | skin contact | swallowed | inhaled | damage to organs | germ cell mutagenicity | carcinogen | reproductive toxicity | corrosive to metals | flammable solid | reacts with water | toxic to aquatic life (acute) | toxic to aquatic life (chronic) |
|---|
| skin | eye | toxic | CMR |
|---|
| Na | | 1B | | | | | | | | | | | | | | 1 | | |
| Zn | | | | | | | | | | | | | | | | | | |
| Ba | | 1B | | | 1 | | | 3 | | | | | | | 1 | 1 | | |
| Ca | | | | | | | | | | | | | | | | 2 | | |
| K | | 1B | | | 1 | | | | | | | | | | | 1 | | |
| Li | | 1B | | | 1 | | | | | | | | | | | 1 | | |
| Sr | 2 | | | | | | | | | | | | | | | 1 | | |
| BaCl2 | | | | 2 | | | | 3 | 4 | | | | | | | | | |
| CaCl2 | | | | 2 | | | | | | | | | | | | | | |
| KCl | | | | | | | | | | | | | | | | | | |
| LiCl | 2 | | | 2 | | | | 4 | | | | | (1A) | | | | | |
| NaCl | | | | | | | | | | | | | | | | | | |
| SrCl2 | | | | | 1 | | | | | | | | | | | | | |
| ZnCl2 | | 1B | | | | | | 4 | | | | | | | | | 1 | 1 |
| Na2O | | 1B | | | | | | | | | | | | | | | | |
| NaOH | | 1A | | 1 | | | | | | | | | | 1 | | | | |
| ZnO | | | | | | | | | | | | | | | | | 1 | 1 |
| Zn(OH)2 | | | | | | | | | | | | | | | | | 1 | 2 |
| AgCl | | | | | | | | | | | | | | 1 | | | 1 | 1 |
| AuCl3 | | 1B | 1 | | | | | | | | | | | | | | | |
| Cl2 | 2 | | | 2 | | | | | 2 | 3 | | | | | | | 1 | 1 |
| CrCl2 | 2 | | | 2 | | | | 4 | | 3 | | | | | | | | |
| CrCl3 | | | 1 | | | | | 4 | | | | | | 1 | | | | 2 |
| CuCl | 2 | | | | 1 | | 4 | 4 | | | | | | | | | 1 | 1 |
| CuCl2 | 2 | | | | 1 | | 4 | 4 | | | | | | 1 | | | 1 | 1 |
| FeCl2 | | 1B | | | 1 | | | 4 | | | | | | 1 | | | | |
| FeCl3 | 2 | | 1 | | 1 | | | 4 | | | | | | 1 | | | | |
| HCl | | 1A | | | 1 | | | | 3 | | | | | | | | | |
| MoCl3 | 2 | | | 2 | | | | | | 3 | | | | | | | | |
| MoCl5 | | 1B | | | | | | | | | | | | | | | | |
| NiCl2 | 2 | | 1 | | | 1 | | 3 | 3 | 1 | 2 | 1A | 1B | | | | 1 | 1 |
| WCl6 | | 1B | | | 1 | | | 4 | | | | | | | | | | |
| PH3 | | 1B | | | 1 | | | | 1 | | | | | | | | 1 | |
| fibres | | | | | | | | | | 1B | | | | | | | | |
4.1.1 Metals. While Zn metal is generally safe (although Zn vapour should not be inhaled), Na presents several risks. Cold metallic Na is corrosive to human tissue, and causes severe burns to the eyes, skin, lungs and the respiratory system50–52. Splashes in the eye are especially dangerous and can cause blindness51. Na droplets might burn even at 125 °C; thus a fire risk exists as soon as Na is in contact with air53,54. The speed at which a Na fire spreads depends crucially on its surface area, with the flames producing Na2O and Na2O2 of which 40 % end up as aerosols53. These oxides react gradually to form NaOH with air humidity and finally to Na2CO3 with carbon dioxide53. Na reacts directly with moisture, producing NaOH and hydrogen53. The latter may ignite spontaneously55, especially above 560 °C53. Air-hydrogen mixtures are flammable or explosive between 4 and 77 vol%3,50,56,57; however, with the necessary safety factors, often 1 or 2 vol% are mentioned as lower limits. Na fires can be extinguished by dry sand, cement or special metal-fire extinguishers; water and CO2 are very dangerous and must be avoided58.
Depending on the salt composition, other alkali or alkaline earth metals such as Ba, Ca, Li, K or Sr may be codeposited at the anode during charging. These should be treated in the same way as Na, as all of them may react to form appreciably corrosive oxides/hydroxides and hydrogen50. Special care is required when handling K as it reacts with air to form highly explosive peroxides50. The yellow crust on its surface can be detonated simply by cutting it with a knife59. Finally, Ba is highly toxic and its reaction products can even be absorbed through the skin50. Ba ions act as muscle stimulants and can cause death due to ventricular fibrillation59.
4.1.2 Molten salts. The hazard presented by the electrolyte depends strongly on its chemical composition:
BaCl2 is highly toxic and damages muscles, intestine and heart51. Its main exposure route is via the lungs50.
CaCl2 causes irritation of the skin and eyes, but is otherwise relatively safe50.
KCl is not considered a hazardous substance50.
LiCl is irritating for skin and eyes and toxic if swallowed50. Its reproductive toxicity is currently under discussion, with the classification cat. 1A proposed60.
NaCl is not considered a hazardous substance50.
SrCl2 is classified as eye damaging but otherwise comparably safe.
ZnCl2 causes strong irritation of the eyes, skin, and respiratory system, with aqueous solutions being corrosive. Exposure is possible via the skin or when swallowed, leading to damage to the intestine, kidneys and heart. ZnCl2 produces HCl when heated in air and is very toxic to aquatic life with long-lasting effects50,51.
4.1.3 Corrosion products. It is difficult to predict which exact corrosion products may appear. However, based on the components of the housing, the following should be considered:
active metals: NaOH, Na2O, Zn(OH)2 and ZnO might result from humidity
feedthrough: Au or Ag might dissolve in small amounts from the feedthrough braze
HCl and Cl2 gas may evolve due to hydrolysis or salt decomposition
sealing: Cu ions might be present
current collector: Mo or W reaction products might appear
housing: Fe, Cr and Ni reaction products may dissolve
Table 4 gives a selection of possible corrosion products. It is obvious that corrosion products pose rather greater hazards than the active materials. Many of them are corrosive and toxic, including to aqueous life, and some are even carcinogenic.
4.1.4 Ceramics. Binders and additives of ceramics are often AlPO4-based. The phosphorous can be reduced by certain alkali and earth alkaline metals to form metal phosphides. These may react with water to form highly toxic phosphine (PH3) gas, which is absorbed very fast in the lungs. Breathing such gas for 5 minutes at a concentration of 1000 ppm is lethal50,62,63. In certain cases, ceramic Al2O3 fibre material is used as a diaphragm. When entering the lungs, such fibres can cause cancer, with the probability being determined by the dose of exposure, dimensions of the fibres, and their biopersistence. Fibres with a diameter < 3 µm, a length > 5 µm and a length-to-diameter ratio of > 3:1 are considered carcinogenic64. Further, Al2O3 is considered very biopersistent, and therefore needs to be classified as carcinogenic cat. 1B50.
4.1.5 Recommendations. Battery safety can be increased significantly by avoiding BaCl2 and ceramics which contain AlPO4-based binders. When disassembling and cleaning cells, this work should only be performed in a fume hood while wearing gloves and eye protection. In case of accidents, the main exposure to toxic substances is probably via the lungs due to vapours, aerosols and possibly PH3. Further, hydrogen might be released. If it cannot be assured that the housing is hermetically sealed under all circumstances, the cells must be operated inside a fume hood to evacuate toxic or explosive gases3. Hydrogen traps need to be avoided3. Finally, a second crucible or absorption material around the cell might be useful to catch up spills65.
4.2 Electrical hazards
Typical electrical hazards include:
Short circuit: any fast discharge may lead to cell heating and pressure buildup, as explained in Section 4.5.5. Reasons for a short circuit might be abuse, a power outage, deposition of Na vapour on a feedthrough, internal self-discharge, Zn deposition or any other internal mutual metallic contact. Short circuits cannot be safely excluded.
Failure of pressure sensor: if used to monitor battery safety, the system should shut off if the pressure sensor fails.
Failure of heating system: if a thermocouple or heat controller breaks, the heating system must switch off. Thermocouples need to be fixed safely such that they cannot be removed accidentally. If necessary, a second heat controller for safety shutdown might be installed.
Overcharge or -discharge: too high or too low cell potentials may lead to current collector corrosion and salt decomposition. The latter may increase the internal pressure considerably, as explained in Section 4.5.4 and must absolutely be avoided. The corrosion potentials for various current collector materials are given in Table 16, the decomposition potentials of the salts in Table 14.
4.3 Thermal hazards
Thermal hazards include mainly
overheating, which might be caused by broken or removed thermocouples or failure of heat control
external fire, leading to overpressure and air corrosion as explained in Section 4.5.1 and Section 4.6.1
skin burns, which may happen if parts with a temperature above 55–65 °C are touched, as shown in Figure 5
4.4 Humidity and salt drying
Humidity is problematic because it may increase cell pressure and induce corrosion. Most salts are appreciably hygroscopic; the latter being defined as the ability of a material to take up water from the environment by adsorption, absorption or capillary action67,68. Effective procedures from drying salts are described in the foregoing. Good reviews on general approaches to salt drying are also available69,70.
The most typical reactions of water with chloride salts are the formation of69
hydrates, e.g. CaCl2 + H2O ⟶ CaCl2 · H2O,
hydroxides due to hydrolysis, e.g. ZnCl2 + 2 H2O ⟶ Zn(OH)2 + 2 HCl,
oxides due to hydrolysis, e.g. ZnCl2 + H2O ⟶ ZnO + 2 HCl and
hydroxides from oxides, e.g. CaO + H2O ⟶ Ca(OH)2,
which can lead to the formation of hydrogen and contamination of the melt with corrosive O2–, OH–, Cl– or H+ ions. The simplest approach to purifying salts is heating under vacuum. While slightly hydrated salts such as KCl and NaCl can easily be vacuum dried without precautions, care must be taken with others because of hydrolysis reactions71. Suitable drying temperatures are best obtained from thermogravimetric analysis (TGA) experiments, salt-water phase diagrams or other suitable literature. Salts which undergo hydrolysis should first be dried in vacuum at low temperature before rising it slowly69,70. In order to speed up the process regular purging with inert gas is recommended71,72. The achievable vacuum pressure is a measure of the success of the drying procedure.
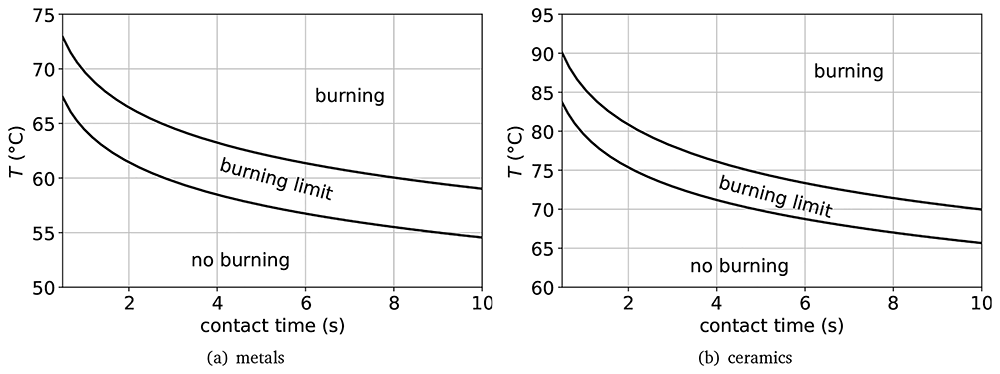
Figure 5.
Burn threshold of metals (a) and ceramics (b)66.
Salts for which hydrolysis cannot be avoided need to be melted under HCl, and HCl or Cl2 should be bubbled through this melt to remove oxides/hydroxides70,71. This approach does not eliminate the need for vacuum drying. Alternatively, sublimation or distillation may be used although they are rather costly70.
Barium chloride is hygroscopic and is stable as a dihydrate in contact with air50,59,73–76. The water-BaCl2 phase diagram77 predicts di-hydrate decomposition at 102 °C77–79, mono-hydrate decomposition at 145 °C77 and hemi-hydrate decomposition at 167 °C77,78 at ambient pressure; at 0.1 mbar it can even be fully dried at room temperature. TGA experiments show water loss between 60 and 150 °C; heating to 160 °C is claimed to be sufficient for drying80. The dehydration-rehydration process is claimed to be fully reversible81, but information on hydrolysis is limited82–84. At least above 900 °C, hydrolysis has been demonstrated experimentally83,85 and is also predicted by HSC41.
Calcium chloride is very hygroscopic50,59,74; its phase diagram has been investigated several times86–91. CaCl2 can exist as 1/3, mono-, di-, tetra- and hexahydrate50,92–95. Smith et al. give an excellent overview on drying CaCl296. At ambient pressure, CaCl2-hexahydrate reacts to tetra-, di- and anhydrate and liquid water at 3097, 45 and 175 °C59,73–75,98. However, the dehydration steps and phases depend much on pressure – and in certain cases higher temperature up to approx. 300 °C might be required94,99. Further, hydrolysis has occasionally been observed at 380 °C100,101 – and often at higher temperatures above 600 °C84,102–104. Such reactions produce CaO above 400–450 °C105,106; at lower temperature, Ca(OH)2 might be more stable. Purifying CaCl2 under vacuum for one week at 100 °C, followed by another week at 225 °C, leads to a contamination of 0.3 wt% H2O107, which is equivalent to a more sophisticated purging with HCl at 850 °C under vacuum.
Sodium chloride is only slightly hygroscopic74. While mined salt contains up to 0.4 wt% humidity, NaCl does not form hydrates but only adsorbs humidity on the surface96. Water-NaCl phase diagrams do exist but focus often on the NaCl-solubility49,88,108. Smith et al. thoroughly reviewed the drying procedure of NaCl suggesting that drying at 400 °C under vacuum leads to complete water removal96. Wang et al. found that NaCl contained initially 0.026 % humidity and that complete drying took approx. 12 h at 120 °C109. Hydrolysis of NaCl has been investigated repeatedly, and might occur at 450 °C. However, when dried under inert gas, it is considered negligible96,110–112.
Lithium chloride is extremely hygroscopic98,113. Although several hydrates are known, only the monohydrate is relevant as the others only occur below 0 °C113,114. Phase diagrams are given by various authors91,114–116 – see also the references therein. In contact with air, LiCl forms a surface layer of LiCl · H2O (2.55 % water)117. TGA measurements show that drying occurs in two steps between 99–110 and 160–186 °C118 or according to other authors at 80 °C and the rest between 96 and 175 °C80. Hydrolysis has been observed at 390–500 °C69,72,119, with increasing propensity near the melting point around 600 °C112,117,119,120. According to Smirnov et al., hydrolysis produces comparable amounts of oxide and hydroxide110. Drying has been shown to be a slow process: vacuum and flushing three times with inert gas needed 40 h at 25 °C, and 20 h at 100 °C to achieve a pressure of 133 Pa72. Swain et al. carefully reviewed possible drying procedures suggesting that heating to 300 and 500 °C for more than one week under vacuum yields similar purity as using HCl121. Other authors suggest based on TGA measurements a temperature of 450 °C under vacuum72 or 480 °C – 500 °C followed by fusion under vacuum and if possible under anhydrous HCl120 or Cl296.
Potassium chloride is only slightly hygroscopic, adsorbing water on its surface if humidity surpasses 66 % relative humidity96,98. Water-KCl phase diagrams are available49,88,122; a good overview on drying is provided by Smith et al.96. TGA measurements have shown that KCl looses water at 219 °C80,96. Hydrolysis can theoretically happen, and has been measured at temperatures as low as 500 °C. However, it is negligible if heated under protective gas72,110,111,123. According to Wang et al., KCl drying required 30 h at 120 °C to remove the 0.03 % water originally present. Typically, heating to 300–400 °C under vacuum with regular flushing with inert gas is the recommended drying procedure96.
Strontium chloride is hygroscopic, forming hexa-, di-, mono- and hemihydrates50,73,76,124,125 according to the phase diagram124,126. Dehydration under a humid atmosphere proceeds step wise from the hexa- to the di- to the mono-hydrate, from 61–320 °C98,127. The exact transformation temperatures depend very much on air moisture – which is the reason why many authors give different values126–128. In dry air, only the monohydrate is stable126 and forms the anhydrate at 37 °C126. Hydrolysis can be expected especially for the higher hydrates and higher temperature82,84 and has been shown to occur at 935 °C85.
Zinc chloride is the most practically challenging of all the salts considered. It is strongly hygroscopic50,75,95,98,129 and many hydrates are known, including 1.33, 2.5, 3 and 4.5-hydrate95,129–133. As can be seen in the phase diagram, dewatering happens in five steps95,130. All water is not removed until ZnCl2 is heated above its melting point; the last 0.1 % disappears above 310 °C and is fully lost at 350 °C130,134. Threlfall claim that ZnCl2 contains water even up to its boiling point135.
Hydrolysis of ZnCl2 has often been studied and is as complex as dehydration. It is well known that it depends on the exact salt mixture and that ZnO can limit HCl formation. Depending on the exact conditions, hydrolysis has been observed to set in at temperatures of 160–340 °C130,136–139. Giving a thorough overview on the purification of ZnCl2, Hamilton states that the degree of hydrolysis is low139. His drying procedure is similar to the one recommended by other authors140,141, and consists of: vacuum drying for 4–5 days until pressure decreases to 5 · 10−3 torr; heating to 250 °C for several days until the same pressure is obtained; flushing with HCl while heating to 350 °C; further bubbling with HCl for 5 h; and finally, flushing with dry Ar for 5 h.
Recommendations Salt drying is a mass transfer controlled process. A large surface area of the material, for example as powder, and regular flushing with inert gas is therefore useful. Drying should be performed under vacuum and for sufficient time – as rule of thumb for at least one day, but better a week. Salts should be dried separately, especially those where hydrolysis can be expected. The exact drying procedure, including heating speed and temperature steps, need to be adjusted for the specific salt – based on scientific information such as phase diagrams, TGA measurements or similar. Salts which tend to undergo hydrolysis are generally best predried at room temperature before increasing temperature slowly. In case of very challenging salts such as ZnCl2, purging of the melt with HCl or Cl2 might be required to remove all moisture.
4.5 Pressure buildup
Pressure buildup in LMBs can have different causes and may potentially be dangerous. The European Pressure Equipment Directive 2014/68/EU provides a regulatory framework to design safe pressure devices142. As the volume of our cell is below 1 l and the expected maximum pressure below 200 bar, it does not directly apply.
4.5.1 Heating. Pressure buildup during heating can be adequately approximated by the ideal gas law as40
with the temperature T in K, the amount of substance n, the gas constant R and cell volume V. As shown in Table 5, this may lead to an overpressure of 2 bar at normal operation. Even a temperature increase to 900 °C would add only one bar more.
Table 5. Overpressure due to heating.
| T (°C) | Δp (bar) |
|---|
| 25 | 0 |
| 600 | 1.9 |
| 700 | 2.3 |
| 800 | 2.6 |
| 900 | 2.9 |
Figure 6 shows the measured cell pressure within a battery during heat-up. The slight pressure over-estimation can be attributed to the presence of the pressure-sensor tube (see Figure 3), which encloses a significant volume of gas with a lower temperature than the gas in the main body of the cell (tube dimensions: 300 mm length, 4 mm internal diameter). However, overall the experimental and theoretical curve match well, and do – most importantly – not show evidence of additional pressure increase due to humidity.
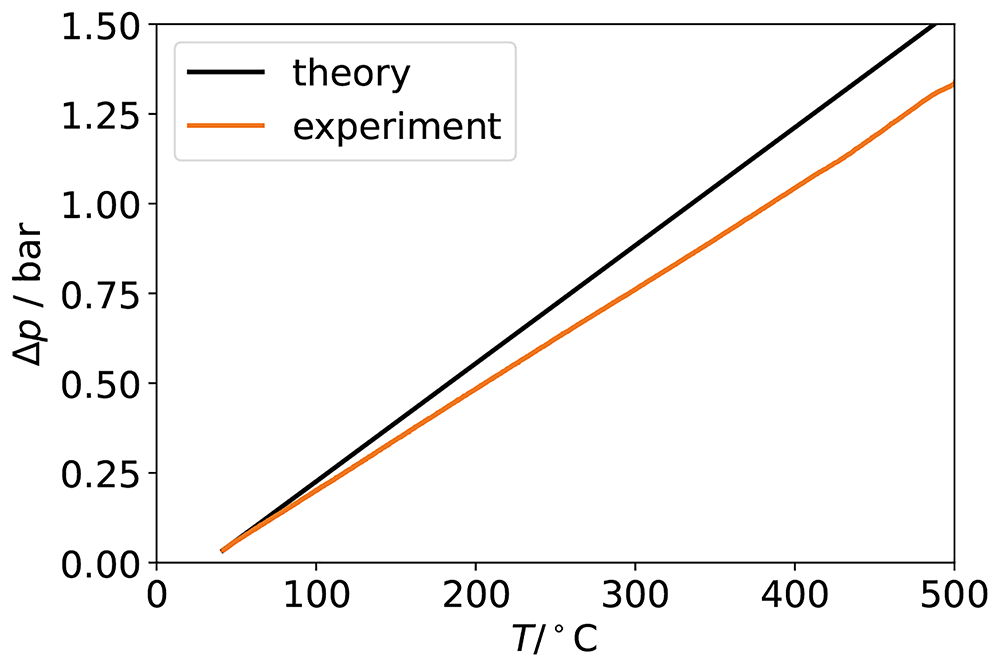
Figure 6. Pressure rise predicted by the ideal gas law (black) and measured in a battery experiment (orange).
4.5.2 Vapour pressure. The vapour pressures of Na, Zn and ZnCl2 are considerable and lead to continuous evaporation in open cells – as shown exemplary in Figure 7. However, their contributions to the overall cell pressure can safely be neglected, as shown in Table 6.
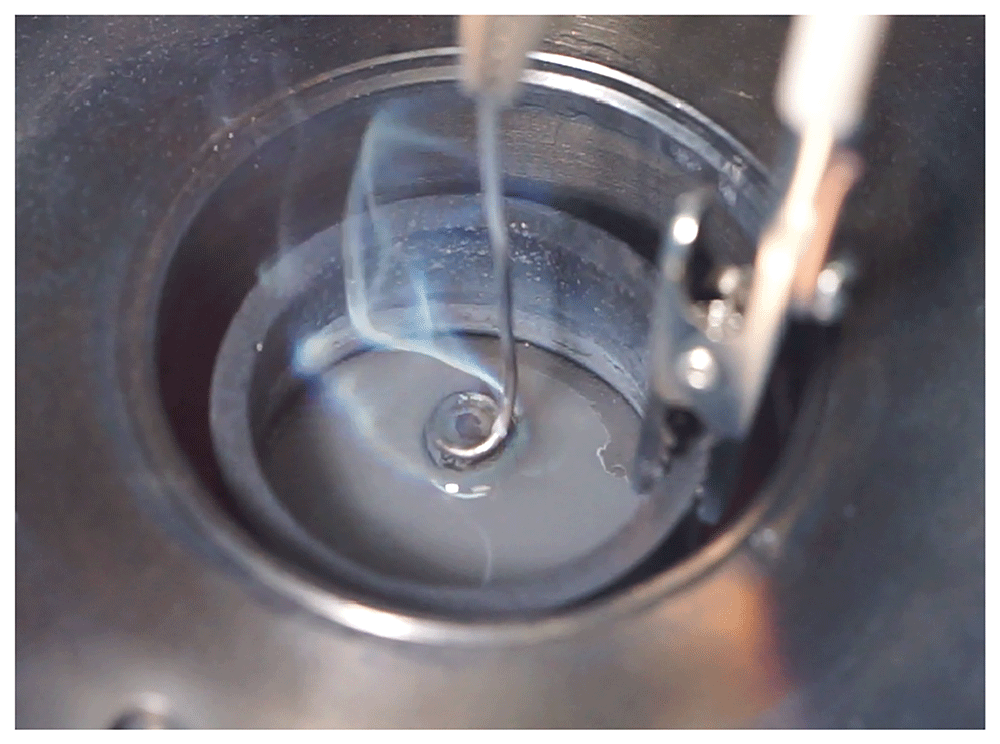
Figure 7. Na vapour forming at the anode of an open Na-Zn cell experiment.
Table 6. Vapour pressure of battery materials at 600 °C.
★ Emons et al.143 do not mention the unit of their vapour pressure equation; for plausibility reasons, torr was assumed. FactSage gives an order of magnitude smaller value of 3.1 · 10−7 Pa.
| compound | vapour pressure | comment |
|---|
| Pa | bar |
|---|
| Ba | 7.1 | 7.1 · 10−5 | at melting point45 |
| Ca | 218 | 2.2 · 10−3 | at melting point45 |
| K | 20314 | 0.2 | 45 |
| Li | 7.4 | 7.4 · 10−5 | 45 |
| Na | 3382 | 0.034 | 144 |
| Sr | 7.7 | 7.7 · 10−5 | 145 |
| Zn | 1489 | 0.015 | 46 |
| BaCl2 | 3.8 | 3.8 · 10−5 | at melting point146 |
| CaCl2 | 0.028 | 2.8 · 10−7 | at melting point147 |
| KCl | 51.5 | 5.2 · 10−4 | at melting point70 |
| LiCl | 3.9 | 3.9 · 10−5 | at melting point147 |
| NaCl | 46 | 4.6 · 10−4 | at melting point147 |
| SrCl2 | 0.48 | 4.8 · 10−6 | at melting point146,143★ |
| ZnCl2 | 16000 | 0.16 | 70 |
| H2O | 22 · 10−6 Pa | 220 | at critical temperature
of 374 °C39 |
4.5.3 Water, hydroxide and oxide decomposition. Humidity in the cell will result in hydrogen production thus increasing cell pressure. The exact amount of water depends on the cleaning of the battery parts, on the specific salt and its drying procedure. Especially ceramic parts can absorb water and should be carefully dried before use. Table 7 gives an overview of measured water contents in various salts after purification.
Table 7. Water content in purified salts.
| salt | water content | purification steps | source |
|---|
| CaCl2 | 0.3 wt% | 5–7 days at 100 °C, then 225 °C for 5–7 days under vacuum | 107 |
| 0.3 wt% | 850 °C under vacuum, sparging with HCl for 30 min, then Ar | 107 |
| KCl | 0 | 400 °C | 96 |
| 0 | 30 h at 120 °C | 109 |
| LiCl | 0.17-0.4 mol% | LiCl-KCl mixture heated for 1 h in vacuum to 480 °C | 119 |
| NaCl | 0 | NaCl-KCl mixture heated to 700 °C under vacuum for 15 min | 119 |
| ZnCl2 | 11.2 % | 120 °C, 32 h | 109 |
A water concentration of 0.3 wt% in CaCl2 can be assumed as realistic while NaCl might be assumed to be fully dry. After assembling a cell in a discharged state using Zn, NaCl and CaCl2, humidity might react slowly with Zn to form H2 and Zn(OH)2 as this is the stable species at room temperature – see Table 15. When heating the battery, the reaction might accelerate, forming ZnO instead of hydroxide above 85 °C41. During the first charge, water may alternatively react with ZnCl2 (by hydrolysis) or with Na to form NaOH.
To estimate the pressure increase due to hydrogen release, only the free space above the crucible – ignoring the feedthroughs, barrel connectors and small tube – is assumed as free gas volume as
Assuming that the CaCl2 contains 0.3 wt% water, the total water mass is m = 0.6 · 32 g · 0.003 = 0.058 g or n = 0.0032 mol. At 600 °C, the ideal gas law39,40
predicts a pressure of 1 548 kPa = 15 bar for the water vapour alone assuming that all of the initial water’s hydrogen is released, and its oxygen forms oxides with negligible vapour pressure. Adding the thermal expansion of the Ar gas cushion results in a total pressure difference (between the capsule interior and normal atmospheric pressure) of almost 18 bar. Pressure measurements made on real experimental cells report values that are substantially lower than this, supporting the efficacy of the salt drying procedures described in Section 4.4.
Based on Table 15, it is impossible to predict which oxide or hydroxide will be formed preferentially at 600 °C. Comparing only the decomposition potentials, and assuming that the species with the highest potential is the most stable, the formation of Ca(OH)2 would be preferred. This might be true if Ca(OH)2 does not dissolve in the salt. However, if it dissociates into Ca2+ and OH– ions, the various hydroxides cannot be distinguished any more and hydroxide decomposition may occur much below the decomposition potential of Ca(OH)2. Moreover, complex ions, hydroxychloride or other compounds might be formed139,148.
Under these circumstances, and also considering that the decomposition potentials in Table 15 do not account for activities, it cannot be predicted at which potentials gas evolution will start. It is, however, obvious that especially oxygen would immediately back-react with any metal to oxide in closed cells. Similarly, hydrogen may back-react with oxides to hydroxides if these are more stable. The full release of all bound hydrogen can therefore be considered as the worst case scenario. In any case, oxides and humidity must absolutely be avoided as their decomposition and reaction with the cell’s electroactive materials might significantly reduce its coulombic efficiency.
4.5.4 Salt decomposition. If excessively low or high inter-electrode potentials are applied to the cell the electrolyte might decompose to form metal and chlorine gas. As a worst-case scenario, 12.8 g (0.219 mol) of NaCl and 19.2 g (0.173 mol) of CaCl2, fully decomposed, would result in 0.28 mol of chlorine gas. Taking a simplified large cell volume of
this corresponds to a cell pressure of
Table 14 gives an overview of theoretical decomposition potentials, neglecting the species’ activities. It should be emphasised that the chlorine evolution reaction will compete with the Zn oxidation reaction at charge, or with the anode current collector corrosion reaction at discharge. Gas generation might therefore be slow. Moreover, chlorine is expected to back-react immediately with any metal in the cell so that it is unlikely that large amounts of chlorine can be generated.
The attentive reader might notice that the decomposition potential of ZnCl2 is with 1.6 V lower than the cell’s open-circuit potential. For decomposition to occur, Zn2+ ions need to reach the anode current collector. However, this is impossible because they will immediately be reduced by (dissolved) Na when "approaching" the anode. ZnCl2 decomposition is therefore only possible if building cells containing ZnCl2 in discharged state, or when (much) Na is lost during cell operation. However, care must be taken to cycle within predetermined safe potential limits.
4.5.5 Short circuit. An instantaneous adiabatic full-cell discharge is the worst conceivable outcome of a short-circuit. The resulting temperature increase can be calculated as follows.
The extent of the reaction is limited by the amount of available Na. Assuming that the battery is charged until salt solidification (DoD = 45 %) and that the complete salt column (i.e. not just the salt below the diaphragm) participates in the reaction, the amount of Na is
where m denotes the mass and M the molar mass of Na.
The enthalpy change of the cell reaction (Equation 1) can be expressed as149
As simplification we neglected the enthalpy of mixing of NaCl/ZnCl2 with molten CaCl2 and simply extrapolate the enthalpy of formation of liquid NaCl to 600 °C and assume an ideal solution. Such an approach is justified as the enthalpy of mixing in NaCl-CaCl2 systems (< 3 kJ/mol,150) and NaCl-ZnCl2 systems (< 8 kJ/mol,151) indeed is small. Using the values of Table 8, the total enthalpy liberated by the reaction is then given as
Table 8. Enthalpies of formation of Na, Zn and their chlorides at 600 °C.
| compound | H (J/mol) | source |
|---|
| Na(l) | 19853 | 41 |
| ZnCl2(l) | -356844 | 152 |
| NaCl(l) | -352778 | 152 |
| Zn(l) | 23828 | 41 |
Considering that all ZnCl2 disappears during the reaction, metallic Zn (being the most volatile constituent) would be the first to evaporate when reaching 907 °C – see Table 10. With the heat capacity of the active materials of 45.9 J/K according to Table 9 the necessary heating would consume
Table 9. Mass, molar mass, amount and heat capacities of Na, NaCl and ZnCl2.
| m | M | n | cp | source |
|---|
| g | g/mol | mol | J/mol K | J/K |
|---|
| Zn | 25 | 65.39 | 0.3823 | 31.4 | 12.00 | 153 |
| NaCl | 12.8 | 58.443 | 0.2190 | 67.9 | 14.87 | 154 |
| CaCl2 | 19.2 | 110.983 | 0.1730 | 110 | 19.03 | 154 |
| sum | | | | | 45.9 | |
Table 10. Boiling points of Zn and the salts.
| Tb (°C) | source |
|---|
| Zn | 907 | 45 |
| BaCl2 | 1560 | 75 |
| CaCl2 | 1936 | 155 |
| KCl | 1500 | 75 |
| LiCl | 1360 | 75 |
| NaCl | 1465 | 155 |
| SrCl2 | 1250 | 75 |
| ZnCl2 | 732 | 75 |
which means that 22.4 kJ are left for evaporation.
In order to evaporate all Zn, an energy of 44 kJ would be required, considering that the heat of evaporation of Zn is 115 kJ/mol45. Therefore, roughly 50 % of the Zn might evaporate. Assuming ideal gas behaviour and using only the free volume above the crucible (Equation 3) the resulting pressure increase would amount to 1 bar, as shown in Table 5.
4.5.6 Recommendations. Table 11 summarises reasons and values for pressure increases. Obviously, it is imperative to avoid salt decomposition due to overcharge or overdischarge. Further, it is very important to carefully dry the salts, because even small quantities of residual moisture might lead to pressure buildup on the order of 18 bar. When using new salts or trialling new charging currents, a pressure monitoring is recommended. If all recommendations are followed, normal cell overpressure will be on the order of 2 bar.
Table 11. Possible pressure increase in the cells due to various effects.
| effect | pressure
increase (bar) | comment |
|---|
| vapour pressure | 0.2 | by ZnCl2, Zn and Na |
| heating | 2 | |
| short-circuit | 1 | |
| water | 18 | assuming 0.3 wt%
water in CaCl2 |
| salt decomposition | 450 | |
| overheating | 1 | if 300 K more |
4.6 Durability of housing
The cell housing protects the environment from the cell’s hazardous constituents, and the cell interior from moisture and oxygen. Its long-term integrity is therefore essential. The choice of materials, design and calculations are explained in Section 6.4. In the following, possible cell failure mechanisms will be discussed.
4.6.1 Corrosion. Na is able to reduce most other metals and might therefore attack ceramics, such as the Al2O3 of the feedthrough; this depends of course on temperature156. Further, it might dissolve Ag from the braze of the feedthrough in the event that sufficient amounts of Na condense there157. Steel and other metals will also be attacked by HCl, which is formed due to hydrolysis caused by humidity of the salts. While pure salts are not corrosive, impurities such as O2, H2, H+, H2O or OH– can act as oxidising agents and can lead to rapid corrosion. If the gas-tight seal is broken, then a continuous inflow of the surrounding atmosphere can be expected. In such case a rapid corrosion of the housing is inevitable, as demonstrated in Figure 8 (a). In this example, the cell was not tightened on purpose. In a short time (ca. 6 h), the corrosive salt has destroyed the housing. Liquid Zn, which will – like Na – evaporate and condensate at different places within the cell housing, is able to easily dissolve steels158–160. An example of a Zn dissolved Inconel barrel connector is shown in Figure 8 (b). Finally, excessively high potentials might lead to electrochemical corrosion, if there is electrical contact with the part in question. Overall, an extensive cell testing and thorough understanding is necessary to be able to safely exclude internal corrosion of the cell.
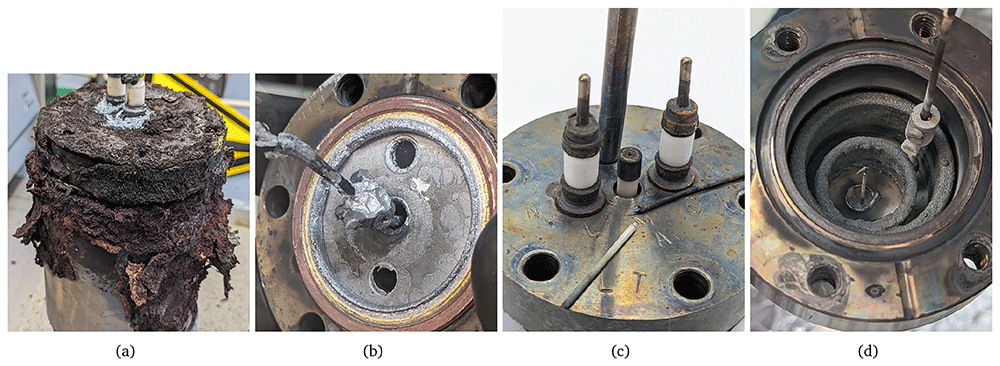
Figure 8.
Corrosion of an untight cell body due to leaked molten salts in (a), corrosion of an Inconel barrel connector due to Zn vapours in (b), failure of a small feedthrough due to high temperature and increased pressure in (c) and material sedimentation on internal parts leading to compositional changes and eventual failure of the cell due to high resistance in (d).
The cell might not only fail due to corrosion from the inside, but also due to attack from the outside. For example, certain insulation wools contain chloride ions which are able to attack steel161–163. Further, HCl vapour in chemical laboratories will have a similar effect. Maybe most importantly, the feedthrough braze is usually not stable in air and will corrode slowly. According to the manufacturer, simple Ag-Cu brazes can only be used up to 350 °C in air, while Au-covered brazes might be used up to 450 °C164. A failure of a small feedthrough as well as corrosion of larger Ag-Cu ones are shown in Figure 8 (c).
4.6.2 Thermal shock and stresses. Volume change and thermal stresses are extremely important for cell safety. Rapid heating or cooling is especially harmful for ceramics as they conduct heat slowly and the resulting differential stresses might lead to cracking165. The heating/cooling rate must therefore be limited to 5 K/min166. Moreover, volume change is a significant challenge as some salts expand by 20–30 % upon melting – see Table 12. Zn, which melts more than 100 K earlier than the salt might be trapped in the salt and exert strong forces on its surroundings. While the battery housing has been shown to be able to cope with these stresses, the sealing of the feedthroughs might nonetheless be damaged.
Table 12. Melting points (Tm), densities (ρ) and volume change of metals and salts defined as ΔV/V = (Vhot – Vcold)/Vcold = ρcold/ρhot – 1.
If no reference is given, the volume change has been calculated. ★ In computing the volume change of the metals, the volumetric expansion coefficient has been assumed to be 3 times the linear expansion coefficient.
| substance | Tm | ρ (g/cm3) | volume change (%) |
|---|
| | 25 °C | Tm (lq) | 600 °C | solid | melting | liquid |
|---|
| Ca | 83959 | 1.5440 | 1.37840 | - | 440★ | 7.4★ | - |
| 84240 | | | | | | |
| Na | 9840 | 0.9740 | 0.927153,168 | 0.808153,168 | 1.640★ | 2.6169 | 14.7 |
| Zn | 42040 | 7.1440 | 6.57445,46 | 6.39845 | 3.840★ | 4.08169 | 2.75 |
| BaCl2 | 96240,59,75,98 | 3.85673,75
3.9198 | 3.17440 | 3.70849 | 4 | 3.570 | - |
| CaCl2 | 77275 | 2.1575 | 2.08540 | 2.09149 | 4 | 0.0970 | - |
| 77540 | 2.17449 | | | | | |
| KCl | 77059 | 1.98475 | 1.52740 | 1.83249 | 8.3 | 17–2370,170 | - |
| 77140,98 | 1.98798 | | | | | |
| LiCl | 60575 | 2.06875,98 | 1.50240 | 1.89149 | 9.4 | 26.2170 | - |
| 61040 | | | | | | |
| 61498 | | | | | | |
| NaCl | 80140 | 2.16575 | 1.55640 | 1.99049 | 8.8 | 23–3070,170 | - |
| SrCl2 | 87440 | 3.05275,98 | 2.72740 | 2.89249 | 5.5 | 2.4–4.270 | - |
| 87598 | | | | | | |
| ZnCl2 | 28398 | 2.90775,98 | 2.5440 | 2.89249 | 3 | 11.670 | 5.849 |
| 29040,75 | 2.9849 | | (at m.p.) | | | |
| CaCl2-NaCl 44:56 mol% | ~53049 | 2.1749 | 1.9447 | 1.9147 | 5.149 | 5.149 | 1.57 |
4.6.3 Manufacturing defects and ageing. Weldseams can always contain defects. Although many material tests are available167, a simple pressure test of the vessel might be the most reasonable approach to defect identification. It would also ensure that compression fittings are correctly mounted when using a pressure sensor or thermocouple. Finally, a torque wrench should be used to tighten the screws and hermetically seal the cell.
Battery ageing may be caused by any corrosion process, but also by microstructural changes in the steel from which the housing/screws are made. For example, a very brittle Fe-Cr phase might form between 600 and 800 °C if the battery is exposed to this temperature for several hours. This sigma phase can appear only in steels with a minimum Cr content of 18–20 %, where Si, Mn, and Mo promote sigma phase formation167. As the 1.4980 steel (used here for screws) has a chromium concentration of 13.5–16 %, and the 1.4306 steel (used for the housing) has chromium concentration of 18–20 %, sigma phase formation is theoretically possible only for the housing.
Secondly, at 475 °C embrittlement can be expected in ferritic Cr-steels if held for several hours between a temperature of 400 and 550 °C167. Fortunately, this is rather improbable as the Na-Zn cell operates at higher temperature and both of the steels used are austenitic.
Finally, electrolyte ageing might be a challenge, too. As shown in Figure 8 (d), during the 400 h electrochemical cycling experiment, salt has gradually deposited on the ceramic walls, irreversibly altering the remaining composition. This eventually leads to increased resistance and higher potentials.
4.6.4 Abuse. Several possibilities exist for abuse of Na-Zn cells. Physical impacts, thermal shocks, and exposure to corrosive substances, among others, must be excluded. During disassembly, cells must be handled carefully, especially when removing their lids to avoid damage to the flange’s knife-edge and/or sealing surface. The feedthroughs and pressure sensor tube in the lid are both fragile and should be handled with the necessary care. Cells should not be lifted using the pressure sensor tube.
4.6.5 Recommendations. Designing a cell housing which can safely contain the active materials under all probable circumstances is very challenging. As explained in Section 6.4 it is especially difficult to calculate the appropriate tightness of the screws at 600 °C, as well as an appropriate feedthrough design.
Cell pressures in the order of 2–3 bar during normal operation can safely be contained using the materials investigated to date (see Table 2). However, traces of moisture might induce considerable overpressure on the order of 18 bar. In such scenarios, the housing, tube and screws are still expected to maintain their integrity – most probably the braze of the feedthrough will fail first. The pressure sensor might also fail at such high pressures. Finally, volume changes leading to deformation of the current collector and stresses in the braze of the feedthrough can easily destroy the latter. Concerning long-term stability, the feedthroughs and their corrosion by air is clearly the limiting factor. Corrosion from inside is probably less problematic as long as the cell is properly sealed.
To ensure safe operation, the following safety measures are recommended:
battery prototypes should always be operated under a fume hood as the sealing might fail at any time
only carefully dried salts should be used
when using new salt mixtures, the cell pressure should be monitored
standard procedures for drying, filling and assembling (torque, etc.) should be developed
all cell prototypes need to be handled with care
5 Conclusions
A safety assessment of a Na-Zn Liquid Metal Battery (LMB) has been performed at the cell level with a focus on operation in a laboratory furnace. Material, electrical, thermal and mechanical hazards have been discussed. It has been shown that safety of Na-Zn LMBs depends crucially on the selection of a safe electrolyte; if technically possible, avoidance of LiCl and BaCl2 is desirable. One of the main hazards, cell overpressure, can be avoided by proper salt purification and by operating the cell in a safe potential window, as is the case for ZEBRA, Na-S and AMBRI’s Ca-Sb batteries. In terms of cell engineering, LMBs are still at a low TRL level and certain aspects of their potential failures modes are not yet fully understood. However, it can be predicted at the outset that LMBs can reach a very high safety level, similar to ZEBRA batteries, because they are not vulnerable to thermal runaway. In this important respect, the cells are safer than Na-S or Li-ion batteries, and are expected to comply with the (relatively demanding) safety standard UL 9540A32 in future.
To further improve cell safety, a better understanding of corrosion mechanisms and corrosion products is required. The weakest components of the cell housing are the feedthroughs; here, much knowledge regarding (air-induced) corrosion, thermal stresses, and mechanical durability is missing. Finally, the extensive topic of cell design and engineering has scarcely been covered in the past and requires more attention in future. Apparently simple phenomena, like the volume change of the salt upon solidification, or thermal stresses borne by the cell housing, are crucial to operate Na-Zn cells safely and efficiently at 600 °C, but are insufficiently well understood at present. In the face of these knowledge gaps, LMB prototypes should be operated under a fume hood until the various possible failure mechanisms are fully understood. Nevertheless, continuous operation of gas-tight batteries for up to 6 weeks outside a protective environment has demonstrated that this demanding but affordable energy storage concept not only has great potential, but may also become inherently safe in the near future28.
6 Tables and technical design specifications
6.1 Safety tests for batteries
Table 13. Typical safety tests for battery cells according to various standards29,31,32,171,172.
For the various misuse tests, noncompliant results are, e.g. leakage, fire, explosion, release of toxic or flammable gases.
| test | description |
|---|
| electrical tests |
|---|
| overcharge | a battery is charged to 110 % |
| high rate charge | a battery is charged with 120 % of the specified maximal
current |
| short circuit | a charged battery is short-circuited with max. 20 mΩ |
overload under
discharge | a charged battery is discharged once with 90 % of the rated
overcurrent protection value of the BMS, and once with 135 %
of the main fuse rating |
| overdischarge protection | a charged battery is discharged with the specified maximum current until the temperature/voltage protection of the BMS switches it off |
| temperature and operating limits | a battery is brought to specified upper temperature limit, then charged and discharged |
| imbalanced charging | all cells are fully discharged, while one is brought to a SoC of 50 %; then all together are charged with maximum current |
| insulation resistance | the electrical spacing and insulation are tested |
| continuity test | the grounding of the battery is tested |
| failure thermal management | the battery is discharged, the thermal management system switched off and the battery charged with maximum current; the same is done with discharge |
| working voltage measurements | the potential between live parts and metal enclosure is measured and compared with specifications |
| locked-rotor test | the fan of a possible cooling motor is blocked for 7 h |
| input current | the input current drawn by accessory devices which are connected to AC is measured |
| leakage current | the leakage current of AC secondary components is measured |
| strain relief | the strain relief of the power cord is tested |
| push-back relief | it is determined whether the power cord can be pushed back into the device |
| low voltage transformer | a possible transformer is tested for fire hazards |
| electromagnetic immunity tests |
|---|
| electrostatic discharge | test for electrostatic contact discharge of 6 kV and air discharge of 8 kV |
| radio-frequency electromag. field | immunity against radio frequency is tested with 10 V/m from 80 MHz to 1 GHz and 3 V/m from 1.4 to 6 GHz |
| burst immunity | immunity to electrical fast transients/bursts is tested |
| impulse voltage test | surges of 0.5-2 kV line-to-ground are tested which might result from lightning |
| radio-frequency common mode | radio-frequency conducted disturbances are tested at in- and output ports |
| power frequency magnetic field | immunity to 10 A/m power-frequency magnetic fields is tested |
| mechanical tests |
|---|
| vibration | a fully charged battery is subject to random vibration |
| shock | a fully charged battery is subject to shock |
| crush | battery crushed between a fixed surface and a ribbed test platen |
| static force | 250 N are applied on all sides at a round 30 mm surface |
| impact | a charged battery receives three impacts of 6.8 J |
| drop impact | a charged battery is dropped depending on its weight up to 1 m |
| wall mount fixture | an additional force of 3 times the weight of the battery is applied |
| hydrostatic pressure test | cell needs to support 1.5 times its hydrostatic pressure |
| pneumatic strength tests | cell needs to support 1.3 times its design pressure |
| environmental tests |
|---|
| thermal cycling | environment temperature of a fully charged battery is changed between -40 and 75 °C |
| resistance to moisture | test of IP rating |
| salt fog | a salt fog test is performed for batteries to be installed near the sea |
| external fire exposure | a fully charged battery is subjected to a fire for 20 min and should not explode |
| tolerance to internal cell failure test |
|---|
| single cell failure tolerance | a failing single cell should not lead to destruction of the complete battery |
| thermal runaway test |
|---|
| cell level | a single charged cell is heated at 4–7 K/min; if thermal runaway occurs or flammable gas is released, module test follows |
| module level | one or several cells in a module are forced into thermal runaway to observe propagation; if thermal runaway cannot be contained in module or flammable gas is released, unit level test follows |
| unit level | the complete BESS is tested accounting for its installation site (indoor, outdoor) |
6.2 Risk assessment table
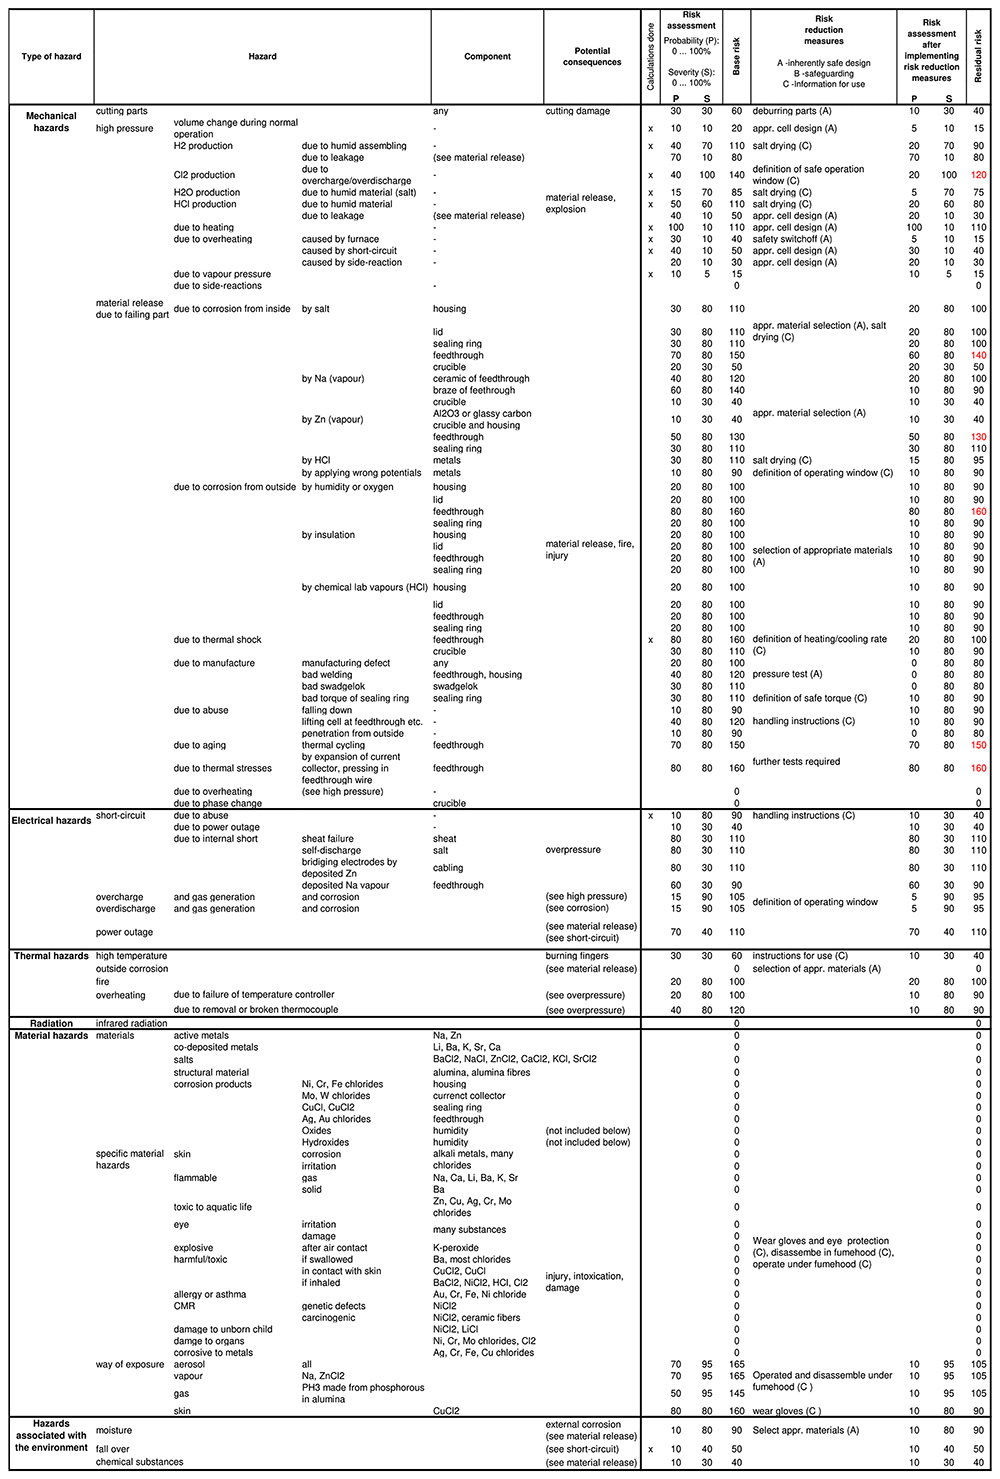
Figure 9. Excel table of the risk assessment.
6.3 Decomposition and corrosion potentials
Decomposition potentials for many pure substances have been tabulated, and are readily available in the literature. In general, these have either been measured experimentally, or calculated from thermodynamic data (specifically, the Free energy changes of their decomposition reactions). Table 14 and Table 15 summarise such data for substances relevant to Na-Zn cells. These are substances that are either components of a prospective electrolyte, or occur as contaminants in the cell.
Table 14. Decomposition potentials of chloride salts at 600 °C.
At overcharge, metal is produced on top and gas on the bottom of the cell, at overdischarge (negative potentials) inversely. Activities have been neglected.
| salt | ΔE (V) |
|---|
| 36 | 41 |
|---|
| BaCl2 | 3.7 | 3.7 |
| CaCl2 | 3.5 | 3.4 |
| KCl | 3.7 | 3.7 |
| LiCl | 3.6 | 3.5 |
| NaCl | 3.4 | 3.4 |
| SrCl2 | 3.6 | 3.6 |
| ZnCl2 | 1.6 | 1.5 |
Table 15. Decomposition potentials for oxides and hydroxides at 600 °C41, and stability of species.
At overcharge, metal is deposited on top, and gas released on bottom of the cell, at overdischarge (negative potentials) inversely. The ‘stable species’ entries are based on thermodynamic calculation neglecting activities and ignoring peroxides, superoxides and hydroxychlorides; the values should therefore be treated with care.
| substance | product | △E (V) | stable species | comment |
|---|
| 25 °C | 600 °C |
|---|
BaO
Ba(OH)2 | Ba, O2
H2, O2
H2O, O2
BaO, H2O | 2.4
3.6
2.6 |
hydroxide |
hydroxide |
BaO forms at 900 °C83 |
CaO
Ca(OH)2 | Ca, O2
H2, O2
H2O, O2
CaO, H2O | 2.8
3.80
2.76
|
hydroxide |
oxide | 2.2 V at 1000 °C175
stability limit hydroxide is 400 °C101,106 |
K2O
KOH | K, O2
H2, O2
H2O, O2
K2O, H2 | 1.2
3.1
2.1
|
hydroxide
|
hydroxide
|
KOH produced at 827 °C110; K2O2 might be more
stable at 450 °C69 |
Li2O
LiOH | Li, O2
H2, O2
H2O, O2
Li2O, H2 | 2.5
3.6
2.6 |
hydroxide
|
hydroxide
|
LiOH and Li2O appear in comparable amount110;
Li2O generation starting at ∼250 °C176 |
Na2O
NaOH | Na, O2
H2, O2
H2O, O2
Na2O, H2O | 1.5
3.1
2.1 |
hydroxide |
hydroxide | 1.76-2.18175
NaOH produced at 450, 70096 and 827 °C110 |
SrO
Sr(OH)2 | Sr, O2
H2, O2
H2O, O2
SrO, H2 | 2.6
3.7
2.7
|
hydroxide |
hydroxide | |
ZnO
Zn(OH)2 | Zn, O2
H2, O2
H2O, O2
ZnO, H2O | 1.3
2.0
0.9 |
hydroxide |
oxide | 1.24-1.3 V175
hydroxychlorozinc might be formed instead139;
ZnO at least above 200 °C134 |
Table 16. Selected potentials for corrosion of current collectors.
| cell | ∆E (V) | comment |
|---|
| 36 | 41 |
|---|
| Corrosion of anode current collector if going below |
|---|
| Al-Zn | 0.55 | 0.31 | first value at 200 °C |
| Co-Zn | -0.47 | -0.50 | |
| Cr-Zn | -0.08 | -0.06 | Cr2+ |
| Cr-Zn | -0.29 | -0.31 | Cr3+ |
| Cu-Zn | -0.55 | -0.53 | Cu+ |
| Cu-Zn | -1.05 | -1.01 | Cu2+ |
| Fe-Zn | -0.35 | -0.31 | Fe2+ |
| Fe-Zn | -0.54 | -0.68 | Fe3+, first value at 350 °C |
| Mn-Zn | 0.35 | 0.39 | |
| Mo-Zn | -1.08 | -0.69 | Mo2+ |
| Mo-Zn | -1.03 | -0.63 | Mo3+, first value at 350 °C |
| Mo-Zn | -0.97 | -0.78 | Mo4+, first value at 200 °C |
| Ni-Zn | -0.55 | -0.61 | |
| Ti-Zn | 0.33 | 0.41 | Ti2+ |
| Ti-Zn | 0.28 | 0.33 | Ti3+, first value at 500 °C |
| W-Zn | -1.16 | -0.71 | W2+ |
| W-Zn | -1.12 | -0.97 | W4+ |
| W-Zn | -1.16 | -1.04 | W5+ |
| W-Zn | -1.23 | -1.10 | W6+ |
| Corrosion of cathode current collector if going above |
|---|
| Na-Al | 1.33 | 1.60 | |
| Na-Co | 2.35 | 2.42 | |
| Na-Cr | 1.95 | 1.97 | Cr2+ |
| Na-Cr | 2.16 | 2.23 | Cr3+ |
| Na-Cu | 2.42 | 2.44 | Cu+ |
| Na-Cu | 2.92 | 2.93 | Cu2+ |
| Na-Fe | 2.22 | 2.22 | Fe2+ |
| Na-Fe | 2.41 | 2.60 | Fe3+, first value at 350 °C |
| Na-Mn | 1.52 | 1.52 | |
| Na-Mo | 2.95 | 2.60 | Mo2+ |
| Na-Mo | 2.91 | 2.54 | Mo3+, first value at 350 °C |
| Na-Mo | 2.84 | 2.69 | Mo4+, first value at 200 °C |
| Na-Ni | 2.4 | 2.52 | |
| Na-Ti | 1.54 | 1.50 | Ti2+ |
| Na-Ti | 1.59 | 1.58 | Ti3+, first value at 500 °C |
| Na-W | 3.0 | 2.62 | W2+ |
| Na-W | 2.99 | 2.89 | W4+ |
| Na-W | 3.03 | 2.96 | W5+ |
| Na-W | 3.10 | 3.02 | W6+ |
An important caveat to the use of these tabulated values is that they are strictly valid only for pure substances, whereas a Na-Zn electrolyte comprises a solution of several substances whose components’ activities may differ from their molar concentrations (i.e. exhibit non-ideal behaviour). The influence of such non-ideality on the potential is expressed by the Nernst equation, which, for a generic oxidation reaction at a single interface173,174 is
where E0 denotes the standard potential (provided by the tables), R the gas constant, F the Faraday constant, T the temperature in K, z the number of exchanged electrons, and aox and ared the activities of the oxidised and reduced species respectively. The overall (inter-electrode) cell potential comprises the difference between two such interfaces
where the index a refers to the anode and c to the cathode. Thus, for the whole cell we have:
Evaluation of activities is non-trivial, since there is no completely general model that successfully predicts their relationship to molar concentration, and experimental measurements on halide solutions are not comprehensive. By providing only the standard state terms (E0,c and E0,a), the tabulated potentials offer an approximation rather than a precise description of these decomposition potentials.
The cell potential at which one of the current-collector metals can oxidise – here termed the ‘corrosion potential’ – is a similarly important limit for sustainable cell operation. Table 16 displays such potentials for a range of candidate current collector metals. The metal couples in the left-hand column indicate possible exchange reactions: anode current collector versus Zn in the upper half; Na versus the cathode current collector on the lower half. The voltages displayed are those at which each metal couple undergoes electron exchange, resulting in the dissolution of the current collector metal into the electrolyte. For a pure single-component electrolyte, comprising the chloride of the reducing metal, such voltages are simply equal to the difference between the decomposition potentials of the chlorides of the metals concerned, according to Equation 12 above. However, as with the aforementioned decomposition potentials, the precise voltage for the multi-component case constituted by a Na-Zn cell, the activities of the components must be included in the calculation (Equation 13). Accordingly, Table 16 offers useful approximations rather than precise values.
6.4 Design and durability of cell
The details, calculations and further considerations concerning the cell design are summarised in this section.
6.4.1 Housing material. The steel for the cell housing needs to fulfil the following criteria:
heat-resistance: the steel needs to maintain high strength and structural integrity when subjected to 600 °C for long periods of time
scaling resistance: the steel needs to exhibit significant resistance to scaling, which refers to the formation of oxide layers on the surface when exposed to high temperatures in the presence of air
long-term stability at high temperature: material degradation or structural weakening at high-temperature during long time periods needs to be prevented
corrosion resistance: the steel needs to support the specific environment within the cell, including molten salt, Na and Zn vapour
adequate performance under thermal changes: the material needs to support large and repeated temperature changes including expansion and contraction
compatibility with other cell components: the steel is required to be compatible with other materials used in the cell avoiding any adverse reactions, material incompatibilities or degradation
manufacturing reliability: the selected steel must be consistently manufactured to precise specifications, to ensure reliability and avoid variations in material performance that could pose risks during cell operation
weldability, if possible without pre- or postheating
adequate machinability for easy manufacturing
Given the number of steels available in the market, it is impossible to provide clear advice how to select the most appropriate steel in a systematic manner. Even though patents of the LMB company AMBRI177 mention 1.4016 (AISI 430)178 to the best of our knowledge no study on suitable steels for LMBs has been published. We assume therefore that such steels which are used at high temperature for furnaces and in the chemical industry might be suitable. This includes in particular creep resistant, high-temperature steels. Table 17 provides a selection of steel grades which we consider to be suitable for LMBs.
Table 17. Possible steels and Ni-based alloys for high-temperature batteries with an operation temperature of 600 °C.
Data taken from various material data sheets and Wegst & Wegst181.
| material | characteristics |
|---|
1.4762
X10CrAlSi25
AISI 446 | Ferritic stainless steel of low strength but excellent resistance to high-temperature oxidation. Weldable, but might need pre-heating. Application: industrial furnaces, combustion chambers, oil burners, heat exchangers, kiln liners, glass moulds. |
1.4828
X15CrNiSi20-12
AISI 309 | Standard steel in furnace building of high strength and corrosion resistance up to 650 °C in air. Weldable without preheating. Application: annealing bells, cementation and hardening boxes, annealing pots, etc. Alternatives: 1.4835, 1.4841. |
1.4845
X15CrNi25-21
AISI 310S | Austenitic steel with corrosion resistance in air up to 1050 °C. Weldable. Applications: furnace building, chemical industry, steam boilers, petroleum processing plants, heat treatment baskets, etc. |
1.4864
X12NiCrSi35-16
AISI 330 | High strength and corrosion resistance in air up to 1000 °C. Welding without pre-heating. Applications: furnace building, chemical industry, heat exchangers. |
1.4876
X10NiCrAITi32-20
Alloy 800 | High-temperature strength and excellent resistance to oxidation up to 1100 °C in air. Weldable. Applications: parts for furnace and steam boiler constructions, petroleum industry, heat exchangers, and furnace components. Similar alternatives: 1.4958 and 1.4959. |
1.4910
X3CrNiMoBN17-13-3
AISI 316LN | Creep-resistant alloy for usage up to 700 °C. Weldable. Application: pressure vessels, steam boilers, chemical industry. |
1.4922
X20CrMoV11-1 | Creep resistant construction steel for usage in air up to 600 °C. Low corrosion resistance due to low Cr content. Application: chemical industry. |
2.4816
NiCr15Fe
Alloy 600 | Ni-bases superalloy with excellent corrosion resistance up to 1050 °C. Weldable. Applications: industrial furnaces, chemical industry, reactors, aerospace applications. |
2.4856
NiCr22Mo9Nb
Alloy 625 | High-temperature alloy for use up to 1050 °C with excellent corrosion resistance. Weldable without preheating. Applications: chemical process industry, offshore and environmental technology. |
As standard vacuum parts for our cell design were not available in the steel grades mentioned, simple 1.4306 had to be used for the housing and lid. At temperatures exceeding 500 °C, creeping will always occur179. We therefore base the strength calculations on the assumption that a deformation of 1 % in 10 000 h (Rp1.0) is acceptable179. Table 18 provides the material properties.
Table 18. Material properties of steel 1.4306 with data taken from various data sheets.
| property | unit | value | comment |
|---|
| maximum use temperature | Tmax | °C | 600 | |
| yield strength | Rp0.2 | N/mm2 | 90 | |
| yield strength | Rp01.0 (10 000 h) | N/mm2 | 138 | for the similar 1.4307179 |
| thermal expansion coefficient | α | 1/K | 18 · 10−6 | |
6.4.2 Housing cylinder. The allowed pressure within the cell housing, as dictated by its material properties, can be calculated as180
with Rp1.0 denoting the yield stress and S = 1.5 the safety factor179,180. The wall thickness is s = 1.5 mm and the outer diameter da = 40 mm. As the cells will only be pressurised up to 2 bar under normal operation, the housing is safely dimensioned.
6.4.3 Tube. The tube extending through the lid capping the cell serves to connect a pressure sensor, thermocouple or similar. Using the same formula for cylindrical pressure vessels as for the cell housing, an outer diameter of 6 mm and a wall thickness 1 mm yields
which is, as previous, more than sufficient to contain the expected operating pressures.
6.4.4 Compression fittings. Compression fittings are used to attach a pressure sensor, bursting disk or thermocouple to the tube. According to the manual, for a 6 mm tube, a minimum wall thickness of 0.8 mm is required182. With a temperature reduction factor of 0.49 for AISI 304L (1.4306), the tube would support 211 bar at 600 °C. Most probably, it can be safely assumed that the fittings are designed for the same pressure.
6.4.5 Pressure sensor. Pressure sensors are sometimes used to monitor the cell pressure during heating and to detect leaks in the housing. According to the data sheet, they support 2.5 times the pressure of their full scale183. The typically used 4 bar sensors can therefore only support 10 bar before they might fail.
6.4.6 Welding. The housing is TIG welded by butt joints between bottom plate and the tube, and between the tube and the flange. As these weldseams are rather thick compared to the 1.5 mm tube, no failure is expected here.
The tube in the lid as well as the feedthroughs are laser welded in order to prevent damage from the feedthroughs. As the gap between laser welded parts needs to stay below 10 % of its wall thickness, and the feedthrough tubes are only 0.5 mm thick, a maximum gap width of 0.05 mm, i.e. very narrow tolerances are required for successful welding167. The final weldseam is usually 1 mm wide, with its depth depending on welding speed – possibly reaching 1–5 mm167. Obviously an accurate machining of the parts is necessary to meet the required tolerances. As the laser welding might be imperfect, a pressure test is recommended. Laser-welded parts should be handled with care.
6.4.7 Screws and Cu sealing. The lid of the cell is fixed with six M6 screws (ISO 4017, 1.4980). The latter need to deform the Cu sealing ring sufficiently to ensure the formation of a gas-tight seal, and need to be tightened such that they do not unfasten themselves while heating. However they also need to be removable after battery cycling. Finally, they should support an internal cell pressure of 18 bar, as explained in Section 4.5.6.
The correct dimensioning of screws starts by calculation of the preload force, accounting for cell pressure, deformation of the sealing, surface pressure and deformation of parts. Knowing the required force of the screw, the torque can be calculated. Finally, the static strength, surface pressure and sealing tightness safety factors are assessed184. This stress analysis involves several empirical formulae, which are well established for room temperature. However, when heating the cell to 600 °C, material properties such as yield strength or elastic modulus, among others, will change. Creeping of parts will occur, since the screw, housing and Cu have different thermal expansion coefficients, as well as being subject to a temperature gradient between the hot capsule interior and the colder exterior184,185. Although it is very challenging to correctly design the screws under such conditions, some general statements can be made. The high-temperature material (1.4980), with its yield strength of Rp0.2 = 380 N/mm2 at 650 °C186, allows for a force of 5 880 N in each screw. This is remarkable as an internal cell pressure of 18 bar would lead only to ca. 360 N. Under some assumptions, a force of 4.5 kN per screw is required for a sufficient deformation of the sealing ring and 3 kN to keep the seal tight over time. Tightening the screws with 100 % of its yield strength would lead to 6 Nm – which is a very small value compared to typical torques for M6 at room temperature of 7.7 - 26.8 Nm185. As the cell housing made of 1.4306 has a lower strength, the surface pressure of order 210 N/mm2 might be a problem.
Experimental trials have shown that a tightening torque of 5 Nm was not sufficient for proper sealing, and 10 Nm was hard to loosen again after a long-term cycling. Therefore, 8 Nm was identified as the appropriate average value to keep the cells gas-tight during normal cycling experiments. This is consistent with the calculated 6 Nm – which should still be sufficient for the screws to support an internal cell pressure of 18 bar.
6.4.8 Feedthrough. The approximate dimensions of the feedthroughs used, which are acquired from Kyocera164,166 or Alumina Systems, are shown in Figure 10. Typically, the insulator is made of Al2O3, the collars of Invar 42 (1.3917) and the conductor of Ni. Brazing between the ceramic and metal, as well as between the conductor and the collar is performed either with eutectic Ag-Cu braze (melting point 780 °C) or Au-Ni braze (melting point 950 °C)164,166. While the Ag-Cu braze is comparably cheap, it clearly reaches its limits at 600 °C – especially with small but rapid changes in temperature, the sealing will fail28.
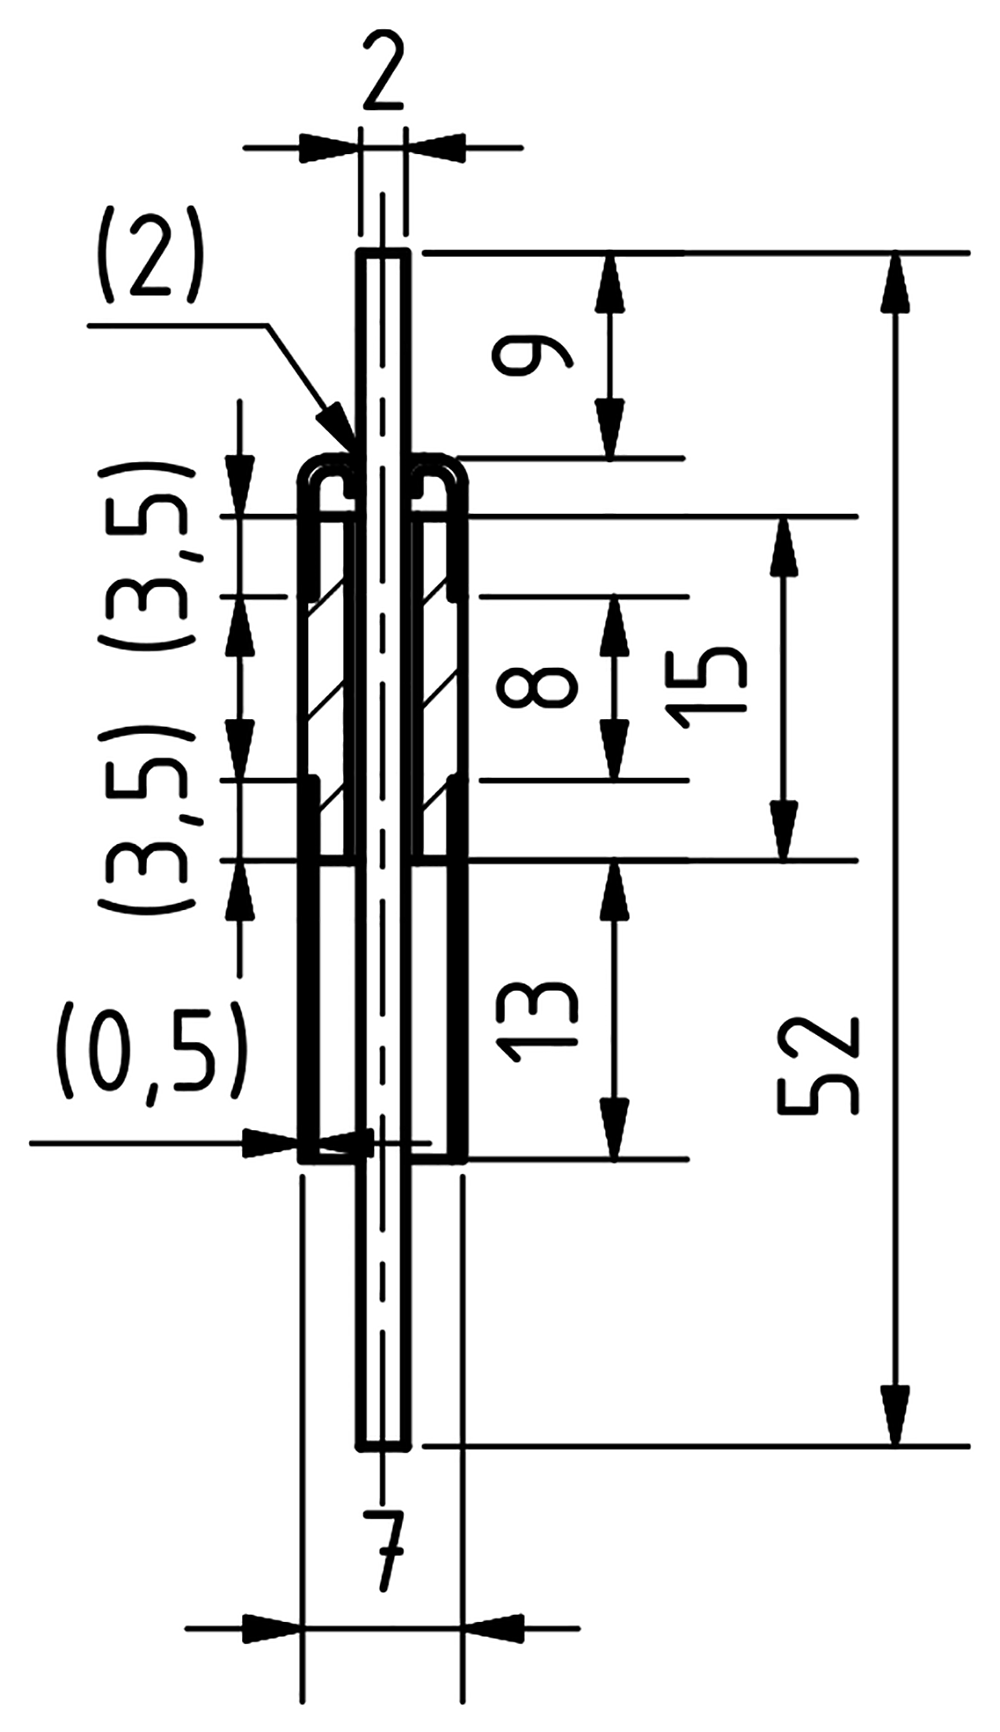
Figure 10. Dimensions of the Kyocera/Friatec feedthrough.
The values in brackets are estimated from the image in the manufacturers catalogue164.
A correct stress analysis of the feedthrough is challenging187. It must involve the strength of the ceramic, the thin Invar 42 collars and the three brazing points. While Invar 42 yield strengths48 are available at 600 °C, values for the brazes are scarce188. Apart from the internal cell pressure, forces may act via the current collector on the pin due to different thermal expansion – as explained in Section 4.6.2. The stress conditions will be complex, and might be better addressed with FEM simulations. Applying a lateral force by, for example, attaching an off-centred current collector will add an additional strain on the braze joint. Finally, also long-term stability of materials is a challenge since the parts of the feedthroughs are susceptible to various corrosive vapours187, e.g. Na attacks the ceramics as well as the braze while the conductive pin and collars could alloy with Zn. Cheaper Ag-Cu brazed devices are at 600 °C at their limit, and even Au-Ni brazed versions might fail if safe handling is not ensured and correct operational parameters, such as low heating/cooling rates, are not set. Overall, the sealing of the feedthrough is clearly the weakest point of the cell housing. Therefore, it is worthwhile to focus actively on improving the durability of the feedthroughs and investigating the various failure mechanisms in detail, both experimentally and numerically.








