Equilibrium structure of the complexes
To examine the molecular-level adsorption of CO2 and N2 on oxazole, we first located the CO2 and N2 molecules at the N1 site of oxazole (refer to Figure 1) and then we oriented them around it to explore all possible equilibrium structures. It's worth noting that the number of stable structures increases the likelihood of gas capture. Despite multiple attempts, the optimization results at the MP2/AVTZ level consistently converged toward one of the structures presented in Figure 1A and 1B, which characterize the complexes formed by oxazole with CO2 and N2.
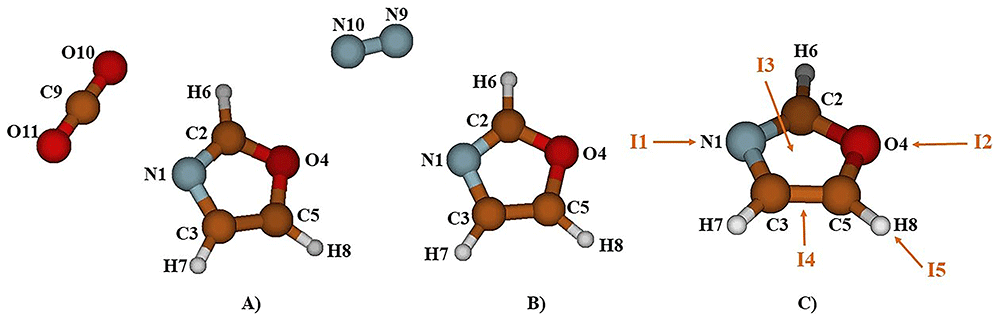
Figure 1.
The atom labeling of the complex Oxazole + CO2 (A), Oxazole + N2 (B) and Oxazole and the five principal complexation pathways, I1, I2, I3, I4, and I5 (C).
The study carried out at the MP2/AVTZ level on the Oxazole- CO2 complex reveals the existence of two stable structures labeled I1 and I2 (cf. Figure 2A, Table 1). In structure I1 (Er = 0.0 kcal/mol), identified as the global minimum, the bond is established through an interaction between the electron donor-acceptor (EDA) sites of CO2 and oxazole (RO10-H6 = 2.6956 Å and RC9-N1 = 2.8418 Å). However, in structure I2 (Er = 1.31 kcal/mol), the bond is maintained through a donor-acceptor electron exchange (EDA), where the oxygen atom of CO2 interacts with H8 of oxazole (RO10H8 = 2.7362 Å) and the carbon atom of CO2 interacts with the oxygen of oxazole (RC9-O4 = 2.8340 Å).
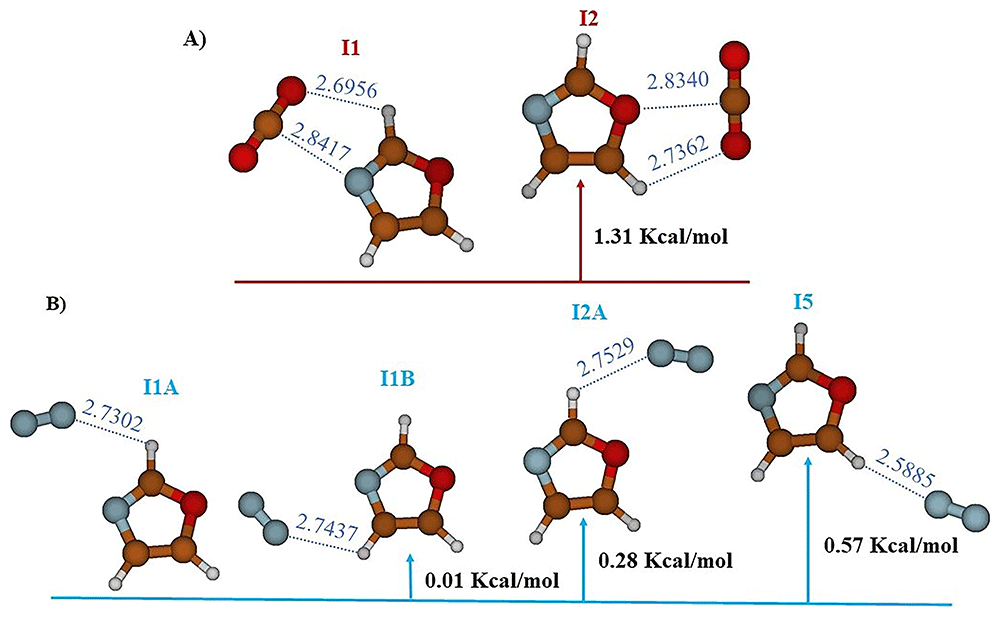
Figure 2.
The equilibrium geometries and the MP2/AVTZ relative energies of the oxazole +CO2 (A) and oxazole + N2 (B) Van der Waals complexes.
Table 1. Total electronic energies (E, in a.u.), relative energies (Er, in kcal/mol) and structural parameters (Distances in Å; angles in degrees) of the two equilibrium structures of the Oxazole-CO2 complexes calculated with MP2/aug-cc-pVTZ.
| Oxazole (C1) | I1 (C1) | I2 (C1) |
|---|
| | | | | |
|---|
| E | -245.639836 | E | -433.968056 | E | -433.965972 |
| | ER | 0.0 | ER | 1.31 |
| C2N1 | 1.2996 | C2N1 | 1.3011 | C2N1 | 1.2987 |
| C3N1 | 1.3862 | C3N1 | 1.3858 | C3N1 | 1.3869 |
| O4C2 | 1.3552 | O4C2 | 1.3531 | O4C2 | 1.3570 |
| C5C3 | 1.3596 | C5C3 | 1.3597 | C5C3 | 1.3593 |
| H6C2 | 1.0755 | H6C2 | 1.0757 | H6C2 | 1.0757 |
| H7C3 | 1.0752 | H7C3 | 1.0752 | H7C3 | 1.0752 |
| H8C5 | 1.0739 | H8N4 | 1.0739 | H8N4 | 1.0741 |
| C3N1C2 | 104.0 | C3N1C2 | 104.2 | C3N1C2 | 104.1 |
| O4C2N1 | 114.7 | O4C2N1 | 114.5 | O4C2N1 | 114.6 |
| C5C3N1 | 109.1 | C5C3N1 | 109.0 | C5C3N1 | 109.3 |
| H6C2N1 | 128.6 | H6C2N1 | 128.2 | H6C2N1 | 128.8 |
| H7C3N1 | 122.1 | H7C3N1 | 122.1 | H7C3N1 | 122.0 |
| H8C5O4 | 116.7 | H8C5O4 | 116.8 | H8C5O4 | 116.6 |
| CO2 | | | | |
| E | -188.321641 | | | | |
| CO | 1.1702 | O10C9 | 1.1718 | O10C9 | 1.1709 |
| | O11C9 | 1.1686 | O11C9 | 1.1690 |
| <OCO | 180.0 | <OCO | 177.6 | <OCO | 179.3 |
| | O10H6 | 2.6956 | O10H8 | 2.7362 |
| | O10H6C2 | 104.2 | O10H8C5 | 111.2 |
| | C9O10H6 | 114.7 | C9O10H8 | 113.6 |
| | C9N1 | 2.8418 | C9O4 | 2.8340 |
| | C9N1C2 | 106.8 | C9O4C2 | 142.8 |
| | O10C9N1 | 86.1 | O10C9O4 | 85.8 |
Additionally, the study of the complex between N2 and oxazole, still at the MP2/AVTZ level, revealed the existence of four adsorption sites as outlined in Figure 2B and Table 3. These sites are labeled as follows: I1A (Er = 0.0 kcal/mol), I1B (Er = 0.01 kcal/mol), I2A (Er = 0.28 kcal/mol), and I5 (Er = 0.57 kcal/mol). These distinct structures depict various stable configurations of the N2-oxazole complex. Predominantly, the key interactions observed in the stable structures occur where hydrogen bonds link N2 to oxazole. Additionally, the equilibrium distances within the van der Waals systems RN9Hx (X=6,7,8) exhibit the following variations: RN9H6 = 2.7302 Å for I1A, RN9H7 = 2.7437 Å for I1B, RN9H6 = 2.7529 Å for I2A, and RN9H8 = 2.5885 Å for I5.
Table 1 and Table 3 present the structural parameters at the MP2/AVTZ level, while Table 2 and Table 4 provide the MP2/AVTZ harmonic frequencies for each examined complex. The parameters of the van der Waals aggregates are compared to those of the corresponding isolated components.
Table 2. Harmonic fundamental frequencies (ω, in cm-1) of CO2, oxazole, and the two equilibrium geometries of the oxazole-CO2 complexes calculated at the MP2/AVTZ level of theory.
| ω |
|---|
| Oxazole | CO2 | I1 | I2 |
|---|
| ω1 | a | 3330 | | | a | 3331 | a | 3330 |
| ω2 | 3311 | | | 3312 | 3309 |
| ω3 | 3299 | | | 3300 | 3299 |
| ω4 | | σu | 2402 | 2402 | 2404 |
| ω5 | 1546 | | | 1546 | 1547 |
| ω6 | 1508 | | | 1506 | 1507 |
| ω7 | 1355 | | | 1355 | 1354 |
| ω8 | | σg | 1326 | 1327 | 1328 |
| ω9 | 1272 | | | 1269 | 1270 |
| ω10 | 1185 | | | 1189 | 1182 |
| ω11 | 1141 | | | 1144 | 1138 |
| ω12 | 1109 | | | 1111 | 1108 |
| ω13 | 1086 | | | 1086 | 1082 |
| ω14 | 915 | | | 917 | 917 |
| ω15 | 905 | | | 909 | 904 |
| ω16 | 864 | | | 865 | 868 |
| ω17 | 827 | | | 836 | 827 |
| ω18 | 763 | | | 766 | 771 |
| ω19 | 665 | | | 667 | 664 |
| ω20 | | π | 659 | 662 | 660 |
| ω21 | | π | 659 | 637 | 651 |
| ω22 | 628 | | | 628 | 626 |
| ω23 | | | | 132 | 100 |
| ω24 | | | | 88 | 80 |
| ω25 | | | | 52 | 39 |
| ω26 | | | | 44 | 38 |
| ω27 | | | | 29 | 21 |
Table 3. Total electronic energies (E, in a.u.), relative energies (Er, in kcal/mol) and structural parameters (Distances in Å; angles in degrees) of the four equilibrium structures of the Oxazole-N2 complex calculated with MP2/aug-cc-pVTZ.
| Oxazole (C1) | I1A (C1) | I1B (C1) | I2A (C1) | I5 (C1) |
|---|
| | RNH | 2.7302 | RNH | 2.7437 | RNH | 2.7529 | RNH | 2.5885 |
|---|
| E | -245.639836 | E | -355.007379 | E | -355.007363 | E | -355.006923 | E | -355.006474 |
| | ER | 0.0 | ER | 0.01 | ER | 0.28 | ER | 0.57 |
| C2N1 | 2.9962 | C2N1 | 1.3003 | C2N1 | 1.30006 | C2N1 | 1.2997 | C2N1 | 1.2998 |
| C3N1 | 1.38622 | C3N1 | 1.3860 | C3N1 | 1.3867 | C3N1 | 1.3859 | C3N1 | 1.3863 |
| O4C2 | 1.35519 | O4C2 | 1.3549 | O4C2 | 1.3547 | O4C2 | 1.3565 | O4C2 | 1.3550 |
| C5C3 | 1.35957 | C5C3 | 1.3597 | C5C3 | 1.3597 | C5C3 | 1.3597 | C5C3 | 1.3599 |
| H6C2 | 1.07554 | H6C2 | 1.0754 | H6C2 | 1.0756 | H6C2 | 1.0752 | H6C2 | 1.0755 |
| H7C3 | 1.07521 | H7C3 | 1.0752 | H7C3 | 1.0751 | H7C3 | 1.0752 | H7C3 | 1.0752 |
| H8C5 | 1.07390 | H8C5 | 1.0739 | H8C5 | 1.07388 | H8C5 | 1.0733 | H8C5 | 1.0738 |
| C3N1C2 | 103.99 | C3N1C2 | 104.0 | C3N1C2 | 104.0 | C3N1C2 | 104.0 | C3N1C2 | 104.0 |
| O4C2N1 | 114.70 | O4C2N1 | 114.7 | O4C2N1 | 114.7 | O4C2N1 | 114.6 | O4C2N1 | 114.7 |
| C5C3N1 | 109.13 | C5C3N1 | 109.1 | C5C3N1 | 109.1 | C5C3N1 | 109.1 | C5C3N1 | 109.2 |
| H6C2N1 | 128.59 | H6C2N1 | 128.4 | H6C2N1 | 128.6 | H6C2N1 | 128.8 | H6C2N1 | 128.7 |
| H7C3N1 | 122.09 | H7C3N1 | 122.1 | H7C3N1 | 122.0 | H7C3N1 | 122.1 | H7C3N1 | 122.0 |
| H8C5O4 | 116.75 | H8C5O4 | 116.9 | H8C5O4 | 116.8 | H8C5O4 | 116.8 | H8C5O4 | 116.7 |
| N2 | | | | | | | | |
| E | -109.364800 | | | | | | | |
| NN | 1.11401 | NN | 1.11387 | | 1.11408 | | 1.11396 | | 1.11401 |
| | N9H6 | 2.7302 | N9H7 | 2.7437 | N9H6 | 2.7529 | N9H8 | 2.5885 |
| | N9H6C2 | 109.2 | N9H7C3 | 113.3 | N9H6C2 | 114.9 | N9H8C5 | 167.7 |
| | N10N9H6 | 147.3 | N10N9H7 | 144.1 | N10N9H6 | 114.9 | N10N9H8 | 172.1 |
Table 4. Harmonic fundamental frequencies (ω, in cm-1) of N2, oxazole and the four equilibrium geometries of the oxazole-N2 complexes calculated at the MP2/AVTZ level.
| Ω |
|---|
| Oxazole | N2 | I1A | I1B | I2A | I5 |
|---|
| ω1 | a | 3330 | | | a | 3330 | a | 3330 | a | 3329 | a | 3336 |
| ω2 | 3310 | | | 3314 | 3310 | 3316 | 3310 |
| ω3 | 3298 | | | 3298 | 3301 | 3298 | 3299 |
| ω4 | | σg | 2187 | 2186 | 2185 | 2186 | 2186 |
| ω5 | 1545 | | | 1544 | 1545 | 1545 | 1546 |
| ω6 | 1507 | | | 1506 | 1507 | 1506 | 1508 |
| ω7 | 1355 | | | 1354 | 1354 | 1355 | 1356 |
| ω8 | 1271 | | | 1271 | 1271 | 1271 | 1273 |
| ω9 | 1185 | | | 1186 | 1186 | 1182 | 1186 |
| ω10 | 1141 | | | 1142 | 1140 | 1141 | 1141 |
| ω11 | 1109 | | | 1109 | 1110 | 1108 | 1113 |
| ω12 | 1085 | | | 1086 | 1086 | 1085 | 1085 |
| ω13 | 915 | | | 914 | 915 | 914 | 915 |
| ω14 | 904 | | | 905 | 904 | 904 | 905 |
| ω15 | 863 | | | 864 | 870 | 865 | 866 |
| ω16 | 826 | | | 834 | 827 | 833 | 827 |
| ω17 | 763 | | | 765 | 764 | 763 | 784 |
| ω18 | 664 | | | 666 | 665 | 665 | 665 |
| ω19 | 627 | | | 628 | 628 | 627 | 630 |
| ω20 | | | | 84 | 82 | 77 | 58 |
| ω21 | | | | 63 | 58 | 54 | 57 |
| ω22 | | | | 46 | 46 | 42 | 49 |
| ω23 | | | | 40 | 43 | 26 | 22 |
| ω24 | | | | 21 | 20 | 13 | 9 |
During the formation of weak intramolecular bonds, the structure of the oxazole ring and N2 undergoes minimal changes (see Table 1 and Table 3). However, a significant deformation is observed in the CO2 molecule, resulting in the loss of its symmetry. This deformation is particularly pronounced in the oxazole-CO2 complexes I1 and I2 (see Table 1), where the C-O bond in CO2 tends to shorten (O11C9: 1.1686 Å for I1, 1.1690 Å for I2), while the distance O10C9 is elongated (1.1718 Å for I1, 1.1709 Å for I2), compared to free CO2 (CO=1.1702 Å). Additionally, the <OCO angle is bent away from the linear configuration of a free CO2 molecule, measuring 177.6 degrees for I1 and 179.3 degrees for I2, respectively. This deformation is attributed to the formation of the van der Waals complexes between CO2 and oxazole, leading to electron redistribution and strengthening of the C-O bond.
Harmonic frequencies were computed to ensure minimal energy for all structures. Notably, in Table 2 and Table 4, certain low frequencies (5 frequencies for Oxazole-CO2, ω23-ω27, and for Oxazole-N2, ω20-ω24) emerge, which were not observed for the monomers. This situation allows for the use of a Born-Oppenheimer-type approach, which distinguishes between intramolecular and intermolecular vibrations. Intermolecular vibrations more closely resemble hindered rotations or tunneling motions. Generally, there is a strong coupling between different intermolecular degrees of freedom. The deformation vibrations of O–C–O in complexes I1 and I2 occur at frequencies of 637 cm-1 and 651 cm-1, respectively. These modes experience significant frequency shifts compared to the CO2 monomer, approximately 8 cm−1 for complex I2 an 22 cm-1 for complex I1. Furthermore, the symmetric and antisymmetric intermolecular O-C stretching modes with frequencies ω8 = 1328 cm-1 and ω4 = 2402 cm-1 for complex I2 have shifted by 2 cm-1 from frequencies of ω8 = 1326 cm-1 and ω4 = 2404 cm-1 for the CO2 monomer. In the oxazole-N2 complex, the stretching mode of N-N is not influenced by the formation of the hydrogen bond between the N of N2 and the H of oxazole. Thus, the intermolecular stretching vibrations H..N–N(ω21) in the optimal structure are observed at frequencies of 63 cm−1, 58 cm−1, 54 cm−1, and 57 cm−1 for I1A, I1B, I2A, and I5, respectively.
Binding energies
Two body complexes type oxazole-CO2 and oxazole-N2
The binding energy is crucial for understanding, predicting, and enhancing the performance of adsorbent materials in greenhouse gas and pollutant capture processes. It determines the interaction between the host and the guest, as well as the properties of the adsorbent material. A more negative adsorption energy generally indicates a stronger adsorption interaction. For this reason, the binding energies of all previously mentioned stable forms, are computed via the MP2/AVTZ approach and including the zero-point vibrational energy (ZPVE) along with as well as the Boys and Bernardi correction (BSSE), are listed in Table 5. Our calculations indicate that oxazole is energetically favored as an adsorbent for both our adsorbates although CO2 shows a higher capacity to bind oxazole rings. The range of CO2 binding energies spans from -4.13 to -2.82 kcal/mol, while for N2, the energies range from -1.77 to -1.19 kcal/mol. Based on the adsorption energies, the nitrogen site of the oxazole is the most stable site for CO2 adsorption, and Hydrogen 6 is the most stable site for N2 adsorption. The zero-point vibrational energy (ZPVE) correction ranges from 0.39 to 0.51 kcal/mol for the CO2 complexes and from 0.32 to 0.39 kcal/mol for the N2 complexes. On the other hand, the BSSE correction is between 0.02 and 0.09 kcal/mol for CO2 and 0.05 kcal/mol for N2.
Table 5. MP2/AVTZ binding energies of the oxazole complexes (Eb, kcal/mol).
| Complex | Eint | Eint +BSSE | Eint +ZPVE | Eint +BSSE +ZPVE |
|---|
| Oxazole-CO2 | | | | |
| I1 | -4.13 | -4.22 | -3.62 | -3.71 |
| I2 | -2.82 | -2.84 | -2.43 | -2.45 |
| Oxazole-0N2 | | | | |
| I1A | -1.77 | -1.72 | -1.38 | -1.33 |
| I1B | -1.76 | -1.71 | -1.39 | -1.37 |
| I2A | -1.48 | -1.43 | -1.16 | -1.11 |
| I5 | -1.19 | -1.14 | -0.85 | -0.8 |
Three body complexes type CO2-Oxazole-N2
Since this article focuses on the CO2 separation properties relative to N2, the most abundant gas in Earth's atmosphere (78.084%)53, our aim is to understand, at the molecular level, whether oxazole-based (MOFs) can simultaneously capture two different gases and how the CO2 capture capacity varies in the presence of N2, which a third body can alter the interaction between two bodies. To achieve this, we performed geometry optimizations on three-body systems, namely N2-oxazole-CO2, starting from various configurations where CO2 and N2 occupy the equilibrium positions of the two-body systems, oxazole-CO2 and oxazole-N2. We then examined the capture of the second gas. The resulting structures are presented in Table 6 and illustrated in Figure 3. In Figure 3A, the equilibrium structures of three systems are shown, obtained using the equilibrium configurations of the oxazole-CO2 complex and rotating N2 around oxazole. However, in Figure 3B, the equilibrium structures of three other systems are displayed, obtained using the equilibrium configurations of the oxazole-N2 complex and rotating CO2 around oxazole. The structures in Figure 3A are identified by the symbol "InIm," where "In" and "Im" respectively represent the main complexation pathways (I1, I2, I3, I4, and I5) of CO2 and N2 with oxazole (Figure 1C), while in Figure 3B, they are identified by the symbol "ImIn". The binding energies in Table 6 are determined by combining the AVDZ basis set with MP2 correlation, which is an appropriate method for three-body systems. We opted for AVDZ over AVTZ due to the size of the systems, which makes the use of AVTZ impossible. These values are then compared to those of two-body complexes (oxazole+X, where X= CO2, N2) calculated using the same level of theory. It is observed that the presence of a second gas appears to be beneficial, thereby enhancing the oxazole's ability to capture both CO2 and N2 without causing competition.
Table 6. MP2/AVDZ binding energies of the two-body and three-body complexes (Eb, kcal/mol).
| Complex | Eint | Eint +ZPVE | Complex | Eint | Eint +ZPVE |
|---|
| Oxazole-CO2 | | | Oxazole-CO2+N2 | | |
| I1 | -4.48 | -3.95 | I1I5 | -5.94 | -5.13 |
| I2 | -3.13 | -2.74 | I1I2A | -6.18 | -5.40 |
| | | I1AI2B | -6.23 | -5.44 |
| | | I1AI2B | -6.57 | -5.70 |
| | | I1AI1A | -6.57 | -5.71 |
| | | I1AI3 | -8.40 | -7.31 |
| Oxazole-N2 | Oxazole-N2 +CO2 |
| I1A | -1.91 | -1.51 | I1AI1A | -4.85 | -4.09 |
| I1B | -1.94 | -1.56 | I1A I4 | -3.93 | -3.26 |
| I2A | -1.61 | -1.28 | I1B I4 | -4.81 | -3.98 |
| I5 | -1.40 | -1.03 | I2A I4 | -3.60 | -2.99 |
| | | I1B I2 | -5.03 | -4.354 |
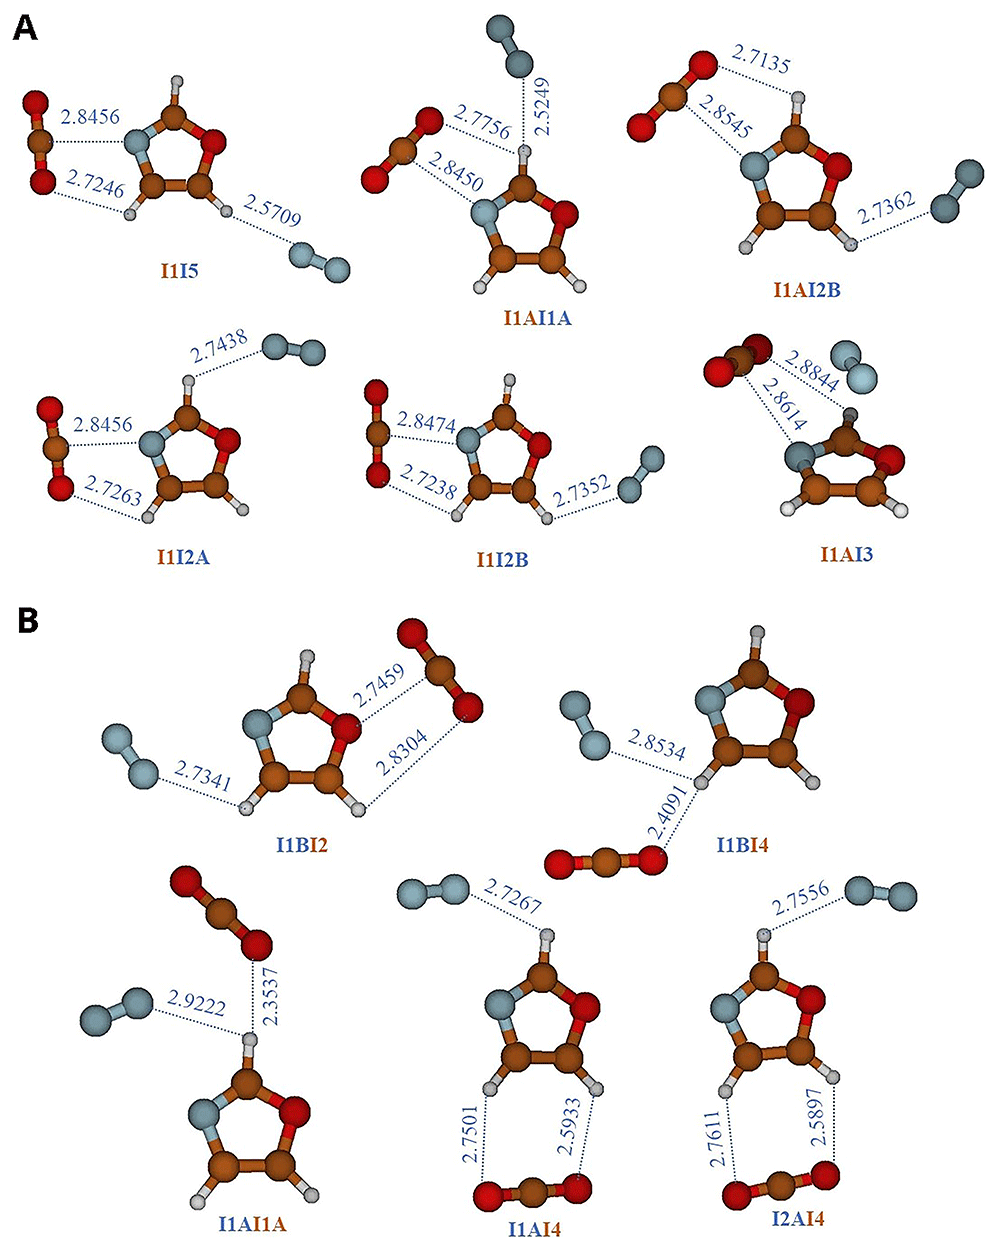
Figure 3. Three-body complexes composed by CO2-oxazole-N2.
A) CO2-oxazole + N2 complexes, they are labeled using the symbol ‘‘InIm”.‘‘n” denotes the location of CO2 and ‘‘m” refers to the position of N2. B) N2-oxazole + CO2 complexes, they are labeled using the symbol ‘‘ImIn”.‘‘ m ” denotes the location of N2 and ‘‘n” refers to the position of CO2.
The interaction energies of the three-body systems increase and are higher than those observed in the two-body oxazole + CO2 complexes. In the case of the oxazole-N2+CO2 complexes, the binding energy ranges between -3.60 kcal/mol and -5.03 kcal/mol, compared to the two-body systems, oxazole+N2, whose binding energies are respectively between -1.40 kcal/mol and -1.94 kcal/mol. So, for the oxazole-CO2+N2 complexes, the binding energy ranges between -5.94 kcal/mol and -8.40 kcal/mol, compared to the two-body systems oxazole+CO2, which exhibit binding energies ranging from -3.13 kcal/mol to -4.48 kcal/mol. This is explained by the formation of an additional intramolecular bond between the molecules of the three systems (π-stacking and Van der Waals interactions), which can stabilize the systems. The inclusion of the ZPVE vibrational correction results in a decrease in the energy quantities of three systems, ranging from -0.49 kcal/mol to -1.09 kcal/mol.
Oxa@Au6, Cu6 and Zn3O3 and CO2/N2–Oxa@Au6, Cu6 and Zn3O3
Recently, various technologies have emerged for CO2 capture, utilizing methods such as chemisorption and physisorption, due to the development of nanodevices such as metal nanoclusters and metal oxide nanoclusters54. These nanocomposite materials have found wide-ranging applications, including energy storage55, drug delivery56, and the adsorptive removal of diverse pollutants from contaminated environments57. These applications benefit from the materials' high stability, ease of synthesis, and ability to be modulated into various shapes and sizes. This section focuses on investigating the mechanisms of adsorption and activation of CO2 and N2 by metal clusters, Au6 and Cu6, as well as on the metal oxide Zn3O3. To bolster the CO2 and N2 adsorption capabilities, this choice of clusters was motivated by the tendency of clusters with an even number of particles to demonstrate higher stability compared to their odd-sized counterparts, along with possessing a larger HOMO-LUMO gap58–60. Moreover, these clusters exhibit a rapid increase in binding energies with increasing cluster size. Notably, these nanoparticles possess the ability to bind with various biological or medicinal molecules containing relevant heteroatoms like nitrogen and oxygen, all while exhibiting low toxicity61. The CO2/N2–Oxa@Au6, Cu6, or Zn3O3 complexes were initially formed by attaching the stable structures of two distinct complexes, namely I1 (Oxa@ CO2) and I1A (Oxa@ N2), to the most stable form of Au6, Cu6, and Zn3O3 (a planar triangle with D3h symmetry), using electron-rich positions such as N59,60,62,63. Harmonic vibration frequencies were also calculated at the same theoretical level to identify the obtained structures as local minima. Figure 4 displays the optimized structures for Oxa@Au6, Cu6 and Zn3O3 and for CO2/N2–Oxa@Au6, Cu6 and Zn3O3. This figure shows that in the Oxazole@cluster structure, the gold, copper, or zinc atoms situated at the apex of the octahedron form a covalent bond interaction at the O4 positions of the oxazole molecule. As seen in Figure 4, both gases are physically adsorbed, and the I1 and I1A structures of the Oxa@CO2 and Oxa@N2 complexes are moderately perturbed by the presence of the cluster. Consequently, in the structure I1@Au6 and I1@Cu6, the hydrogen bond between the oxygen O10 and H6 of the oxazole breaks, and a new hydrogen bond forms between O11 and H7 of the oxazole. The calculated MP2/AVDZ/ LanL2DZ Binding energies (BEs) of the CO2/N2–Oxa@Au6,Cu6 and Zn3O3 complexes are listed in Table 7. Our results show that metallic and metal oxide clusters favor the adsorption of CO2 and N2 gases. In hexametallic clusters, the adsorption energies (Eb) reach a maximum with the Cu6 cluster, at -6.46 kcal/mol for CO2 and -10.25 kcal/mol for N2. However, the Au6 and Zn3O3 clusters exhibit similar binding energy values: Eb(Au6@I1) = -4.58 kcal/mol and Eb(Zn3O3@I1) = -4.56 kcal/mol for CO2, and Eb(Au6@I1) = -2.19 kcal/mol and Eb(Zn3O3@I1) = -2.22 kcal/mol for N2. This is highly advantageous as it allows for the replacement of expensive gold clusters with more cost-effective materials such as Zn3O3.
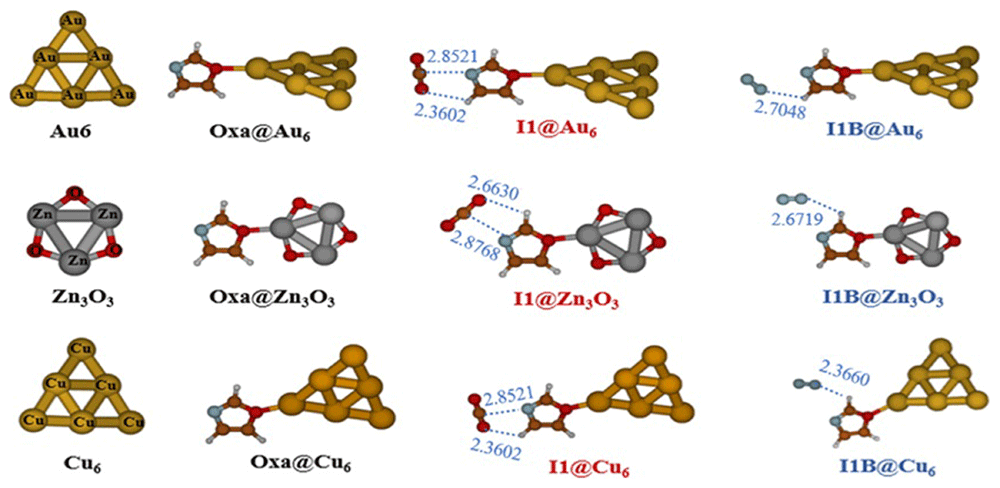
Figure 4. Optimized structures of Oxa@Au6, Cu6 and Zn3O3 and of CO2/N2Oxa@ Au6,Cu6 and Zn3O3 complexes at MP2/ AVDZ/LanL2DZ level of theory.
Table 7. MP2/AVDZ/LanL2DZ binding energies of the CO2/N2@–Oxa@Au6, Cu6 and Zn3O3 complexes (Eb, kcal/mol).
| | Au6 | Cu6 | Zn3O3 |
|---|
| Complexes | I1 | I1 | I1 | I1 |
|---|
| Oxazole@CO2 | -4.48 | -4.58 | -6.46 | -4.56 |
| Oxazole@N2 | -1.77 | -2.19 | -10,25 | -2.22 |
Adsorption of CO2 and N2 in the metal and metal oxide surfaces (111)
The Molecular simulation (Monte Carlo) was conducted to examine the adsorption of CO2 and N2 on Au, Cu, and ZnO (111) surfaces. The choice of Au (111) and Cu (111) surfaces is motivated by the interest in the interaction of small molecules Au (111) surface. Furthermore, adsorption on noble metals (such as Cu, Ag, and Au) is considered a promising avenue for materials in future technologies and applications64, however, the selection of ZnO aims to ensure high efficiency in the low-cost adsorption of pollutants. The investigation commenced with optimizing the geometries of the Oxa@CO2 and Oxa@N2 complexes using the COMPASS II force field in the Forcite Module. Subsequently, we constructed three-layer models for each surface (Au(111), Cu(111), and ZnO(111)). In the Adsorption Locator Module, we selected one of these surfaces and added the adsorbate, either Oxa@CO2 or Oxa@N2, before running the calculations. This process was repeated for all surfaces. The optimized geometries and their corresponding adsorption energies are depicted in the Figure 5. The calculations show spontaneous physisorption of CO2 and N2. Additionally, the ZnO surface is the most favorable for N2 adsorption compared to CO2, with an adsorption energy of -151.62 kcal/mol for N2, while for CO2, it reaches -148.01 kcal/mol. However, for the two other surfaces, Cu (111) and Au (111), the adsorption of CO2 is more favorable than that of N2, with respective adsorption energy values of -36.97 kcal/mol and -32.88 kcal/mol for Au, and -22.27 kcal/mol and -19.52 kcal/mol for Cu (111). Overall, our calculations demonstrate that the surfaces of gold (Au), copper (Cu), and zinc oxide (ZnO) are capable of adsorbing N2 and CO2 from gas mixtures. Moreover, ZnO and Cu offer advantages in terms of adsorption capacity for both gases, without introducing additional cost-related issues.
Sorption isotherms
The adsorption isotherms of oxazole@CO2 and oxazole@N2 on Au (111), Cu (111), and ZnO (111) surfaces were calculated with the GCMC65,66 procedure implemented in the sorption module in BIOVIA Materials Studio. These simulations were carried out in the μVT ensemble, where the chemical potential (μ), volume (V), and temperature (T) are held constant, allowing the number of gas molecules in the system to fluctuate naturally in response to the external reservoir. All simulations were performed at 298 K over a pressure range of 1000 to 10,000 kPa. The chemical potential corresponding to each pressure point was determined using the Peng–Robinson equation of state, which accounts for non-ideal gas behavior. The Metropolis algorithm was applied to sample system configurations through stochastic insertion, deletion, translation, and rotation of molecules, ensuring ensemble consistency. Long-range electrostatic interactions between the adsorbates and the surfaces were calculated using the Ewald summation method with an energy accuracy of 0.001 kcal/mol, while van der Waals interactions were modeled using the atom-based method with a cutoff distance of 12.5 Å. Each simulation consisted of 10,000 loading steps for system equilibration and 100,000 production steps to collect statistically meaningful adsorption data. This computational approach provides detailed insight into the pressure-dependent adsorption behavior of oxazole-functionalized gases on metallic
The GCMC adsorption isotherm is a key tool for evaluating and quantifying the gas adsorption capacity on the hosts. The adsorption isotherms of Oxazole@CO2 and Oxazole@N2 on Au (111), Cu (111), and ZnO (111) surfaces, presented in Figure 6, reveal that all three surfaces generally exhibit better adsorption performance for CO2 compared to N2.
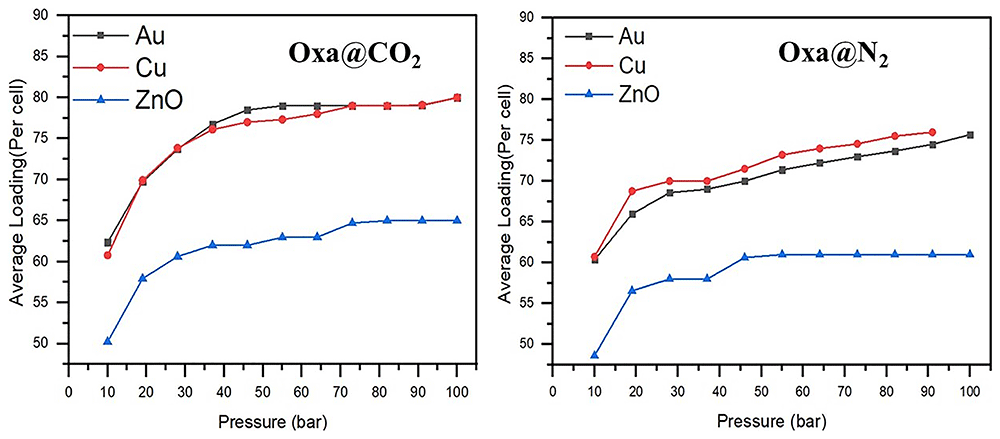
Figure 6. Calculated Oxa@CO2 and Oxa@N2 adsorption isotherms at 298 K on Au (111), Cu (111), and ZnO (111) surfaces.
For instance, at a pressure of 19 bars, the average loading of Oxazole@CO2 is 57 on ZnO (111), and 69 on both Cu (111) and Au (111), whereas for Oxazole@N2, the values are 56.6 for ZnO (111), 68.8 for Cu (111), and 65.9 for Au (111). When the pressure increases to 91 bars, the number of CO2 molecules adsorbed reaches 65 on ZnO (111), and 79 on both Cu (111) and Au (111), while for Oxazole@N2, the values reach 61, 74.5, and 76, respectively.
In the case of Oxazole@CO2, the ZnO (111) surface appears to reach saturation adsorption equilibrium at a relatively high pressure, around 73 bars. In contrast, for Oxazole@N2, equilibrium seems to be reached earlier, around 46 bars.
Given the trend of the adsorption isotherms, it is likely that the Au (111) and Cu (111) surfaces only reach adsorption equilibrium at around 55 bars for gold and 73 bars for copper in the case of Oxazole@CO2. On the other hand, for Oxazole@N2, adsorption continues to increase significantly with rising pressure. Therefore, the Cu surface, in particular, is expected to offer even greater adsorption capacity for both CO2 and N2 at higher pressures.