1 Introduction
She-oaks (Fam. Casuarinaceae) comprise a group of trees and small shrubs whose natural distribution ranges from SE Asia to Melanesia (Johnson & Wilson, 1989), where they usually behave as pioneer plants on nutrient-poor soils (Dawson, 2007; Jaffré et al., 1994). This group of plants has a characteristic vegetative morphology. Thus, the leaves in Casuarinacaceae are reduced to millimetrical laminae, and photosynthesis is performed by deciduous branchlets (Dörken & Parsons, 2017; Johnson & Wilson, 1989). This trait, which has been interpreted as being beneficial for growth in nutrient-poor environments (Dörken & Parsons, 2017), is part of an adaptation system for the efficient acquisition and conservation of nutrients: Casuarinaceae are actinorhizal plants that form symbiotic relationships with N2-fixing Frankia actinobacteria (Normand & Fernández, 2019), with plants from genera Casuarina and Allocasuarina also forming symbioses with ectomycorrizal fungi (Reddell et al., 1986); members of the family possess cluster roots that are developed under P and Fe deficits (Diem et al., 2000).
In their native range, Casuarinaceae are potentially useful for restoring degraded soils, including mine soils (McCoy, 1998; Quintela-Sabarís et al., 2019). However, Casuarinaceae (mainly species of the genus Casuarina), which are grown in tropical and subtropical areas in Africa and America for multiple purposes (timber and wood production, dune fixation, revegetation of polluted land, and wind barriers), have become invasive in many areas (Diagne et al., 2013; Valdés, 2007).
The shed branchlets of Casuarinaceae are degraded slowly and form thick layers of litter beneath the tree canopies (Jaffré et al., 1994; Quintela-Sabarís et al., 2019). These litter layers may impede recolonization of the site by other species due to several processes such as physical limitation (i.e., only very small seeds can germinate in the litter), the release of allelopathic compounds during litter decomposition (Xu et al., 2022), and the creation of fire-prone conditions that impede the ecological succession to more mature systems (Barritt & Facelli, 2001; Hata et al., 2010a; McCoy et al., 1996; McCoy et al., 1999). Thus, the recalcitrance of the litter may limit the utility of these plants for purposes of restoration unless new approaches to increasing the decomposition of Casuarinaceae litter are developed.
Litter decomposition is mainly driven by microorganisms, whose activity is regulated by soil macroorganisms (i.e., soil fauna and plant roots) (Lavelle & Spain, 2001). Earthworms (Annelida, Clitellata, Oligochaeta) play a main role in soil functioning (Coleman & Wall, 2015) and they are often referred to as soil engineers, based on their ability to alter their surrounding soil environment through a variety of activities, such as grazing, burrowing and particle ingestion (Aira & Domínguez, 2011). Organic matter (OM) composition and bacterial communities are highly modified after passage through earthworms’ guts by fragmentation and digestion (i.e. gut-associated processes or GAPs) and the released casts suffer ageing processes that modify the bacterial communities around them (cast-associated processes or CAPs) (Aira & Domínguez, 2011; Domínguez et al., 2019; Gómez-Brandón et al., 2011; Gómez-Brandón & Domínguez, 2014). Comminution, burrowing and casting increase the OM surface that is available for the decomposing activity of the microorganism communities, resulting in an overall stimulation of organic matter decomposition (Blouin et al., 2013; Lavelle & Spain, 2001).
The abundance of different groups of microarthropods, such as collembolans and mites, can accelerate the litter mass loss based on their grazing activity, promoting mechanical fragmentation (Ke et al., 2005; Yang et al., 2012). These animal groups can be in turn affected by changes in litter composition and transformation due to the decomposition process, such as the release of leachates (Chomel et al., 2020), or by the indirect interactions with earthworms that compete for resources or modify the microbial communities that serve as food for certain animal groups (Domínguez, 2004; Jacques et al., 2021; Monroy et al., 2008; Monroy et al., 2011), having effects on the long-term decomposition of litter.
Epigeic (i.e., ‘litter-dwelling’) earthworms can colonize organic waste, and some species have traits that favour their use in vermicomposting (e.g. high rates of consumption of organic matter, wide tolerance to environmental factors, high-reproductive rates, among others) (Domínguez & Edwards, 2010). To date, vermicomposting systems have been applied to the decomposition and stabilization of different organic residues, e.g.(Domínguez, 2004; Ferraz Ramos et al., 2022; Gómez-Brandón & Domínguez, 2014; Sánchez-Hernández & Domínguez, 2019); the ubiquitous Eisenia andrei (Bouché) is the most commonly used earthworm species in all climates, from temperate areas to tropical or equatorial regions (Domínguez, 2004; Domínguez, 2023; Domínguez & Edwards, 2010; Domínguez et al., 2019; Ferraz Ramos et al., 2022).
In order to explore bio-based approaches for accelerating the decomposition of Casuarinaceae litter, we have performed a vermicomposting litterbag experiment using plant material and the earthworm E. andrei. Previous experiments have shown that this earthworm species (and associated microorganisms) is able to decompose recalcitrant plant material rich in secondary compounds (Domínguez et al., 2014; Domínguez et al., 2018; Quintela-Sabarís et al., 2022), as is the case with tannin-rich Casuarinaceae litter (Okuda et al., 1983). We assessed the effect of vermicompost and earthworm + vermicompost on biomass loss and changes in the chemical composition of Casuarina equisetifolia litter over a period of 40 weeks.
2 Methods
2.1 Plant material
Branches of Casuarina equisetifolia were collected in December 2021 from a recently felled adult tree in Lourizán Forestry Research Centre in Pontevedra (Spain) (coordinates 42.4098 º N, 8.6674 º W). At the time of sampling, the photosynthetic branchlets were still green. A sample of around 20 kg of C. equisetifolia branches was transported to the greenhouse belonging to the Animal Ecology research group on the University of Vigo Campus (Vigo, Spain). The branches were left to air dry in the greenhouse until having reached a constant weight.
Afterwards, 3 kg of the dry C. equisetifolia branches (hereafter, litter) were cut into small pieces of length 1 to 5 cm. The litter was mixed thoroughly and used to fill 36 litterbags (dimensions 10*10 cm, mesh-size 1 mm, 10 g DW of litter per bag). It is indicated that mesh sizes greater than 2 mm should be used to allow the entry of macrofauna (i.e. earthworms) (Karberg et al., 2008), but prior to the experiment we checked that this mesh size allowed the entry of earthworms and smaller soil fauna into the litterbag with minimum litter loss.
2.2 Vermicompost and earthworms
We collected 10 kg of vermicompost produced in the facilities of the Animal Ecology research group (University of Vigo Campus, Vigo, Spain). The vermicompost was produced from grape marc (skins, stalks and seeds) of the white grape variety Albariño, which was processed by E. andrei in an industrial-sized metal vermirreactor (dimensions 5.8*0.49*1.46 m). On close observation, this vermicompost was found to consist of small woody material (grape seeds, stalks) mixed with finer material composed by disaggregated earthworm casts and a variety of soil fauna (e.g., collembola, acari, pseudoscorpions, millipedes, insects) and individual E. andrei at different stages of development. We carefully screened the vermicompost to remove all E. andrei individuals and cocoons and performed an overall characterization of the invertebrate groups in the vermicompost at the start of the experiment (more details in section 2.4). We chose grape marc vermicompost as this material is of vegetal origin and it is rich in secondary compounds (tannins and other polyphenols), like Casuarinaceae litter. Previous research with similar bedding material and E. andrei showed successful vermicomposting of other plant biomass rich in secondary compounds (Domínguez et al., 2018; Quintela-Sabarís et al., 2022).
2.3 Experimental set-up
The experiment was conducted in 750 ml plastic boxes. Each box was filled as follows. A bedding layer of 100 g (FW) of vermicompost was placed on the bottom of the box. A previously prepared litterbag (see above) was then placed horizontally on top of the vermicompost and covered with another 135 g of vermicompost. A square hole (4*4 cm) was made in the lid of each box and covered with a fine mesh to allow air exchange. We prepared 36 similar boxes, and each was randomly allocated to one of the treatments: Vermicompost (VC) or Vermicompost + Earthworms (hereafter, treatment E). Fifteen adult E. andrei collected from the top layer of the same vermirreactor where the vermicompost was obtained were then placed in each of the boxes in treatment E. No earthworms were added to the boxes in treatment VC.
The experiment was run for 40 weeks. During this period, the boxes were held in darkness at a constant temperature of 20ºC in a culture chamber (WTW, model TS606/2i). The moisture content of the vermicompost was estimated gravimetrically every week and adjusted to 80% by spraying with distilled water. The boxes were re-allocated randomly inside the culture chamber every week.
2.4 Experiment follow-up
To observe the dynamics of litter degradation, we destructively sampled three boxes per treatment after 2, 4, 8, 16, 32 and 40 weeks. Each sampled box was processed as follows. First, the litterbag was carefully removed from the box, and any vermicompost particles adhered to the outer side of the litterbag were gently brushed away. Each litterbag was then opened, the contents were placed in a plastic tray, and the earthworms contained within were collected. After removal of the earthworms, the litterbag contents were dried in an oven at 40ºC for a week. The litter fragments were separated from the vermicompost particles that had entered the litterbags, with the aid of sieves (0.71 mm) and tweezers, and the dry weight (DW) of the litter was recorded.
The vermicompost in each box was screened and all earthworms and cocoons were collected. The number of earthworms in the litterbags and vermicompost were counted and summed to determine the total number of earthworms (N_earthworms) in each box. The earthworms were rinsed with distilled water, to remove soil particles adhered to their skin, and then blotted gently with absorbent paper before being weighed to obtain the fresh weight (FW_earthworm).
After removal of litterbag and sampling earthworms, the remaining vermicompost in each box (approximately 200 g FW) was transferred to a Tullgren/Berlese funnel to extract invertebrates in response to light and temperature (Carter & Gregorich, 2008). The samples were kept in the funnel for three days in order to assure that the material was dried off and that the maximum number of invertebrates would escape through the mesh, avoiding the light and dry matrix. The mesofauna in vermicompost samples was collected in a cup filled with 20 mL of a 70% ethanol and 5% glycerol mixture placed at the bottom of the funnel. The number of Acari, Collembola and other groups such as flies (Diptera) were counted. According to their characteristics (Fjellberg, 1998), two categories were defined within the Collembola: Folsomia sp., as the most visible springtail genus, and other Collembola, which included among others Proisotoma sp.
2.5 Sample analysis
The chemical composition of litter was determined in ground subsamples. Each subsample (0.25 g) was placed in a Teflon container (Savillex), to which 4 ml HNO3 (67%, NORMATOM for trace metal analysis, VWR chemicals, catalog number 83872.290), 1 ml HCl (34%, NORMATOM for trace metal analysis, VWR chemicals, catalog number 83871.270) and 2 ml H2O2 (30%, stabilised, VWR chemicals, catalog number 23622.298) were added. Samples were digested in a microwave oven (Anton Paar-GmbH Multiwave-3000) at 800 W for 45 min. Samples were left to cool down and diluted to 50 mL using milliQ water. The pseudototal concentrations of Ca, Cu, Fe, K, Mg, Mn, Na, P, S and Zn were determined in digested samples by Inductively Coupled Plasma Optical Emission Spectroscopy (ICP-OES) (in an iCAP-pro analyzer, ThermoFisher). The concentrations of C and N were estimated by combustion (in a CHN Thermo Fischer NC2500 analyzer). The molecular structure of primary and secondary compounds of the OM in litter samples was determined by Fourier Transform Infrared spectroscopy combined with Attenuated Total Reflectance (FTIR-ATR) (in a Thermo Nicolet 6700 spectrometer equipped with a Smart Orbit Diamond ATR accessory, Thermo, Madison, WI, USA). FTIR-ATR spectra were acquired at a resolution of 4 cm-1 in the mid-infrared region (4000 – 400 cm-1), by averaging 32 scans per sample. Infrared spectra were processed using the andurinha package (Álvarez-Fernández & Martínez-Cortizas, 2020) in R version 4.2.2 (R Core Team, 2022). This package computes the mean absorbance spectrum and the standard deviation spectrum (to check for regions of the spectra with higher variability among samples). It also provides the second derivative spectra that we used to identify relevant peaks. In order to assign the identified peaks to functional groups and/or putative chemical compounds we used the information provided by (Artz et al., 2008; Carballo et al., 2008; Martínez Cortizas et al., 2021; Oberle et al., 2015; Srivastava et al., 2020).
2.6 Data analysis
For each sampling time, the litter mass loss was estimated, and the effects of treatment, time and the interaction treatment × time on litter mass loss were assessed by a two-way ANOVA followed by a post-hoc Tukey test to identify significant differences between sampling times and simple effects tests to evaluate the differences in litter mass loss between treatments for each sampling time.
The variation in the total FW_earthworm in different sampling times was assessed using one-way ANOVA. The variation in N_earthworms was evaluated using a linear model with a Poisson distribution and time as the explanatory variable followed by a post-hoc Tukey test, whereas the variation in the abundances of total mesofauna, Collembola, Acari and Other mesofauna with respect to treatment and time was assessed using a linear model with a QuasiPoisson distribution. In both cases, we used the R packages emmeans (Lenth, 2023) and multcompView (Graves et al., 2023), implemented in R (ver. 4.2.2) (R Core Team, 2022). Differences in mesofaunal communities between treatments were further assessed by non-metric multidimensional scaling (NMDS) using Bray–Curtis distances, and constraining solution to only two dimensions. The earthworm data (N_earthworm and FW_earthworm) and the sampling time were fitted as vectors onto the NMDS ordination. The correlation of these three vectors with the NMDS ordination and the p-value of that correlation were estimated by 1000 permutations. Only those vectors with p-values < 0.05 were plotted in the NMDS graph. NMDS and fitting of earthworm and time vectors were computed in R (ver. 4.2.2) (R Core Team, 2022) using the functions diversity, metaMDS and envfit from the vegan package (ver 2.6-4) (Oksanen et al., 2017).
Principal Components Analysis (PCA) was applied to litter data including the elemental composition (concentrations of C, N, Ca, Cu, Fe, K, Mg, Mn, Na, P, S and Zn) and the relevant IR peaks selected with andurinha package. The PCA was based on the correlation matrix between variables. The effects of treatment, time and the interaction treatment × time on the principal components (PCs) were explored by two-way ANOVA.
When required, the variables were transformed (log10 transformation) to meet the ANOVA assumption of homocedasticity. ANOVAs and PCA were computed using SPSS (v. 15, SPSS Inc., Chicago, IL, USA).
3. Results
3.1 Litter mass loss
After 40 weeks, the average loss of litter mass was 44.6 % in the vermicompost (VC) and 56.7 % in the earthworm + vermicompost (E) treatment (Figure 1). The two-way ANOVAs indicated significant effect of the factors treatment (F1,24 15.5, p-val 6.11 10-4), time (F5,24 294.3, p-val 1.03 10-20) and their interaction (F5,24 3.76, p-val 0.012) on litter mass loss. Considering only differences between sampling times, the litter mass loss followed this pattern: 2 weeks < 4 weeks < 8 and 16 weeks < 32 and 40 weeks (Figure 1). The simple effects tests comparing treatments at each sampling time showed that treatment E yielded higher litter mass losses than VC at 32 and at 40 weeks (Figure 1).
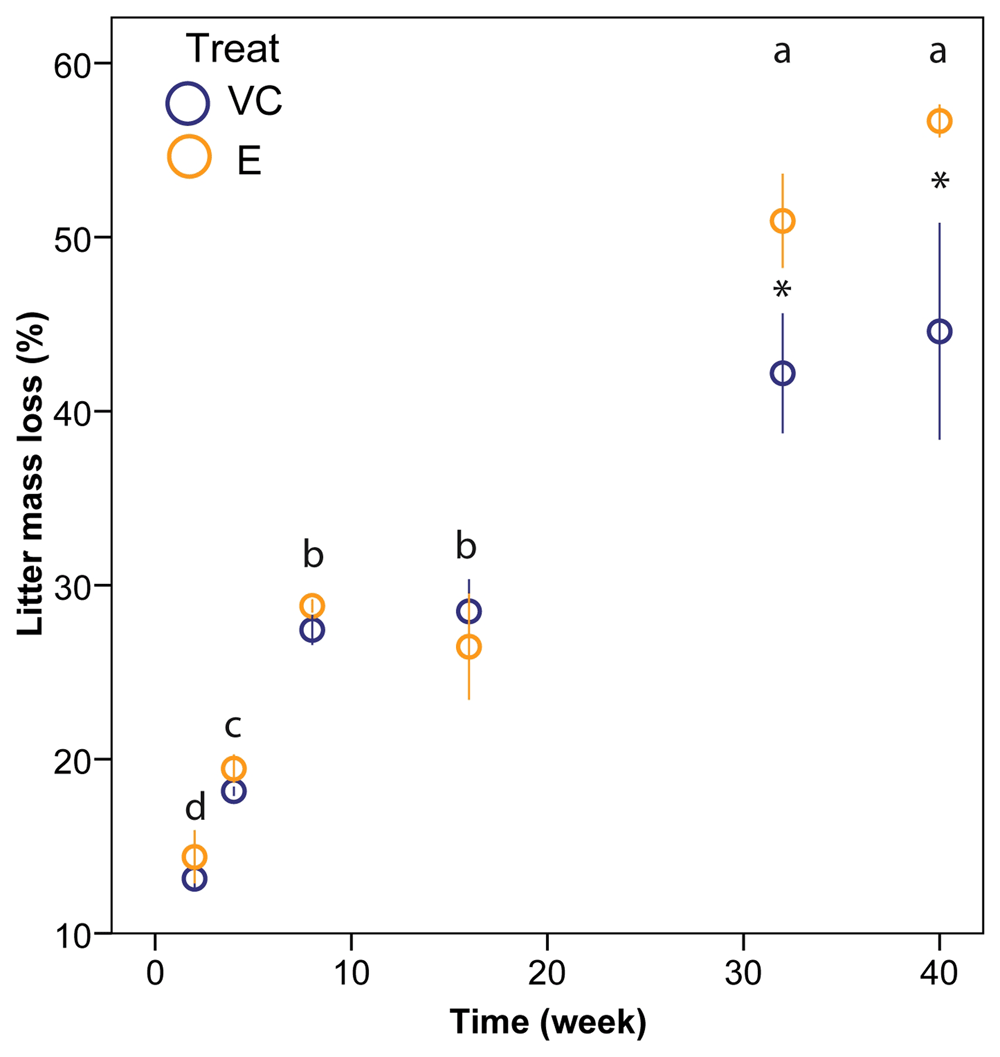
Figure 1. Percentage litter mass loss as a function of time.
Each dot corresponds to the average litter mass loss for three litterbags and the bars indicate the standard deviation. Blue dots denote treatment VC, and orange dots denote treatment E. Different letters indicate significant differences between sampling time, as indicated by post-hoc Tukey tests. Asterisks mark those sampling times for which there were significant differences between treatments.
3.2 Changes in litter chemical composition and functional groups
The raw C. equisetifolia litter contained 44% of carbon (C), whereas nitrogen (N) content was around 1.6%. The mineral element present at the highest concentration was calcium (Ca) with values higher than 3%, followed by potassium (K), magnesium (Mg), sulphur (S) and phosphorus (P), with concentrations of 8.6, 1.8, 1.4 and 1.1 g kg-1, respectively (Table 1). The C:N and N:P ratios were 27.5 and 14.5, respectively. Relative to the starting conditions, the litter at the end of the experiment contained less C (values around 39.5%) and Na (values around 490 mg kg-1) and higher concentrations of the other elements (e.g. concentrations of N, P, K and S at T40 were around 25, 9, 28 and 2.7 g kg-1, respectively). There were no differences in composition between treatments (Table 1).
Table 1. Summary of the chemical composition of the C. equisetifolia litter at the beginning of the experiment (T0) and at the end of experiment (T40), for the vermicompost (VC) and vermicompost + earthworms (E) treatments.
For each variable, the average values (highlighted in bold) and the standard deviations are indicated.
| Variable (unit) | T0 | T40 VC | T40 E |
|---|
| Mean | SD | Mean | SD | Mean | SD |
|---|
| N (%) | 1.6 | 0.29 | 2.7 | 0.1 | 2.4 | 0.1 |
| C (%) | 44 | 1.2 | 39.2 | 0.3 | 39.8 | 0.2 |
| Ca (mg kg-1) | 32280 | 2622 | 42165 | 725 | 42522 | 966 |
| Cu (mg kg-1) | 11.6 | 0.8 | 84.5 | 5.7 | 80.6 | 3.9 |
| Fe (mg kg-1) | 118.9 | 16.2 | 942.7 | 793.5 | 470.0 | 86.3 |
| K (mg kg-1) | 8644 | 624 | 27802 | 1469 | 28447 | 1216 |
| Mg (mg kg-1) | 1879 | 52 | 2770 | 175 | 2744 | 123 |
| Mn (mg kg-1) | 108 | 3 | 164 | 7 | 167 | 16 |
| Na (mg kg-1) | 696 | 41 | 480 | 38 | 497 | 19 |
| P (mg kg-1) | 1101 | 116 | 8516 | 798 | 9377 | 617 |
| S (mg kg-1) | 1419 | 136 | 2795 | 155 | 2734 | 81 |
| Zn (mg kg-1) | 17.4 | 0.6 | 42.18 | 4.41 | 42.14 | 2.51 |
| C:N | 27.5 | 3.9 | 14.4 | 0.7 | 16.7 | 0.8 |
| N:P | 14.5 | 1.8 | 3.2 | 0.2 | 2.6 | 0.2 |
The analysis of second derivative transformed FTIR-ATR spectra identified 18 relevant peaks at wavenumbers (WNs) between 511 cm-1 and 3847 cm-1. Using information from the literature, we were able to assign 16 out of the 18 peaks to some functional groups or molecules, such as cellulose (three peaks at WNs 511, 779, and 1317 cm-1), lignin (three peaks at WNs 1454, 1504, and 1514 cm-1) or lipids (two peaks at WNs 2850 and 2920 cm-1) (Table 2).
peak
code | WN
(cm-1) | S.d. sum
spectra | Characterisation | Assignment |
|---|
| Peak_1 | 511 | 21.97 | Carbohydrates & minerals | C-H stretching + Si-O-Si
stretching |
| Peak_2 | 779 | 67.54 | Cellulose, aliphatics | C-H stretching + Si-O-Si
stretching |
| Peak_3 | 1317 | 104.95 | Cellulose, hemicellulose | O-H stretching |
| Peak_4 | 1454 | 17.14 | Lignin, aliphatics and carboxylate | C-H deformations |
| Peak_5 | 1466 | 23.18 | Methylene compounds | C-H bending |
| Peak_6 | 1504 | 20.56 | Lignin | Aromatic C-H bending |
| Peak_7 | 1514 | 17.58 | Lignin | Aromatic C=C stretching |
| Peak_8 | 1614 | 29.14 | - | - |
| Peak_9 | 1647 | 19.23 | Proteins and peptides, possibly
fats if bands at 1000–700 are
also present | C=O stretching |
| Peak_10 | 1730 | 36.90 | Carboxylic groups, aldehydes,
ketones; carbonyl | C=O stretching |
| Peak_11 | 1981 | 39.24 | Alkynes | C≡N stretching |
| Peak_12 | 2050 | 19.95 | Alkynes | C≡N stretching |
| Peak_13 | 2146 | 26.39 | Alkynes | C≡N stretching |
| Peak_14 | 2164 | 87.80 | Alkynes | C≡N stretching |
| Peak_15 | 2324 | 35.45 | Alkynes | C≡N stretching |
| Peak_16 | 2850 | 65.30 | Fats, wax, lipids | Symmetric CH2 |
| Peak_17 | 2920 | 47.77 | Fats, wax, lipids | Antisymmetric CH2 |
| Peak_18 | 3847 | 17.78 | - | - |
The PCA applied to the data including concentrations of C, N and mineral elements in the litter and the 18 IR peaks identified three principal components (PCs) that explained the 84.9 % of the total variance. Most of the litter variables had important contributions to first PC (57% variance, Table 3). For this PC, the elements C and Na and the peaks associated with cellulose, proteins, fats and carboxylic acids (e.g. peaks 2, 3, 8, 9 and 10, Table 2) had negative loadings (i.e. negative correlation), whereas the other elements (N, Ca, Cu, Fe, K, Mg, Mn, P, S and Zn) as well as two peaks related to lignin (peaks 6 and 7) yielded positive loadings (Table 3). Thus, this PC can be identified as a time-dependent degradation gradient. The second and third PCs (PC2 and PC3, with 19% and 9% of total variance, respectively) do not provide a clear pattern of variation. Nine IR peaks, three with negative loadings (cellulose, lignin and methylene) and six (five alkyne peaks and one unidentified peak) with positive loadings (Table 2 and Table 3) were related to PC2; whereas two IR peaks (both linked to fats, wax, and lipids) were correlated to PC3 (Table 3).
Table 3. PCA analysis of the variation in composition of C. equisetifolia litter during the 40 weeks duration of the experiment.
The amount of variance explained by three principal components (PC1 to PC3) and loadings for the chemical elements and IR peaks on these PCs are shown. PCA was computed on a correlation matrix of the variables. Variables with high correlation with PCs (i.e. loadings > |0.6| are highlighted in bold.
| PC1 | PC2 | PC3 |
|---|
| Variance explained (%) | 56.5 | 19.4 | 9.1 |
| Eigenvalue | 16.95 | 5.81 | 2.74 |
| Variable Loadings | | | |
| % N | 0,88 | -0,13 | 0,22 |
| % C | -0,96 | -0,03 | 0 |
| Ca | 0,78 | 0,01 | -0,06 |
| Cu | 0,95 | -0,08 | 0,11 |
| Fe | 0,71 | -0,07 | 0,14 |
| K | 0,98 | -0,06 | 0,07 |
| Mg | 0,96 | -0,06 | 0,08 |
| Mn | 0,91 | 0,05 | 0 |
| Na | -0,69 | 0,02 | 0,14 |
| P | 0,97 | -0,08 | 0,1 |
| S | 0,99 | -0,09 | 0,11 |
| Zn | 0,97 | -0,07 | 0,1 |
| Peak_1 | -0,43 | -0,8 | -0,32 |
| Peak_2 | -0,75 | -0,57 | -0,22 |
| Peak_3 | -0,95 | -0,12 | -0,08 |
| Peak_4 | 0,45 | -0,73 | 0,41 |
| Peak_5 | 0,43 | -0,68 | 0,53 |
| Peak_6 | 0,95 | -0,13 | -0,12 |
| Peak_7 | 0,95 | -0,19 | 0,03 |
| Peak_8 | -0,95 | -0,04 | 0,1 |
| Peak_9 | -0,92 | -0,12 | 0,27 |
| Peak_10 | -0,79 | -0,18 | 0,55 |
| Peak_11 | -0,19 | 0,83 | 0,26 |
| Peak_12 | 0,18 | 0,81 | 0,3 |
| Peak-13 | 0,32 | 0,72 | 0,14 |
| Peak_14 | -0,52 | 0,72 | -0,03 |
| Peak_15 | -0,05 | 0,7 | 0,03 |
| Peak_16 | -0,48 | -0,21 | 0,82 |
| Peak_17 | -0,5 | -0,24 | 0,8 |
| Peak_18 | 0,29 | 0,84 | 0,33 |
The plot of the litter sample scores on the first two PCs showed a time dependent arrangement of the samples (Figure 2). Thus, the T0 samples had the most negative scores with PC1 (centroid around -1.4, Figure 2) and the samples collected subsequently had increasing scores with PC1 depending on the sampling time (e.g., centroids for samples collected after 2 weeks of experiment had scores around -1, whereas the scores of centroids of samples collected after 40 weeks were around 1.5) (Figure 2). By contrast, there were no visual differences in time or treatments on PC2, although we observe a greater heterogeneity between samples at earlier sampling times (i.e. samples collected after two and four weeks of experiment) (Figure 2).
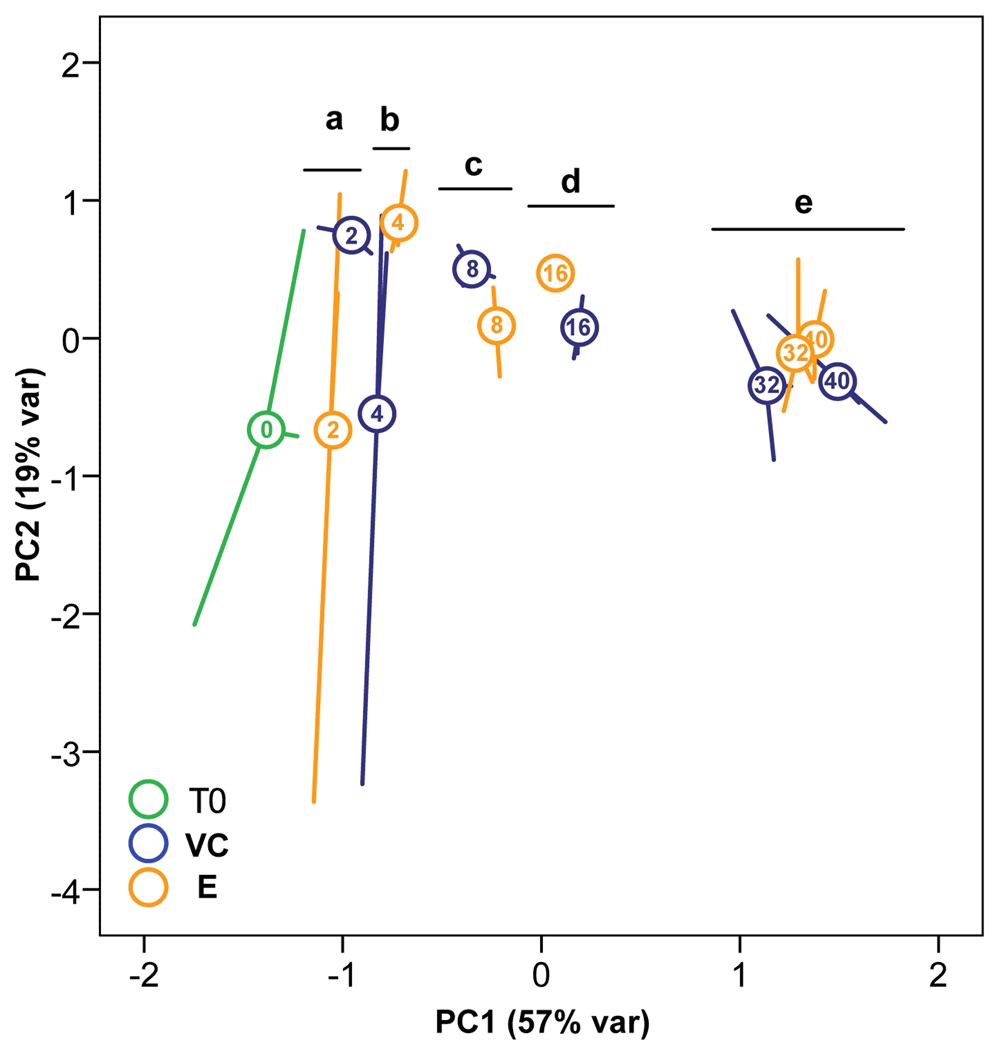
Figure 2. Variation in the composition of the Casuarina equisetifolia litter with time.
Data on samples of C. equisetifolia litter collected at different sampling times were plotted against the two first Principal Components (PCs) identified by the PCA on chemical composition data. Each dot corresponds to the centroid of one combination of sampling time (indicated by inscribed numbers) and treatment (indicated by different colors: green denotes T0 samples, blue denotes VC samples and orange denotes E samples). The radiating lines connect the centroid of each group with the samples forming that group (samples not shown in the graph). Different lower-case letters indicate significant differences in PC1 scores between sampling times as indicated by a post-hoc Tukey test.
The ANOVA applied to PC1 indicated significant effects only for the factor time (F5,24 492.0, p-val 2.4 10-23), whereas treatment and the interaction treatment × time were non-significant (F1,24 0.149, p-val 0.703 and F5,24 2.018, p-val 0.112, respectively). These results indicate that with increased time of decomposition the concentration of C and Na in the litter decreased, whereas the other elements increased, and that the amount of cellulose, proteins and lipids decreased, whereas the lignin concentration increased. The ANOVA of the PC2 scores showed no significant differences between levels of treatment (F1,24 0.08, p-val 0.779), time (F5,24 0.255, p-val 0.933) or the treatment × time interaction (F5,24 1.350, p-val 0.278).
3.3 Changes in earthworms and mesofaunal groups
The number and biomass of earthworms decreased throughout the experiment, although the rate of decrease was different for each parameter (Figure 3a,b). Thus, the number of earthworms remained stable for most of the experiment, with a strong, significant reduction in week 40 (Figure 3a). By contrast, the total earthworm biomass inside the boxes decreased throughout the duration of the experiment: thus, between T0 and week 4, the earthworm FW was around 3 g per box; this amount was around 1.8 g per box in weeks 8 and 16 and around 0.3 g per box in weeks 32 and 40 (Figure 3b).
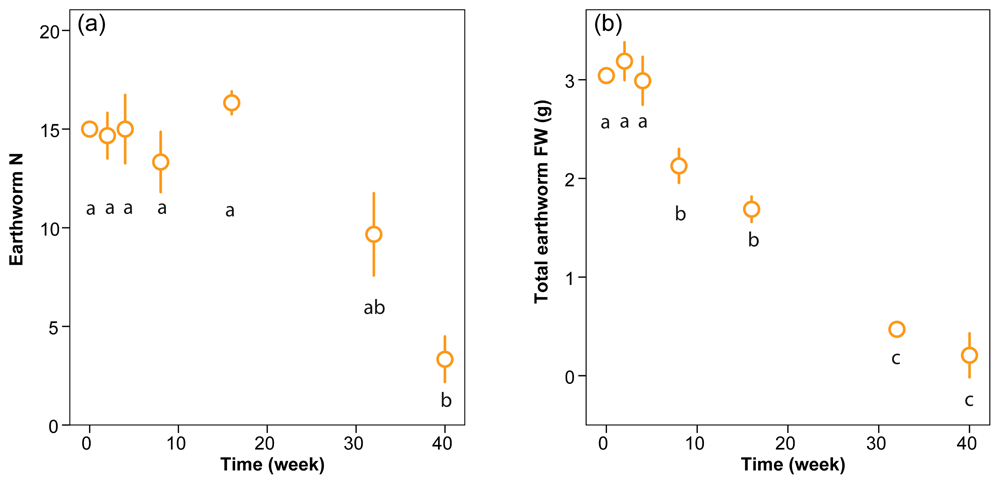
Figure 3.
Variation in the earthworm number (a) and total fresh weight (b) during the experiment. The empty dots indicate the mean for treatment E in each sampling time, whereas the whiskers indicate the standard deviation of the data. Different lower-case letters indicate significant differences between sampling times as indicated by the post-hoc Tukey post-hoc test.
Our analyses showed no significant differences between treatments in the abundance of mesofauna (either taking the four groups together or each group separately), but total mesofauna abundance varied significantly with time (Figure 4a). This variation was mainly due to the variation in the number of Collembola, the most abundant group (Figure 4b). In both cases, there was a similar trend: an increase from time 0 to the week 4, then a plateau with average values around 120 individuals per box until the week 16, followed by a marked decrease in the mesofaunal abundance to around 25–30 individuals per box in the weeks 32 and 40 (Figures 4a, 4b). In the case of Acari and other mesofaunal groups (Figures 4D, 4E), the important overdispersal of the data (especially during the weeks 2 to 8) resulted in non-significant differences with time, although these groups have a similar pattern of variation as Collembola.
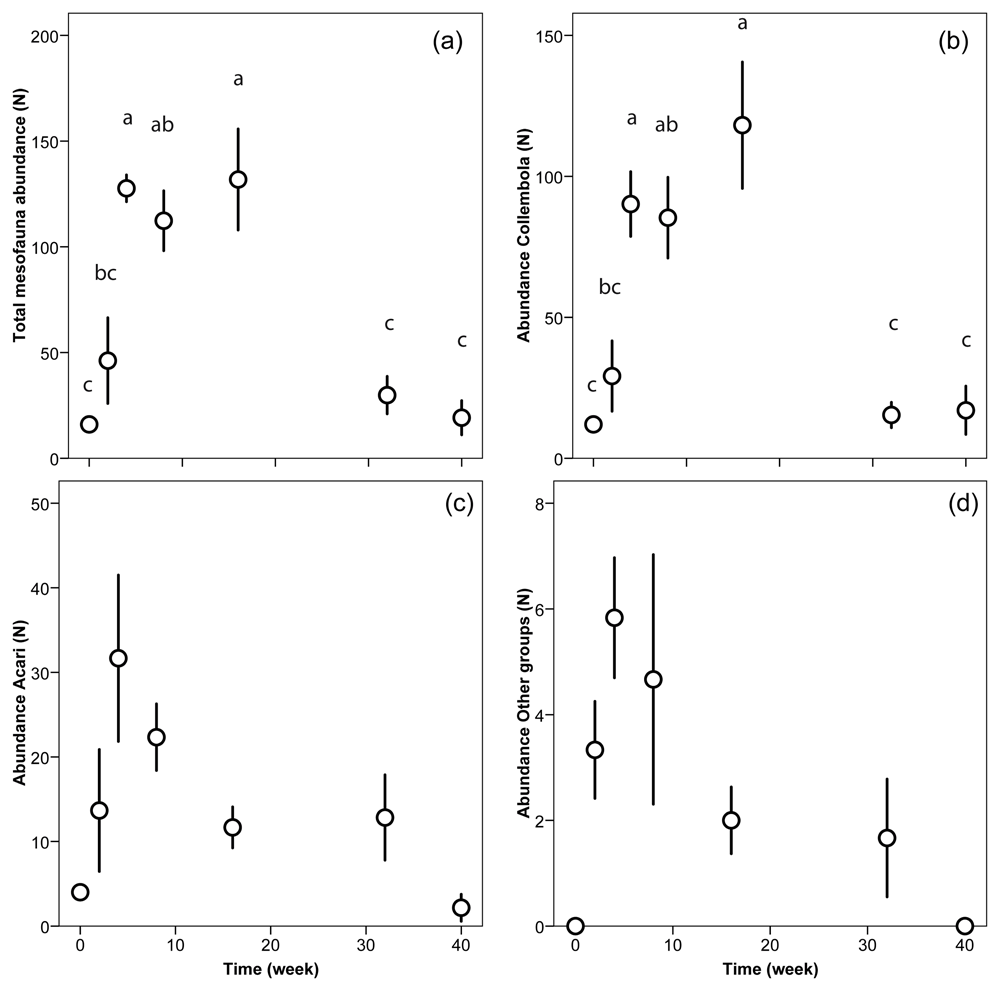
Figure 4. Variation in the abundance (number of individuals) of mesofaunal groups.
Each pannel presents: Total mesofauna (a), Collembola (b), Acari (c) and other groups (d). As the linear models indicated no differences between the treatments, the graphs present the average for all the samples (including both treatments VC and E) in each sampling time. The open dots indicate the mean, whereas the whiskers indicate the standard deviation of the data. Different lower-case letters indicate significant differences between sampling times as indicated by the Tukey post-hoc test.
The results of the NMDS analysis of mesofaunal communities were similar to the linear models and revealed that the composition of the communities in boxes collected at different times between 2 and 32 weeks was similar (i.e., superposition of convex hulls), whereas the at the final sampling time (40 weeks) there was a marked divergence in the community composition (Figure 5). This divergence can be attributed to a relative increase in the number of collembolans (mainly Folsomia sp.) in the boxes at the end of the experiment (40 weeks) due to the marked decrease in the abundances of Acari and other mesofauna (Figure 4). Neither the number of earthworms nor earthworm biomass (FW) significantly affected those communitiets, which were only affected by the factor time (Figure 5).
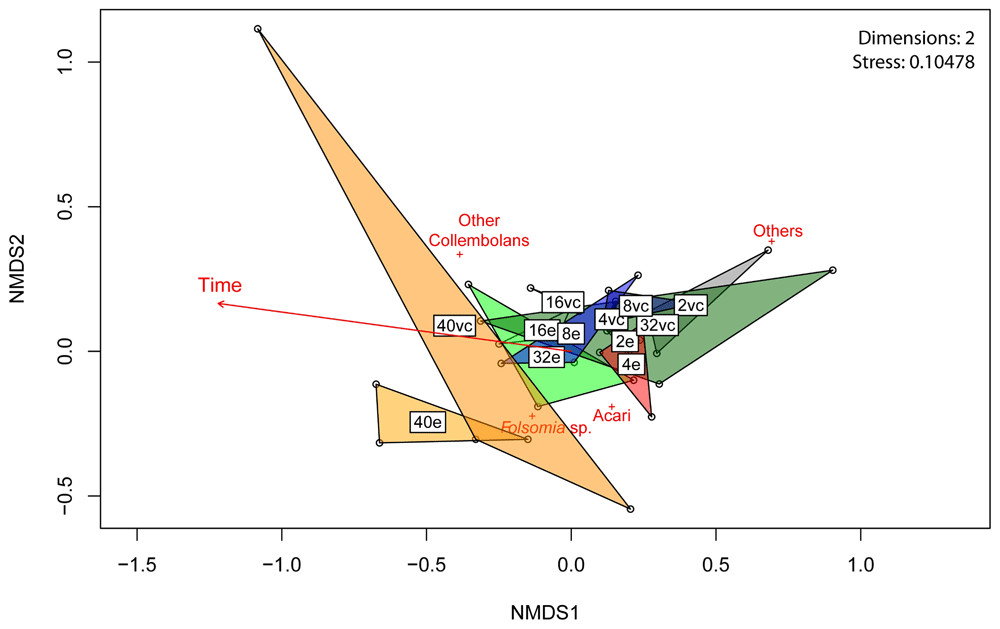
Figure 5. NMDS analysis on the composition of mesofaunal communities.
The graph shows the variation in the composition of mesofaunal communities during the experimental decomposition of Casuarina equisetifolia litter. Each polygon is a convex hull grouping all the boxes from each treatment (VC or E) harvested at the same sampling time. Polygon colours indicate sampling time (gray, 2 weeks; red, 4 weeks; blue, 8 weeks; yellow, 16 weeks; green, 32 weeks; orange, 40 weeks). White rectangles with codes indicate the centroid for each combination treatment × sampling time. The red crosses indicate the direction of the effect of abundance of each mesofaunal category on the NMDS space. The red arrow indicates the variable (in this case, time) which is significantly correlated (i.e., p-value < 0.05) with the ordination.
4. Discussion
The nitrogen-fixing tree Casuarina equisetifolia is cultivated in tropical regions worldwide for multiple uses. Litter production in this species may vary between 3.3 to 11 tons ha-1 year-1 (Hata et al., 2010b; Mailly & Margolis, 1992; Parrotta, 1999) and the low rate of degradation of the litter creates new challenges regarding the use of the tree for the restoration of degraded areas. In this study, we estimated the effect of vermicompost (VC) and Eisenia andrei + vermicompost (E) on the decomposition of the litter of this tree. After 40 weeks, the treatments resulted in the decomposition of between 45% (VC) and 55% (E) of the litter mass. These values obtained in microcosms are within the C. equisetifolia litter decomposition rates reported in other field-conducted litterbag decomposition experiments, which range widely, from 35 to 55% of mass loss after one year in subtropical areas in Japan (Hata et al., 2012) and coastal China (Zhang et al., 2013), to 41% to 70% decomposition in tropical warm areas in India after one year of experiment (Dutta & Agrawal, 2001; Srivastava & Ambasht, 1996). Moreover, 100% of litter mass loss was reported in a 3-year old C. equisetifolia plantation in a semiarid zone of India (Uma et al., 2014). Some climate related factors (mainly temperature) are known to favor litter decay, especially during the early stage of decomposition (Berg & McClaugherty, 2014), so that the high decomposition values reported in some of these studies may be due to elevated temperatures (higher than in the present study) in the subtropical and tropical regions where the experiments were conducted.
Berg & Matzner proposed a model for litter decomposition which three phases: an initial stage determined by litter composition, in which rapid degradation of more labile compounds occurs, a later phase in which lignin accumulation reduces decomposition rate, and a final stage in which the decomposition has stopped (Berg & Matzner, 1997; Berg & McClaugherty, 2014). Under our experimental conditions, the decomposition of C. equisetifolia litter followed a similar asymptotic pattern. Thus, during first eight weeks we observed a continuous trend for litter mass loss to increase, reaching values of around 30% at week 8. This large loss of mass can be explained by the relatively high concentrations of major nutrients in the litter (16 g kg-1 N, 1.1 g kg-1 P, 1.4 g kg-1 S) and an adequate balance (e.g. N:P ratio 14.5). Previous research has shown maximal bacterial stimulation and cellulose decomposition at intermediate N:P ratios (Güsewell & Gessner, 2009).
Between week 8 and the end of the experiment, the decomposition took place more slowly and accumulated litter mass losses of between 45 and 55% were only reached after a further 32 weeks.
In parallel with the accumulated litter mass loss, the analysis of changes in the composition of the litter indicated a reduction in C and as indicated by the variation in IR peaks, most of the lost carbon came from hemicellulose, cellulose, and proteins, which also resulted in a relative increase in IR peaks linked to lignin. All of these changes are compatible with the second decomposition stage in Berg & Matzner model (Berg & Matzner, 1997).
The reduction in C concentration in the litter involved an increase in the concentration of all the other measured elements (except sodium). Previous studies using the litterbag approach also reported an increase in nitrogen and phosphorus concentrations C. equisetifolia litter during decomposition (Dutta & Agrawal, 2001; Zhang et al., 2013), whereas in other studies a continuous reduction in nitrogen (Hata et al., 2012; Srivastava & Ambasht, 1996) or other elements, such as K and Ca (Dutta & Agrawal, 2001), was observed. However, the studies reported in all of these papers were conducted in the field, where the seasonal weather conditions (e.g. rainy seasons) are expected to cause higher levels of element leaching than within our microcosm boxes.
The variation in the earthworm number and biomass mirrored the changes in litter biomass. Thus, these parameters stayed stable during the first weeks of the experiment (when the decomposition of the more labile OM happened), and decreased during the last sampling times. This is a common pattern in populations in closed systems such as in the present study and it has been observed in other vermicomposting trials without a continuous addition of fresh organic residues (e.g. (Domínguez et al., 2018; Quintela-Sabarís et al., 2022; Sanchez-Hernandez & Domínguez, 2017)).
Interestingly, differences in litter decomposition between the two treatments were only visible in the samples collected after 32 and 40 weeks, when the earthworm number and biomass (and the mesofaunal community, see the following paragraph) were minimal. Earthworms facilitate microorganism-mediated decomposition directly (e.g. by OM ingestion and fragmentation, burrowing) and by indirectly through cast mixing with the substrate and cast ageing (Aira & Domínguez, 2011; Domínguez et al., 2010). Previous studies have shown that, due to the presence of specific microbial communities and extracellular catalytic enzymes in the worm-worked material, the indirect effects of vermicompost can be quite strong (Aira & Domínguez, 2011) and even useful in the bioremediation of organic pollutants (Sanchez-Hernandez & Domínguez, 2017). Thus, we hypothesize that indirect effects mediated by the degradative capacity of vermicompost (e.g. an increase in enzymatic activity of carboxylesterases (Sanchez-Hernandez et al., 2019)) were the main actors in the decomposition of the fibrous C. equisetifolia litter and that increased cast deposition by earthworms inside the litterbags facilitated access to the litter by the microorganisms, resulting in enhanced decomposition in the long-term, despite the reduced earthworm presence.
The mesofaunal communities in the study microcosms changed over time and, as it happened with the earthworms, the maximum abundances occurred between weeks 4 and 16 and there was a subsequent decrease until the week 40 that affected all the groups. However, the abundance of mesofaunal groups was not affected by the presence of earthworms. As already indicated in the case of microorganisms, earthworm activity can stimulate other faunal groups by increasing the availability of nutritive resources; however, in the case of nutrient scarcity, the presence of earthworms may also have had a negative effect due to competition (Gómez-Brandón & Domínguez, 2014), which in turn affects also species on the food web such as predatory acari. Thus, studies on the decomposition of pig manure (Monroy et al., 2011) or of a mixture of straw and animal manure (Jacques et al., 2021) reported a positive effect of earthworms on the abundance of faunal communities, especially collembolans. However, the substrates used in these studies were rich and easy to decompose, thus providing sufficient resources for earthworms and faunal communities to develop, whereas the vermicomposted grape marc used in our experiment (lacking fresh OM) and the low palatability of the C. equisetifolia litter created relatively nutrient-scarce conditions that may have hindered the development of earthworms and promoted competition between animal groups.
5. Conclusions
In this study we evaluated the effect of vermicompost and vermicompost + Eisenia andrei on the decomposition of Casuarina equisetifolia litter, with a view to using a similar approach in revegetation trials of mine areas where Casuarinaceae are being grown. Although the earthworm treatment yielded the best results in terms of decomposition after 40 weeks, the vermicompost treatment resulted in degradation of almost half of the litter. This result, supported by the existing literature, suggests that the direct application of vermicompost (in either solid or in liquid form) may be a feasible option for stimulating litter decomposition. Further studies, including a control without vermicompost application, should be conducted on a large scale and under natural outdoor conditions to confirm the validity of this approach for litter decomposition and revegetation trials in the field.
Ethics and consent
Ethical approval and consent were not required.
Data availability
Zenodo: Dataset of the manuscript "Assessing the influence of Eisenia andrei on the decomposition of Casuarina equisetifolia litter in vermicompost." https://doi.org/10.5281/zenodo.8146229 (Quintela-Sabarís et al., 2023)
The project contains the following underlying data:
- readme.csv (a file where we explain the meaning of each column –and in which units is expressed– in each of the other five files).
- earthworm_N_biomass.csv (a table with the number of Eisenia andrei individuals and the total earthworm fresh weight in each of the experimental units we sampled)
- FTIR_spectra.csv (a file with the raw spectral data we obtained from the litter by Fourier Transform Infrared spectroscopy combined with Attenuated Total Reflectance,FTIR-ATR. First column indicate the wavenumber (cm-1) and the other columns indicate the absorbance values of each litter sample for each wavenumber).
- litter_chemical_composition.csv (a file with the raw data of the concentrations of different chemical elements measured in C. equisetifolia litter collected at different decomposition times).
- litter_mass_loss.csv (contains the dry weight data of the litter at time 0 and after each collection time, as well as the percentage of litter mass loss with time).
- mesofaunal_com.csv (are the numbers of individuals of several groups of mesofaunal organisms –collembolans, mites, and others– we recovered in each of our experimental units).
Data are available under the terms of the Creative Commons Attribution 4.0 International license (CC-BY 4.0)(https://creativecommons.org/licenses/by/4.0/).
Acknowledgements
This research and CQS contract were funded by the European Union’s Horizon 2020 research and innovation programme under the Marie Skłodowska-Curie grant agreement No 892814. LAM acknowledges support from the European Union Horizon 2020 Programme-funded LABPLAS—Land-Based Solutions for Plastics in the Sea—project (grant agreement number 101003954) through the award of a post-doctoral research contract. JD wants to acknowledge funding by the Spanish Ministerio de Ciencia e Innovación (PID2021-124265OB-100), the Xunta de Galicia (ED431C 2022/07) and by the MCIN/AEI and European Union Next Generation_EU under the project TED2021-129437B-100. Authors would like to acknowledge the use of scientific and technical services of Centro de Apoio Científico e Tecnolóxico á Investigación (CACTI-Universidade de Vigo)
Faculty Opinions recommendedReferences
- Aira M, Domínguez J:
Earthworm effects without earthworms: inoculation of raw organic matter with worm-worked substrates alters microbial community functioning.
PLoS One.
2011; 6(1): e16354. PubMed Abstract
| Publisher Full Text
| Free Full Text
- Álvarez-Fernández N, Martínez-Cortizas A:
Andurinha: make spectroscopic data processing easier. 2020. Reference Source
- Artz RR, Chapman SJ, Robertson AJ, et al.:
FTIR spectroscopy can be used as a screening tool for organic matter quality in regenerating cutover peatlands.
Soil Biol Biochem.
2008; 40(2): 515–527. Publisher Full Text
- Barritt AR, Facelli JM:
Effects of Casuarina pauper litter and grove soil on emergence and growth of understorey species in arid lands of South Australia.
J Arid Environ.
2001; 49(3): 569–579. Publisher Full Text
- Berg B, Matzner E:
Effect of N deposition on decomposition of plant litter and soil organic matter in forest systems.
Environ Rev.
1997; 5(1): 1–25. Publisher Full Text
- Berg B, McClaugherty C:
Plant litter. Third Edition. Springer, Heidelberg, 2014. Publisher Full Text
- Blouin M, Hodson ME, Delgado EA, et al.:
A review of earthworm impact on soil function and ecosystem services.
Eur J Soil Sci.
2013; 64(2): 161–182. Publisher Full Text
- Carballo T, Gil MV, Gómez X, et al.:
Characterization of different compost extracts using Fourier-Transform Infrared Spectroscopy (FTIR) and thermal analysis.
Biodegradation.
2008; 19: 815–830. PubMed Abstract
| Publisher Full Text
- Carter MR, Gregorich EG, (eds):
Soil sampling and methods of analysis. Second Edition. CRC press, Boca Raton, Florida, 2008. Reference Source
- Chomel M, Baldy V, Guittonny M, et al.:
Litter leachates have stronger impact than leaf litter on Folsomia candida fitness.
Soil Biol Biochem.
2020; 147: 107850. Publisher Full Text
- Coleman DC, Wall DH:
Soil fauna: occurrence, biodiversity, and roles in ecosystem function. In: Paul EA (ed) Soil Microbiology, Ecology and Biochemistry. Fourth Edition. Academic Press, Boston, 2015; 111–149. Publisher Full Text
- Dawson JO:
Ecology of actinorhizal plants. In: Pawlowski K, Newton WE (eds) Nitrogen-fixing actinorhizal symbioses. Springer, Dordrecht, 2007; 199–234. Publisher Full Text
- Diagne N, Arumugam K, Ngom M, et al.:
Use of Frankia and actinorhizal plants for degraded lands reclamation.
Biomed Res Int.
2013; 2013: 948258. PubMed Abstract
| Publisher Full Text
| Free Full Text
- Diem HG, Duhoux E, Zaid H, et al.:
Cluster roots in Casuarinaceae: role and relationship to soil nutrient factors.
Ann Bot.
2000; 85(6): 929–936. Publisher Full Text
- Domínguez J:
State-of-the-art and new perspectives on vermicomposting research. In: Edwards CA (ed) Earthworm Ecology. 2nd edn. CRC Press, Boca Raton, Florida, 2004; 401–424. Publisher Full Text
- Domínguez J:
State-of-the-art and new perspectives on vermicomposting research: 18 years of progress. In: Mupambwa HA, Horn LN, Mnkeni PNS (eds) Vermicomposting for Sustainable Food Systems in Africa. Springer, Singapore, 2023; 27–44. Publisher Full Text
- Domínguez J, Aira M, Gómez-Brandón M:
Vermicomposting: earthworms enhance the work of microbes. In: Insam H, Franke-Whittle I, Goberna M (eds) Microbes at Work. From Wastes to Resources. Springer, Heidelberg, 2010; 93–114. Publisher Full Text
- Domínguez J, Aira M, Kolbe AR, et al.:
Changes in the composition and function of bacterial communities during vermicomposting may explain beneficial properties of vermicompost.
Sci Rep.
2019; 9(1): 9657. PubMed Abstract
| Publisher Full Text
| Free Full Text
- Domínguez J, Edwards CA:
Biology and ecology of earthworm species used for vermicomposting. In: Edwards CA, Arancon NQ, Sherman R (eds) Vermiculture Technology: Earthworms, Organic Wastes and Environmental Management. CRC Press, Boca Raton, Florida, 2010; 27–40. Publisher Full Text
- Domínguez J, Gómez-Brandón M, Martínez-Cordeiro H, et al.:
Bioconversion of Scotch broom into a high-quality organic fertiliser: vermicomposting as a sustainable option.
Waste Manag Res.
2018; 36(11): 1092–1099. PubMed Abstract
| Publisher Full Text
- Domínguez J, Martínez-Cordeiro H, Álvarez-Casas M, et al.:
Vermicomposting grape marc yields high quality organic biofertiliser and bioactive polyphenols.
Waste Manag Res.
2014; 32(12): 1235–1240. PubMed Abstract
| Publisher Full Text
- Dörken VM, Parsons RF:
Morpho-anatomical studies on the leaf reduction in Casuarina: the ecology of xeromorphy.
Trees.
2017; 31: 1165–1177. Publisher Full Text
- Dutta RK, Agrawal M:
Litterfall, litter decomposition and nutrient release in five exotic plant species planted on coal mine spoils.
Pedobiologia.
2001; 45(4): 298–312. Publisher Full Text
- Ferraz Ramos R, Almeida Santana N, de Andrade N, et al.:
Vermicomposting of cow manure: effect of time on earthworm biomass and chemical, physical, and biological properties of vermicompost.
Bioresour Technol.
2022; 345: 126572. PubMed Abstract
| Publisher Full Text
- Fjellberg A:
The collembola of fennoscandia and Denmark. I. poduromorpha and onychiuridae. Brill, Leiden, 1998. Publisher Full Text
- Gómez-Brandón M, Aira M, Lores M, et al.:
Epigeic earthworms exert a bottleneck effect on microbial communities through gut associated processes.
PLoS One.
2011; 6(9): e24786. PubMed Abstract
| Publisher Full Text
| Free Full Text
- Gómez-Brandón M, Domínguez J:
Recycling of solid organic wastes through vermicomposting: microbial community changes throughout the process and use of vermicompost as a soil amendment.
Crit Rev Environ Sci Technol.
2014; 44(12): 1289–1312. Publisher Full Text
- Graves S, Piepho H, Selzer L, et al.:
multcompView: visualizations of paired comparisons. R package version 0.1-9, 2023.
- Güsewell S, Gessner MO:
N: P ratios influence litter decomposition and colonization by fungi and bacteria in microcosms.
Funct Ecol.
2009; 23(1): 211–219. Publisher Full Text
- Hata K, Kato H, Kachi N:
Leaf litter of the invasive Casuarina equisetifolia decomposes at the same rate as that of native woody species on oceanic islands but releases more nitrogen.
Weed Res.
2012; 52(6): 542–550. Publisher Full Text
- Hata K, Kato H, Kachi N:
Litter of an alien tree, Casuarina equisetifolia, inhibits seed germination and initial growth of a native tree on the Ogasawara Islands (subtropical oceanic Islands).
J For Res.
2010a; 15(6): 384–390. Publisher Full Text
- Hata K, Kato H, Kachi N:
Litterfall in forests dominated by an alien woody species, Casuarina equisetifolia, on Chichijima Island.
Ogasawara Research.
2010b; 35: 1–14. Reference Source
- Jacques RG, Allison G, Shaw P, et al.:
Earthworm-Collembola interactions affecting water-soluble nutrients, fauna and physiochemistry in a mesocosm manure-straw composting experiment.
Waste Manag.
2021; 134: 57–66. PubMed Abstract
| Publisher Full Text
- Jaffré T, Gauthier D, Rigault F, et al.:
Les Casuarinacées endémiques. Caractéristiques écologiques et nutritionnelles.
Bois & Forêts des Tropiques.
1994; 242: 31–43. Reference Source
- Johnson LAS, Wilson KL:
Casuarinaceae: a synopsis. In: Crane PR, Blackmore S (eds) Evolution, systematics and fossil history of the Hamamelidae, volume 2: “Higher” Hamamelidae. Claredon Press, Oxford, 1989; 167–188. Reference Source
- Karberg NJ, Scott NA, Giardina CP:
Methods for estimating litter decomposition. In: Hoover CM (ed) Field Measurements for Forest Carbon Monitoring: A Landscape-Scale Approach. Springer Netherlands, Dordrecht, 2008; 103–111. Publisher Full Text
- Ke X, Winter K, Filser J:
Effects of soil mesofauna and farming management on decomposition of clover litter: a microcosm experiment.
Soil Biol Biochem.
2005; 37(4): 731–738. Publisher Full Text
- Lavelle P, Spain AV:
Soil Ecology. Kluwer Academic Publishers, Dordrecht, 2001. Publisher Full Text
- Lenth R:
emmeans: estimated marginal means, aka least-squares means. R package version 1.8.6, 2023. Reference Source
- Mailly D, Margolis HA:
Forest floor and mineral soil development in Casuarina equisetifolia plantations on the coastal sand dunes of Senegal.
Forest Ecology and Management.
1992; 55(1–4): 259–278. Publisher Full Text
- Martínez Cortizas A, Sjöström JK, Ryberg EE, et al.:
9000 years of changes in peat organic matter composition in Store Mosse (Sweden) traced using FTIR-ATR.
Boreas.
2021; 50(4): 1161–1178. Publisher Full Text
- McCoy SG:
The dynamics of Gymnostoma maquis on ultramafic soils in New Caledonia. PhD. Thesis, Australian National University, 1998. Publisher Full Text
- McCoy SG, Ash J, Jaffré T:
The effect of Gymnostoma deplancheanum (Casuarinaceae) litter on seedling establishment of new caledonian ultramafic maquis species. In: Bellairs SM, Osborne JM (eds) Second Australian Native Seed Biology for Revegetation Workshop. Australian Centre for Minesite Rehabilitation Research, 1996; 127–135. Reference Source
- McCoy S, Jaffré T, Rigault F, et al.:
Fire and succession in the ultramafic maquis of New Caledonia.
J Biogeogr.
1999; 26: 579–594. Reference Source
- Monroy F, Aira M, Domínguez J:
Changes in density of nematodes, protozoa and total coliforms after transit through the gut of four epigeic earthworms (Oligochaeta).
Appl Soil Ecol.
2008; 39(2): 127–132. Publisher Full Text
- Monroy F, Aira M, Domínguez J:
Epigeic earthworms increase soil arthropod populations during first steps of decomposition of organic matter.
Pedobiologia.
2011; 54(2): 93–99. Publisher Full Text
- Normand P, Fernández MP:
Frankia. In: Trujillo ME, Dedysh S, DeVos P, et al. (eds) Bergey’s manual of systematics of Archaea and Bacteria. Bergey’s Manual Trust, 2019. Publisher Full Text
- Oberle J, Dighton J, Arbuckle-Keil G:
Comparison of methodologies for separation of fungal isolates using Fourier Transform Infrared (FTIR) spectroscopy and Fourier Transform Infrared-attenuated Total Reflectance (FTIR-ATR) microspectroscopy.
Fungal Biol.
2015; 119(11): 1100–1114. PubMed Abstract
| Publisher Full Text
- Oksanen J, Blanchet G, Friendly M, et al.:
vegan: Community Ecology Package. R package version 2.4-4, 2017.
- Okuda T, Yoshida T, Ashida M, et al.:
Tannis of Casuarina and Stachyurus species. Part 1. Structures of pendunculagin, casuarictin, strictinin, casuarinin, casuariin, and stachyurin.
J Chem Soc Perkin 1.
1983; 1: 1765–1772. Publisher Full Text
- Parrotta JA:
Productivity, nutrient cycling, and succession in single- and mixed-species plantations of Casuarina equisetifolia, Eucalyptus robusta, and Leucaena leucocephala in Puerto Rico.
For Ecol Manag.
1999; 124: 45–77. Publisher Full Text
- Quintela-Sabarís C, Auber E, Sumail S, et al.:
Recovery of ultramafic soil functions and plant communities along an age-gradient of the actinorhizal tree Ceuthostoma terminale (Casuarinaceae) in Sabah (Malaysia).
Plant Soil.
2019; 440: 201–218. Publisher Full Text
- Quintela-Sabarís C, Mendes LA, Domínguez J:
Vermicomposting as a sustainable option for managing biomass of the invasive tree Acacia Dealbata link.
Sustainability.
2022; 14(21): 13828. Publisher Full Text
- Quintela-Sabarís C, Mendes LA, Domínguez J:
Dataset of the manuscript "Assessing the influence of Eisenia andrei on the decomposition of Casuarina Equisetifolia litter in vermicompost". (Version 2) [Data set]. Zenodo. 2023. http://www.doi.org/10.5281/zenodo.8146229
- R Core Team: R: A language and environment for statistical computing. 2022. Reference Source
- Reddell P, Bowen GD, Robson AD:
Nodulation of Casuarinaceae in relation to host species and soil properties.
Aust J Bot.
1986; 34(4): 435–444. Publisher Full Text
- Sanchez-Hernandez JC, Cares XA, Domínguez J:
Exploring the potential enzymatic bioremediation of vermicompost through pesticide-detoxifying carboxylesterases.
Ecotoxicol Environ Saf.
2019; 183: 109586. PubMed Abstract
| Publisher Full Text
- Sánchez-Hernández JC, Domínguez J:
Dual role of vermicomposting in relation to environmental pollution: detoxification and bioremediation. In: Sánchez-Hernández JC (ed) Bioremediation of agricultural soils. CRC Press, Boca Raton, Florida, 2019; 217–230. Publisher Full Text
- Sanchez-Hernandez JC, Domínguez J:
Vermicompost derived from spent coffee grounds: assessing the potential for enzymatic bioremediation. In: Galanakis CM (ed) Handbook of Coffee Processing By-Products.
Sustainable Applications.
Academic Press, London, 2017; 369–398. Publisher Full Text
- Srivastava AK, Ambasht RS:
Litterfall, decomposition, and nitrogen release in two age groups of trees in Casuarina equisetifolia plantations in the dry tropical Vindhyan plateau, India.
Biol Fertil Soils.
1996; 21: 277–283. Publisher Full Text
- Srivastava V, Goel G, Thakur VK, et al.:
Analysis and advanced characterization of municipal solid waste vermicompost maturity for a green environment.
J Environ Manage.
2020; 255: 109914. PubMed Abstract
| Publisher Full Text
- Uma M, Saravanan TS, Rajendran K:
Growth, litterfall and litter decomposition of Casuarina equisetifolia in a semiarid zone.
J Trop For Sci.
2014; 26: 125–133. Reference Source
- Valdés M:
Frankia ecology. In: Pawlowski K, Newton WE (eds) Nitrogen-fixing Actinorhizal Symbioses. Springer, Dordrecht, 2007; 49–71. Publisher Full Text
- Xu Z, Zuo L, Zhang Y, et al.:
Is allelochemical synthesis in Casuarina equisetifolia plantation related to litter microorganisms?
Front Plant Sci.
2022; 13: 1022984. PubMed Abstract
| Publisher Full Text
| Free Full Text
- Yang X, Yang Z, Warren MW, et al.:
Mechanical fragmentation enhances the contribution of Collembola to leaf litter decomposition.
Eur J Soil Biol.
2012; 53: 23–31. Publisher Full Text
- Zhang LH, Zhang SJ, Ye GF, et al.:
Changes of tannin and nutrients during decomposition of branchlets of Casuarina equisetifolia plantation in subtropical coastal areas of China.
Plant Soil Environ.
2013; 59: 74–79. Publisher Full Text