Introduction
The latest studies of recent (< 75 years) earthquake sequences around the Svalbard Archipelago in the Norwegian Arctic (Figure 1a) have shown that seismic activity in this area is probably related to movement along faults with various orientations, including faults striking N–S, NE–SW (Junek et al., 2014; Junek et al., 2015; Pedrosa-Gonzalez et al., 2024; Pirli et al., 2010; Pirli et al., 2013; Pirli et al., 2021), and WNW–ESE (Mitchell et al., 1990). These earthquakes (see Figure 1b for location of all recent earthquakes between 76–80° latitude and 10–30° longitude with Mw ≥ 4.0; International Seismological Centre, 2024) are commonly ascribed to reactivation and/or overprinting of brittle faults inherited from Svalbard’s complex tectonic history. Notable inherited structures are related to the Timanian Orogeny (top-SSW contraction at 650–550 Ma; Koehl, 2019; Koehl, 2020; Koehl et al., 2022a; Koehl et al., 2023a; Koehl & Mottram, 2024; Majka et al., 2008), Caledonian Orogeny (closure of Iapetus Ocean and collision of Greenland and Svalbard at ca. 460–410 Ma; Dallmeyer et al., 1990; Faehnrich et al., 2020; Gee & Page, 1994; Horsfield, 1972; Ohta et al., 1989), late Paleozoic collapse–rift-related extension (multi-kilometer-thick basins; Braathen et al., 2011; Braathen et al., 2018; Cutbill & Challinor, 1965; Manby & Lyberis, 1992; McCann & Dallmann, 1996), Eurekan tectonism (collision of Greenland and Svalbard at ca. 62 Ma; Bergh & Grogan, 2003; Dallmann et al., 1993; Harland & Horsfield, 1974; Steel et al., 1985), and late Cenozoic rifting (starting in the earliest Oligocene; Engen et al., 2008; Lowell, 1972; Thiede et al., 1990).
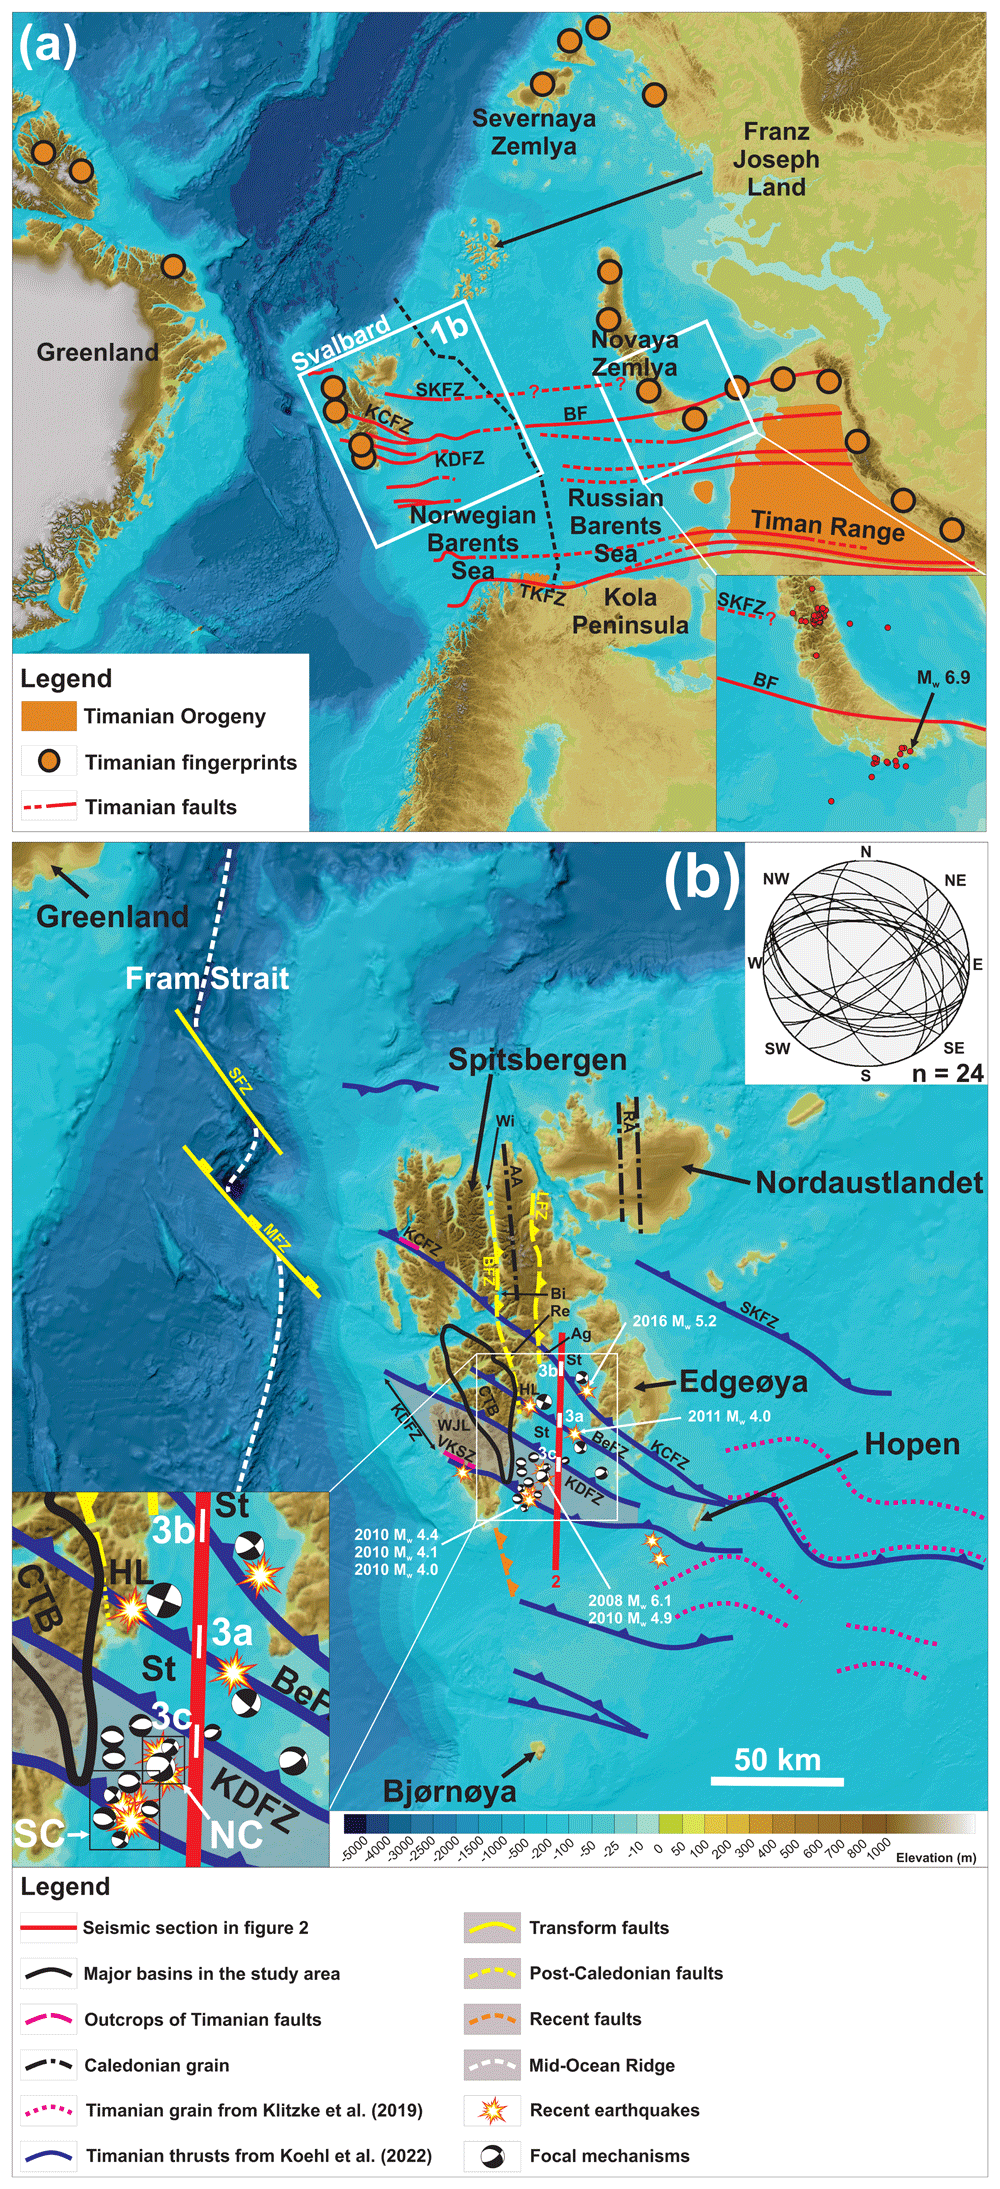
Figure 1. Overview map of the study area.
(a) Overview map of the Barents Sea region showing Timanian thrust systems in Svalbard, the Barents Sea, and northwestern Russia and Novaya Zemlya. Basemap is from Jakobsson et al. (2012). Abbreviations: BF: Baidaratsky Fault Zone; KCFZ: Kongsfjorden–Cowanodden fault zone; KDFZ: Kinnhøgda–Daudbjørnpynten fault zone; SKFZ: Steiløya–Krylen fault zone; TKFZ: Trollfjorden–Komagelva Fault Zone. (b) Overview map showing Timanian thrust systems in the northern Norwegian Barents Sea and Svalbard. The location of recent earthquakes is based on data from the International Seismological Centre (2024). Focal mechanisms are from Pirli et al. (2010; 2013; 2021) and Junek et al. (2014; 2015) and are shown in detail in the lower left corner. The map includes all recent earthquakes between 76–80° latitude and 10–30° longitude with Mw ≥ 4.0 (including the main shock and some aftershocks of the Storfjorden seismic sequence). The lower hemisphere Schmidt stereonet in the upper right corner displays the two fault surfaces extracted from the double-couple solution of each recent earthquakes around Svalbard, which are dominated by E–W- to NW–SE-striking faults (75%). Note that Timanian thrust systems are tens of kilometers wide and that their outline as thin dotted black lines only reflect their overall trend (not their width). Thus, earthquakes located a few kilometers away from dotted black lines still coincide with the location of major WNW–ESE-striking fault systems (e.g., Kinnhøgda–Daudbjørnpynten fault zone, which is 60 km wide along a NNE–SSW-trending axis in Storfjorden; see width of Timanian fault systems in Figure 2). The basemap is from Jakobsson et al. (2012). Abbreviations: AA: Atomfjella Antiform; Ag: Agardhfjellet; BeFZ: Bellsundbanken fault zone; BFZ: Billefjorden Fault Zone; Bi: Billefjorden; CTB: Central Tertiary Basin; HL: Heer Land; KCFZ: Kongsfjorden–Cowanodden fault zone; KDFZ: Kinnhøgda–Daudbjørnpynten fault zone; LFZ: Lomfjorden Fault Zone; NC: northeastern earthquake cluster; RA: Rijpdalen Anticline; Re: Reindalspasset; SC: southwestern earthquake cluster; SKFZ: Steiløya–Krylen fault zone; St: Storfjorden; VKSZ: Vimsodden–Kosibapasset Shear Zone; Wi: Wijdefjorden; WJL: Wedel Jarlsberg Land.
The Storfjorden sequence is a series of seismic events that took place from 2008 to 2016 in Storfjorden, east of Spitsbergen. The sequence began with a Mw 6.1 earthquake at a depth of 15.4 ± 5.1 km on February 21st 2008, which produced a series of aftershocks up to 2016 (Pirli et al., 2013; Pirli et al., 2021). It was initially proposed to have occurred along a preexisting NE–SW-trending brittle fault formed during late Paleozoic–Cenozoic rifting (Pirli et al., 2013). Since crustal-scale, WNW–ESE-striking Timanian thrust systems in the northern Barents Sea and Svalbard were only discovered recently (Koehl, 2019; Koehl, 2020; Koehl et al., 2022a), they were not considered in previous seismotectonic studies (e.g., Mitchell et al., 1990; Pirli et al., 2013). We review the evidence for current movement along deep Timanian thrust systems and related younger and shallower overprinting structures around Svalbard and discuss their implications for earthquake sequences in the Norwegian Arctic and linear earthquake swarms in general.
Geological setting
The Timanian structures discussed here are described in Koehl et al. (2022a) and include E–W- to NW–SE-striking, dominantly NNE-dipping brittle–ductile mylonitic thrust systems and shear zones (Figure 2 and Figure 3). These formed during NNE–SSW-oriented contraction in the latest Neoproterozoic and were later deformed into NNE–SSW-striking folds and reactivated as sinistral-reverse faults during E–W-oriented Caledonian contraction (Figure 1a–b; Koehl et al., 2022a; Koehl et al., 2023b; Koehl, 2024). Notably, the Kongsfjorden–Cowanodden, Bellsundbanken, and Kinnhøgda–Daudbjørnpynten fault zones intersect Storfjorden where multiple earthquakes were recorded in recent years (Figure 1b and Figure 2; Junek et al., 2014; Junek et al., 2015; Pirli et al., 2010; Pirli et al., 2013; Pirli et al., 2021).
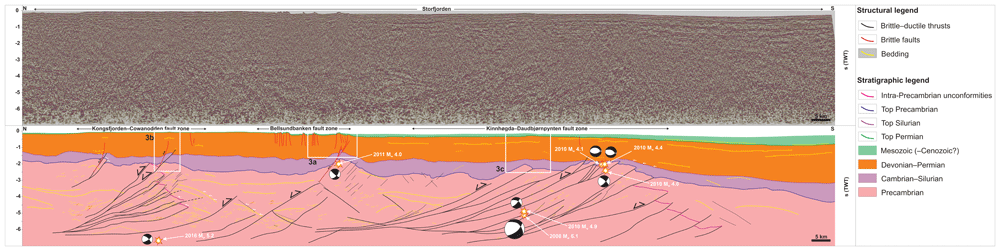
Figure 2. Seismic profile through Storfjorden.
The data (in seconds Two Way-Time – TWT) shows three major, NNE-dipping Timanian thrust systems, including (from north to south) the Kongsfjorden–Cowanodden, Bellsundbanken, and Kinnhøgda–Daudbjørnpynten fault zones. White frames show the location of zoomed-in portion of the profile shown in Figure 3. The three earthquakes are projected along a WNW–ESE-trending axis (i.e., parallel to the Timanian thrust systems), and earthquake depths were time-converted using velocities from Gernigon et al. (2018) and seismic interpretation by Koehl et al. (2022a). A high-resolution version of the figure is available on DataverseNO (Koehl, 2021b). The time-conversion is included in supplement S1. The location of the profile is shown as a red line in Figure 1b.
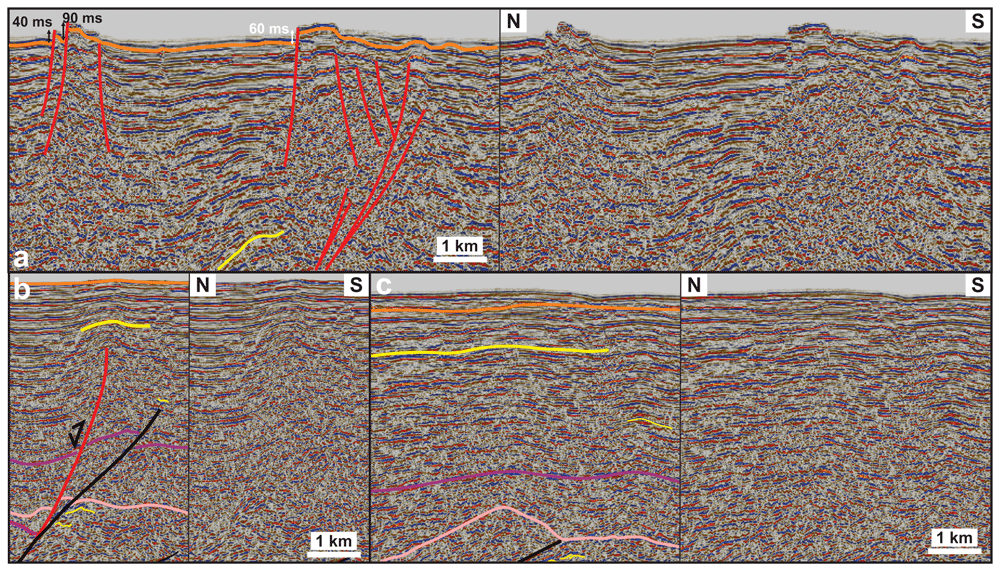
Figure 3. Interpreted and uninterpreted zoomed-in portions of the seismic profile (shown in Figure 2).
(a) Series of normal offsets of the seafloor and sub-surface (offset orange line) along recent, high-angle, brittle overprints (red lines) of the Bellsundbanken fault zone. (b) Gentle, probably early Cenozoic folding of the seafloor and shallow sedimentary strata (yellow line) over and around a blind, high-angle, brittle, Devonian–Carboniferous (?) overprint (red line) of the Kongsfjorden–Cowanodden fault zone (black line). (c) Gentle early Cenozoic (?) folding of the seafloor and sub-surface (yellow, orange, and purple lines) above the northern portion of the Kinnhøgda–Daudbjørnpynten fault zone (black line). The yellow, orange, purple and pink lines in (a–c) respectively corresponds to bedding surfaces, the base of the Mesozoic sedimentary succession, the base of the Devonian–Permian sedimentary succession, and the top of the Proterozoic basement.
The Kongsfjorden–Cowanodden and Bellsundbanken fault zones propagate upwards as brittle overprints that possibly initiated as high-angle listric normal faults during late Paleozoic, late–post-Caledonian extension and were inverted during Eurekan contraction. Inversion resulted in local folding of shallow sedimentary rocks (Figure 2 and Figure 3a–c; Koehl et al., 2022a).
The Kinnhøgda–Daudbjørnpynten fault zone is a c. 60 km wide zone involving km-scale thrust sheets and mylonitic shear zones (Figure 2; Koehl et al., 2022a). This structure runs from the island of Hopen to west of Spitsbergen (Koehl, 2024; Koehl et al., 2022a). It crops out onshore Wedel Jarlsberg Land in southern Spitsbergen, where a major deformation structure of this broad thrust system, the Vimsodden–Kosibapasset Shear Zone, is exposed (Figure 1b; Mazur et al., 2009). The Vimsodden–Kosibapasset Shear Zone is a subvertical, WNW–ESE-striking shear zone associated with late Neoproterozoic amphibolite facies metamorphism (Timanian; Majka et al., 2008; Manecki et al., 1998) and Caledonian sinistral strike-slip reactivation (Faehnrich et al., 2020; Mazur et al., 2009).
The study area is also thought to be crosscut by N–S-striking fault zones, such as the Billefjorden Fault Zone (Haremo et al., 1990; Harland, 1969; Harland et al., 1974) and Lomfjorden Fault Zone (Andresen et al., 1992; Haremo & Andresen, 1992; Piepjohn et al., 2019; Figure 1b). These faults were previously thought to have formed during the early–mid Paleozoic and to have accommodated strike-slip movements of hundreds to thousands of kilometers (Harland, 1969; Harland et al., 1974). Recent studies suggest that the amount of lateral displacement along these faults is challenging to estimate (Piepjohn et al., 2019). In fact, strike-slip movements along these faults are unlikely because they do not show any lateral offset of late Neoproterozoic thrust systems (Koehl et al., 2022a). Instead, the Lomfjorden Fault Zone and Billefjorden Fault Zone (apart from the Odellfjellet segment) are suggested to be Caledonian thrust (Koehl et al., 2022a) and early Cenozoic Eurekan reverse faults respectively (Koehl, 2021a; Koehl et al., 2024).
In the Fram Strait, rifting and breakup occurred later than in the Arctic and northeastern Atlantic oceans, possibly in the earliest Oligocene at ca. 24.8 Ma (Engen et al., 2008). Little magmatism was involved (e.g., Amundsen et al., 1987; Hansen et al., 2003; Skjelkvåle et al., 1989), and ongoing processes include transform faulting along the WNW–ESE-striking Molloy and Spitsbergen fault zones (Figure 1b).
Methods
We use interpretation of seismic reflection data from the Norwegian National Data Repository for Petroleum Data (DISKOS database) of the Norwegian Offshore Directorate using Petrel 2021.3. An open-access alternative to Petrel is OpendTect. We build on previous work by Koehl et al. (2022a). The seismic reflection database is shown in Koehl et al. (2022a their figure 1b). The figures were designed with CorelDraw 2017. An open-access alternative is GIMP.
To tie recent earthquakes to specific structures and slip surfaces on the interpreted regional seismic transects, we time-converted the earthquake hypocentral depths using seismic velocities from Gernigon et al. (2018). An uncertainty to the time conversion process is the possible spatial variation of the density of and, thus, seismic velocities in metamorphosed basement rocks. Previous studies have shown that the most impactful factor on seismic velocities is the composition of the metamorphosed rocks (mafic versus felsic; Gorbatsevich, 2014; Schön, 2011). Overall, seismic velocities in mafic metamorphic rocks are about 1 km.s-1 faster (c. 7 km.s-1) than in felsic metamorphic rocks (c. 6 km.s-1; e.g., Gorbatsevich, 2014). Using a 7.0 km.s-1 velocity for basement rocks (instead of 6.15 km.s-1 from Gernigon et al., 2018) would result in slightly shallower hypocenters (c. 0.01–0.1 second TWT for the shallower hypocenters and up to 0.5 second TWT for the deepest Mw 5.2 2016 hypocenter in northernmost Storfjorden; Figure 1b). Nevertheless, the study area is well within continental crust, and since continental crust is dominated by felsic rocks, the potential variations generated by local occurrences of mafic rocks are believed to be negligible (< 0.1 second TWT) and would thus not impact the model proposed.
Another uncertainty is the earthquake hypocentral depths. Assuming a two sigma-one error, hypocenter depths may vary up to 1 km (in the case of the Mw 5.2 2016 earthquake in northernmost Storfjorden), i.e., ≤ 0.3 second (TWT), i.e., not significant enough to impact the model proposed.
Results
Seismic interpretation
Interpretation of seismic reflection data in Storfjorden shows multiple, ≤ 1 second (TWT) deep brittle faults bounding grabens and horsts on a NNE–SSW-trending seismic section. The faults offset the seafloor by 30–90 milliseconds (TWT), i.e., c. 22–66 meters (Table 1). The clear seismic imaging of these faults on the NNE–SSW-trending seismic section (Figure 2 and Figure 3a) suggests that they strike (sub-) orthogonal to the seismic section, i.e., approximately WNW–ESE.
Table 1. Depth conversion of seafloor offset across the small normal faults in Storfjorden.
See Figure 1b for location of the faults.
| Length (in s TWT) | Length (in m) |
|---|
| Minimum offset | 0.03 | 0 |
| Maximum offset | 0.09 | 0 |
| Velocity from Gernigon et al., 2018 (in m.s-1) | 1470 | |
Initially these faults were interpreted as reverse faults (Koehl et al., 2022a). This error was due to the hard-linked connection of some of the faults with an underlying Devonian–Carboniferous high-angle normal fault, which overprints the Bellsundbanken fault zone. The Devonian–Carboniferous high-angle normal fault was inverted during early Cenozoic Eurekan contraction. Early Cenozoic contractional reactivation is suggested by folding of shallow late Paleozoic–Mesozoic strata there (Figure 3a) and above the tip of Devonian–Carboniferous overprints of other Timanian thrust systems (Figure 3b–c). This contractional episode is clearly distinct from the brittle normal faults truncating the seafloor.
Time-conversion of earthquake hypocentral depths
In order to display the recent earthquakes and correlate them with major structures on seismic reflection data in Storfjorden, we converted the depth obtained for these events into time depth (TWT) using seismic velocities from Gernigon et al. (2018) and seismic rock units from Koehl et al. (2022a). For more detail on the interpretation of the rock units and ties to nearby wellbores, see Koehl et al. (2022a) and related supplements.
To time-convert the hypocentral depths, we calculated the thickness and cumulated depth in meters of the water column and of the rock layers from Koehl et al. (2022a) with finite thickness, i.e., Mesozoic, upper Paleozoic, and lower Paleozoic rock successions (Figure 2; fifth and sixth columns in upper sub-tables in Table 2). We then calculated the thickness (in meters) of Precambrian basement rocks required to reach the depth of the hypocenters obtained from the International Seismological Centre database (second column in lower sub-tables in Table 2). We time-converted that thickness (third column in lower sub-tables in Table 2) and added it to the thickness of overlying rock units with finite thickness to obtain the time depth of the earthquake hypocenter on the seismic section (Figure 2). Finally, we projected the earthquake locations on the seismic section along a WNW–ESE-trending axis, i.e., parallel to major Timanian thrust systems in the area to see if these structures could be responsible for the studied earthquakes.
Table 2. Time conversion of earthquake hypocentral depths in Storfjorden for projection on the interpreted seismic data.
See Figure 2 for projection of the hypocenters after conversion of their hypocenter’s depths into time depth.
Time conversion of the depth of earthquakes in Storfjorden for projection
on interpreted seismic reflection data. | | |
|---|
Calculation Mw 6.1 2008 earthquake Storfjorden (main
shock of the Storfjorden sequence along the Kinnhøgda-
Daudbjørnpynten fault zone) | | | |
|---|
| Interval | Thickness from Koehl
et al. (in s TWT) | Velocity from Gernigon et al., 2018 (in m.s-1) | Velocity
used | Calculated
thickness (m) | Calculated
cumulated depth (m) |
|---|
| Water | 0.1 | 1470 | 1470 | 73.5 | 73.5 |
Mesozoic (most
likely Triassic) | 0.25 | 3600–4550 | 4075 | 509.375 | 582.875 |
| Upper Paleozoic | 1.5 | 5000–5800 | 5400 | 4050 | 4632.875 |
| Lower Paleozoic | 0.3 | 5900–6300 | 6100 | 915 | 5547.875 |
Proterozoic
basement rocks | ? | 6000–6300 | 6100 | | |
Depth Mw 6.1 Storfjorden
earthquake (m) | Missing thickness of Proterozoic
basement rocks (m) | Missing thickness of Proterozoic basement
rocks (s TWT) |
|---|
| 15000 | 9452.125 | 3.10 |
| 9700 | 4152.125 | 1.36 |
| 20400 | 14852.125 | 4.87 |
Calculation Mw 4.0 2011 earthquake Storfjorden (aftershock of the
Storfjorden sequence along brittle overprint of the Bellsundbanken fault
zone) | | |
|---|
| Interval | Thickness from
Koehl et al. (in s TWT) | Velocity from Gernigon et al., 2018 (in m.s-1) | Velocity
used | Calculated
thickness (m) | Calculated cumulated
depth (m) |
|---|
| Water | 0.1 | 1470 | 1470 | 73.5 | 73.5 |
Mesozoic (most
likely Triassic) | 0.05 | 3600–4550 | 4075 | 101.875 | 175.375 |
| Upper Paleozoic | 1 | 5000–5800 | 5400 | 2700 | 2875.375 |
| Lower Paleozoic | 0.4 | 5900–6300 | 6100 | 1220 | 4095.375 |
Proterozoic
basement rocks | ? | 6000–6300 | 6150 | | |
| Depth Mw 4.0 earthquake (m) | Missing thickness of Proterozoic
basement rocks (m) | Missing thickness of Proterozoic basement
rocks (s TWT) |
|---|
| 5000 | 904.625 | 0.29 |
| 7500 | 3404.625 | 1.11 |
Calculation Mw 5.2 2016 earthquake Storfjorden (along the Kongsfjorden-
Cowanodden fault zone) | | |
|---|
| Interval | Thickness from
Koehl et al. (in s TWT) | Velocity from Gernigon et al., 2018 (in m.s-1) | Velocity
used | Calculated
thickness (m) | Calculated
cumulated depth (m) |
|---|
| Water | 0.1 | 1470 | 1470 | 73.5 | 73.5 |
Mesozoic (most
likely Triassic) | 0 | 3600–4550 | 4075 | 0 | 73.5 |
| Upper Paleozoic | 1.5 | 5000–5800 | 5400 | 4050 | 4123.5 |
| Lower Paleozoic | 0.4 | 5900–6300 | 6100 | 1220 | 5343.5 |
Proterozoic
basement rocks | ? | 6000–6300 | 6150 | | |
Depth Mw 5.2 earthquake
(m) | Missing thickness of Proterozoic
basement rocks (m) | Missing thickness of Proterozoic
basement rocks (s TWT) |
|---|
| 20000 | 14656.5 | 4.77 |
Calculation Mw 4.9 2010
earthquake Storfjorden
(aftershock of the Storfjorden
sequence along the Kinnhøgda-
Daudbjørnpynten fault zone) | | | | | |
|---|
| Interval | Thickness from Koehl
et al. (in s TWT) | Velocity from
Gernigon et al., 2018 (in m.s-1) | Velocity
used | Calculated
thickness (m) | Calculated
cumulated
depth (m) |
|---|
| Water | 0.1 | 1470 | 1470 | 73.5 | 73.5 |
| Mesozoic (most likely Triassic) | 0.25 | 3600–4550 | 4075 | 509.375 | 582.875 |
| Upper Paleozoic | 1.5 | 5000–5800 | 5400 | 4050 | 4632.875 |
| Lower Paleozoic | 0.3 | 5900–6300 | 6100 | 915 | 5547.875 |
| Proterozoic basement rocks | ? | 6000–6300 | 6150 | | |
Depth Mw 4.9
earthquake (m) | Missing thickness of Proterozoic
basement rocks (m) | Missing thickness of Proterozoic basement
rocks (s TWT) |
|---|
| 14000 | 8452.125 | 2.75 |
Calculation Mw 4.1 & 4.4 2010 southern earthquakes Storfjorden
(aftershocks of the Storfjorden sequence along the Kinnhøgda-
Daudbjørnpynten fault zone) | | |
|---|
| Interval | Thickness from
Koehl et al. (in s
TWT) | Velocity from
Gernigon et al., 2018
(in m.s-1) | Velocity
used | Calculated
thickness (m) | Calculated
cumulated
depth (m) |
|---|
| Water | 0.2 | 1470 | 1470 | 147 | 147 |
Mesozoic (most
likely Triassic) | 0.2 | 3600–4550 | 4075 | 407.5 | 554.5 |
| Upper Paleozoic | 1.5 | 5000–5800 | 5400 | 4050 | 4604.5 |
| Lower Paleozoic | ? | 5900–6300 | 6100 | | |
Proterozoic
basement rocks | ? | 6000–6300 | 6150 | | |
Depth Mw 4.1 & 4.4
earthquakes (m) | Missing thickness of lower Paleozoic
rocks (m) | Missing thickness of lower Paleozoic
rocks (s TWT) |
|---|
| 5000 | 395.5 | 0.13 |
Calculation Mw 4.0 2010 southern earthquake Storfjorden (aftershock
of the Storfjorden sequence along the Kinnhøgda-Daudbjørnpynten
fault zone) | | |
|---|
| Interval | Thickness from
Koehl et al. (in s
TWT) | Velocity from
Gernigon et al., 2018
(in m.s-1) | Velocity
used | Calculated
thickness (m) | Calculated
cumulated depth (m) |
|---|
| Water | 0.2 | 1470 | 1470 | 147 | 147 |
Mesozoic (most
likely Triassic) | 0.2 | 3600–4550 | 4075 | 407.5 | 554.5 |
| Upper Paleozoic | 1.5 | 5000–5800 | 5400 | 4050 | 4604.5 |
| Lower Paleozoic | 0.2 | 5900–6300 | 6100 | 610 | 5214.5 |
Proterozoic
basement rocks | ? | 6000–6300 | 6150 | | |
Depth Mw 4.0 earthquake
(m) | Missing thickness of Proterozoic
basement rocks (m) | Missing thickness of Proterozoic
basement rocks (s TWT) |
|---|
| 6000 | 785.5 | 0.26 |
After time conversion and projection on the seismic reflection data, the main event (Mw 6.1) of the 2008–2016 Storfjorden seismic sequence and the 2010 aftershock with the highest magnitude (Mw 4.9) correlate with a major, c. 60 km wide, gently NNE-dipping, mylonitic thrust surface at a depth of 5.0–5.1 seconds TWT, i.e., in the deeper half of the Kinnhøgda–Daudbjørnpynten fault zone (Figure 2). There, the fault zone consists of folded (yellow lines) and imbricated, probably metamorphosed rock units and two major fault surfaces that die out below 4.0–4.5 seconds (TWT; Figure 2). Three 2010 aftershocks with Mw 4.0–4.4 of the Storfjorden seismic sequence occurred in the shallow portion of the fault zone, just below the boundary of Precambrian rocks with lower Paleozoic rocks at ca. 2.0–2.5 seconds (TWT; Figure 2). There, these events coincide with moderately NNE-dipping fault surfaces of more modest size (up to a few km). At depth, these fault surfaces merge with a major gently NNE-dipping fault surface, which nearly intersects with the 2008 Mw 6.1 main event and 2010 Mw 4.9 aftershock (Figure 2).
Farther north, the 2011 Mw 4.0 event occurred at a depth of 1.8–1.9 seconds (TWT) and correlates with a high-angle brittle overprint of the Bellsundbanken fault zone (red line in Figure 2), near the boundary with overlying lower Paleozoic rocks. The location of this event also corresponds with that of the interpreted small normal faults, which offset the seafloor (Figure 2 and Figure 3a).
Farther north, east of Edgeøya, the 2016 Mw 5.2 event occurred at a depth of 6.7–6.8 seconds (TWT) and correlates either with the lowermost portion of the Kongsfjorden–Cowanodden fault zone or the northward prolongation of a major, gently NNE-dipping fault surface of the Bellsundbanken fault zone (Figure 2). The truncation of the seafloor by small normal faults above the Bellsundbanken fault zone (Figure 3a) suggests the latter to be more likely.
Discussion
Potential source of the Storfjorden seismic sequence and other recent earthquakes in Svalbard
The 2008–2016 Storfjorden seismic sequence (Pirli et al., 2013; Pirli et al., 2021) could have been caused by movement along either a NW–SE-striking, northeast-dipping fault, or a NE–SW-striking, subvertical fault. Pirli et al. (2013) attributed the sequence to movements along a postulated NE–SW-striking fault at a depth of c. 15 km. Their interpretation is based on previous studies of mostly low-quality legacy seismic data in adjacent areas (Bergh & Grogan, 2003; Faleide et al., 1984), on a potential “ridge-like” structure inferred from NE–SW-trending (i.e., sub-parallel to the stipulated fault) ocean-bottom-seismometer transects (Breivik et al., 2005; Czuba et al., 2008), and on a presumed gradual southwestwards migration of earthquakes over time (Pirli et al., 2013 their figure 2e–f).
The “ridge-like” structure interpreted by Breivik et al. (2005) and Czuba et al. (2008) on an ocean-bottom-seismometer transect in Storfjorden is unlikely to be associated with movement along a NE–SW-striking fault. First, the “ridge-like” structure was interpreted on only one ocean-bottom-seismometer transect and, thus, its trend is uncertain. Second, the ocean-bottom-seismometer transect on which it was interpreted trends NE–SW, i.e., parallel to the presumed NE–SW-striking fault inferred by Faleide et al. (1984). Such a feature is therefore unlikely to show well on a sub-parallel transect. It is therefore more likely that the “ridge-like” feature instead reflects uplifted basement rocks along a WNW–ESE-striking fault system. The NNE-dipping thrust systems interpreted by Koehl et al. (2022a) strike suborthogonal to the ocean-bottom-seismometer transect of Breivik et al. (2005) and Czuba et al. (2008). Moreover, the “ridge-like” structure coincides with the trace of the Bellsundbanken fault zone, which uplifted relatively dense Precambrian basement rocks at this location (Figure 2).
Based on structural interpretation of seismic and potential field data in the area, another possibility is that the “ridge-like” feature in Breivik et al. (2005) and Czuba et al. (2008) reflects N–S-trending structural fabric of the Caledonian Orogeny and/or of a N–S-striking fault zones, such as the Billefjorden and Lomfjorden fault zones (Figure 1b). This is supported by narrow, N–S- to NNE–SSW-trending positive magnetic anomalies in Storfjorden (see Koehl et al., 2022a their fig. 5), which merge with anomalies related to Caledonian structural fabrics in northern Spitsbergen (e.g., Atomfjella Antiform; Witt-Nilsson et al., 1998) and Nordaustlandet (e.g., Rijpdalen Anticline; Dumais & Brönner, 2020; Figure 1b). However, no focal mechanisms suggest any relationship to N–S-striking structures (Junek et al., 2014; Junek et al., 2015; Pirli et al., 2010; Pirli et al., 2013; Pirli et al., 2021; Figure 1b).
In addition, the relatively shallow character of the Billefjorden and Lomfjorden fault zones, i.e., mostly surficial or near the surface down to c. 2.2–2.3 km depth at Reindalspasset (Bælum & Braathen, 2012; Koehl, 2021a; Koehl et al., 2024) suggest that they cannot be responsible for the earthquakes, which all occurred at ≥ 5 km depth. Moreover, new constraints on their size from recent studies (hundreds of meters to a kilometer in width, tens of kilometers length) and timing of formation (respectively early Cenozoic and early–mid Paleozoic; Koehl & Allaart, 2021; Koehl et al., 2024) suggest that the Billefjorden and Lomfjorden fault zones are significantly smaller (by one to two orders of magnitudes) and younger than the tens of km wide, hundreds-to-thousands of km long, crustal-scale, late Neoproterozoic Timanian thrust systems in Svalbard and the northern Barents Sea (Koehl et al., 2022a; Figure 1a–b and Figure 2). Furthermore, new evidence suggest that the Agardhfjellet segment of the Lomfjorden Fault Zone was controlled by a Timanian thrust (Kongsfjorden–Cowanodden fault zone; Koehl et al., 2022a). Thus, the Billefjorden and Lomfjorden fault zones are unlikely to be potential sources for the Storfjorden seismic sequence and other recent earthquakes in Svalbard.
The compilation of nodal planes extracted from the focal mechanisms associated with the earthquakes around Spitsbergen (International Seismological Centre, 2024 http://www.isc.ac.uk/iscbulletin/search/fmechanisms) shows that 75% (18 of 24) of all nodal planes strike NW–SE to E–W (see stereonet in Figure 1b) and that all the double-couple focal mechanisms involve at least one NW–SE to E–W nodal plane, i.e., parallel to Timanian thrust systems. This implies that all the earthquake focal mechanisms are consistent with movement along NW–SE- to E–W-striking Timanian faults. In contrast, only 50–60% involve a NE–SW-striking plane. In addition, interpretation of NW–SE-trending seismic reflection transects clearly indicates that there is no NE–SW-striking fault in the area. Note that the nodal planes plotted in the stereonet in Figure 1b do not include those of the Heer Land earthquake sequence, which is associated with a sub-vertical WNW–ESE-striking fault surface (c. 110°; see Mitchell et al., 1979; Mitchell et al., 1990). Therefore, at least half of all the recent Mw ≥ 4.0 earthquakes around Svalbard between latitude 76–80° and longitude 10–30° are likely related to movement along WNW–ESE-striking faults.
Recent mapping of tectonic structures with high-resolution seismic data and potential field (magnetic and gravimetric) data by Koehl et al. (2022a) indicates that the main structures and fabrics at depth in Storfjorden strike WNW–ESE to NW–SE (Figure 1a–b and Figure 2). These structures crosscut tightly folded and metamorphosed Precambrian basement rocks and form part of gently NNE-dipping, mylonitic thrust systems and related high-angle overprints (Koehl et al., 2022a; Figure 2). While these thrust systems are located at great depth in Storfjorden (Figure 2), E–W-oriented Caledonian and Eurekan contraction contributed to exhume them in western Spitsbergen, where they yield late Neoproterozoic to earliest Cambrian U–Pb ages (Faehnrich et al., 2020; Koehl & Mottram, 2024; Figure 1b), which indicate formation during the Timanian Orogeny. These thrust systems, especially the Kinnhøgda–Daudbjørnpynten, Bellsundbanken, and Kongsfjorden–Cowanodden fault zones, were then reactivated and/or overprinted during the Caledonian Orogeny, Devonian–Carboniferous extension, and early Cenozoic Eurekan event (e.g., Faehnrich et al., 2020; Koehl et al., 2022a; Ziemniak et al., 2022). Notably, gentle folding of shallow late Paleozoic–Mesozoic rock successions in Storfjorden suggest that both the Kongsfjorden–Cowanodden, Bellsundbanken, and Kinnhøgda–Daudbjørnpynten fault zones were mildly reactivated during the early Cenozoic Eurekan event (Figure 2 and Figure 3a–c). This suggests that Timanian fault zones are prone to reactivation and are likely sources for recent earthquakes around Svalbard.
The present study shows several normal offsets of the seafloor reflection across WNW–ESE-striking brittle faults (Figure 2 and Figure 3a). Some of these small faults merge at depth with a gently NNE-dipping Timanian thrust system, the Bellsundbanken fault zone (black lines in Figure 2), and its high-angle overprints (red lines in Figure 2 and Figure 3a). This connection (in some cases hard linked) suggests ongoing inversion (i.e., with normal motion) of the Timanian thrust systems in Storfjorden. The time-conversion of the earthquake hypocentral depths in the present study (Table 2) shows that each of the major Mw ≥ 4.0 events can be correlated to a discrete WNW–ESE-striking fault surface at depth (Figure 2). In addition, the 1977–1981, 3–5 km deep, Heer Land seismic sequence and the 2011, 5 km deep, Mw 4.0 event align along the trace of the Bellsundbanken fault zone and display consistent sinistral to normal-sinistral kinematics according to the focal mechanisms (Figure 1b; Mitchell et al., 1979; Mitchell et al., 1990; Pirli et al., 2010; Pirli et al., 2013). We therefore propose that the Storfjorden seismic sequence and most (if not all) the recent earthquakes around Svalbard were caused by reactivation of inherited NNE-dipping Timanian thrust systems and related overprints.
A feature of interest is the mild deviations from the main WNW–ESE Timanian trend of the strike of local fault surfaces suggested by the focal mechanisms (Figure 1b). The focal mechanisms suggest fault striking E–W to NW–SE (Junek et al., 2014; Junek et al., 2015; Pirli et al., 2010; Pirli et al., 2013; Pirli et al., 2021; Figure 1b). Although Timanian thrust systems strike overall WNW–ESE, they are notably known to have been folded during subsequent oblique Caledonian and Eurekan contraction. Thus, they locally display NW–SE- and E–W-striking geometries (Koehl et al., 2022a; Koehl et al., 2023b; Koehl & Stokmo, 2024), which accounts for the observed mild fault strike variations obtained from the focal mechanisms.
The strong impact of Timanian structures on the structural development of Svalbard and on present-day tectonics is further illustrated by ongoing deformation and seismicity along the Timanian thrust front onshore northern Norway and the Kola Peninsula in northwestern Russia, the Trollfjorden–Komagelva Fault Zone (see location in Figure 1a; Gurevich et al., 1972; Karpuz et al., 1994; Roberts et al., 1997).
Implications for linear earthquake swarms
Earthquakes of the Storfjorden seismic sequence migrated to the southwest between 2008 and 2012 (Pirli et al., 2013). The migration was initially described as progressive and interpreted to indicate movement along a presumed NE–SW-striking fault (Pirli et al., 2013). However, since the migration occurred exclusively between two and three years after the main event (Pirli et al., 2013 their figure 2e–f), it is equally possible to describe it as abrupt and to separate the sequence into two clusters (northeastern and southwestern; see lower left inset in Figure 1b).
After time conversion (Table 2), the main events (Mw ≥ 4.0) of the two clusters coincide with discrete fault surfaces of the 60 km wide, NNE-dipping Kinnhøgda–Daudbjørnpynten fault zone at depth (Figure 1b and Figure 2). The main 2008 event and the 2010 Mw 4.9 aftershock (northeastern cluster) occurred at a 15.1 ± 5.4 km depth in the direct vicinity of two fault surfaces tens of km wide, which die out upwards below depths of 4.0–4.5 seconds, i.e., blind faults (TWT; Figure 2 and Figure 4a–b). By contrast, the southwestern cluster of Mw ≥ 4.0 aftershocks occurred at much shallower depth (5–6 km) near moderately to gently NNE-dipping, all of which merge with one another downwards and can be traced at depth as a major ≥ 30 km wide gently dipping fault surface that extends 0.2–0.5 second (TWT) away from the location of the main two events of the northeastern cluster (Figure 2 and Figure 4b).
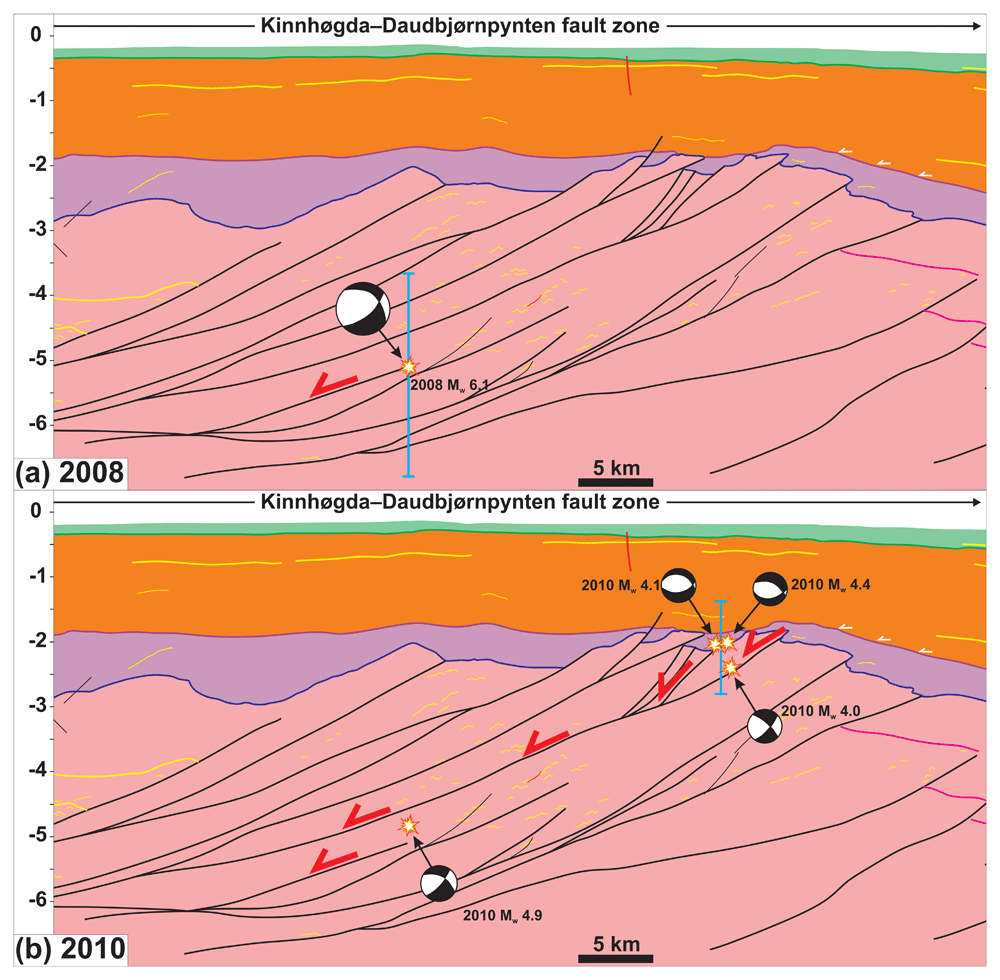
Figure 4. Zoom in the Kinnhøgda–Daudbjørnpynten fault zone.
The figure shows a scenario that explains the abrupt southward migration of earthquakes of the Storfjorden sequence from 2008 to 2010 involving reactivation of two discrete thrust fault surfaces within the fault zone (see red half arrows). See Figure 2 for location of the profile. (a) In 2008, a deep, shallow dipping thrust surface was reactivated. (b) In 2010, a shallower thrust fault surface was reactivated, possibly due to continued movement along the deep thrust fault surface that triggered the 2008 earthquake. The blue error bars in (a–b) represent the uncertainty associated with hypocenter’s depth.
Based on these spatiotemporal relationships, we propose that normal-sinistral movements related to regional tectonics occurred along a 14–15 km deep (i.e., ca. 5.0–5.5 seconds TWT), gently NNE-dipping, blind fault surface and triggered the main earthquake of the Storfjorden seismic sequence in 2008 (Figure 4a). These movements are believed to have created local instabilities along a nearby, NNE-dipping, shallower fault surface. Upwards propagation of the instabilities along the fault surface, i.e., towards the southwest, triggered the 2010 aftershocks of the southwestern cluster (Figure 4b). In this model, the migration of seismic events occurs abruptly when rupture occurs along a second nearby fault surface at shallower depth. This model is supported by the kinematics of the focal mechanisms of the aftershocks in the southwestern cluster, which suggest normal and normal-sinistral movements, i.e., in line with the regional kinematics along the main fault at depth (normal-sinistral) and with local shallow collapse processes in response to deep instabilities (normal; Figure 1b).
Regardless of the associated error, the depth of the southwestern cluster is unlikely to be less than 5 km because no fault is seen in post-Caledonian sedimentary strata in the area (Figure 2 and Figure 4a–b). Even if a 50% error is assumed, the depth of the southwestern cluster (5–7.5 km) would still be significantly shallower than that of the northeastern cluster (9.7–20.4 km; blue error bars in Figure 4a–b). In addition, the southwestern cluster would still likely be triggered by the same fault surface due to the relatively low uncertainty and absence of faults in post-Caledonian sedimentary rocks (Figure 4b). Thus, the model proposed for the southwestward migration of earthquakes over time would still be consistent with the hypocenters being deeper.
The proposed model has implications for the source of linear earthquake swarms worldwide and suggests that these may be triggered by reactivation and/or overprinting of inherited, crustal-scale, brittle–ductile thrust systems. Other earthquake swarms with similar characteristics have been reported, for example, in northern Norway and along the San Andreas fault.
In northern Norway, Igland (2016) identified a NW–SE-striking linear earthquake swarm. Based on focal mechanisms indicating mostly normal movements, and gradual migration towards the southeast and the surface, he suggested that the earthquake swarm was generated by normal movements along a northwest-dipping fault. This fault geometry is typical of Caledonian thrust systems and their extensional overprints in the area (Péron-Pinvidic & Osmundsen, 2020; Roberts, 2003). It is therefore possible that there too, deep thrust systems are responsible for recent seismicity.
In southern California, several such linear earthquake swarms have been recorded at the southern termination of the San Andreas fault (Hauksson et al., 2017; Hauksson et al., 2022). There, the San Andreas fault terminates and steps as the Imperial fault across the Brawley seismic zone. A notable feature of interest is the 2005 Mw 5.1 Obsidian Butte Sequence, which occurred as a NE–SW-striking swarm of earthquakes aligning along a gently northeast-dipping plane. Similarly to the Storfjorden seismic sequence, events of the Obsidian Butte Sequence occurred initially at deeper crustal level (i.e., to the northeast) and migrated upwards and to the southeast over time (Hauksson et al., 2022 their figure 12a). Extensive studies of the San Andreas fault have suggested that it is related to gently northeast-dipping faults at a few km depth (e.g., Fuis et al., 2017 their figure 6; Janecke et al., 2018 their figure 15). Given the recently identified global correlation of major transform faults with preexisting orogens (Koehl & Foulger, 2024), the formation of the San Andreas fault and thus ongoing seismicity along this major transform plate boundary may be controlled by preexisting thrust systems in local orogens, e.g., Nevadan Orogen (Bateman, 1968; Garlick et al., 2009; Schweickert et al., 1984).
Driving mechanism of present-day tectonics
Recent studies have stressed the impact of unloading and ensuing isostatic rebound on recent tectonic movements along the western Svalbard–Barents Sea margin (Cooke et al., 2023; Pedrosa-Gonzalez et al., 2024; Plaza-Faverola & Keiding, 2019). Pedrosa-Gonzalez et al. (2024) notably suggested that recent reverse faulting south of Spitsbergen is related to postglacial rebound. While this is possible in their study area where Cenozoic brittle thrusts of the West Spitsbergen Fold-and-Thrust Belt occur at shallow levels (e.g., Bergh & Grogan, 2003), the structural setting in Storfjorden is different. There, all the recent earthquakes show focal mechanisms indicating normal, normal–sinistral, or sinistral strike-slip (Junek et al., 2014; Junek et al., 2015; Mitchell et al., 1979; Mitchell et al., 1990; Pirli et al., 2010; Pirli et al., 2013; Pirli et al., 2021; Figure 1b). While the normal component (uplift of the horst blocks) may be (partly?) ascribed to postglacial rebound, the sinistral strike-slip component cannot (e.g., Wu et al., 1999).
The sinistral strike-slip component of movement along WNW–ESE-striking faults (e.g., in Heer Land and west of Edgeøya; Mitchell et al., 1979; Mitchell et al., 1990; Pirli et al., 2013; Figure 1b) matches the present-day kinematics at the southeastern tips of the Molloy and Spitsbergen fault zones in the Fram Strait (Figure 1b and Figure 5a–b). Recent studies indicate that the Kongsfjorden–Cowanodden and Kinnhøgda–Daudbjørnpynten fault zones extend past the De Geer Zone into the Fram Strait (Koehl, 2024; Koehl & Mottram, 2024). It is therefore plausible that they transfer sinistral transform movements in the Fram Strait as sinistral strike-slip movements in Storfjorden. Thus, a probable driving mechanism for most of the recent normal and sinistral strike-slip faulting and seismicity in Svalbard is transtension related to transform faulting (Figure 5a–b). This is supported by the 32.9 ± 9.9 Ma (earliest Oligocene) U–Pb age obtained for syn-kinematic carbonates along a reactivated Timanian thrust with sinistral–normal kinematics in western Spitsbergen (Koehl & Mottram, 2024; Figure 5a), i.e., well before post-glacial rebound. In this scenario, WNW–ESE-oriented extension in the Fram Strait is accommodated through sinistral–normal movements along inherited Timanian thrusts, which localized the formation of core complexes in the Fram Strait (Figure 5a) and, later on, of transform faults (Koehl et al., 2021; Figure 5b). Thus, post-glacial rebound may have only minor influence on seismicity in Storfjorden.
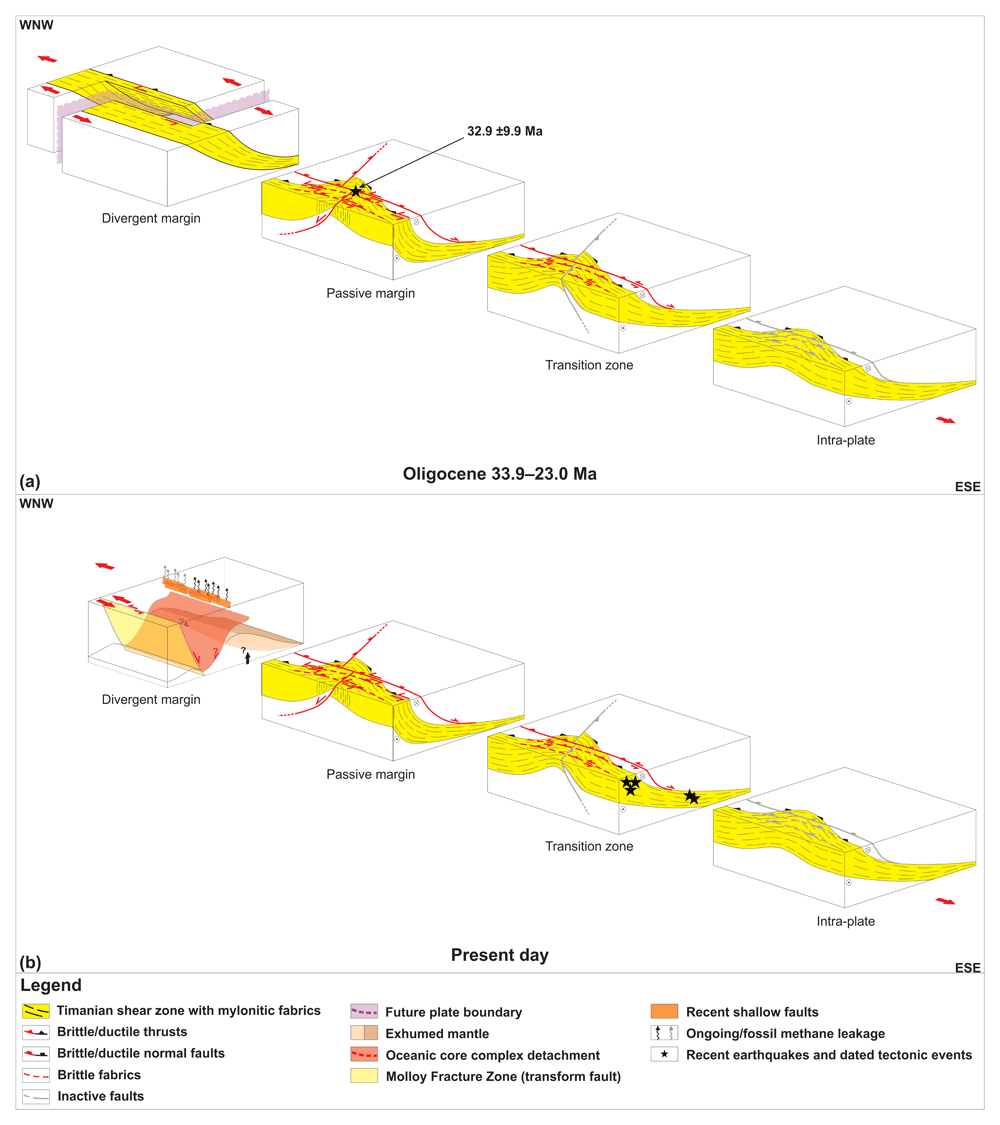
Figure 5. Schematic model of the breakup of the Fram Strait.
(a) Breakup is hindered by the Timanian Orogen. Timanian thrust systems control the breakup and localize the formation of margin-oblique core complexes and related detachments near the future plate boundary and normal–sinistral strike-slip faulting occurs along Timanian thrusts in adjacent areas (e.g., 32.9 ±9.9 Ma U–Pb on synkinematic carbonate from Koehl & Mottram, 2024). (b) Transform faults form along major Timanian thrusts and take margin-oblique core complexes are only mildly active or inactive. Continued normal–sinistral strike-slip movements occur along inherited Timanian thrust systems in nearby areas (e.g., recent earthquakes in transition zone). Modified after Koehl et al. (2021; 2022a).
Ridge push in the Fram Strait may have had a limited impact on seismicity in Svalbard. Ridge-push is thought to be responsible for recent earthquakes (1989–1996) on reverse faults in northern Norway (Bungum & Lindholm, 1997; Roberts et al., 1997) and is also a potential driving mechanism for the observed seismicity around Spitsbergen (e.g., recent east-dipping thrust fault south of Spitsbergen; Pedrosa-Gonzalez et al., 2024).
Since no recent earthquakes have been recorded in central and western Spitsbergen, strain along the western portion of Timanian thrust systems may be accommodated aseismically (e.g., via plastic deformation or lubricated fault surfaces). A possible hypothesis to be tested is lubrication of slip surfaces along Timanian thrust systems in western and central Spitsbergen facilitated by their proximity to surface water (Koehl, 2024; Koehl & Mottram, 2024; Koehl et al., 2022a; Mazur et al., 2009).
Another possibility is that the lack of earthquakes in central and western Spitsbergen is related to the presence of a thick sedimentary basin in this area in the form of a major Caledonian–Eurekan syncline. While competent metamorphosed Precambrian basement rocks are found at relatively shallow crustal levels in Storfjorden, the syncline in central Spitsbergen includes several kilometers of heterogeneous, relatively weak (compared to metamorphic basement rocks) upper Paleozoic, Mesozoic, and Cenozoic sedimentary successions (e.g., Central Tertiary Basin; Blinova et al., 2013; Steel et al., 1981; Figure 1b). The relatively weak character of these sedimentary successions is at least partly due to the dominance of weak rock types within the syncline. For example, the ≤ 8–10 km thick Lower Devonian to lowermost Upper Devonian succession is dominated by weak shales (Friend, 1961; Friend et al., 1997; Murascov & Mokin, 1979), and uppermost Devonian–Mississippian (Aakvik, 1981; Cutbill & Challinor, 1965; Cutbill et al., 1976; Gjelberg, 1984), Pennsylvanian–Permian (Harland et al., 1988; Lønøy, 1995; Pickard et al., 1996; Ringset & Andresen, 1988; Samuelsberg & Pickard, 1999), Triassic (Worsley & Mørk, 1978), and lower Cenozoic successions (Livshits, 1965; Livshits, 1974; Livshits, 1992; Steel et al., 1981) in central and western Spitsbergen involve large amounts of coals, shales, and evaporites. Weak rock types are more prone to folding and (shale) smearing during deformation (i.e., plastic deformation), especially at shallow crustal levels. A key example is the San Andreas fault in California, along which strongly folded shale-rich sedimentary strata crop out (Bergh et al., 2019; Janecke et al., 2018; Koehl et al., 2022b; Miller, 1998). The weakness of sedimentary strata permits them to accumulate significant amounts of shortening prior to rupture. Thus, the thick weak sedimentary deposits in the Central Tertiary Basin may partly explain the absence of recent earthquakes in central Spitsbergen.
Intra-plate seismicity occurring off the active transform fault segment also occurs in connection to other major transform faults. For example, the Davie fault zone, offshore the Mozambique Basin, is associated with many recent earthquakes with focal mechanisms suggesting normal and sinistral strike-slip movements along N–S-striking fault surfaces (Bertil et al., 2021). These kinematics might be explained by residual extension at the Somali Basin fossil mid-ocean ridge. However, since rifting there ceased at ca. 121 Ma (Davis et al., 2016), this is unlikely. A more probable driving mechanism is ongoing rifting and seafloor spreading at the South-West Indian Ridge and related sinistral transform faulting at the Andrew Bain Fault Zone (Peyve et al., 2007; Sclater et al., 2005). Similarly to the Storfjorden area in Svalbard, the Davie fault zone parallels thrust structures of the East African Orogen (Armistead, 2019; Boger et al., 2015; Collins et al., 2000; Collins et al., 2012; De Waele et al., 2011; Key et al., 1989; Mosley, 1993; Shackleton, 1996; Stern & Kröner, 1993), and possibly formed along such structures (Koehl & Foulger, 2024) as suggested from contractional structures parallel to the Davie fault zone on seismic reflection data (Klimke et al., 2018 their figure 6). It is therefore possible that seismicity in the Mozambique Channel occurs along inherited late Neoproterozoic thrusts of the East African Orogen.
Earthquake risk of Timanian thrust systems
Should extension in the Fram Strait persist, it would be natural to expect further movement along inherited, crustal-scale Timanian structures and associated younger overprints in the near future. It is therefore paramount to carefully evaluate their geohazard potential for local communities.
Using the equation of Wells & Coppersmith (1994) for sub-surface rupture, the potential maximum magnitude of an earthquake generated by rupture along the entire length of the Kongsfjorden–Cowanodden fault zone and its Russian continuation, the Baidaratsky Fault Zone (Korago et al., 2004; Lopatin et al., 2001), i.e., total fault length of 2000 km, is c. 8.9 (Table 3). This is similar to major subduction-related fault zones at present, e.g., Sunda Trench, Cascadia subduction zone, Alaska–Aleutian Trench, and Japan Trench (e.g., Atwater et al., 1991; Atwater et al., 2015; Hubbard et al., 2015). This a lower estimate considering that (1) the equation of Wells & Coppersmith (1994) generally yields lower magnitudes than modern datasets suggest (e.g., Stirling et al., 1998) and (2) the Kongsfjorden–Cowanodden fault zone may extend farther southeast in Russia (Korago et al., 2004; Lopatin et al., 2001) and possibly farther offshore in the Fram Strait (e.g., Koehl et al., 2021).
Table 3. Maximum earthquake magnitude along the studied faults using the equation of Wells and Coppersmith (1994).
The faults include the Kongsfjorden–Cowanodden fault zone (KCFZ) and Kinnhøgda–Daudbjørnpynten fault zone (KDFZ). Abbreviations: KCFZ: Kongsfjorden–Cowanodden fault zone; KDFZ: Kinnhøgda–Daudbjørnpynten fault zone.
| Maximum earthquake magnitude | |
|---|
| Fault length KCFZ (in km) | 2000 |
| Max Mw KCFZ (Wells & Coppersmith, 1994) | 8.91 |
| Fault length KCFZ (in km) | 430 |
| Max Mw KDFZ (Wells & Coppersmith, 1994) | 8.13 |
Similarly, rupture along the 430 km-long Kinnhøgda–Daudbjørnpynten fault zone may generate earthquakes with magnitudes up to 8.1 (Table 3). This is also a minimum magnitude estimate for the same reasons as the Kongsfjorden–Cowanodden fault zone. Further structural mapping on seismic reflection data is needed in the central Barents Sea to better constrain the length (especially southeastward extent) of this major thrust system.
Besides having been reactivated/overprinted in Svalbard recently, it is probable that movements along the Baidaratsky Fault Zone (continuation of Kongsfjorden–Cowanodden fault zone in Russia; Figure 1a) were responsible for aftershocks of earthquakes triggered by nuclear tests in southern Novaya Zemlya in 1973 (Khalturin et al., 2005). In total, 47 events with Mw ≥ 2.0 occurred as two WNW–ESE-trending clusters in southern and central Novaya Zemlya between 1970 and 2020 (see lower right inset in Figure 1a), most of them prior to 1990, some of which probably linked to nuclear explosions (Khalturin et al., 2005). A potential hypothesis to be tested for the northern cluster is that they may be related to movements along the southeastward continuation of the Steiløya–Krylen fault zone of Koehl et al. (2022a; Figure 1a). Unfortunately, no focal mechanisms are available for these events, and a depth of c. 10 km was obtained for 14 of them (International Seismological Centre, 2024). Such a depth is compatible with an origin along Timanian thrust systems (Koehl et al., 2022a). The event with the highest magnitude (Mw 6.9) records the underground nuclear explosion on October 27th 1973 (see lower right inset in Figure 1a). Using the empirical relationship of Wells & Coppersmith (1994), such a magnitude suggests that a c. 35–40 km long portion of the Baidaratsky Fault Zone could have ruptured (Table 4).
Table 4. Minimum and maximum length of the subsurface rupture in southern Novaya Zemlya.
Fault rupture followed the October 27th 1973 nuclear test. The subsurface rupture length was calculated using the equation of Wells and Coppersmith (1994). Abbreviations; BF. Baidaratsky Fault Zone.
| Subsurface rupture length BF 27.10.1973 | |
|---|
| Minimum subsurface rupture length BF | 35 |
| Minimum magnitude 27.10.1973 earthquake | 6.87 |
| Maximum subsurface rupture length BF | 40 |
| Maximum magnitude 27.10.1973 earthquake | 6.94 |
The current tectonic setting in Svalbard and Novaya Zemlya does not involve subduction or large-scale (San-Andreas type) transpression and is therefore not prone to generating large-magnitude earthquakes. Nevertheless, the occurrence of seismic events at both ends of the Timanian fault systems, especially the Kongsfjorden–Cowanodden fault zone and its continuation in Russia, the Baidaratsky Fault Zone, suggest that they are prone to reactivation and seismicity. Thus, future studies should focus on qualitatively assessing the risk these hundreds to thousands km long fault systems pose to local communities.
Ethics and consent
Ethical approval and consent were not required.









