RETROFIT-LAT is organized into two distinct datasets, each offering unique insights. The first dataset, titled EF comp, provides detailed information on building energy efficiency projects, including metadata said buildings (e.g. location, area, volume, and structural features), pre- and post-retrofit energy consumption, carbon dioxide emissions, and technical details of implemented energy-saving measures, The second dataset, named Sol pan comp focuses on solar panel installations, capturing data on financial support, electricity consumption from the grid, inverter specifications, solar electricity production, primary energy consumption changes, and CO2 emissions reductions.
EF comp dataset overview
The features in RETROFIT-LAT have been organized into distinct categories that provide a comprehensive overview of each building’s energy performance and efficiency measures. These categories include (a) General Building Information, (b) Energy Performance, (c) Energy Resource (d) CO2 Emission and Primary Energy Factors, (e) Energy Saving and Efficiency and (f) Energy Efficiency Measures. Each of these categories provides essential data for evaluating the energy performance and environmental impact of buildings before and after interventions.
General building information
In Table 1, we display the group of features that offer general details about each building, including its geographic location (region, town/village) and the year it began operation. These features provide essential context for understanding each building’s baseline attributes and forms the basis for analysing and reporting on implemented projects.
Table 1. General Building Information.
| Feature | Description | Data type |
|---|
| The Date | Date when the project application was
submitted and its implementation started. | Text |
| Region | Planning region where the house is located. | Text |
| The Town/Village | Town or village where the house is located. | Text |
| County/City | County or city where the house is located. | Text |
| Initial year of exploitation | Initial year of exploitation of the building | Integer/Year |
The dataset covers five planning regions in Latvia: Riga, Zemgale, Kurzeme, Vidzeme and Latgale, with the distribution of buildings across them shown in Figure 1.
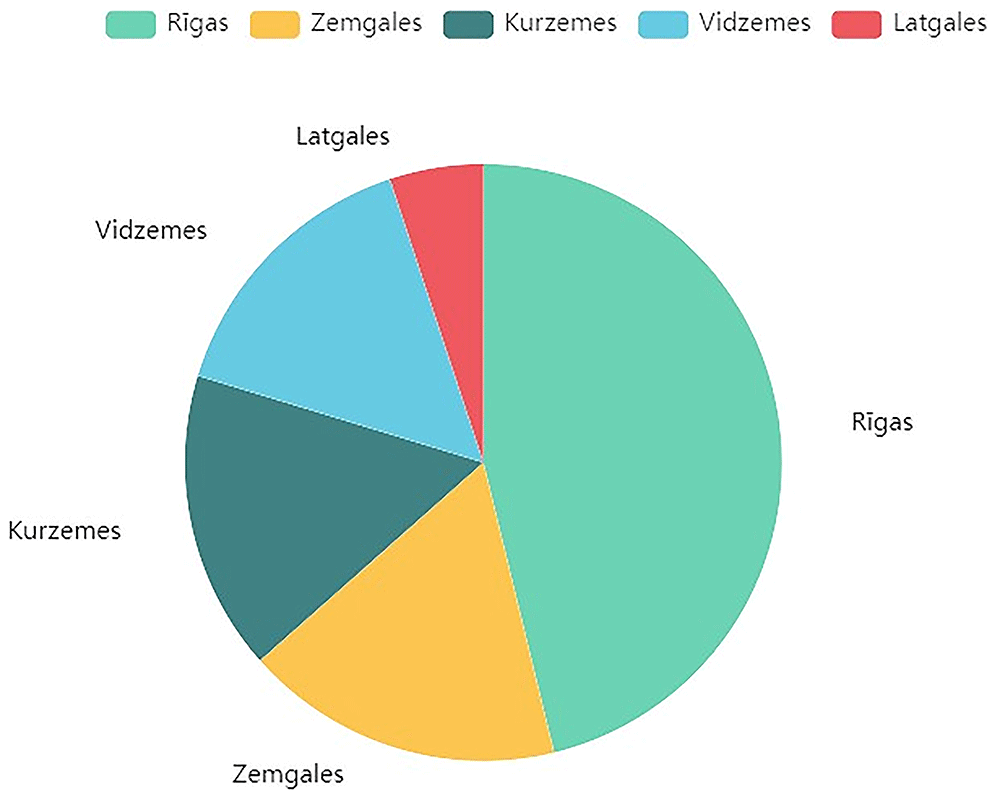
Figure 1. Distribution of data across Latvian regions.
Illustrates the geographical spread of the 1010 residential building projects within the five planning regions of Latvia: Riga, Zemgale, Kurzeme, Vidzeme, and Latgale.
Location is also indicated by the columns The town/village and County/City, which exhibit a high number of distinct values with 122 and 68 unique entries respectively.
Building characteristics
The dataset also encompasses detailed information about the structure of the buildings, offering valuable insights into their impact on energy efficiency and potential for optimization. Table 2 presents the features regarding a building’s physical attributes, thermal performance, and operational parameters. It includes metrics such as Building Total Area, Room Volume, and Reference Area, which are fundamental for energy performance calculations.
Table 2. Building Characteristics.
| Feature | Description | Unit (measure) |
|---|
Building Total
Area | The total area of the building. | m2 |
| Room Volume | The total volume of rooms in the building. | m3 |
Average Floor
Height | The average height of each floor. | m |
| Reference Area | The reference area used in energy performance calculations. | m2 |
Above-Ground
Floors | The number of floors above ground level in the building. | Floor number |
| Underground Floor | Indicates whether the building has underground floors. | Yes/No |
| Mansard | Indicates if the building has a mansard roof. | Yes/No |
| Roof Floor | Indicates if the building has a roof floor. | Yes/No |
| Area of the External Surface | The total area of the external surface of the building. | m2 |
Average Heat
Transfer Coefficient | The average heat transfer coefficient, which indicates the
insulation performance. | W/(m2K) |
Average Heat
Transfer
Coefficient1 | An alternative value of the heat transfer coefficient for
different parts of the building. | W/(m2K) |
Building
Calculated Heat
Loss Coefficient | The calculated value for the heat loss coefficient of the
building. | W/(m2K) |
Building Allowable
Heat Loss
Coefficient | The allowable value for the building’s heat loss coefficient
based on regulations. | W/(m2K) |
Indoor
Temperature
Heating | The indoor temperature set for heating. | °C |
Indoor
Temperature for Cooling | The indoor temperature set for cooling. | °C |
| Air Exchange Rate | The rate at which air is exchanged in the building. | h−1 |
Ventilation Heat
Loss Coefficient | The coefficient that quantifies the heat loss due to ventilation. | W/(m2K) |
Structural details related to the buildings’ flooring (e.g average floor height, the number of above-ground/underground floors) provide important insights into the building’s design. As a general overview, 66% of the buildings have two above-ground floors. while only 7 buildings include three floors. The remaining buildings consist of a single floor and an underground floor is present in 42% of the properties. A roof floor exists in approximately 14% of the houses and 24% are constructed with a mansard roof, indicating varied architectural designs that contribute to the dataset’s diversity.
Thermal performance is evaluated through metrics (e.g average heat transfer/loss coefficients etc), which reflect the building’s insulation and compliance with energy standards. Operational settings (e.g indoor temperatures for heating and cooling, Air Exchange Rate etc) are critical parameters for assessing energy consumption and ensuring thermal comfort.
Energy performance
Energy performance features, such as Energy Class (Initial Energy Class, Energy Class After), which reflect the building’s energy efficiency before and after improvements, are illustrated in Table 3. In Figure 2, we present the distribution of buildings’ energy classes before and after renovations, highlighting the impact of these interventions on energy efficiency. Initially most buildings belonged to classes D, E, and F. After the retrofitting, all buildings were upgraded to classes A (10%), B (22%), C (68%).
Table 3. Energy Performance.
| Feature | Description | Unit (Measure) |
|---|
Energy Consumption
Before | The total energy consumption of the
building before energy-saving interventions. | kWh/m2 |
| Initial Energy Class | The energy class of the building before | Energy Class (e.g.A,B,C) |
Heat Energy
Consumption
Before | The total heat energy consumption of the
building before the renovation. | kWh/m2 |
Carbon Dioxide Emissions
Before | The carbon dioxide emissions from the building’s
energy consumption before renovation. | kg CO2/m2 per
year |
| Energy Consumption After | The total energy consumption of the
building after energy-saving interventions. | kWh/m2 |
| Energy Class After | The energy class of the building after | Energy Class (e.g. A,B,C) |
Heat Energy Consumption
After | The total heat energy consumption of the
building after renovation. | kWh/m2 |
Consumption for
Hot Water After | The energy consumption for hot water after
energy-saving interventions. | kWh/m2 |
Consumption for Mechanical
Ventilation After | The energy consumption for mechanical
ventilation after interventions. | kWh/m2 |
Consumption for
Lighting After | The energy consumption for lighting after
renovation. | kWh/m2 |
Consumption for
Cooling After | The energy consumption for cooling after
renovation. | kWh/m2 |
Primary
Non-Renewable
Energy | The amount of non-renewable energy used after
renovation. | kWh/m2 |
Primary Total Energy
Consumption | The total amount of energy consumed after
renovations, considering all sources. | kWh/m2 |
| Almost Zero Energy Building | Indicates if the building meets almost zero
energy standards after renovation. | Yes/No |
Carbon Dioxide
Emission
Tons After | The total carbon dioxide emissions after energy-
saving interventions. | tons CO2 per year |
Carbon Dioxide
Emission After | The carbon dioxide emissions after renovations. | kg CO2/m2 per
year |
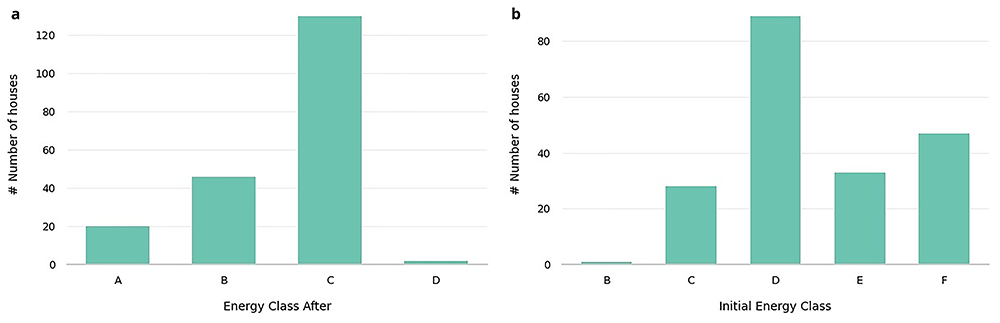
Figure 2. Initial energy class and Energy class after distributions.
Showcases the shift in the energy efficiency of the buildings before and after retrofitting interventions.
Specifically, the heatmap in Figure 3 illustrates the transitions between initial and final energy classes in detail, highlighting the specific patterns of energy class progression within the dataset.
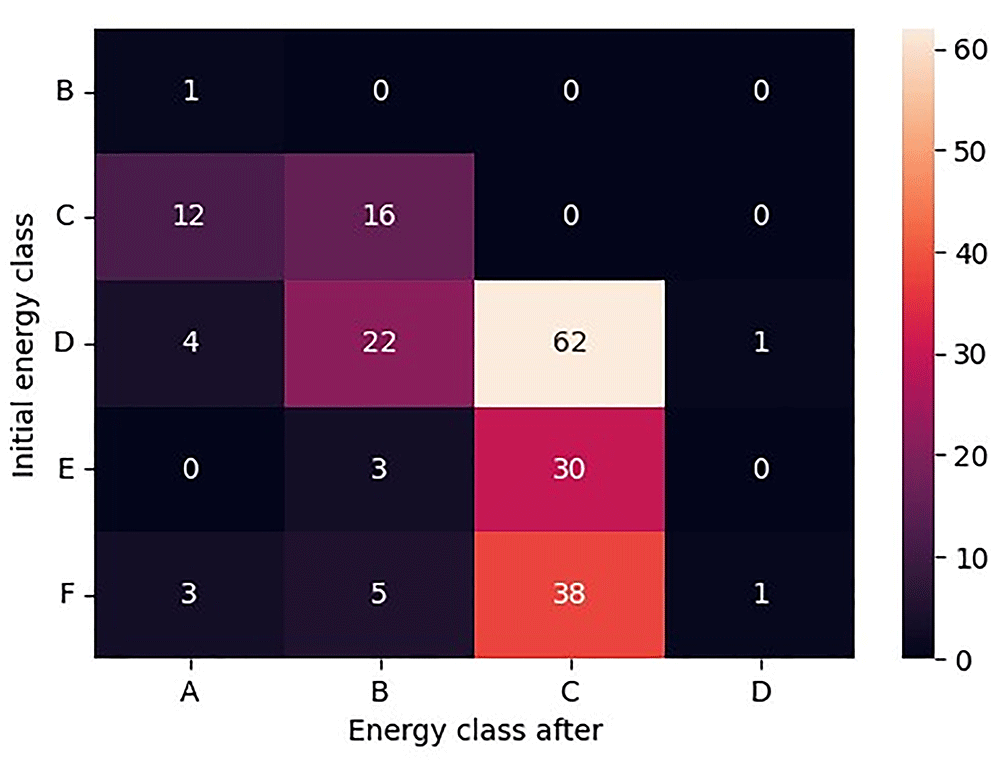
Figure 3. Heatmap of Initial energy class and Energy class after combinations.
A detailed view of the transitions between the initial and final energy classes for the retrofitted buildings, illustrating the specific patterns of energy class progression within the dataset.
The Energy Consumption (e.g., Energy Consumption Before, Energy Consumption After) measures the total energy used by the building. Figure 4a illustrates the distribution of total energy consumption both before and after the implementation of energy efficiency measures, capturing a significant reduction in their values. As shown in Figure 4b, a similar pattern is observed in the case of energy consumption for heating, which accounts for the largest share of total energy demand.
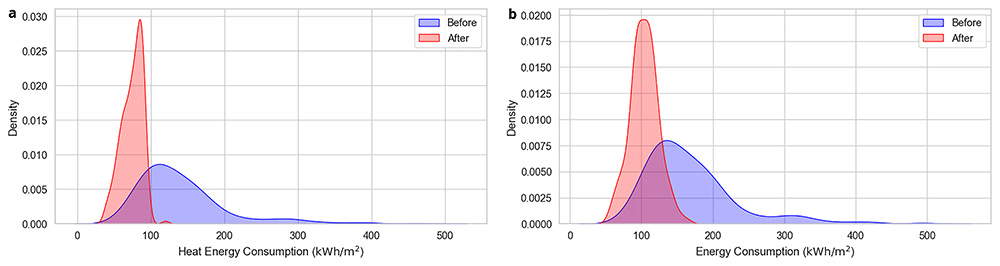
Figure 4. Total and heat energy consumptions before and after the renovation.
Visualizes (a) the distribution of total energy consumption before and after the implementation of energy efficiency measures (b) a similar pattern for heat energy consumption, which represents the largest share of total energy demand.
This group of features also includes specific categories regarding energy consumption (e.g. consumption for mechanical ventilation/lighting/cooling) highlighting the changes resulting from energy-saving interventions in each system. The Primary Energy (e.g., Primary Non-Renewable Energy, Primary Total Energy Consumption) measures the primary energy usage from both renewable and non-renewable sources after renovation, with Primary Non-Renewable Energy focusing on non-renewable resources.
Carbon Dioxide Emissions (e.g. Carbon Dioxide Emissions Before, Carbon Dioxide Emissions After) track the amount of CO2 emissions associated with the building’s energy consumption before and after renovations. Figure 5 visualizes the corresponding distributions, emphasizing the environmental benefits of the retrofitting actions. Lastly, the Almost Zero Energy Building feature indicates whether the building meets almost zero energy standards after renovation.
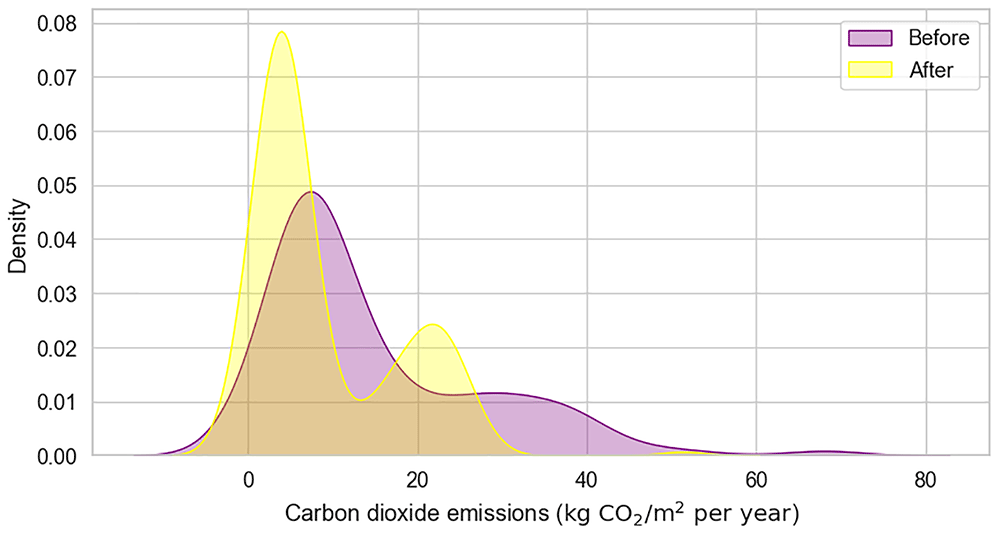
Figure 5. KDE plot of Carbon dioxide emissions before and after the renovation.
Visualizes the distributions of CO2 emissions associated with the buildings' energy consumption.
Energy saving and efficiency
The Energy Saving and Efficiency category, illustrated in Table 4, focuses on the impact of energy-saving measures implemented in the building. It includes features such as Heat Saving for Heating, which measures the reduction in heat energy consumption for heating purposes after renovations. Total Energy Consumption Saving tracks the overall energy savings achieved across all systems and interventions, providing a comprehensive view of the building’s energy efficiency improvements. Additionally, Saving of Heat Energy specifically quantifies the amount of heat energy conserved through various energy-saving measures. These features collectively help assess the effectiveness of renovations in reducing energy usage, improving efficiency, and lowering operational costs.
Table 4. Energy Saving and Efficiency.
| Feature | Description | Unit (Measure) |
|---|
Heat Saving for
Heating | The amount of heat energy saved for
heating after interventions. | kWh/m2 |
Total Energy
Consumption
Saving | The total energy saved after
renovations. | kWh/m2 |
Saving of Heat
Energy | The total amount of heat energy saved
through energy-saving measures. | % |
Energy resource use
Features describing energy resource uses (e.g heating/hot water, ventilation etc) provide insight into the primary and secondary energy sources used to power key building systems. These features help in understanding the overall energy mix and efficiency of the building, capturing different resources utilized. Table 5 presents these features in detail, outlining the proportions of energy sources such as electricity, natural gas, or renewable options, offering a clear perspective on resource allocation. Note that in many buildings distinct energy resources are not allocated for specific systems such as ventilation. Similarly, the presence of a secondary energy resource for heating, hot water, or cooling is not applicable in certain cases and, therefore, the corresponding features are assigned the value ’-’. This data is crucial for evaluating sustainability and optimizing energy consumption across multiple buildings.
Table 5. Energy Resource Use.
| Feature | Description | Data type |
|---|
| Energy Resource for Heating 1 | The primary energy resource used for heating (e.g., gas,
electricity). | Text |
| Energy Resource for Heating 2 | The secondary energy resource used for heating. | Text |
| Energy Resource for Hot Water 1 | The primary energy resource used for hot water. | Text |
| Energy Resource for Hot Water 2 | The secondary energy resource used for hot water. | Text |
| Energy Resource for Ventilation | The primary energy resource used for the ventilation system. | Text |
| Energy Resource for Cooling 1 | The primary energy resource used for cooling the building. | Text |
| Energy Resource for Cooling 2 | The secondary energy resource used for cooling. | Text |
CO2 emission and primary energy factors
Features regarding CO2 emission factors (e.g heating, hot water, ventilation etc.) indicate the amount of carbon dioxide emissions associated with the energy consumed by building energy systems. These factors, depicted in Table 6 are based on the specific energy sources used in each system, providing a measure of their environmental impact. Similarly, non-renewable/renewable energy factors for said energy systems capture the non-renewable/renewable energy consumed by these systems. The total factors are derived as the sum of the corresponding non-renewable and renewable factors. This data also assist in the evaluation of a building’s sustainability, supporting decisions towards reducing emissions and improving energy efficiency.
Table 6. CO2 Emission and Primary Energy Factors (X refers to HVAC systems: heating 1, heating 2, hot water 1, hot water 2, ventilation, cooling 1, cooling 2).
| Feature | Description | Data type |
|---|
| CO2 emission factor for X | CO2 emission factor for X based on the energy source used. | Integer |
| Non-renewable factor for X | Primary energy factor for the part of non-renewable energy resources for X. | Integer |
| Renewable factor for X | Primary energy factor for the part of renewable energy resources for X. | Integer |
| Total factor for X | Total primary energy factor for X based on the energy source used. | Integer |
Energy efficiency measures
Finally, we have retrofitting actions (e.g Carrying out Construction Works, Reconstruction of Engineering Systems etc) that represent different energy efficiency measures in building renovation and upgrades. These measures focus on improving the overall energy performance of the building. For instance, Carrying out Construction Works refers to the work done on enclosing structures, while Reconstruction of Engineering Systems involves upgrading systems like ventilation or recuperation to boost energy efficiency. The Water Heating System refers to the installation of a new system to improve hot water energy use, and Heat Installation focuses on ensuring that heating is produced using renewable energy sources. Table 7 illustrates these measures in detail, highlighting their significance as crucial steps in enhancing a building’s sustainability and energy efficiency.
Table 7. Energy efficiency measures.
| Feature | Description | Data type |
|---|
| Carrying out construction works | Carrying out construction works in the enclosing structures | Boolean |
Reconstruction of engineering
systems | Reconstruction of engineering systems
(ventilation, recuperation) to increase the energy efficiency of the house | Boolean |
| Water heating system | Installation of a new water heating system | Boolean |
| Heat installation | Installation of heat installations to ensure the production of heat from
renewable energy sources | Boolean |
Figure 6 visualizes the number of buildings that implemented each energy efficiency measure compared to those that did not, providing an overview of the adoption rates for these retrofitting actions.
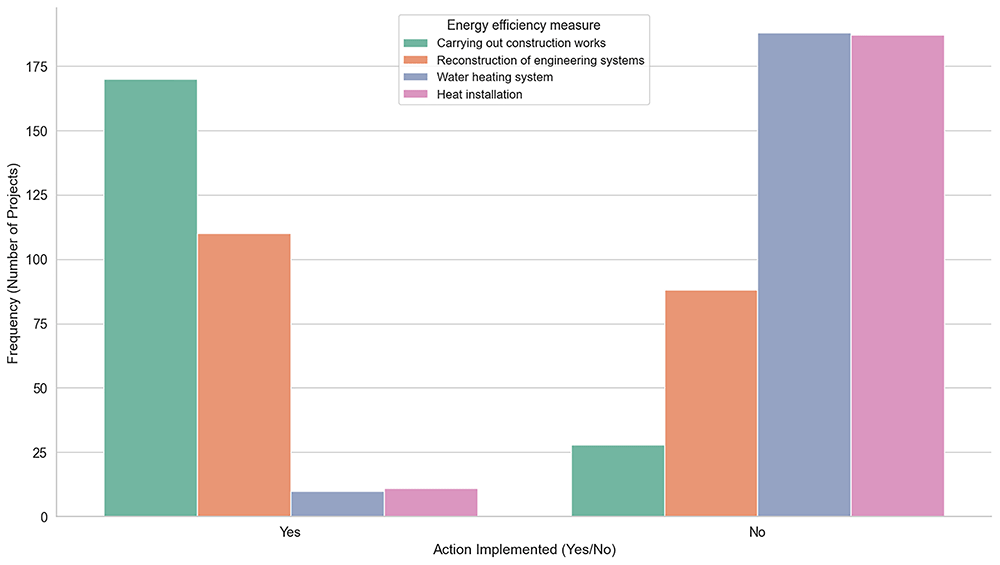
Figure 6. Clustered Bar Plot for Energy efficiency measures implementation.
Comparison between the number of buildings that implemented each of the energy efficiency measures (Carrying out Construction Works, Reconstruction of Engineering Systems, Water heating system, Heat installation) to those that did not, providing an overview of the adoption rates for these retrofitting actions.







