Introduction
The Newcomb-Benford Law (NBL) is a mathematical concept that has been postulated to be able to reveal intriguing insights into the reliability of data depending on the resulting frequency distribution of the significant digits, and has found a niche in data science applications that aim to detect manipulation and falsification in datasets1–5. The fundamental concept underpinning the NBL is that the occurrence of significant digits in stochastic processes does not follow a uniform distribution and instead follows a predictable trend6 and therefore, any deviation from this trend could be an indicator of the reliability of the data at hand. Operating at the crux of probability theory, NBL suggests a counterintuitive observation – that the probability distribution (PB) of leading significant digits (i.e., the left-most, non-zero digit) in random numbers is not uniform or equal across the different numbers. Instead, the frequency distribution follows a unique pattern (Equation 1):
where d = 1, 2,...,9 represents the first digit. This results in a distribution where 1 has a higher relative frequency than 2 and so on. Intuitively, the frequency of the number 1 would be expected to be the same as the number 2 if the occurrence of the number was completely by chance. The NBL was first noted by Simon Newcomb in 18817 and later revisited by Frank Albert Benford in 19388 who applied the concept across a large number of data sets to further investigate its properties. Still later, the ‘first digit phenomenon’ was reintroduced by Hill9, who expanded the concept to following digits (Equation 2 and Equation 3).
With random variables D1, D2, … Dk containing the first (leftmost, independent of the location of the decimal point), second, …, kth significant digits, d = 1,2,…,9 and di = 0,1,…,9 (j = 2,…,k). However, as described by Benford and explained by Brown10, some data will inherently violate the Newcomb-Benford Distribution (NBD), namely: (1) data that are confined by upper or lower limits, (2) experimental designs that allow for only a few discrete values, and (3) in systems where processes are present that influence the equilibrium or regulation to a value.
Notably, the usefulness of the NBL in identifying inconsistencies has been harnessed for a wide range of purposes, including the detection of fraudulent or manipulated data in political realms (e.g., voter fraud11), economic domains (e.g., tax evasion12), and scientific investigations (e.g., data manipulation13). A search of the SCOPUS database was performed and found that publications pertaining to the NBL (benford AND distribution) resulted in 462 publications from 1975 to 202414. Of these, the majority (348) are journal articles, the frequency of which only began to gain traction after 2005. Furthermore, a deeper assessment of the applications of the NBL by subject area reveals that over half of the articles belong to the fields of mathematics (177), computer science (109), physics (86), and economics (63). When this search was further limited to the health and environmental sciences, a mere 44 publications were found. Upon closer inspection of these articles, most appeared to assess the conformity of specific types of data to the NBD in order to assess the reliability of the datasets. One study by Garcia-Sosa suggested that the use of the NBL could be applied in the context of drug discovery, artificial intelligence, and machine learning to increase data integrity3. However, publications to date do not appear to further investigate the underlying mechanisms that may influence the accordance of datasets with the NBD.
One crucial aspect that remains obscured is the influence of physiological processes that can lead to deviations from the NBD in biological systems. As previously described, such fields of research that utilize the NBL have used it to detect manipulated or falsified data. However, this practice could lead to overlooking assumption (3) of the aforementioned properties of the NBL, which suggests that fundamental properties may drive the accordance or violation of data to the distribution without any form of manipulation or fraudulence. In data where processes are present that may influence the random nature of the data, for example, preferential uptake of essential and beneficial elements by the body in living organisms could affect accordance to the NBD and incorrectly label datasets as manipulated when in fact they are being driven by factors associated with physiology and metabolism. In order to further investigate the characteristics of the NBL, five data sets that measured a range of essential, beneficial, and non-essential elements in biosamples were examined. Of these, four datasets were from European biomonitoring studies in humans (adults, adolescents, and children) that measured elemental concentrations in three different biosamples (blood, urine, and hair). Another dataset from an exposure study conducted in mice was also used to explore the influence of dosing studies on the NBL, where bone and blood were collected from juvenile and adult mice.
The selected array of datasets allowed for a more thorough examination of various factors that may influence the NBD such as elemental essentiality status, sample type, age of study organism, and type of experimental design. From the above datasets, conformity to the NBD was assessed. According to point (3) of the NBL, we hypothesize that the essentiality of each group of elements will affect the conformity of the datasets to the NBD due to the presence of physiological processes that favour active uptake of essential/beneficial elements (and thereby lead to a violation) versus non-essential elements, which we hypothesize will follow the NBD. We also assessed the accordance of the combination of all elements, which we hypothesized should also follow the NBD.
Methods
Statistical background
The NBL suggests that the probability for the leading significant digit (1 through 9) of randomly occurring numbers is not equally distributed as one would consider by chance; if every digit were to demonstrate an equal probability of occurrence of 1/9, each number from 1 to 9 should have a relative frequency of 11.1%. This results in a distribution where 1 has a higher relative frequency than 2 and so on (Figure 1).
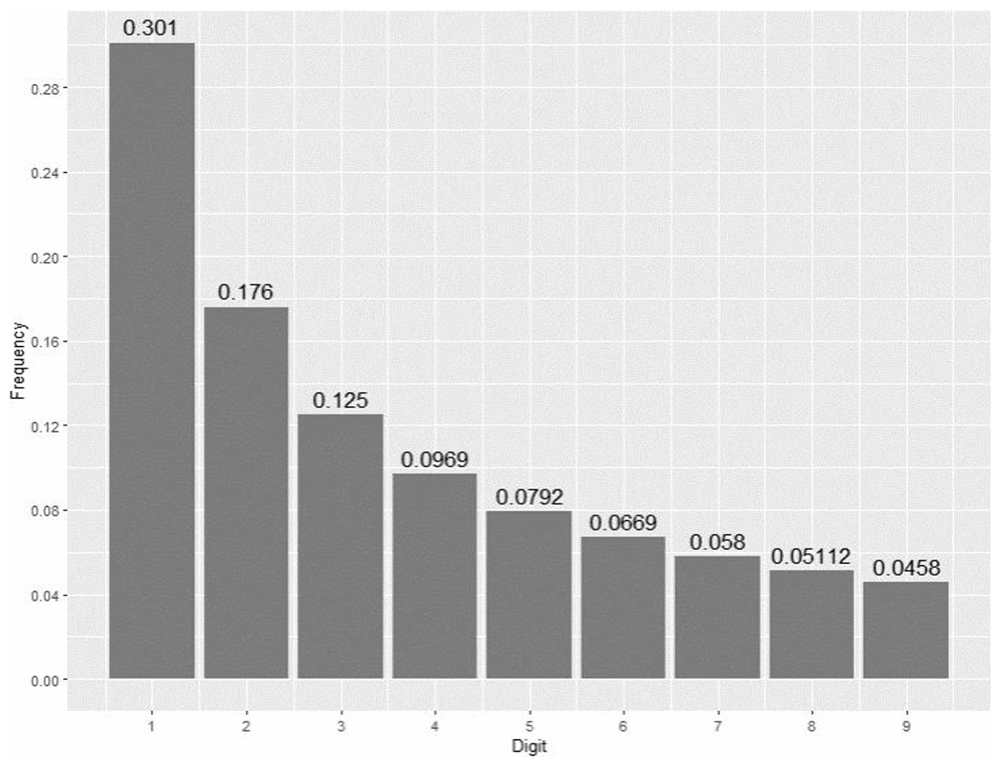
Figure 1. Expected Leading Digit Distribution of the Benford Law.
Relative frequency distributions for the leading digits 1 through 9 as described by the Newcomb-Benford Law.
For example, in a data set of measured concentration values, the frequency of occurrence of the number “1” in a data set of numbers 1.25, 21.32, 176.84, 8.54 would result in a frequency of 1, 0, 1, 0 for the numbers respectively (1.25, 21.32, 176.84, 8.54). In theory, the frequency of the number 1 should be the same as the number 2 (0, 1, 0, 0 for the former data set), and so on, if the occurrence of the number were completely by chance, however is not the case.
Datasets
The present study is a secondary data analysis and did not involve any new data collection, laboratory experiments, or biological sample collection or analysis. All datasets in this study were obtained from previously published human biomonitoring studies or experimental analyses with permission. No new measurements were conducted, and all analyses were performed exclusively using computational and statistical methods on de-identified, pre-existing raw data, which included only the element measurement results, associated cohort name, and sample types. No personal identifiers or individual-level demographic data were accessed or used in this study. The data sets used in the present investigation were collected as part of monitoring surveys with partner institutes (Table 1). However, these studies conducted their own sample collection and laboratory analyses, which included quality control and validation specific to their institutes and studies. The full details of data collection and measurement procedures can be found in more detail in the source materials. Further information from the selected studies is provided below.
Table 1. Characteristics of the five (PROBE_1, PROBE_2, UNICEF, BURLO, MICE) datasets.
| Data Set | Sample Type | Species | Age | Size | Design | Elements |
|---|
| PROBE_115,16 | Blood/
Serum | H. sapiens | Adult | 1423 | Observational | Co, Mo (essential);
Cr, Mn, Ni, Sn (beneficial);
As, Be, Cd, Hg, Ir, Pb, Pd, Pt, Rh, Sb,
Tl, U, V, W (non-essential) |
| PROBE_215–17 | Blood | H. sapiens | Adolescent | 453 | Observational | Co, Mo (essential);
Cr, Mn, Ni, Sn (beneficial);
As, Be, Cd, Hg, Ir, Pb, Pd, Pt, Rh, Sb,
Tl, U, V, W (non-essential) |
| UNICEF18 | Blood | H. sapiens | Child | 1571 | Observational | Mn (beneficial);
As, Cd, Hg, Pb (non-essential) |
| BURLO19,20 | Urine | H. sapiens | Child | 175 | Observational | Mn, Se (beneficial);
As, Cd, Hg, Pb (non-essential) |
| Hair | H. sapiens | Child | 175 | Observational | Mn (beneficial); Hg (non-essential) |
| MICE21 | Blood | M. musculus | 2 months/
1 year | 758 | Experimental | Mn, (beneficial); Pb (non-essential) |
| Bones | M. musculus | 2 months/
1 year | 775 | Experimental | Mn, (beneficial); Pb (non-essential) |
PROBE
The PROgramme for Biomonitoring the Italian Population Exposure (PROBE)15–17 for the assessment of the internal dose of metals in the Italian population was a human biomonitoring study that assessed a population sample of 1423 individuals, aged between 18 and 65 years from five regions and ended in 2011. Concentrations of 20 metals [arsenic (As), beryllium (Be), cadmium (Cd), cobalt (Co), chromium (Cr), mercury (Hg), iridium (Ir), manganese (Mn), molybdenum (Mo), nickel (Ni), lead (Pb), palladium (Pd), platinum (Pt), rhodium (Rh), antimony (Sb), tin (Sn), thallium (Tl), uranium (U), vanadium (V) and tungsten (W)] were determined in whole blood and serum. The study was later expanded to include 453 adolescents from 13–15 years of age17. Blood samples were analysed for 19 metals (As, Be, Cd, Co, Cr, Hg, Ir, Mn, Mo, Ni, Pb, Pd, Pt, Rh, Sb, Sn, Tl, V, and W). The PROBE studies are thus broken down into PROBE_1 and PROBE_2 for the adult and adolescent cohorts, respectively.
UNICEF
The UNICEF study incorporated Multiple Indicator Cluster Surveys (MICS) under the partnership of the Georgian Government and the Istituto Superiore di Sanità, Rome Italy18. UNICEF employed a Lead Surveillance System to monitor lead exposure in Georgia at the national level between 2018–201922. The study primarily included monitoring of blood Pb levels in children (2–7 years; 1571) to measure changes over time and to identify major sources of exposure. The study also included measurements and monitoring of Mn, As, Cd, and Hg.
BURLO
The BURLO biomonitoring study assessed exposure to As and some trace metals (Cd, Hg, Mn, and Pb) in urine and scalp hair from a representative sample of children aged 6–9 years (n=175). This study simultaneously analysed five elemental metals in the urine and hair of children19,20.
In vivo Exposure of Mice (MICE)
A CD1 outbred mouse model was used to investigate the behavioural and developmental effects of low-level exposures to Pb and Mn separately and as combined exposures21. The model of behavioural effects of developmental exposure was used with blood levels similar to those observed in child clinical literature.
Computational tools
All computational and statistical analyses were conducted using R software (version 4.2.1)23. Scripts were developed to automate the calculations and ensure reproducibility. The computing environment was maintained with version control systems to track modifications and dataset versions. Data were processed using the ‘BenfordTests ' package in R [v1.2.0; Joenssen, 2015]. The analysis scripts as well as a sample dataset are available at https://github.com/DaynaSchultz/NewcombBenfordAnalyses. Since the sample data are artificially generated, they will not be expected to behave as natural data. They are for visualisation purposes only. Preliminary analyses aimed to assess the applicability of various methods within the ‘BenfordTests’ package to the PROBE_1 (adult human blood) dataset to determine the most suitable test for downstream comparisons. Tests assessed included: Pearson’s Chi-squared Goodness-of-Fit Test, Euclidean Distance Test, Hotelling T-square Type Test, Joenssen’s JP-square Test, Kolmogorov-Smirnov Test, Chebyshev Distance Test (maximum norm), Judge-Schechter Mean Deviation Test, and Freedman-Watson U-square Test (Table 2). Applications of Pearson’s Chi-squared test and Judge-Schechter Mean Deviation test used asymptotic p-value computation while the remaining tests utilised simulations with 10000 replicates. In the case of the Hotelling T-square Type Test, the selection of eigenvalues were selected as the number of elements included in each category of essentiality (i.e., all = 20; essential = 2; non-essential = 14; beneficial = 4) and the tolerance was set to 0.001 so as to be lower than the lowest LoD.
Table 2. Results of statistical analysis using 8 different tests in the R:BenfordTests package.
| All | Essential | Beneficial | Non-essential |
|---|
| Test
Statistic | P-value | Test
Statistic | P-value | Test
Statistic | P-value | Test
Statistic | P-value |
|---|
Pearson’s Chi-squared
Goodness-of-Fit (χ2) | 2.51 x 10² | < 2.20 x 10⁻¹⁶ | 1.17 x 10³ | < 2.20 x 10⁻¹⁶ | 4.10 x 10² | < 2.20 x 10⁻¹⁶ | 1.03 x 10² | < 2.20 x 10⁻¹⁶ |
| Euclidean Distance (D) | 5.78 x 100 | < 2.20 x 10⁻¹⁶ | 1.59 x 101 | < 2.20 x 10⁻¹⁶ | 6.79 x 100 | < 2.20 x 10⁻¹⁶ | 3.94 x 100 | < 2.20 x 10⁻¹⁶ |
Judge-Schecter Mean
Deviation (DJ) | 3.41 x 10⁻³ | 2.02 x 10⁻³ | 9.77 x 10⁻² | < 2.20 x 10⁻¹⁶ | 7.24 x 10⁻² | < 2.20 x 10⁻¹⁶ | 1.66 x 10⁻³ | 6.06 x 10⁻¹ |
| Hotelling T-square Type (T2) | 2.51 x 10² | < 2.20 x 10⁻¹⁶ | 1.01 x 10³ | < 2.20 x 10⁻¹⁶ | 2.70 x 10² | < 2.20 x 10⁻¹⁶ | 1.03 x 10² | < 2.20 x 10⁻¹⁶ |
| Joenssen’s JP-square (JP2) | 9.84 x 10⁻¹ | < 2.20 x 10⁻¹⁶ | 7.92 x 10⁻¹ | < 2.20 x 10⁻¹⁶ | 8.51 x 10⁻¹ | < 2.20 x 10⁻¹⁶ | 9.85 x 10⁻¹ | < 2.20 x 10⁻¹⁶ |
Kolmogorov-Smirnov
(KS) | 3.89 x 100 | < 2.20 x 10⁻¹⁶ | 1.41 x 101 | < 2.20 x 10⁻¹⁶ | 6.87 x 100 | < 2.20 x 10⁻¹⁶ | 1.75 x 100 | 5.00 x 10⁻⁴ |
Chebyshev Distance
Test (D∞) | 3.89 x 100 | < 2.20 x 10⁻¹⁶ | 1.41 x 101 | < 2.20 x 10⁻¹⁶ | 4.85 x 100 | < 2.20 x 10⁻¹⁶ | 2.92 x 100 | < 2.20 x 10⁻¹⁶ |
Freedman-Watson
U-square Test (U2) | 5.50 x 100 | < 2.20 x 10⁻¹⁶ | 2.95 x 101 | < 2.20 x 10⁻¹⁶ | 7.88 x 100 | < 2.20 x 10⁻¹⁶ | 8.30 x 10⁻¹ | < 2.20 x 10⁻¹⁶ |
Findings from the test comparisons suggest that most of the assessed tests are highly sensitive to rejecting the null hypothesis. In these cases, p-values were measured as 0, and thus it becomes increasingly difficult to compare or quantify differences in the distributions as most researchers rely on p-values instead of test statistics. Moreover, upon comparing the test statistics between each of the above-mentioned methods, the Judge-Schechter Mean Deviation Test2 was the best suited to provide a quantifiable distinction (values present across multiple orders of magnitude) between elemental groupings on the level of p-value and test statistics. Therefore, the Judge-Schechter Mean Deviation Test (J-S Test), which could generate a higher proportion of non-zero p-values and test statistics with at least ten-fold differences between groupings, was selected to facilitate differentiations between violations in the data sets. All data were analysed using the J-S Test for Benford’s Law. The J-S method reduces data points to a specified number of significant digits and then performs a goodness-of-fit test between the measured deviation means of first-digit distributions and the theoretical ideal distribution of the NBD (Equation 4):
where:
µο = the observed mean of the chosen κ number of digits
µe = is the expected/true mean value for Bunford’s predictions
α* = an asymptotic conformation to a truncated normal distribution under the null-hypothesis
The main assumptions of this equation are that values of x should be continuous and that digits should be chosen so that the number of significant digits is not influenced by any previous rounding. Further information can be found in the ‘BenfordTests’ package24. As previously stated, the J-S Test requires that data are not confined by the previous rounding; therefore, measurements found to be at or below the limit of detection (LoD) for each element and analytical method were removed from the data sets before analysis. Information on the number of values retained and discarded can be found in the extended data located on Zenodo25.
For the formal analysis, mean digit tests were not confined by digit number restraints and were performed using asymptotic analysis, as defined by the package. Data visualisations are provided as relative frequencies with 95% confidence intervals (CI). Datasets for PROBE_1, PROBE_2, BURLO, and UNICEF were analysed as a combination of all data (All) as well as into two or three (where applicable) groups split by elemental classifications as previously defined in Table 1. For the MICE dataset, blood and bone measurements were collected from 2-month-old and 1-year-old mice in the performed studies, which aimed to determine the effects of Mn on the absorption and negative impacts of Pb21. Due to the relatively small number of samples, data across age groups were pooled to increase the sample size. Individual life-stage data pooled across treatments can be found in the extended data located on Zenodo25. Results were first combined for each sample type and then divided into the respective treatment groupings.
Results
Human Biomonitoring Data
Adults
The conformity of leading digit distribution in the PROBE_1 adult dataset to the NBD was evaluated across the four groupings, including All (entire dataset), Essential (Co, Mo), Beneficial (Cr, Mn, Ni, Sn), and Non-essential (As, Be, Cd, Hg, Ir, Pb, Pd, Pt, Rh, Sb, Tl, U, V, W) were assessed. In All and Non-essential, the resulting leading digit distribution largely conformed with the expected frequencies (p-value 2.00 x 10⁻¹ and 6.06 x 10⁻¹, respectively). More specifically, the leading digits fell mostly within the 95% CI of the theoretical distributions. Therefore, these data groupings both complied with the initial hypothesis. In contrast, the Essential and Beneficial (both p-value <2.20 x 10⁻¹⁶) subsets displayed significant deviations from the NBD. In the Essential group, all digits except 7 and 9 fell outside of the 95% CI while Beneficial digits 2 and 3 showed the largest divergence. Interestingly, the overall trend of the frequencies in Essential and Beneficial appeared to follow a seemingly non-random rotated S or sigmoidal curve (Figure 2 B and C) whereby the frequency of digit 1 was the highest, followed by a steep decline in the frequency of digits 2 to 4 and a subsequent smooth rise in approximately 5 to 7 and levelling out for the remaining digits (7 to 9). This trend is most notable in Figure 2B and to a less noticeable extent in 2C. Conversely, the classic curve noted from the ideal distribution is an inverse negative exponential curve.
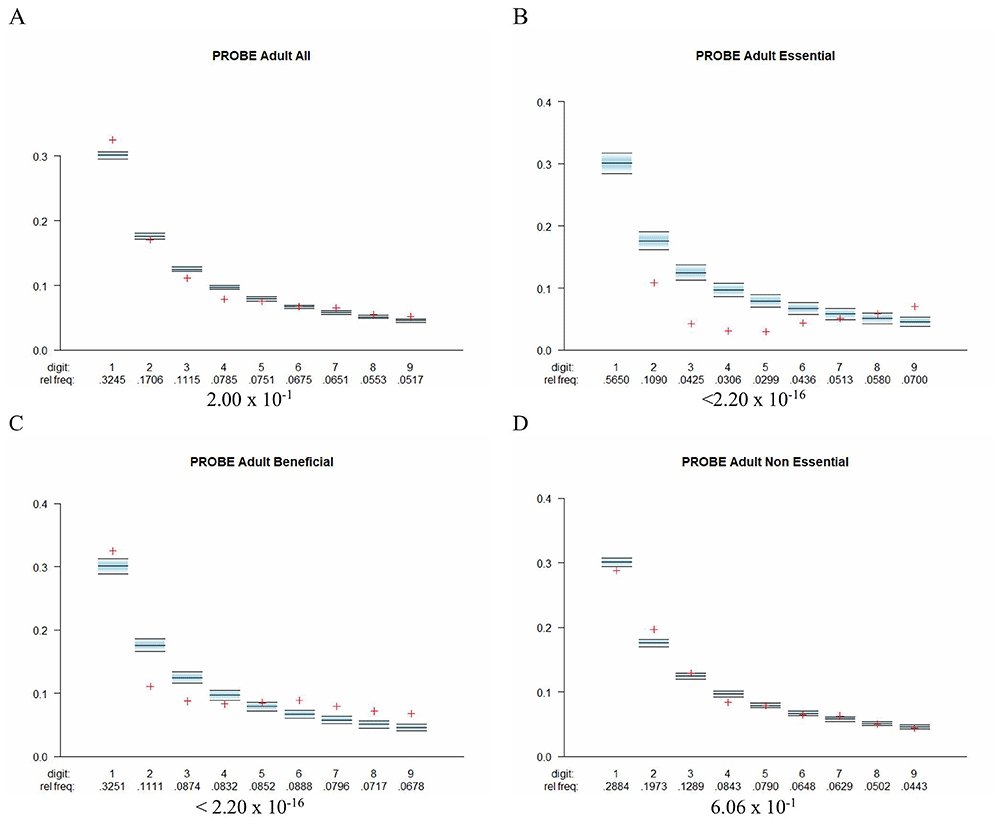
Figure 2. Digit frequency distributions of PROBE_1 blood data by element category.
Frequency distribution of PROBE_1 data divided into All (A), Essential (B), Beneficial (C), and Non-essential (D) groupings where blue boxes depict the theoretical ideal distribution and 95% confidence interval, and the red cross depicts the measured relative frequency. Significance measurements as p-values are provided under each graph, where violations were found in Essential and Beneficial.
Adolescents
Analysis of the PROBE_2 dataset utilised the same four grouping subsets, with only the element U being omitted (from the Non-essential group) compared to PROBE_1 adult data. The distribution evaluation uncovered significant violations in all of the subsets (Figure 3). For the All grouping, there was a large significant deviation from the expected distribution (p-value <2.20 x 10⁻¹⁶), although the deviations of the measured frequencies appeared quite minor and are most notable in digits 1 and 6. In the Essential (p-value 1.12 x 10⁻³) distribution, there was a minor statistical deviation from the expected trend, with subtle departures from the expected in digits 1, 6, 7 while the slightly more significant Beneficial (p-value 1.31 x 10⁻⁹) subset showed more noticeable deviations in digits 2 and 6, although the 95% CI were also larger. For Non-essential (p-value <2.20 x 10⁻¹⁶), there was a strong statistical deviation from the expected trend, with notable offsets particularly in digits 1, and to a lesser extent 6.
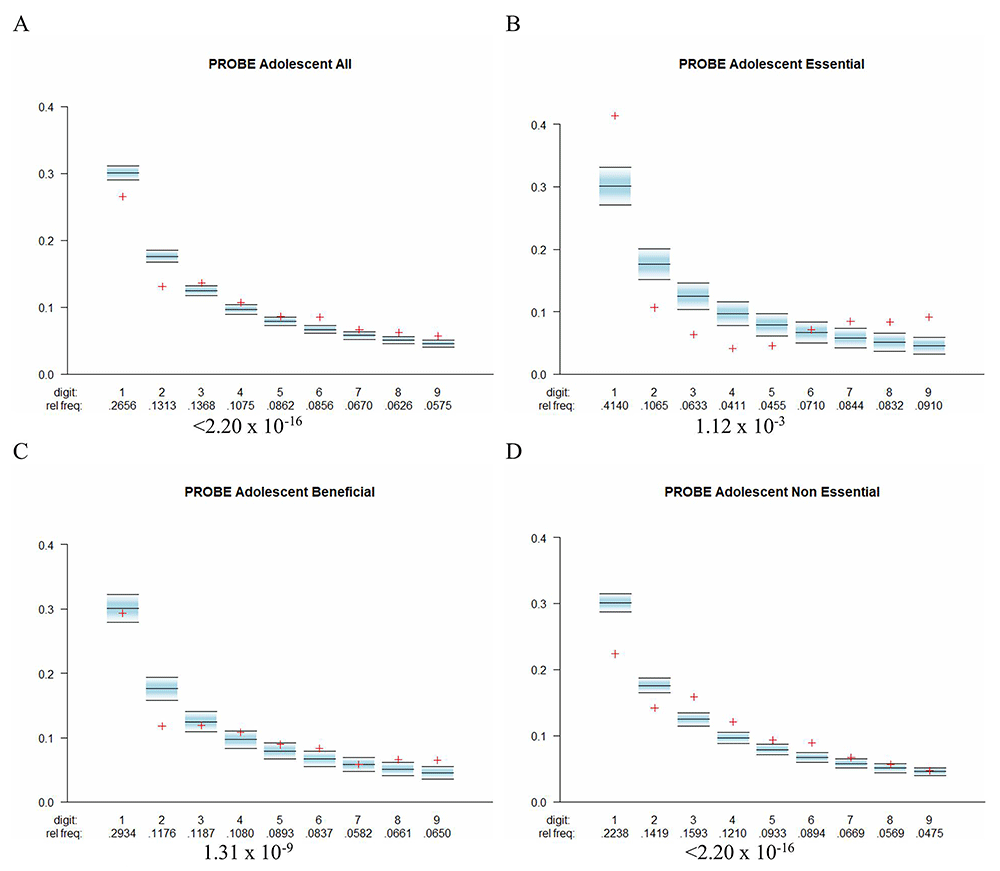
Figure 3. Digit frequency distributions of PROBE_2 blood data by element category.
Frequency distribution of the PROBE_2 (adolescent blood) divided into All (A), Essential (B), Beneficial (C), and, Non-essential (D) groupings where blue boxes depict the theoretical ideal distribution and 95% confidence interval and the red cross depicts the measured relative frequency. Significance measurements as p-values are provided under each graph, where violations were found in all breakdowns.
Children
Blood
The UNICEF cohort included data that were collected in blood samples from children that were then subset into three groupings, including All, Beneficial (Mn), and Non-essential (As, Cd, Hg, Pb) (Figure 4). The All subset conformed closely to the expected distribution, with all measured frequencies falling within the 95% CI (p-value 9.45 x 10⁻¹). In the Beneficial grouping, there was significant violation (p-value 7.25 x 10⁻⁶) of the distribution across all digits except for 7 and resulting in a (similar to the PROBE_1 dataset) characteristic and especially smooth sigmoidal curve, again suggesting a non-random pattern in the resulting deviation. This pattern may indicate an underlying structure to the data. Furthermore, the Non-essential data also denoted a significant deviation from the expected (p-value 3.66 x 10⁻³), although with a close resemblance to the plateau-type response noted in PROBE_2 Non-essential data, where the first 2-3 digits depict similar frequencies and followed by a subsequent drop in the remaining digit frequencies.
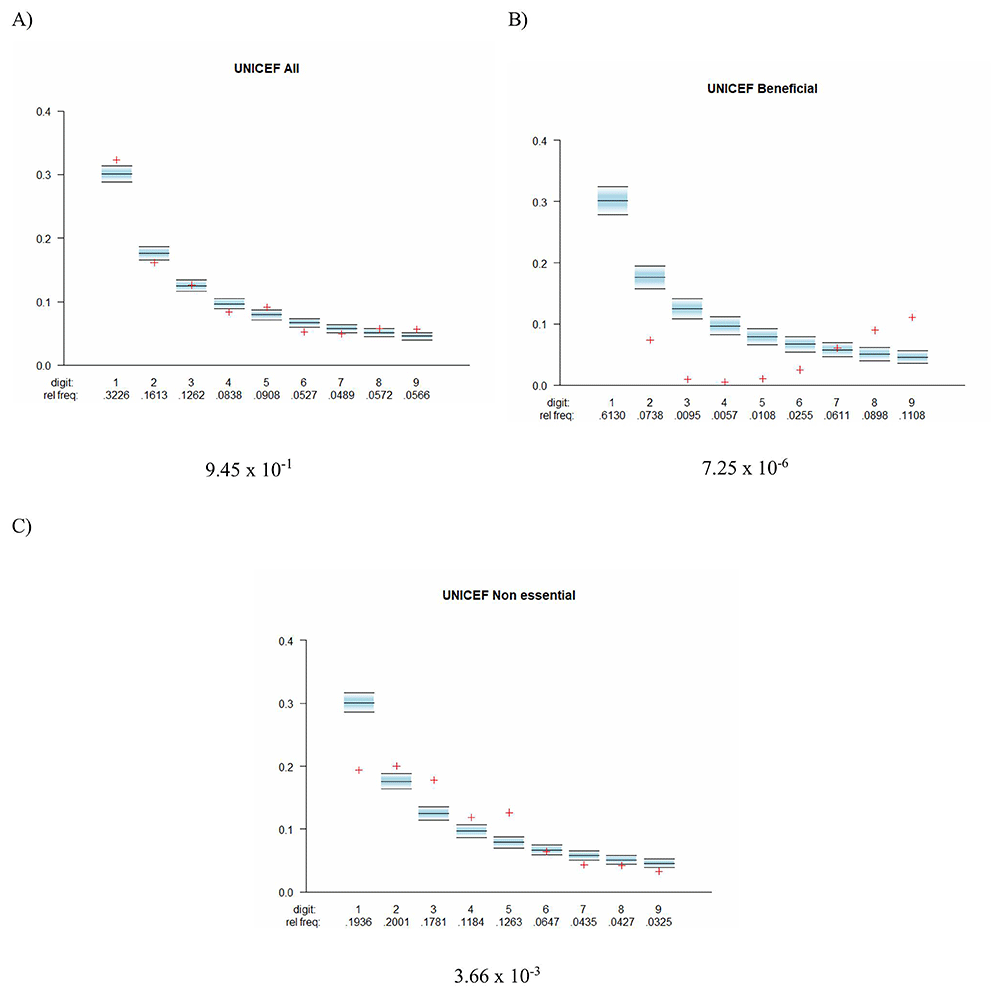
Figure 4. Digit frequency distributions of UNICEF blood data by element category.
Frequency distribution of the data set UNICEF sorted by All (A), Beneficial (B), and Non-essential (C) groupings where blue boxes depict the theoretical ideal distribution and 95% confidence interval, and the red cross depicts the measured relative frequency. Significance measurements as p-values are provided under each graph, where violations were found in Beneficial and Non-essential.
Urine
When analysis of another biosample type was conducted, the expected trends in accordance with the NBD also shifted. The urine samples from children in the BURLO cohort involved three grouping subsets, including All, Beneficial (Mn, Se), and Non-essential (As, Cd, Hg, Pb). Investigation of the distributions uncovered violations across every grouping (Figure 5). There was slight deviation from the expected in the All dataset (p-value 2.22 x 10⁻⁴), where measured frequencies were displaced from the 95% CI in 2 and 5. For Beneficial (p-value 3.24 x 10⁻⁸), there was a moderate deviation with digit 1 being higher than the expected, while Non-essential showed a more pronounced and extreme deviation from the ideal distribution (p-value <2.20 x 10⁻¹⁶), and displaying a seemingly structured deviation from the expected, whereby there is a gradual decrease in the leading digits (particularly 1 through 3), before increasing slightly to initial frequencies (in 4 to 6), and a subsequent gradual decrease in the remaining digits.
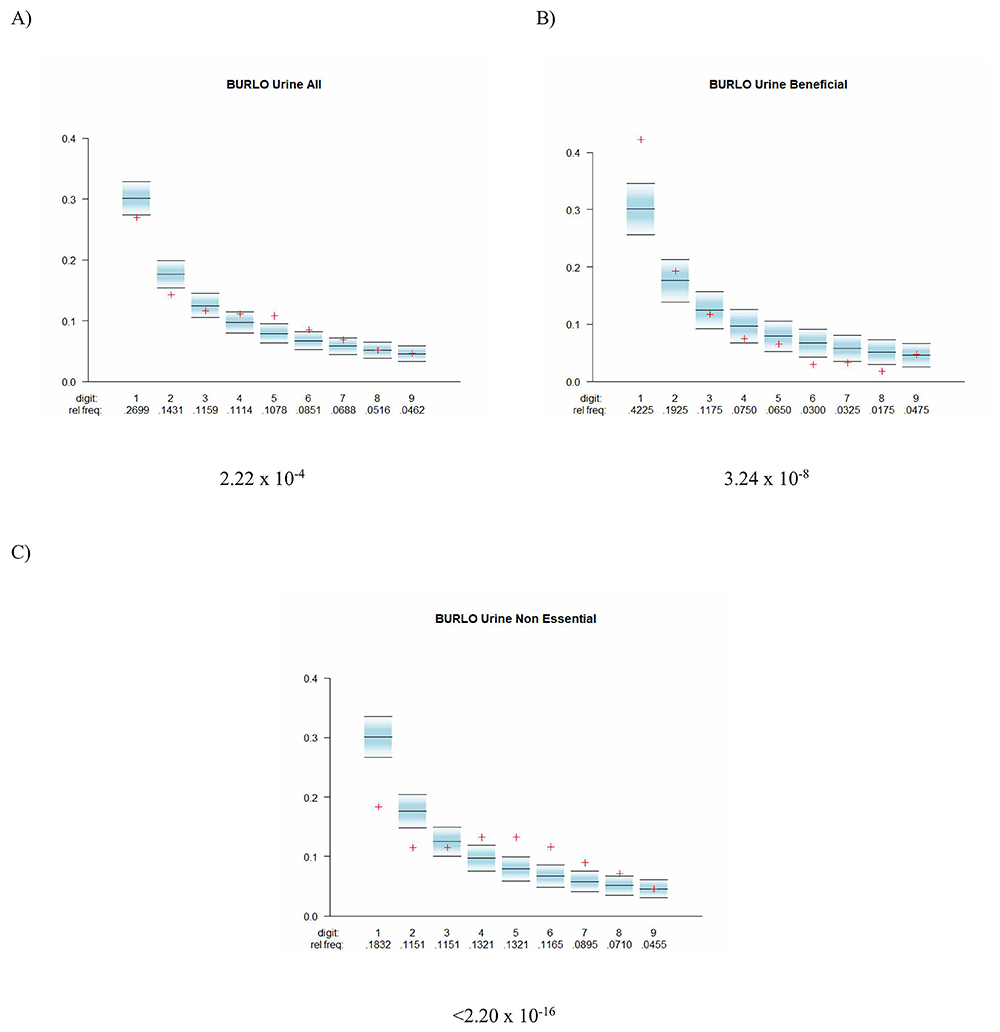
Figure 5. Digit frequency distributions of BURLO urine data by element category.
Frequency distribution of the BURLO urine sorted by All (A), Beneficial (B), and, Non-essential (C) groupings where blue boxes depict the theoretical ideal distribution and 95% confidence interval and the red cross depicts the measured relative frequency. Significance measurements as p-values are provided under each graph. Significant violations were found in all groups.
Hair
Another biosample that was assessed in this assessment was hair from the BURLO study19. Here, three subset groupings were again used, and were constituted of All, Beneficial (Mn), and Non-essential (Pb). Results from this analysis depicted significant variations from the expected in Non-essential (p-value 4.95 x 10⁻²) while All (p-value 5.59 x 10⁻¹) and Beneficial (p-value 2.55 x 10⁻¹ ) data did not (Figure S1). The resulting curves for this dataset were variable in the Beneficial and Non-essential and the confidence intervals were large as a result of the small sample sizes and low number of elements included in the analysis. However, in All, the results followed the trend. Results can be found in the extended data.
Experimental data
Blood
The applicability of the NBL to another type of data was also assessed by using measurements from a study that experimentally administered manganese and lead separately and as a co-exposure of both in 2-month-old and 1-year-old mice. For the blood samples across all treatment groups (Figure 6: A-C), the combined (Combined) data followed the expected trends as previously seen in human samples for child and adolescent data (p-value 5.08 x 10⁻¹). More specifically, the Beneficial data also followed the previously noted S-shaped trend and denoted a violation (p-value 9.43 x 10⁻⁹), with the largest deviations in digits 1 to 3 and then 8 and 9. The Non-essential subset depicted a plateau-type deviation (p-value 1.62 x 10⁻⁶) that was noted previously in both the PROBE_2 and UNICEF data where the first two digits have very similar frequencies, followed by a relative drop off in the values.
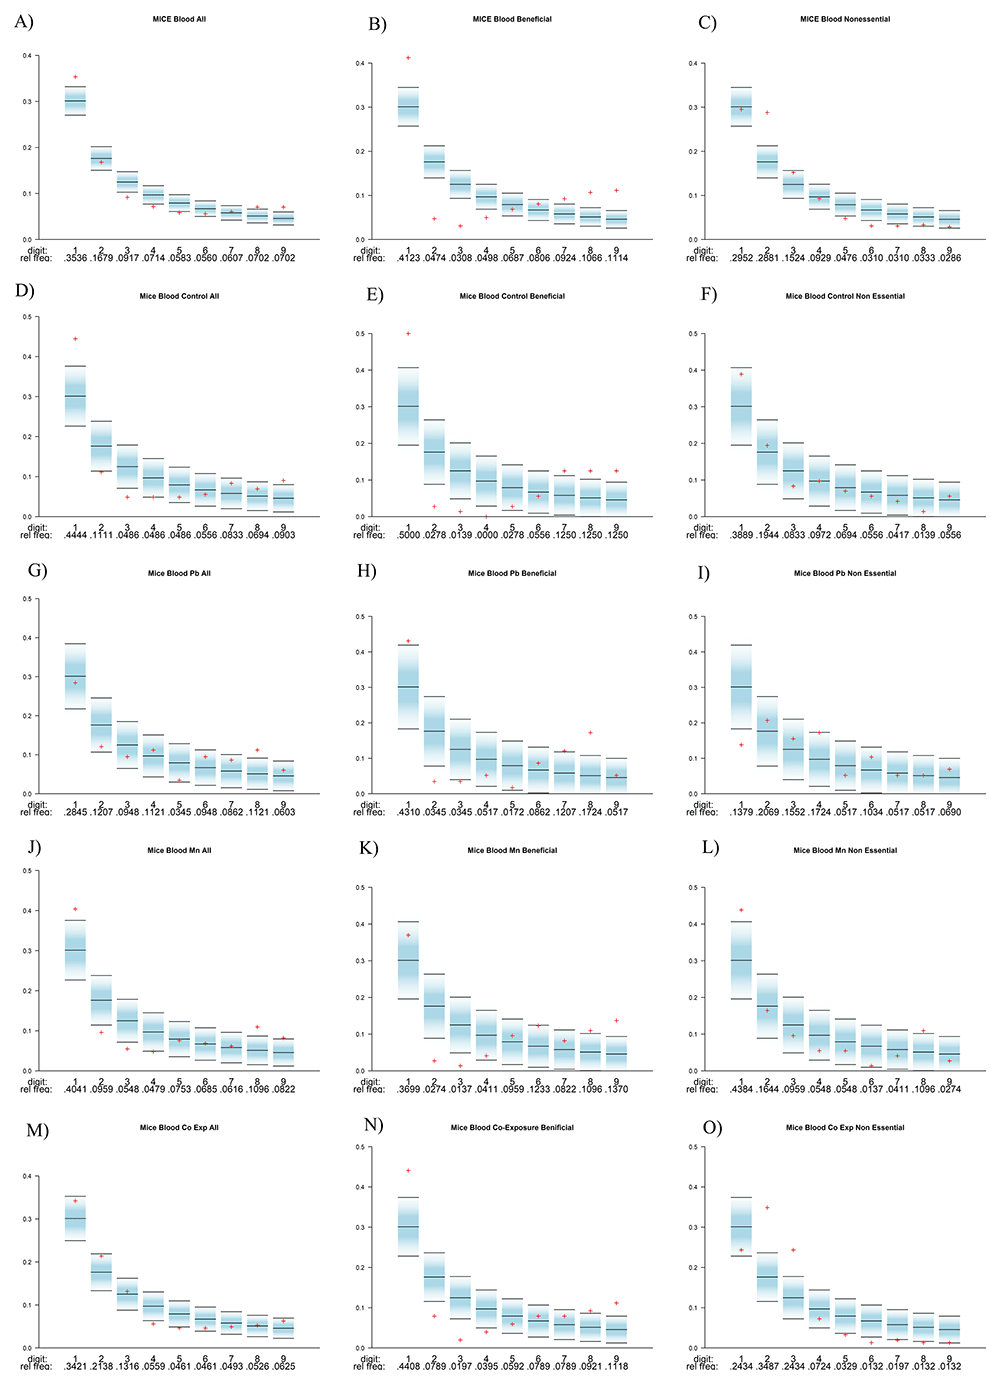
Figure 6. Digit frequency distributions of Mice blood data by element category.
Frequency distribution of the Mice blood sort by All (A, D, G, J, M), Beneficial (B, E, H, K, N), and, Non-essential (C, F, I, L, O) groupings where blue boxes depict the theoretical ideal distribution and 95% confidence interval and the red cross depicts the measured relative frequency. Significant measurements as p-values are provided under each graph. Significant violations were found across the different dosing regimens.
The next data analysed were the treatment-group (Control, Mn, Pb, Mn + Pb) breakdowns of the experimental data. In these data, only the elements of concern were measured, and due to smaller sample size numbers, the 95% CI were generally quite large. Regardless, in control mice (Figure 6:D-F), All and Beneficial groups depicted a similar curvature, whereby the first digit had an exaggeratedly high frequency, followed by a sharp drop in digits 2 to 5, and then a gradual rise in 6 to 9. Here, All was not significantly different than the ideal while Beneficial was minimally significant (p-values of 6.45 x 10⁻¹ and 3.01 x 10⁻², respectively). Alternately, Non-essential was found to be not significant (p-value 1.29 x 10⁻¹). In the Pb-treated mice, (Figure 6:G-I), resulting curves appeared visually more chaotic than the previous data breakdowns. Beneficial data narrowly violated the distribution (p-value 4.01 x 10⁻²), with particularly offset values in digits 2 and 8, while the All subset was also significant (p-value 8.33 x 10⁻³), with discrepancies in digit 8 and all others inside the wide 95% CI. Conversely, Non-essential conformed to the distribution with a p-value of 9.32 x 10⁻², although digit 1 was outside of the 95% CI. When the mice were dosed with Mn only, the resulting curves were noticeably different from the Pb-treated mice. Again, the curve for All data was slightly reminiscent of the previous findings for essential and beneficial data, where there was a high frequency in digit 1, followed by the large drop in 2 to 4, and a relative evening out for the remaining; however, there was no significant deviation from the ideal (p-value 8.80 x 10⁻²). For Beneficial, the distribution significantly departed from expected (p-value 1.46 x 10⁻⁴), owing seemingly to digits 2 and 9. In Non-essential, the results were not significantly different, (p-value 1.66 x 10⁻¹), although noticeable variations were also detected in 1 and 8. Finally, the last grouping was the co-exposure group, which underwent concomitant exposure to both elements. In the All group, the distribution mimicked the ideal distribution (p-value 1.25 x 10⁻¹) while both the Beneficial and Non-essential subsets violated the distributions (p-values of 2.70 x 10⁻² and 1.18 x 10⁻⁵, respectively). In the Beneficial subset, this was mostly due to digits 1 to 4 and 9 while in Non-essential, there is a notable uptick in digits 2 and 3 before returning to the expected trend.
Bone
The final data set analysed were the bones of the mice (Figure 7). Results were inconsistent across treatment groups and life stages (extended data). Due to low sample sizes, results were again combined for the bone analysis. Across all data subsets, there was a violation of the ideal trend, resulting in a minor violation in Beneficial (p-value 4.75 x 10⁻²) and a more extreme violation in Non-essential (p-value 8.10 x 10⁻⁴) data, while All was not significant (p-value 3.34 x 10⁻¹). Upon closer examination in the individual bone data, a wave-like trend was present in the Non-essential subset that depicts almost no frequency of digit 1, a sharp increase in 2~4, and a drastic drop off in subsequent digits.
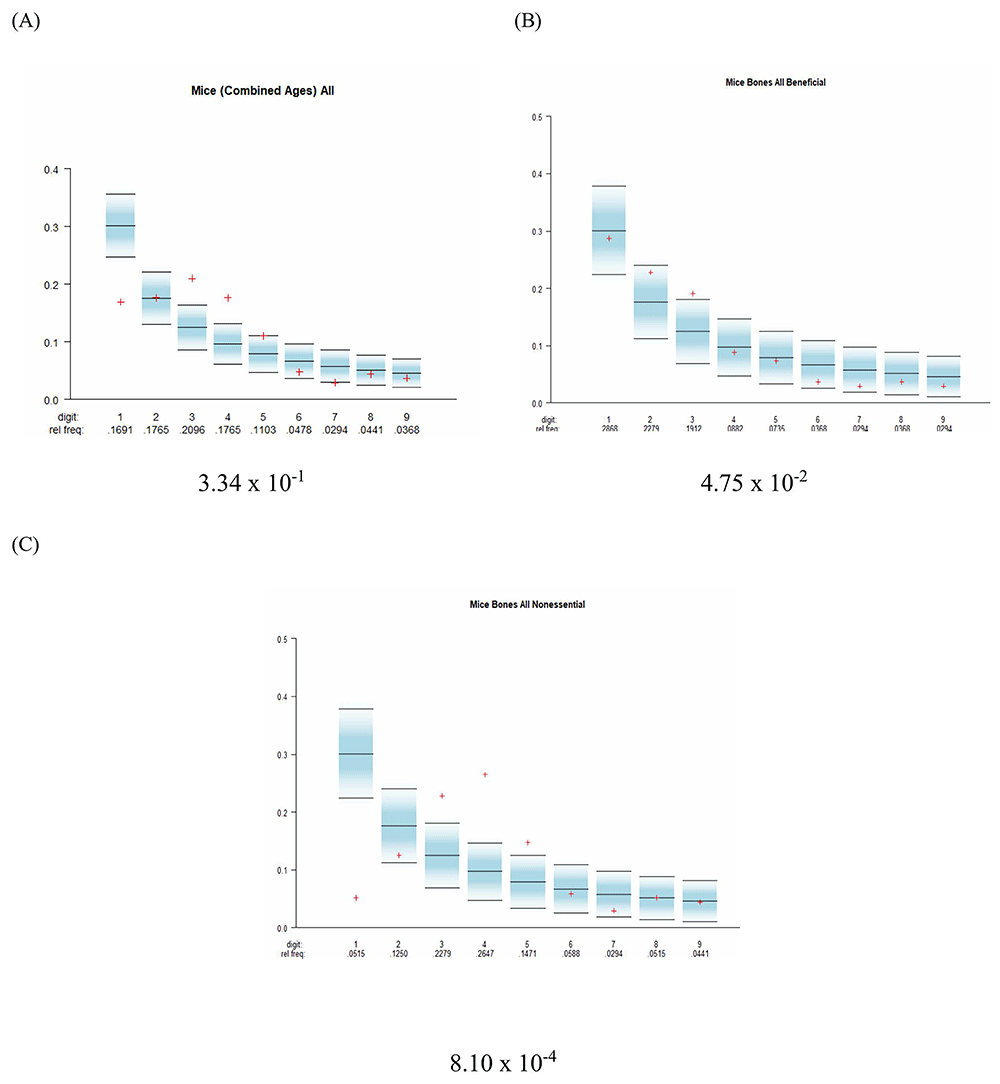
Figure 7. Digit frequency distributions of Mice bone data by element category.
Frequency distribution of the MICE bone (all age groups and treatments combined) results sort by All (A), Beneficial (B), and Non-essential (C) groupings where blue boxes depict the theoretical ideal distribution and 95% confidence interval, and the red cross depicts the measured relative frequency. Significant measurements as p-values are provided under each graph. Significant violations were found in all treatment groups.
Discussion
The NBL concept has been utilized in various fields whereby data that violates the frequency distribution has been flagged as potentially manipulated or fraudulent5,26,27. To test whether the application of the NBL can be influenced by biological factors other than data manipulation, five data sets were analysed to test its accordance with the theory and determine if other factors may influence the data distribution. The results presented herein suggest that data manipulation may not be the only driving factor for violations of the NBL and that its use for identification of fraud, particularly in the biological sciences, should be applied with caution. By using a variety of datasets across species, life stages, and sample type, in combination with visual inspections of the resulting data structure as opposed to only implementing p-value thresholds, it was possible to more thoroughly inspect nuances in the data that were influencing the deviations.
In the human biomonitoring data, the PROBE_1 adult cohort depicted the hypothesized trends, where All and Non-essential element groupings portrayed accordance to the NBL and the Essential and Beneficial elements depicted violations, particularly in a smooth and seemingly non-random fashion. This S-shaped, or sigmoidal, graphical response continued to be an interesting structural characteristic of many of the resulting analyses that warrants further investigations. The deviations in the UNICEF and PROBE_2 datasets, however, provided important insights into how physiological differences between life stages may influence the data distributions in the case of application of the NBL. For instance, larger deviations were noted in the PROBE_2 adolescent dataset compared to the PROBE_1 adult dataset, which could be influenced by several factors, including sample size differences (n = 453 for PROBE_2 versus n = 1423 for PROBE_1). It could also be attributed to the omission of uranium in the adolescent panel, which reduced the overall range of the data in the set and thus resulting in a reduction in the span of the orders of magnitude across the different measurements. However, although statistically significant differences were observed, visual inspection of the curves suggested only minor differences from the expected trend, which could suggest that a larger sample size could result in less deviations. Moreover, the statistical violations could also be ascribed to a greater number of outliers in the dataset. On the contrary, the noted differences could also be attributed to anatomic factors. The period of adolescence is marked by rapid growth rates, large energy and nutrient demands, and overall development; moreover, relative to body weight, energy needs of adolescents are greater than adults28–30. This could explain the noted variations from the NBD; as the energy requirements are heightened, there could be more indiscriminate absorption of non-essential elements with essential analogues as the heightened metabolic activity could impact how elements are absorbed and utilized in the body31,32. Due to increased active uptake of essential and beneficial elements to meet metabolic demands, this could inadvertently result in more non-essential elements entering the bloodstream. Furthermore, in adolescents and children, the unexpected trend in the non-essential class could have similarly resulted due to the immaturity of detoxification and excretion mechanisms33, which leads to increased retention of non-essential elements. It was interesting to note that, when all of the elements were combined in the All grouping, each life stage showed the same trend of the ideal NBD.
Different biosamples also behaved differently when visually inspected for the cause of NBL violations, particularly in urine and hair. While smaller sample sizes (n = 200) in the urine subset could have contributed to these deviations, a graphical assessment also depicted the previously described S-shaped curve in the Non-essential group, characterized by a low initial frequency, shallow decrease and then increase, and then a levelling out. This pattern could be related to the role of urine as an excretory fluid, which indicates the active secretion of waste products34. Thus, Beneficial elements, which are essential for normal bodily functioning, are excreted at a steady-state while non-essential elements are actively filtered out and removed. Furthermore, hair samples were also investigated. Hair is often used in environmental studies to assess long-term exposures to environmental pollutants, although it is known to be highly sensitive to contamination19,35–37. Moreover, non-essential elements such as heavy metals are known to accumulate in hair when exposures are high while essential elements are passively deposited there38–41. In the present study, hair exhibited uncertain trends in the Beneficial and Non-essential groupings and expected responses in the All, where the ideal trend was noted. The irregular response in Beneficial and Non-essential could also be attributed to the limited spread of the data, which only measured two elements and with a relatively small sample size, although it could be due to the aforementioned contamination. It will be important to further characterize the responses of this sample type in future. Overall, these datasets highlighted the importance of considering the sample type and the metabolic role they play in absorption, distribution, metabolism, and excretion functions within the body.
The experimental data also showcased a different aspect to consider when applying the NBL to biological data. Overall, large confidence intervals and variable conformity to the NBL were observed, which could be associated with smaller sample sizes or the inherent nature of experimental dosing studies, where predefined levels of elements are intentionally administered. In this respect, the repetitive and consistent administration of elements, particularly toxic or non-essential ones, does not mimic natural conditions. In reality, organisms are rarely exposed to such large quantities of these elements. As such, the noted deviations from the NBD, particularly in the Pb and Mn treated conditions, could in fact reflect the non-stochastic nature of the data rather than a physiological mechanism. Regardless, the noted trends (as opposed to the p-values) in the control conditions generally agreed with the earlier established trends. Interestingly, the competitive interaction between Pb and Mn resulted in the previously described S-curve for Mn but in a wave-formed result in Pb, which could be attributed to the competitive interference between lead and manganese in biological systems42,43. It would be interesting to further investigate this concept and the potential use of the NBD to assess physiological processes such as the interaction kinetics of elements in study systems. This analysis further endeavoured to assess another biosample type. Bone, which is a relatively inert tissue comparatively, exhibited deviations from the NBD that could reflect its long-term propensity to sequester elements and low metabolic activity. Pb is known to be a calcium analogue and thus is preferentially deposited in bone, although this also depends on life stage44–47. Therefore, the observed distribution could be linked to the tendency of bone to act as a reservoir for the element in question.
The consistently noted trend of the rotated sigmoidal curve was observed across several datasets, particularly in the blood samples in beneficial and essential groupings. This curve may be an indicative feature of elements that undergo active or preferential uptake. Blood is a highly dynamic biofluid that is frequently used as sample type for various biomarkers48–51. It is valued for its accuracy in reflecting the current physiological condition and homeostasis status of organisms as it serves as a transport system for a vast array of metabolic molecules, aspects that make it highly responsive to short-term alterations in the internal environment of the body48–52. This appeared to be reflected in the present study, where blood seemed to be the most appropriate biosample for testing the present hypothesis. Alternately, hair is more useful as a retrospective matrix that is metabolically inert, although it can sequester some contaminants, although its analysis is prone to environmental contamination and sampling error35,36,39,40,53. Urine is the product of a passive system function (excretion) and therefore may not be particularly selective towards elemental essentiality. Urine is also more reflective of the state of the inner equilibrium across a longer time frame and therefore will not reflect as accurately the present state of the body52. Finally, bone is also relatively inert metabolically and instead can sequester certain elements and calcium analogues. Generally, these excretory and sequestration samples may be less useful in the instance of applying the NBL in the manner outlined here, although it is crucial to generate more data in this regard. The cases outlined here further support the utility of combining visual inspections with statistical analysis before developing conclusions on datasets, as the results may lead to invaluable insights into the data. This method of visual inspections could also be used to determine whether deviations from the NBL are actually due to underlying mechanisms (in the cases of seemingly non-random or structured data distributions) versus instances of manipulated or falsified data.
From the present study, we recommend the use of the Judge-Schechter Median Deviation Test as an alternative to the Chi-Square Test, which may improve results interpretation and provide more meaningful insights into the data structure. It is also important to investigate data sets and subset them accordingly and in a manner which makes scientific sense in order to better delve into the characteristics of the data and to avoid variables (sample type, study organism age, experimental type, etc.) that, when combined, may influence the outcome. Moreover, most studies to date focus on binary outcomes when testing the NBD i.e. a data set violates or does not violate the distribution. This practice ignores the importance of understanding whether a violation is resulting from random effects, or potential manipulation (although intentionally manipulated data were not assessed here and are outside of the scope of this analysis). Moreover, violations in the NBD could instead be used to identify whether elements are interacting in a biological system in a meaningful way, whether antagonism, synergism, or competition is occurring, or as an indicator for underlying driving factors. Therefore, we theorise that consistent, structured, characteristic curves in the data dictate a non-random process while no clear trend could indicate violations due to tampering. This further suggests that the p-value may be a false flag when using and investigating the NBL phenomenon. Additional data analyses are necessary to better solidify the concepts explored in the present research, particularly as they apply to differences in life stages, experimental dosing exposures, non-blood-based biosamples, and the implications of competitive interactions in selected elements.
Conclusions
In summary, significant deviations from the expected NBD were noted across all the used datasets. However, with further inspection, many violations resulted in non-random, structured trends that appeared to be driven by physiological mechanisms as opposed to data falsification. The findings presented in this study could have important implications for future research across various fields, especially within the biological sciences considering the increasing use of the NBL in flagging fraudulent data. Further research is needed to determine if this concept can be applied successfully to other datasets and in other areas of interest such as drug metabolism and interaction research or whether it is possible to apply to other classes of substances and molecules in the exposure sciences. Further exploration into how physiology can influence the NBL is pertinent to improving its application and reliability in the natural sciences and in order to progress past binary assessments of data conformity. Overall, the exact determination of which mechanisms are responsible for the violation of NBD will require more extensive analysis with larger datasets on a case-by-case basis.
Ethical approval
Ethical approval and consent' section at the end of the article and add the author's statement 'Ethical approval was not required for this study, as confirmed by the Aristotle University of Thessaloniki Research and Ethics Deontology Committee, which granted an exemption based on the use of fully anonymised and non-identifiable secondary data (Reference No: 131925/2025).









