1.1 Introduction
As our private and personal lives become increasingly digitalised (see 1) with more time spent in cyberspace, there is a growing need to consider the security of online data. Further, with an increased call for health data2 and data sharing3,4, but variable sensitivities and attitudes across individuals5, the responsibility for protecting those data is unclear6. Nonetheless, cyber-attacks which could compromise personal data are increasingly sophisticated7 and with significant impact8. At the same time, and although contested9, private individuals are generally thought to be a significant target for cyber-attacks10. Such attacks might include playing on psychological vulnerabilities11 or using social engineering techniques12. So, it is clearly important to understand the human factors behind potential vulnerability to cyber-attacks13. Along with a focus on implementing appropriate infrastructure-based solutions and management actions14, there is also the challenge of motivating individual behavioural change15 to adopt appropriate security-enhancing measures at a personal level, especially if individuals do not believe the potential risk to be relevant to them16. Using the Protection Motivation Theory behavioural model15,17, this study investigates UK private citizen understanding of security-enhancing technologies and their subsequent willingness to adopt such technologies. On that basis, we explore some of the extraneous factors which are associated with the intention to adopt cybersecurity measures. Determining private citizen responses to threats and attitudes to available controls will increase our understanding of how to encourage behavioural change.
1.2 Background
Understanding private citizen responses to cybersecurity threats involves several perspectives. First, cybersecurity standards have been developed to define the landscape18 and procedures to manage associated risks for technology end-users and administrators19. Section 1.2.1 describes a typical cybersecurity view which informs the rest of the paper. With that in mind, if security experts expect human actors to respond to threats in a socio-technical system, it is important to appreciate their perceptions of risk (Section 1.2.2). Finally, taking a behavioural perspective may throw some light on how private individuals make decisions about responding to threats. In Section 1.2.3, a behavioural model previously associated with the decision to take security-supporting measures is introduced. For each of these sections, specific research questions arise which inform an empirical investigation into private individuals' attitudes to cybersecurity in Section 1.3.
1.2.1 Threats and controls
Defining cybersecurity is not always straight forward20. Although often used interchangeably with information security, von Solms and van Niekerk21 see cybersecurity in broader terms encompassing other assets including technology users themselves and not just their information. An asset, then, is “anything that has value... and which, therefore, requires protection”19 to avoid attack (“attempt[s] to destroy, expose, alter, disable, steal or gain unauthorized access to or make unauthorized use of an asset”18,19) by threats or the “potential cause(s) of an unwanted incident, which can result in harm”18. Threats exploit vulnerabilities (“weakness(es) of an asset”18), and cause risks (the likelihood and impact of loss or damage). They may be either malicious behaviours (attacks), or unintentional or inadvertent behaviours that lead to similar harms. The “well-intentioned" user9 is likely to fall into the latter category. A control is a “measure that is modifying risk"18 by either reducing the likelihood of a threat attacking an asset (reducing the asset's vulnerability) or lowering consequent impact or both. Figure 1 summarises relationships between these concepts, where threat events (an amalgam of threat and event in 18) exploit vulnerabilities leading to cybersecurity risks to particular assets.
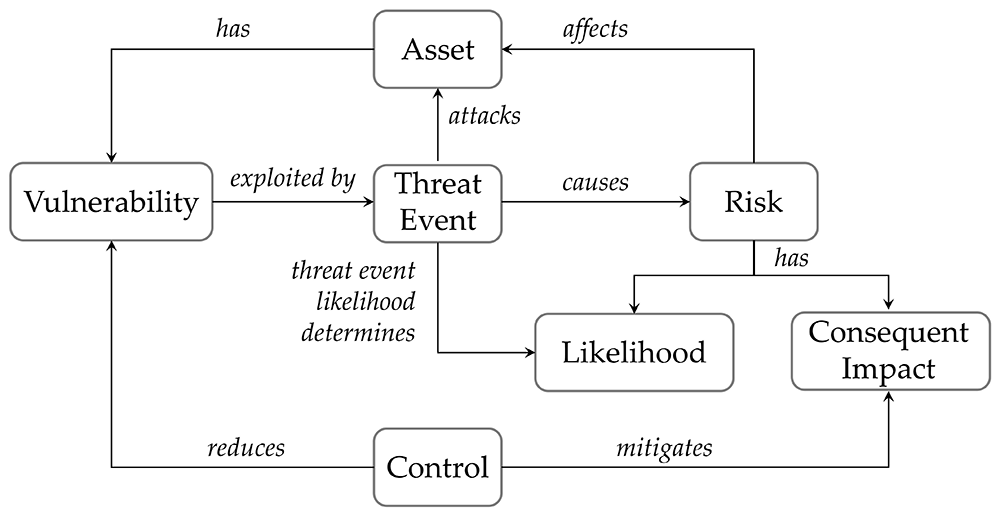
Figure 1. Schematic representation of the threat landscape (see also 22,23).
Following Ganin and his colleagues22, we emphasise that understanding the threat landscape requires a holistic approach. For simplicity, we use threat as shorthand for risk, threat and threat event, and control for any measure taken to contain the threat or mitigate the risk. This leads to our first two research questions (RQ):
1.2.2 Risk perception
As mentioned, people represent a significant source of risk10 and ideally need to become part of the solution rather than the problem9. Context, demographics, affect and beliefs around responsibility all seem to influence cybersecurity adoption decisions. For example, willingness to undertake security-appropriate behaviours may be generalised rather than specific24. That assumes individuals attend fully to all information, though, which may not be the case25, meaning no appropriate protective behaviours are undertaken26. Individual responses appear to differ by how developed a country is27, the measures that country adopts28, cultural differences26, and context-determined affect29. For security professionals, as the amount of relevant information decreases, so the subjectivity of their responses increases30,31. For these experts and private individuals alike, though, affective responses to risk perceptions16,32,33 reveal a complicated interrelationship between emotional response and the intention to act based on risk perception34. This may depend on self-belief (or self-efficacy35) in applying mitigating controls36, and to some degree personality traits37,38. Further, if experts are believed to be responsible for controls, when private individuals are unable to access and assess all relevant information39, then trust plays a mediating, but complex38,40 role as a socially constructed phenomenon related to confidence in system function41. With specific reference to technology, trust is a moderating factor along with risk perceptions, subjective norms and self-efficacy all influencing perceived usefulness decisions in adoption42. Ultimately, though, too much emphasis on the consequences of a given risk may leave individuals overwhelmed, the resulting “security fatigue” leading to inaction26 or even maladaptive behaviours39,40.
For context, we will focus on the potential for sharing health data. These data are defined as special category personal data (Art. 943) and therefore require additional measures from any provider processing such data than other data types, including other types of personal data. Regarding the contextual effects outlined, we targeted the following RQs:
RQ3. How do individual characteristics (demographics) influence cybersecurity judgements?
RQ4. How does affect influence cybersecurity judgements?
RQ5. Who do private individuals believe responsible to introduce controls?
1.2.3 Protection motivation: a behavioural perspective
If risk perception is the result of the integration of an analytical with a more emotional pathway (see, for instance, 29), we must contextualise risks as relevant to individuals to encourage them to adopt any associated controls on the one hand, but also account for affect in the decision-making process. Behavioural models related to risk prevention suggest that the decision to adopt appropriate measures depends on the balance between perceptions of threats and the benefits of adoption (cost-benefit) with self-efficacy and social norms (personal beliefs, experience and ingroup perceptions). All of these have been mentioned in the previous sections as significant for cybersecurity related behaviours.
One common model in this area derives from Protection Motivation Theory (PMT) as shown in Figure 215,42,43. The PMT has been used to explore cybersecurity awareness and the willingness to adopt security-enhancing measures15. Comparing Figure 1 with Figure 2, Threat Appraisal is effectively a risk assessment: what is the likelihood (or Susceptibility in Figure 2, vulnerability in Figure 1) of an event and what would its impact (or Severity in Figure 2 or risk in Figure 1) be? The Coping Appraisal is a judgement about how effective a control may be in dealing with the threat (or Response efficacy in Figure 2 or control in Figure 1) and whether an individual feels able to implement that control (or Self-efficacy). To undertake this cost-benefit analysis leading to Protection Motivation (the intention to adopt the control), individuals must also feel themselves personally responsible.
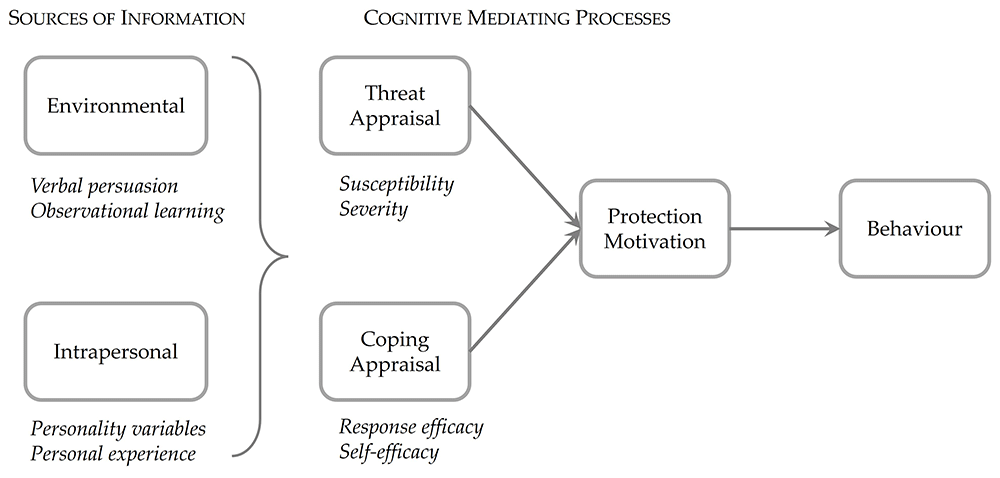
Figure 2. Behavioural model derived from Protection Motivation Theory1.
1.2.3.1 Sources of information and security-related behaviours. The Cognitive Mediating Processes of the PMT model (Figure 2), as the name suggests, represents the more rational decision-making arm of a dual process model. Such processing can be assumed to take place within a specific context, including an individual’s experience and that of significant others (their ingroup). In their meta-analysis, Floyd and her colleagues42 also refer to Sources of Information such as contextual and individual factors (their Figure 1). Although not explicitly identified, others have suggested that individuals equate privacy (individual concern about how data are used) and security (how data are protected) orthogonally37 and may be behaviour specific44; that trait mindfulness can reduce vulnerability45 while other traits influence antecedents of privacy concern38; and that priming (i.e., contextual effects) can influence cybersecurity behaviours, though not in a straightforward manner29. Our final RQ, therefore:
1.3 Methods
Using healthcare data as the overarching setting, the study design used a crowd-sourced, anonymous online survey to investigate private citizen perceptions of cybersecurity as it related to those data. As respondents were UK based, the National Health Service (NHS) was assumed to be the healthcare provider. The survey included a set of ranking and matching tasks using seven cybersecurity threats and seven controls identified in a European research and innovation project to address RQs 1 to 5. These tasks were followed by a pre-validated PMT questionnaire adapted to a healthcare data sharing scenario to explore RQ 6. (The survey is available online46.)
1.3.1 Materials
For ranking and matching, seven common threats were identified in the project: six relate to typical technology scenarios such as data misuse (T1), the loss of or unwise use of the end user's device (T3, T7), insecure ICT infrastructure at the healthcare provider (T4, T6), or misbehaviour of an application running on the user's equipment (T5); the seventh, a common source of information about data use etc. which may be overlooked by users (T2) (see Table 1). Seven appropriate security controls were suggested (see the last two columns of Table 1). These included measures to protect data at rest and in transit (C1), process issues (C2, C5 - restricting access; C3 - providing training); and technology-centric controls (C4, C6, C7). Positioning these controls against the threats in the first two columns as shown in Table 1 is for illustrative purposes only: these matchings were not exposed to survey participants; and many of the controls could be used to mitigate more than one threat.
Table 1. Threats (first two columns) and potential controls (second two columns).
Note that the matching of a control to a threat is suggestive only and was not exposed to participants.
| Threat | Description | Control |
|---|
|
T1
| A hospital using my data for things other than treating me | Making sure that medical staff only see the bits of my data that are essential for my treatment rather than all of it |
C2
|
|
T2
| Trying to understand what all the Terms and Conditions mean when I'm signing up to an app | Making sure that my medical data are protected and can only be looked at by medical staff |
C5
|
|
T3
| If I lost my phone or laptop, or someone got my password, someone getting at my medical records | Having an automatic lock on a phone or computer app, so my data stays safe even if the phone or computer is stolen |
C4
|
|
T4
| If the hospital gets hacked, my medical records falling into the wrong hands | Adding protection (encryption) to all medical data wherever it's stored, sent or viewed, so it can't be tampered with |
C1
|
|
T5
| An app on my phone or computer might send my data to the wrong people | Only allowing my medical data to be used on a separate computer not connected to the Internet |
C7
|
|
T6
| The hospital storing my medical data in the cloud (i.e., somewhere else) | Giving staff at the hospital special training on how to protect my medical data |
C3
|
|
T7
| Using my phone or laptop in a public place where anyone might get access to my medical records | Having threats identified continuously and counter measures automatically activated to help me manage my medical data |
C6
|
A draft of the survey was reviewed by peers to ensure that wording was clear, and to estimate how long the survey would take to complete. The colleagues all have some experience with cybersecurity. They took an average of 10 to 11 minutes. Using this, we established a level of payment. Participants were therefore paid a modest amount2 for taking part.
1.3.2 Participants
Some 8013 participants were recruited via a crowd-sourcing platform (Prolific.co), since others report comparable results from crowd-sourcing platforms and student participant panels47 and slightly better demographic coverage48. In our survey, participants were asked to self-report Gender Identity, Age Group and what they claimed to be their level of Expertise. This information is summarised in Table 2 and compares well with existing UK population projects on (binary) gender, though there is a bias towards younger citizens regarding age group49.
Table 2. Participant demographics.
| Category | N | % |
|---|
|
Gender Identity
|
|---|
| Female | 398 | 49.69 |
| Male | 396 | 49.44 |
| Third gender/non-binary | 4 | 0.50 |
| Prefer not to say | 3 | 0.37 |
|
Age Group
|
|---|
| 18 – 29 | 337 | 42.07 |
| 30 – 49 | 359 | 44.82 |
| 50 – 69 | 100 | 12.84 |
| 70 or over | 5 | 0.62 |
|
Expertise
|
|---|
I'm a novice, and I prefer
not to use technology | 4 | 0.50 |
I'm OK with technology. I
use it when I need it | 427 | 53.31 |
I'm an expert. I use
technology all the time | 370 | 46.19 |
1.3.3 Online survey
The survey was hosted on an external platform (Qualtrics.com) and comprised four main sections46. First, respondents were asked to read a short passage on the threat of cybersecurity retrieved from an online website50. This was followed by a task where respondents were asked to rank threats for seriousness or controls for effectiveness, match controls against threats, or identify who they thought responsible for implementing the control (see Section 1.3.3.1). Third, they were asked to respond to a set of pre-validated, PMT-derived assertions (see Section 1.3.3.2). Finally, they were given an opportunity to leave any general comments and asked to provide selected demographic information. None of the questions or tasks was mandatory.
The survey ran twice. Initially, 500 participants responded. However, there was confusion with the way the matching task had been presented. In Section 1.3.3.1 below, these are grouped as condition None. A second iteration with 301 participants was run making sure the matching task was rendered appropriately. This time, they were asked to match threats and controls, but were randomly assigned to one of two conditions: either they were given a discursive description of the control to aid understanding (Matching – Long Description) or a more succinct one, enough only to identify the control (Matching – Short Description). Different participants took part in the first and second iterations; and different participants were assigned randomly to a different task.
1.3.3.1 Priming task. Different participants took part in the first and second iterations; and different participants were assigned randomly to each different task (see Table 3). Each activity was intended to act as a primer: threats to lead to negative affect, controls and responsibility as well as the matching tasks to positive affect.
Table 3. The 6 overall priming tasks after pre-processing, showing the number of participants assigned to each task and the median time taken to respond to the whole survey.
| Label | Description | Participants | RQs |
|---|
| N | Time |
|---|
| Threats | Participants were asked to rank seven threats by potential impact | 94 | 5m40s | RQ1 |
| Controls | Participants were asked to rank seven controls by perceived effectiveness of that control | 93 | 5m18s | RQ1 |
| Responsibility | Participants were asked to identify whom they believed responsible for implementing the control | 109 | 5m30s | RQ5 |
| Matching – Long Description | Participants were asked to match the control which would best mitigate the threat (the description of the controls was more discursive) | 142 | 7m18s | RQ2 |
| Matching – Short Description | Participants were asked to match the control which would best mitigate the threat (the description of the controls was brief) | 125 | 7m40s | RQ2 |
| None | Participants were asked to match threats and controls, but their matching responses were discarded | 113 | 6m53s | (RQ2) |
| TOTAL | - | 676 | 6m09s | |
The number in the third column shows the total number randomly assigned to a given activity once outliers were removed (see Section 1.4.1). The fourth column shows the median time taken to respond to the whole survey. The timings for Control, Threat and Responsibility are approximately the same. For None, the time increases reflecting the confusion which the formatting caused4. For the Long and Short matching task, participants took longer as expected: they had to read the description of the threat, the description of the control, and then match the two. With that in mind and based on time taken, therefore, we do not believe any of the tasks to have been more or less demanding. The final column indicates the RQ targeted with the task.
The intention with these tasks was to provide a positive or negative context for participants to respond to the PMT assertions: for instance, asking them to rank threats was expected to highlight vulnerability, whereas ranking controls might reduce the perceived vulnerability. Matching controls to threat would be expected to increase self-efficacy. These, therefore, target RQ4. Finally, asking participants to identify who they believed responsible for implementing controls would indicate whether they felt it their job to adopt appropriate protective behaviours (RQ5). These may be regarded as priming tasks51,52 (RQ4).
1.3.3.2 PMT questionnaire. Based on work reported by 53, six constructs from a PMT model were selected as shown in Table 4. According to the PMT, these are assumed to relate to the following latent variables as follows: Threat Appraisal is comprised of SUS and SEV; Coping Appraisal of COST, BENE and SELF; and Intention to Act of INTEN. To pace presentation in the online survey, they were presented in pairs: SUS and SEV appeared in a section titled “How do you feel about cyber security now?”; COST and BENE in “How do you feel about the security measures available to protect your information?”; and SELF and INTEN in “Finally, how do you feel in general about threats to your information and what can be done to protect you?”; the construct labels were not exposed to participants. A six-point Likert scale was used to collect participant responses to each of the assertions ("Strongly Agree" to "Strongly Disagree"). In common with other such surveys, some items were presented with opposite valence: I
believe that... became I don't believe that... (see, for instance, 54). The PMT-derived assertions targeted RQ6.
Table 4. Constructs from the PMT model covered in the online survey.
| Construct | Label | Items | Description |
|---|
| Susceptibility | SUS | 4 | The individual's belief that they are vulnerable to attack |
| Severity | SEV | 4 | The individual's belief concerning the impact of such an attack |
| Cost | COST | 3 | The effort or resource required by the individual to take appropriate
measures to avoid an attack |
| Benefit | BENE | 5 | The likely benefit from taking appropriate measures to avoid attack |
| Self-Efficacy | SELF | 3 | The individual's belief that they are able to take appropriate action to
avoid attack |
| Intention to Act5 | INTEN | 5 | The individual's intention to take appropriate action to avoid attack |
1.4 Results
In the following sections, we report how individuals responded to the priming tasks (Section 1.4.2) and specifically around who is perceived to be responsible for implementing controls (Section 1.4.2.4). After that, we look at the responses to the PMT-derived questionnaire (Section 1.4.3); and finally, any significant effects that context in terms of the priming task (Section 1.4.4.1) or demographic characteristics (Section 1.4.4.2) may have on those responses.
1.4.1 Data pre-processing
None of the individual items in the survey was mandatory. In consequence, there were occasions when responses were missing. For the PMT assertions, we removed the whole set of responses if any individual answers were missing6. From the original 801 original, removing incomplete responses in this way left 776 responses.
From experience with crowd sourcing survey responses, we know that participants will generally complete all questions within a relatively short period of time; in our case, all initial 500 participants had responded within a matter of hours7. The average time was 7 minutes 7 seconds (median duration: 5 minutes 52 seconds); the shortest time was 1 minute 12 seconds, the longest 53 minutes 29 seconds. We removed any responses which were returned in less than 210 seconds (3.5 minutes), which we felt was reasonable for this survey and these participants who were accustomed to responding to surveys. This left us with a total of 676 responses.
1.4.2 Private individual awareness of threats and controls
For Threats and Controls, an overall score for ranking purposes was calculated as follows. When a threat was ranked first (most concerning), it was given a score of 7; when ranked second, it was given a score of 6; down to when it was ranked as the least concerning, it was given a score of 1. For example, for Threat T1, it was ranked most concerning 15 times, ranked second 11 times, and ranked least concerning 8 times. The overall score of 379 in Table 5 was calculated as ((7 * 15)+(6 *11)+(5 * 11)+(4 * 14)+(3 * 19)+(2 * 16)+(1 * 8)). This process was repeated for the Control context.
Table 5. Threats in Rank Order (N = 949).
| Threat | Description | Rank | Score |
|---|
|
T3
|
If I lost my phone or laptop, or someone got my password, someone getting at my medical records
|
1st
|
515
|
| T4 | If the hospital gets hacked, my medical records falling into the wrong hands | 2nd
| 488 |
| T5 | An app on my phone or computer might send my data to the wrong people | 3rd
| 403 |
| T1 | A hospital using my data for things other than treating me | 4th
| 379 |
| T7 | Using my phone or laptop in a public place where anyone might get access to my medical records | 5th
| 366 |
| T6 | The hospital storing my medical data somewhere else (i.e., in the cloud) | 6th
| 257 |
| T2 | Trying to understand what all the Terms and Conditions mean when I’m signing up to an app | 7th
| 224 |
1.4.2.1 Threats. Table 5 summarises the calculated overall rankings provided by private individuals assigned to this task. The highest threat (T3) was deemed to come from loss of a personal device (the threat event), leading to a breach of personal health data (the risk). Similarly, T4 refers to a breach at the service provider (in this case, a hospital) premises. There was less concern for threats relating to actions they could take (T7 and T2), or about secondary use of data (T1). Private individuals are therefore capable of assessing the relative importance of cybersecurity threats. RQ1 is therefore partially answered8.
1.4.2.2 Controls. Table 6 summarises the rankings assigned to the suggested controls when presented in isolation. Overall, participants regarded measures to protect their data wherever they are stored or transmitted (C1) as the most effective control. Controls restricting access (C5 and C4) were next. The infrastructure in the terms of data stored outside the data controller’s premises (C7) was regarded as least important. As with threats, private individuals were able to make decisions about cybersecurity controls. In terms of effectiveness, encryption is a reasonable control as a default mechanism to protect the data. Along with ranking threats (Section 1.4.2.1), RQ1 is answered: private individuals in the UK can evaluate threats and controls in terms of perceived severity / effectiveness.
Table 6. Controls in rank order (N = 939).
| Control | Description (Long) | Rank | Score |
|---|
|
C1
|
Adding protection (encryption) to all medical data wherever it's stored, sent or viewed, so it can't be tampered with
|
1st
|
559
|
| C5 | Making sure that my medical data are protected and can only be looked at by medical staff | 2nd
| 458 |
| C4 | Having an automatic lock on a phone or computer app, so my data stays safe even if the phone or computer is stolen | 3rd
| 367 |
| C6 | Having threats identified continuously and counter measures automatically activated to help me manage my medical data | 4th
| 348 |
| C2 | Making sure that medical staff only see the bits of my data that are essential for my treatment rather than all of it | 5th
| 324 |
| C3 | Giving staff at the hospital special training on how to protect my medical data | 6th
| 308 |
| C7 | Only allowing my medical data to be used on a separate computer not connected to the Internet | 7th
| 240 |
1.4.2.3 Matching threats and controls. In the second iteration of the survey, participants were asked to match a control to a threat, i.e., how would they mitigate the risk associated with a given threat? Participants could match the same control to different threats. Table 7 and Table 8 summarise the results using short and long descriptions respectively.
Table 7. Matching controls to threats based on a short description of the control.
| Control (Short Description) |
|---|
| Threat | C1 | C2 | C3 | C4 | C5 | C6 | C7 |
|---|
| T1 | 56 | 35 | 18 | 0 | 14 | 1 | 1 |
| T2 | 46 | 9 | 21 | 4 | 8 | 29 | 8 |
|
T3
| 31 | 1 | 2 | 79 | 2 | 5 | 5 |
|
T4
| 61 | 3 | 6 | 3 | 11 | 24 | 17 |
|
T5
| 53 | 4 | 3 | 11 | 14 | 21 | 19 |
|
T6
| 65 | 3 | 14 | 1 | 10 | 7 | 25 |
|
T7
| 38 | 1 | 1 | 39 | 9 | 12 | 25 |
|
Total
| 350 | 56 | 65 | 137 | 68 | 99 | 100 |
|
Rank
| 1 | 7 | 6 | 2 | 5 | 4 | 3 |
Table 8. Matching controls to threats based on a long description of the control.
| Control (Long Description) |
|---|
| Threat | C1 | C2 | C3 | C4 | C5 | C6 | C7 |
|---|
|
T1
| 56 | 28 | 7 | 2 | 28 | 8 | 4 |
|
T2
| 36 | 10 | 22 | 11 | 28 | 30 | 5 |
|
T3
| 23 | 0 | 1 | 102 | 8 | 3 | 5 |
|
T4
| 86 | 1 | 1 | 2 | 10 | 19 | 21 |
|
T5
| 56 | 7 | 6 | 13 | 31 | 21 | 8 |
|
T6
| 79 | 2 | 8 | 1 | 13 | 15 | 24 |
|
T7
| 58 | 3 | 4 | 36 | 9 | 20 | 12 |
|
Total
| 403 | 51 | 49 | 167 | 127 | 116 | 79 |
|
Rank
| 1 | 6 | 7 | 2 | 3 | 4 | 5 |
A Mann-Whitney U test on the totals in these two tables showed no significant differences based on the length of the control description when matched against a potential threat (Z = 23.00, p = 0.902).
Table 9 compares the selection of controls from the matching task with the selection of controls in isolation, that is when participants were asked to rank controls from the most effective to the least effective with no reference to threat (see Table 611). C1 (Adding protection (encryption) to all medical data wherever it's stored, sent or viewed, so it can't be tampered with) has been ranked as most effective and matched most often to the threats presented in the survey. On its own, this may indicate that participants regarded this control as a catchall. However, since other rankings lower down in effectiveness are close across the matching task and ranking in isolation, this may suggest that participants are making informed decisions about cybersecurity controls. We therefore believe RQ2 has also been answered affirmatively.
Table 9. Comparing the selection of controls.
| Control |
|---|
| C1 | C2 | C3 | C4 | C5 | C6 | C7 |
|---|
| Matching (Short Description)
|
|
Total
| 350 | 56 | 65 | 137 | 68 | 99 | 100 |
|
Rank
| 1 | 7 | 6 | 2 | 5 | 4 | 3 |
| Matching (Long Description)
|
|
Total
| 403 | 51 | 49 | 167 | 127 | 116 | 79 |
|
Rank
| 1 | 6 | 7 | 2 | 3 | 4 | 5 |
Independent Ranking (regardless of
Threat10)
|
|
Total
| 559 | 324 | 308 | 367 | 458 | 348 | 240 |
|
Rank
| 1 | 5 | 6 | 3 | 2 | 4 | 7 |
| = | | ≈ | ≈ | | = | |
1.4.2.4 Responsibility for implementing cybersecurity controls. Table 10 summarises private individual perceptions of who is responsible for implementing a given control. Looking at the final column (labelled ‘Total’), not surprisingly since participants were asked to consider health data, it is the data controller (the NHS or the hospital) who is regarded as responsible for implementing controls in most cases. On the other hand, since data encryption at rest and in transit was regarded as the most effective control (see Table 9 and Control C1), presumably data subjects believe someone else to be responsible for the secure handling of their data.
Table 10. Who participants believe to be responsible for implementing the control (N = 109); the highest ranked agent(s) is shown in bold.
| Who is Responsible? | C1 | C2 | C3 | C4 | C5 | C6 | C7 | Total |
|---|
| I am | 1 | 4 | 1 | 60 | 1 | 5 | 6 | 78 |
| the Government | 8 | 2 | 13 | 1 | 7 | 20 | 2 | 53 |
| the NHS | 37 | 49 | 52 | 3 | 52
| 19 | 45 | 257 |
| the Hospital | 7 | 23 | 42 | 3 | 22 | 2 | 36 | 135 |
| the phone / computer manufacturer | 5 | 0 | 0 | 26 | 0 | 9 | 3 | 43 |
| the person who wrote the app | 32
| 26 | 1 | 13 | 20 | 27 | 11 | 130 |
| the network carrying the information | 19 | 5 | 0 | 3 | 7 | 27 | 6 | 67 |
Looking at the detail in Table 10 (the columns marked C1 to C7), there are two exceptions to the data controller having responsibility for all controls. First, in response to C4 (Having an automatic lock on a phone or computer app, so my data stays safe even if the phone or computer is stolen), the individual who owns or manages the device is identified as responsible. Encouragingly, private individuals recognise their own obligation to protect their own devices. Secondly, for C6 (Having threats identified continuously and counter measures automatically activated to help me manage my medical data), private individuals identify the manufacturer or network provider as responsible. This makes sense a priori in that the developer could be expected to maintain cybersecurity standards on behalf of the end user. Further, it is common nowadays for software by default to install necessary updates whenever they become available and the device running the software is connected to the Internet.
There is some indication, therefore, that private individuals are making informed decisions about cybersecurity threats and controls. More importantly, that they may also decide who is responsible when it comes to implementing a control based on the specific context as illustrated in Table 10. RQ5 is therefore answered for this context (healthcare data).
1.4.3 Modelling private individual responses to cybersecurity threats to healthcare data
Pooled responses to the PMT-type assertions (676 after initial screening for outliers as described) were quantified including reverse coded items marked with an asterisk (*) in Table 11 (Strongly Agree as 6 to Strongly Disagree as 1; reverse coded items: Strongly Agree as 1 to Strongly Disagree as 6). The Likert scores were used to drive an exploratory factor analysis (EFA)12. The rationale for factor analysis was to find structure within a data set as it might relate to the PMT model (see Figure 2).
Table 11. Factor loadings from the 5-factor solution (with Oblimin rotation).
| Item | Description | C13 | Factor Loadings |
|---|
| Subscale Intention to Act (Cronbach’s α = 0.890) |
|---|
| | | 1 | 2 | 3 | 4 | 5 |
|---|
| INTEN4 | I am certain I will keep using security measures | .834 | .929 | | | | |
| INTEN1 | I'm going to keep using security measures | .702 | .790 | | | | |
| INTEN3 | I would use security measures wherever possible | .621 | .776 | | | | |
| INTEN2 | It is possible that I will use security measures | .574 | .673 | | | | |
| INTEN5 | I'm not likely to keep using security measures *14
| .488 | .670 | | | | |
| Subscale Self-Efficacy (Cronbach’s α = 0.888)15
|
|---|
| SELF2 | I have the expertise to add measures to stop people from getting my confidential information | .819 | | .886 | | | |
| SELF1 | I have the necessary skills to protect myself from hackers | .784 | | .874 | | | |
| Subscale
Benefit
(Cronbach’s α = 0.742)
|
|---|
| BENE2 | Efforts to ensure the safety of my confidential information are really effective | .626 | | | .707 | | |
| BENE1 | Enabling the security measures is an effective way to deter hacker attacks | .538 | | | .649 | | |
| BENE3 | Enabling security measures would stop hackers getting access to sensitive information | .371 | | | .560 | | |
| Subscale
Severity
(Cronbach’s α = 0.832)
|
|---|
| SEV2 | I could fall victim to a malicious attack if I don't take appropriate security measures | .808 | | | | .896 | |
| SEV1 | I know I could be vulnerable to security breaches if I don't take care | .583 | | | | .798 | |
| SEV4 | My data and computer or phone may be compromised if I don't pay attention to security | .558 | | | | .651 | |
| Subscale
Sources of Information
(Cronbach’s α = 0.631)
|
|---|
| SEV3 | I don't believe that trying to protect my information will reduce illegal access to it * | .317 | | | | | .542 |
| BENE4 | Available measures to protect my information are not effective * | .341 | | | | | .536 |
| SELF3 | I don't believe it's in my control to protect my information * | .319 | | | | | .508 |
| COST1 | It would be too costly for me to adopt many security measures * | .333 | | | | | .492 |
Using all 676 response sets, a Principal Axis Factoring analysis with Oblimin rotation16 and Kaiser normalisation yielded a determinant of 0.00037, Kaiser-Meyer-Olkin of 0.892, and a significant Bartlett’s test of sphericity result (χ2 (276) = 6861.08, p<.001). This suggested the data were suitable for factor analysis. With that in mind, the analysis was repeated iteratively as follows: any items where correlations were ≤ |0.300| were removed; any extraction communalities below 0.300 and factor loadings less than |0.400| were all removed. After an initial analysis retaining factors with eigenvalues ≥ 1 and using the .40-.30-.20 rule55 and the scree plot, a 5 factor solution was generated17: Principal Axis Factoring with Oblimin rotation and Kaiser normalisation and rotation converging in 7 iterations, accounting for 68.61% of the variance. Table 11 summarises the solution; reliability of each construct ranges between 0.890 and 0.631, as measured with Cronbach’s α. The table shows the individual items, their extraction communalities, and factor loadings. Note that all five items for the Intention to Act construct (see Table 4) contribute to the model; this is not the case for the others.
Table 12 shows corresponding correlations between the factors. Correlations generally indicate reasonable separation between factors. Factors 1 (Intention to Act) and 4 (Severity) represent a possible exception. With a correlation of 0.501 suggesting the factors covary and so may effectively reflect similar constructs, this is not surprising though, since it is to be expected that as perceived Severity increases, so the intention to take action will increase. Excepting possibly Factor 4 (Severity), all factors correlate with the Factor 5 (which we have labelled: Sources of Information). This suggests that this factor is significant in the decisions making leading to the Intention to Adopt security measures.
Table 12. Factor correlations for the 5-factor solution.
| Factor | 1 | 2 | 3 | 4 | 5 |
|---|
|
1
| - | .292 | .380 |
.501
| .365 |
|
2
| | - | .197 | .075 | .436 |
|
3
| | | - | .334 | .397 |
|
4
| | | | - | .196 |
|
5
| | | | | - |
The subscale Cost is not represented in the 5-factor solution, which may be either because another party is assumed to take responsibility to implement controls or simply that it’s accepted as part and parcel of online activity (see below). Apart from Cost, therefore, the PMT model (see Section 1.2.3 is partially validated as expected: specifically, with reference to the original model (see Figure 2), private individuals do make some kind of Threat Appraisal (Factor 4, Severity) and corresponding Coping Appraisal (Factors 3, Benefit, and 2, Self-Efficacy), leading to an intention to do something to counter the threats (Factor 1, Intention to Act). Factor 5, which we have labelled Sources of Information in Table 11, does not fit the Cognitive Mediating Processes of the PMT model completely, however. In answer to RQ6, therefore, there is evidence that private individuals in the UK rely on additional Sources of Information when making decisions about implementing cybersecurity controls.
1.4.3.1 Freeform comments. There were 72 comments left including expressing thanks, pointing out issues with the survey format, and so forth. However, there was evidence that participants had given some thought independently to cybersecurity. From identifying who should be responsible:
“Companies should up their security as online has become so common now” and
“Emphasis should be on user. My workplace was hacked and my personal data taken, despite me taking personal measures to not share my info.”
Including recognising problems of visibility online:
“In my opinion the highest threat about most people getting hacked is by publicly displaying much of their information by themselves, filling all the facebook info down the phone number and secondly using an universal password, so getting hacked on something, gives the hackers accest [sic.] to many other things.”
Concerns about cost:
And about the field in general:
“I read that cyber attacks occur continuously 24/7 and that criminal elements are often involved as well as state actors who try to harm important state infrastructure. I wonder what role AI will play in protecting from cyber attacks, or worse, if it could be used to perpetrate such acts.”
Participants are aware, of course, and had been primed if not by the ranking and matching tasks, then at least by the introductory passage on cybersecurity. But they do recognise that there are multiple factors associated with maintaining cybersecurity readiness. This includes:
an awareness of all online activity affecting security of data (living in a digital world)
the cost of implementation (what digitalisation implies), and
a need for service-providers and users to cooperate and coordinate responses to cybersecurity threats (responsibility)
Their comments seem to expand on Factor 5 (Sources of Information) in the EFA model above (Table 11): participants appreciate that something must be done, that there are multiple aspects to ensuring cybersecurity readiness, that this will be costly, but do not see themselves solely responsible to implement controls.
1.4.4 The effect of context
For each of the six constructs in Table 4, the total Likert response score for a given respondent was summed across all items to give a total score for that construct. Thus, for each participant responding to the four items under Susceptibility a total was derived by summing the individual responses for each of those four items. Parametric tests were undertaken to identify potential effects of these contexts on responses to the PMT-derived assertions. Given the assumptions associated with parametric tests, we first reviewed the frequency distributions for the total values for each construct and for Threat Appraisal, Coping Appraisal and the grand total for each participant. Although Susceptibility, Severity and Intention to Act showed a negative skew by eye, all other constructs approximated a normal distribution. Much has been written about violation of the assumption of a normal distribution (see, for example, 56). Because of the sample sizes here and an assumption based on the central limit theorem that with sufficient samples the distribution of sample means will tend towards a normal distribution, we decided to proceed with parametric tests. The assumptions of equal variance were individually tested as reported below.
1.4.4.1 Priming. To test if the priming tasks affected the total Likert scores for each construct, a MANOVA was run12. First, responses from the original survey associated with matching controls and threats (labelled None) were removed, giving a revised total of (676 – 113 =) 563 responses. Box’s M (85.371, p=0.499) was not significant, indicating that there was no violation of the assumption of homogeneity of the variance-covariance matrices. Further, there was a significant difference in total Likert scores across the constructs depending on priming task: F(24,1930.40) = 1.594, Wilks’ λ = 0.934, p = 0.034, η2 = 0.017. Although significant, the effect is small accounting for around 1.7% of the variance.
1.4.4.2 Demographic category removal. When testing for any significant effects of context, and to avoid very large discrepancies in the samples within a given category, responses from Gender Identity (for Third gender… and Prefer not to say), from Age Group, (for 70 or over), and Expertise, (for I’m a novice…) were removed for the significance testing only. This left two groups for Gender Identity and Expertise, and three for Age Group.
1.4.4.2.1 Self-reported expertise
Although Box’s test was significant (M = 33.995, p=.040), differences between the total Likert scores associated with Self-Reported Expertise seemed to be significant (F(6,543) = 8.245, Wilks’ λ = 0.916, p < 0.001, η2 = 0.084). From visual inspection of plots for the means associated with self-reported expertise, all Likert totals were higher for the experts than for those reporting that they were OK with technology…. Between-Subject tests, however, revealed the differences for the constructs COST (p < .001, η2 = .029), BENE (p = .045, η2 = .007), SELF (p<.001, η2 = .069) and INTEN (p < .001, η2 = .025) to be significant. These differences, therefore, account for at least .7 % (for Benefit) but no more than 6.9% (for Self-Efficacy) of the variance in the data.
1.4.4.2.2 Age
Box’s test was not significant (M = 54.960, p=.104). The differences between the total Likert scores associated with Age Group was significant (F(12,1084) = 2.765, Wilks’ λ = 0.941, p = 0.001, η2 = 0.030). Visual inspection of the plots of the means associated with age group, for SUS, SEV, COST, and INTEN, the oldest group (50 to 69) reported the highest and the youngest (18 to 29) the lowest total Likert scores; for BENE and SELF, the oldest group reported scores lower than the middle age group. However, Between-Subject tests revealed that only SEV (p=.010, η2 = .017), COST (p=.001, η2 = .025), SELF (p=.031, η2 = .013), and INTEN (p=.004, η2 = .020) showed significant effects for age group. These differences account for between 1.3% (Self-Efficacy) and 2.5% (Cost) in the variance.
1.4.4.2.3 Gender identity
Box’s test was not significant (M = 29.526, p=.110). The differences between the total Likert scores associated with self-reported Gender Identity was significant (F(6,543) = 8.330, Wilks’ λ = 0.916, p < 0.001, η2 = 0.084). From visual inspection of plots for self-reported expertise, Likert totals for construct SUS were higher for Females than for Males; for all other constructs, the opposite was true. Between-Subject tests, however, revealed the differences for the constructs SUS (p = .010, η2 = .012), COST (p < .001, η2 = .023), SELF (p<.001, η2 = .045) and INTEN (p = .020, η2 = .010) to be significant. Gender Identity appears to account for between 1% (Intention to Act) and 4.5% (Self-Efficacy) of the variance.
1.4.4.3 Does context affect responses? From Section 1.4.4.1, and assuming priming to influence affect (i.e., an emotional response29), there is some evidence to support RQ4: context does have a small effect (here about 1.7% of variance) on cybersecurity judgements based on the constructs of the PMT. From Section 1.4.4.2 and the associated subsections, there is further evidence to support RQ4: speaker characteristics also have a small effect (though no more than would account for 6.9% of the variance) on cybersecurity judgements. This suggests that the five factors identified in Section 1.4.3 are generally robust across contexts (including demographics), with other some minor influence from such factors.
1.5 Discussion
The previous sections showed that private individuals were able to make judgements about threats and controls, certainly in terms of ranking severity or effectiveness respectively, and were able to match a suitable control to a given threat. They did not, however, see themselves responsible across the board for protecting their (health) data. Awareness is therefore not the issue, we believe, when assessing private individual role in addressing cybersecurity threats. At the same time, from the EFA and the resulting Factor 5, making decisions to act on that awareness is not solely a cost-benefit decision. From the original PMT model, the Sources of Information act as antecedents to the cost-benefit activity. As borne out by the freeform comments, private individuals are considering broader challenges such as cost, the effectiveness of controls and their self-efficacy.
Drawing a parallel with a traditional view that technology acceptance is predicted by the perceived usefulness and perceived ease-of-use of that technology (the Technology Acceptance Model and derivatives57,58), decision-making around technology adoption has to be contextualised within potential users’ understanding of background issues independent of the technology itself. They are capable of being part of the solution for cybersecurity threats9, but that means that infrastructure operators and technology suppliers need to understand who their target audience believes responsible for control measures. Beyond that, they need to appreciate what those users believe the effectiveness of the technology to be and consider cost to the end user which seems to be part of a generalised consideration (the Sources of Information above) rather than the cost-benefit assessment for the specific domain.
1.6 Limitations and future work
The priming had only a marginal effect on attitudes, which may be the result of an ambiguous effect of priming on cybersecurity behaviours. As Sharma and her colleagues found, there was an effect when priming for risks, but they could not provoke behaviour change through positive and negative messaging29. Nevertheless, the failure here to see a highly significant effect may result from one or both of the following: first, it could be that our common cybersecurity awareness introductory message had the primary effect and not subsequent exposure to threats or controls; secondly, there were more scenarios (controls, responsibility and matching) which were intended to produce a positive effect. In future, we will revisit this aspect of our survey or any associated discussion groups. Further, using a crowdsourcing platform to distribute the anonymous survey to a balanced cohort has advantages47,48. For this study, there are two potential caveats. First, by definition, and regardless of the expertise question in the survey, as members of the platform participant pool, they can be expected to be more aware of the digital environment than the population as a whole. Secondly, the NHS is the UK is generally trusted regarding healthcare, especially during and following the SARS-CoV-2 pandemic18. This may have influenced perceptions, inflating the reliance on the NHS to hold healthcare data securely. In future, we would look to using a different context than healthcare data sharing to establish whether current responses persist for different data types and different data controllers. Additionally, the selection of threats and possibly controls was dictated at the time by the research and innovation project. Some of the threats, therefore, may have seemed only remotely relevant to the participants, especially situated in a ‘hospital’ or regarding infrastructure. This could be addressed either by looking for common threats identified in the press or by generating the list of threats based on focus-group discussion with members of the public. Finally, we did not separately ask participants who might be responsible to handle a specific threat. For instance, T3 and T7 could be construed as something the individual user should be aware of and take measures to address. This could easily be added to a future iteration and thereby provide greater understand of participants’ (private individuals’) awareness of digital security threats.
1.7 Conclusion
Using healthcare data as an umbrella context, responses to an online anonymous survey of a total of 801 UK private individuals demonstrated that they were able to evaluate the severity of threats to the security of their data and the effectiveness of potential controls to mitigate the risks associated with those threats (RQ1, RQ2). Participant demographics had marginal effects on their responses to a standard (PMT-based) set of assertions (RQ3); similarly, any emotional response to the priming tasks was also marginal (RQ4). However, they did not see themselves responsible for implementing controls in all environments (RQ5): they expected device manufacturers or software developers to handle automatic updates to keep their data safe, and only accepted responsibility for their own device. Overwhelmingly, though, they saw the data controller processing their data (the NHS in the UK or associated hospital) to be responsible for most aspects of cybersecurity. Finally, an exploratory factor analysis revealed that decisions to protect their data may not only rely on rational judgement (Cognitive Mediating Processes from PMT). Instead, there was some suggestion borne out by freeform comments that broader concerns such as the complexity of online activity, the cost associated with being secure, and the need for service provider and service user to collaborate on cybersecurity (RQ6). This research study has therefore contributed to our understanding of how end users within a socio-technical context respond to cybersecurity. To succeed, approaches like Zimmermann and Renaud’s Cybersecurity, Differently, whereby private individuals become “part of the solution”9, need to include the latter’s perceptions of the digital environment in general and the co-creation of a safe environment.
Ethics and consent
This work was approved by the Faculty of Engineering and Physical Sciences (FEPS) Research Ethics Committee at the University of Southampton; ERGO/FEPS/67628 for the base study, and ERGO/FEPS/69107 for the follow-on study. In accordance with the ethics review and approval, participants were asked to confirm via tick box that they were 18 years of age or over and that they agreed to take part