Introduction
Bovine respiratory disease (BRD) is the leading cause of morbidity and a major cause of mortality in cattle, especially in systems that purchase and commingle calves from different origins, such as the feedlot, veal calf, and dairy beef industries (Duff & Galyean, 2007; Renaud & Pardon, 2022; USDA, 2011). BRD is a multifactorial syndrome that involves interactions between host susceptibility, stressors (weaning, commingling, transport, and weather), and a suite of viral and bacterial pathogens. Because BRD affects young stock at critical growth stages and feedlot cattle during high-value finishing periods, it carries substantial and recurrent economic costs that extend well beyond treatment (Blakebrough-Hall et al., 2020; Wang et al., 2018). The global economic losses associated with BRD have not been well characterized but have been estimated to exceed $3 billion annually (Watts & Sweeney, 2010).
Prevalence estimates vary widely according to the production system, region, season, and risk status of the cattle (Duff & Galyean, 2007; USDA, 2011). In US feedlots, BRD is the most frequently treated clinical disease and a leading cause of morbidity and mortality, making it a dominant health issue in this sector (USDA NAHMS Feedlot, 2011). Reported rates vary widely by risk class, season, and management; high-risk, newly received cattle can experience markedly higher BRD burdens than lower-risk placements (Duff & Galyean, 2007). In dairy systems, the incidence of preweaning BRD in heifer calves can fall between 4% and 25%, with respiratory disease responsible for a notable fraction of preweaning deaths and for much of the antimicrobial use in young stock (Donlon et al., 2023; Urie et al., 2018; USDA, 2011; Windeyer et al., 2014). In the veal calf system, BRD is the most frequent cause of morbidity and mortality (Pardon et al., 2012; Pardon et al., 2013).
Given the prevalence described, BRD shapes priorities in welfare, antimicrobial stewardship, and sustainability. Respiratory outbreaks drive a large share of antimicrobial use in cattle, and chronic cases are associated with poor welfare outcomes (USDA, 2017). Although antimicrobial therapy is an effective method for managing BRD, its use can drive the development of antimicrobial resistance (AMR) (Bell et al., 2014). AMR is a serious global health threat, with significant economic consequences due to treatment failure and increased morbidity and mortality in humans (Cassini et al., 2019). Owing to the occurrence of resistant bacteria in animals and the zoonotic risk associated with animal-to-human transmission, antimicrobial stewardship in livestock is warranted to minimize this risk. Because antimicrobials are widely used in livestock and can select for resistant bacteria that can be transmitted to humans and contribute to this burden (Morel, 2019), prudent antimicrobial use in the veterinary sector is essential to minimize zoonotic risk and preserve the effectiveness of critically important antimicrobials (EMA, 2025; WHO, 2024). As BRD is one of the leading reasons for antimicrobial usage in cattle production (Guardabassi et al., 2018), establishing evidence-based guidelines for antimicrobial therapy in BRD is crucial for mitigating the risk of AMR while maintaining animal health and welfare. Achieving this requires a thorough evaluation of the clinical effectiveness of the antimicrobials commonly used to treat BRD.
The primary aim of this systematic review and meta-analysis was to assess the clinical effectiveness of commonly used classes of antimicrobials for the treatment of BRD. The results will inform the BRD Antimicrobial Use Guidelines of the European Network for Optimization of Antimicrobial Veterinary Therapy (ENOVAT) and European Society of Clinical Microbiology and Infectious Diseases (ESCMID) Study Group for Veterinary Microbiology (ESGVM). The ENOVAT guidelines encourage policymakers to use the results of this study to develop regional or national antimicrobial treatment guidelines for BRD.
This systematic review was prespecified to estimate comparative effects at the antimicrobial class level from direct, head-to-head randomized trials. It does not issue recommendations or place value judgements on the results; those decisions are made in the companion ENOVAT guideline using a structured Evidence-to-Decision (EtD) framework. Within-class (substance-level) comparisons and implementation trade-offs (feasibility, stewardship, values and preferences) are beyond the scope of this review and are addressed in the guideline.
Materials and methods
Reporting standards and protocol
This systematic review adhered to the PRISMA guidelines (Page et al., 2021). The PRISMA checklist and protocol deviations are shown in Supplementary File 1. The protocol for this systematic review and meta-analysis was registered with Syreaf. org in July 2022 (https://syreaf.org/wp-content/uploads/2022/07/BRD-PRISMA-protocol_version-for-upload_2022-07.pdf
).
Table 1. PICO questions including sub-groups, intervention and comparator, outcomes and critical outcomes.
The European Medicine Agency (EMA) antimicrobial categories A-D are shown in brackets.
| PICO |
Population |
Intervention
(EMA category) |
Comparator
(EMA category) | Outcomes |
Critical outcomes |
|---|
| 1 | Cattle with undifferentiated pneumonia | Penicillins (D) | Tetracyclines (D) | Therapeutic failure (resolution of clinical disease <7 days).
Relapse (need for re-treatment)
Mortality
Adverse effects Weight gain. | Therapeutic failure (resolution of clinical disease <7 days).
Relapse (need for re-treatment)
Mortality
Adverse effects |
| 2 | Cattle with undifferentiated pneumonia | Penicillins (D) | Macrolides (C) |
| 3 | Cattle with undifferentiated pneumonia | Penicillins (D) | Phenicols (C) |
| 4 | Cattle with undifferentiated pneumonia | Penicillins (D) | Fluoroquinolones (B) |
| 5. | Cattle with undifferentiated pneumonia | Tetracyclines (D) | Macrolides (C) |
| 6 | Cattle with undifferentiated pneumonia | Tetracyclines (D) | Phenicols(C) |
| 7 | Cattle with undifferentiated pneumonia | Tetracyclines (D) | Fluoroquinolones (B) |
| 8 | Cattle with undifferentiated pneumonia | Phenicols (C) | Macrolides (C) |
| 9 | Cattle with undifferentiated pneumonia | Macrolides (C) | Fluoroquinolones (B) |
| 10 | Cattle with undifferentiated pneumonia | Phenicols (C) | Fluoroquinolones (B) |
Guideline and panel organization
The guideline group was chaired by LG. KS, LPC, and LRJ formed the methodological oversight committee, which was responsible for the harmonization of methodological approaches across the ENOVAT consortium. The panel consisted of seven bovine experts and clinicians (AW, SB, CF, MS, BP, RY, and LMÅ), one microbiologist (LG), and one pharmacologist (PLT). The methodological task force were non-voting members of the group (KS, MC, LRJ, and LPC), except for one member that was also part of the panel (RY).
Population, intervention, comparator and outcome (PICO) generation
The clinicians of the panel drafted ten PICO questions (
Table 1) that compared the efficacy of different antimicrobial classes. The included antimicrobials are EMA categories D, C, and B antimicrobials that European bovine practitioners may choose between in their clinical decision-making process. In Scandinavia, the choice of treatment is generally between penicillin (PNC) and tetracyclines (TET). In other parts of Europe, such as Belgium, clinicians often choose between florfenicol (FLO) and macrolides (MAC). Because Mycoplasma bovis (syn. Mycoplasmopsis bovis) is intrinsically resistant to certain antimicrobial classes, trials assessing the antimicrobial efficacy of BRD associated with this organism were analyzed as a subgroup. Hereafter, we use Mycoplasma bovis (M. bovis). Feedlot animals were also analyzed as a subgroup because their status could potentially act as an effect modifier in the pooled results. Risk in feedlots varies by cohort; newly received, commingled, lightweight calves are often higher-risk for BRD, whereas many yearling placements are lower-risk. Because some feedlot cohorts may also have had prior BRD treatment, we explored feedlot versus non-feedlot systems as a potential effect modifier in an exploratory subgroup analysis.
The review question and analyses were defined a priori at the antimicrobial class level to inform guideline decisions typically made at the class level (aligned with WHO/EMA–AMEG stewardship frameworks). This review summarizes effects and certainty; it does not make recommendations. Substance-level (within-class) comparisons were out of scope and were not sought or synthesized. The companion ENOVAT guideline integrates these effect estimates with feasibility, acceptability, values/preferences, and stewardship considerations in EtD frameworks to produce recommendations.
Outcome definitions
- Preferred critical outcome: Short-term therapeutic failure, defined a priori as lack of clinical resolution within 7 days after initial antimicrobial treatment.
- Surrogate used for pooling: Need for retreatment, defined as the first administration of an additional antimicrobial for the same BRD episode within the study’s observation window. In most studies this occurs within the first few days (< 7 days) but is not always explicitely stated and because the observation window varied across trials, we used retreatment as a surrogate for short-term therapeutic failure and rated down for indirectness.
- Relapse: Recurrence of BRD clinical signs requiring treatment after documented initial clinical resolution. This generally occurs after another antimicrobial has been administered. Relapse was therefore not pooled.
Clinical thresholds and stakeholder involvement
Clinical thresholds are used to assess the magnitude of potential health benefits and harms in order to develop sensible recommendations. The Grading of Recommendations Assessment, Development and Evaluation (GRADE) approach categorizes these effect sizes as large, moderate, small, or trivial effects with explicit thresholds that are of clinical importance to stakeholders. These thresholds are also used to judge the precision of an effect (Zeng et al., 2022). The clinicians of the panel drafted clinical threshold surveys. Stakeholders, including farmers (n = 23) and field clinicians (n = 28) from Norway, Austria, Belgium, Canada, and the US, were consulted in the prioritization of outcomes and development of clinically relevant thresholds using semi-structured interviews and surveys. Questions posed in the veterinarian and farmer surveys and results can be found in Supplementary File 2. Surveys were completed via telephone. Clinicians from each country were responsible for contacting the surveyed stakeholders and recording their opinions on acceptable treatment failure and mortality rates for animals with BRD. The median values of acceptable and unacceptable therapeutic failure and mortality by stakeholders were used to establish small and large clinical thresholds. Values between small and large were used to establish a moderate effect. The clinical thresholds in
Table 2 were prespecified for therapeutic failure. When re-treatment was used as the surrogate for therapeutic failure, these thresholds were applied to the absolute effects.
Table 2. Clinical thresholds.
The number of acceptable treatment failures or mortality per 1000 animals. The thresholds were used in the assessment of the imprecision and inconsistency domain to determine a clinically relevant effect size.
| Outcome | Trivial effect | Small effect | Moderate effect |
Large effect |
|---|
| Therapeutic failure | <200 animals | 200–250 animals | 250–300 animals | >300 animals |
| Mortality | <35 animals | 35–50 animals | 50–75 animals | >75 animals |
Search strategy and eligibility criteria
The search was performed according to the protocol on the July 5, 2022, and was updated on the June 1, 2025. Librarians with expertise in search development and information retrieval were consulted for the design of the search strategy. Peer reviewed controlled trials of cattle with natural infections, and the clinical signs of BRD were eligible for inclusion. Cattle of all ages and production systems, irrespective of bacterial etiology, were included, as well as trials with unknown bacterial agents. Other co-treatments, including metaphylaxis prior to trial enrolment, were accepted if both the intervention and comparator groups received the treatment. Trials that solely evaluated the effect of metaphylaxis, articles written in languages other than English, and conference proceedings were excluded. Grey literature was not searched, but the reference lists of all included studies and a previous systematic review (O’Connor et al., 2016) were searched for relevant studies.
Study selection and data collection
Three reviewers (MC, RY, and KS) independently screened titles, abstracts, and full texts in duplicate using an online tool (www.rayyan.ai) for systematic reviews. Covidence (www.covidence.org) was used in the updated search for 2025. Calibration exercises were conducted for every step of the study and the data collection processes. This was done to fine-tune the process and increase standardization across reviewers. Data extraction was performed independently in duplicate (KS, RY, MC) and included information on the study population and baseline characteristics (age, production system), assessment methodology, microbiological samples (methods, isolated bacteria, presence of Mycoplasma, in vitro antimicrobial resistance), intervention and comparator (antimicrobial, dosage, frequency, and duration). Potential conflicts of interest and funding were extracted into a data management tool (Excel, Microsoft). Disagreements between reviewers were resolved through discussion.
Data synthesis and certainty (quality) assessment
A direct pairwise meta-analysis was performed using a random-effects model to estimate the pooled effect risk ratio across studies. Cochrane Review Manager software edition 7.12.0 (revman.cochrane.org) was used to generate the meta-analyses. Descriptive information was extracted for the data that could not be pooled. The GRADE methodology was employed to evaluate the certainty of the evidence and was assessed by KS and LRJ (Guyatt et al., 2025). The panel and methodology task forces were involved in the discussion and final decisions regarding certainty assessment. Inconsistency among the included studies was primarily evaluated by visual inspection to identify outliers in relation to the chosen thresholds, and not based on I2 statistics, which is in line with the updated GRADE guidelines (Guyatt et al., 2023). Imprecision was assessed using confidence intervals (CI), and the effect estimate was considered precise if the 95% CI did not cross clinical thresholds. (Zeng et al., 2022). The GRADEpro software (www.gradepro.org) was used to produce summary of findings (SoF) tables and risk difference calculation for the anticipated absolute effect. There was no risk of bias tool developed specifically for cattle, but the modified Cochrane risk-of-bias tool (RoB 2.0) for randomized trials in swine (Moura et al., 2019) was used, as it was also determined to be relevant to cattle. The risk of bias assessment was performed independently by two reviewers (KS and LRJ) in duplicate. Conflicts were resolved through discussions. The certainty of evidence definitions and descriptions of the five domains used to judge the certainty of evidence are presented in
Table 3.
Table 3. Certainty definitions and short descriptions of the five domains used to grade the evidence using the Grading of Recommendations Assessment, Development and Evaluation (GRADE).
aCited from Guyatt et al. (2025); bAdapted from Guyatt et al. (2025); cCI, confidence interval.
| Certaintya | |
| Very low | The true effect is probably markedly different from the estimated effect |
| Low | The true effect might be markedly different from the estimated effect |
| Moderate | The authors believe that the true effect is probably close to the estimated effect |
| High | The authors have a lot of confidence that the true effect is similar to the estimated effect |
| Domainsb | |
| Risk of bias | Bias occurs when the results of a study do not represent the truth because of inherent limitations in design or conduct of a study. The body of evidence is rated at the outcome level rather than the study level. |
| Inconsistency | When several studies show consistent effects the certainty of evidence is higher. Similarity of point estimates and the overlap of CI are evaluated in the rating process. |
| Indirectness | Evidence is most certain when studies directly compare the interventions of interest in the population of interest, and report the outcome(s) critical for decision-making. Certainty can be rated down if the patients studied are different from those for whom the recommendation applies. Indirectness can also occur when the interventions studied are different than the real outcomes. |
| Imprecisionc | This domain relies on thresholds and CI of absolute effects as a primary criterion for imprecision rating (i.e., CI approach). Certainty is downgraded when confidence intervals cross predefined clinical thresholds (trivial, small, moderate, large) that are of importance to stakeholders. If the relative effect is large the optimal information size is also considered. |
| Other considerations | Publication bias can contribute to further downgrading, but the consideration of large effects, plausible confounding, and dose response gradients can occasionally lead to upgrading of the certainty of evidence. |
Results
Included studies (PICO 1–10)
Twenty-eight randomized controlled trials met the inclusion criteria. The number of excluded reports and reasons for the exclusion of retrieved texts are reported in
Figure 1. Study characteristics such as country, production system, age, antimicrobial substance including dosage, duration of treatment, study duration, and Mycoplasma status are reported for all trials that were pooled in
Table 4. Mortality, relapse, and weight gain outcomes have been reported after the use of several different antimicrobials in most studies, and causation could not be reliably established. These outcomes are, therefore, not pooled but are reported in Supplementary File 3. The data extraction rationale and further details of the diagnostic assessments and funding are also reported in Supplementary File 3.
Table 4. Study characteristics for pooled studies in PICO 1–10.
aDays when pooled outcome was measured. i.m. = intramuscular, s.c. = subcutaneous, SID = once a day, EOD = every other day, PNC = penicillin, OX = oxytetracycline, FLO = florfenicol, MAC = macrolide, QUI = fluoroquinolone. bM.bovis indicates that Mycoplasma bovis was detected in some animals otherwise only Mycoplasma spp. were reported.
|
PICO |
First author (year) |
Country |
Production system |
Age |
Intervention |
Comparator |
Duration of treatment |
Study duration
a |
Mycoplasma status
b |
|---|
| 1 | Bateman et al. (1990) | Canada | Feedlot | 4–7 months | Penicillin (45.000 IU/kg, s.c.,SID) | Oxytetracycline (10 mg/kg, i.m., SID) | 4 days (if responding to treatment, if no response on day 3 antimicrobial was changed to second line) | 3 | Unknown. No sampling |
| 1 | Mechor et al. (1988) | Canada | Feedlot | Recently weaned (250–320 kg) | Penicillin (65.000 IU, i.m. SID) | Oxytetracycline (20 mg/kg, i.m., SID) | 3–4 days. If temperature was abnormal on day 4 treatment was changed to second line. | 60 | Unknown. Samples not tested for Mycoplasma |
| 1, 3, 6 | Welling et al. (2020) | Sweden | Slaughter | <6 months | Penicillin (40 mg/kg, i.m., SID, 5 doses) | Oxytetracycline (20 mg/kg, i.m., EOD, 2 doses) AND Florfenicol(20 mg/kg, i.m., EOD, 2 doses) | PNC 5 days, OX and FLO two long-acting injections 48 h apart. | 60 | Unknown. No sampling. |
| 5 | Keita et al. (2007) | France | Slaughter | 8–90 days | Oxytetracycline (20 mg/kg, i.m.) | Tilmicosin (10 mg/kg, s.c.) | One injection | 10 | Yes. Cultured on 2 farms and positive seroconversion (M.bovis) on 3 farms |
| 5 | Laven & Andrews (1991) | United Kingdom | Beef | 4–8 months | Oxytetracycline (20 mg/kg, i.m.) | Tilmicosin (10 mg/kg, s.c.) | Most animals were treated with one or two injections. One animal was given a third injection. | 28 | Unknown. Samples collected but results not reported |
| 5 | Musser et al. (1996) | USA | Dairy | <3 months | Oxytetracycline (20 mg/kg, i.m.) | Tilmicosin (10 mg/kg, s.c.) | One injection | Not reported | Yes in 22/40 samples (M.bovis) |
| 8 | Catry et al. (2008) | Netherlands | Veal | 2 weeks to 3 months | Tilmicosin (12,5 mg/kg, BID, p.o.) | Florfenicol (40 mg/kg, s.c.) | Not clear, but tilmicosin seem to have been given for 5 days. | 7 | Yes (M. bovis)
|
| 6 | Schunicht et al. (2002) | Canada | Feedlot | 7–10 months | Oxytetracycline (20 mg/kg, i.m.) and 30 mg(kg, i.m) | Florfenicol (20 mg/kg, sc). | Long-acting oxytetracycline given once and florfenicol twice | Until slaughter (days not mentioned) | Unknown. No sampling. |
| 7 | Lekeux & Art (1988) | Belgium | Feedlot | 10 months | Oxytetracycline (10 mg/kg, i.m.) | Enrofloxacin (2.5 mg/kg, i.m) | 3 | 30 | Unknown. Not tested. |
| 7 | Giles et al. (1991) | France | Beef | Not reported | Oxytetracycline (10 mg/kg, i.m.) | Danofloxacin (1.25 mg/kg) | 3 | 5 | Unknown. Not tested. |
| 8 | Godinho et al. (2005) | France, Germany, Italy, Spain | Not reported | 3 weeks to 12 months | Florfenicol (40 mg/kg, s.c.) | Tulathromycin (2,5 mg/kg) | One injection | 14 | Yes |
| 8 | Nutsch et al. (2005) | USA | Stocker | Not reported | Florfenicol (40 mg/kg, s.c.) | Tulathromycin (2,5 mg/kg) | One injection | 60 | Unknown. No sampling |
| 8 | Schunicht et al. (2007) | USA | Feedlot | 5–9 months | Florfenicol (40 mg/kg, s.c.) | Tulathromycin (2,5 mg/kg) | One injection | 28 | Unknown. No sampling. |
| 8 | Skogerboe et al. (2005) | USA | Feedlot | Not reported (Weight = 315 lb–745 lb) | Florfenicol (40 mg/kg, s.c.) | Tulathromycin (2,5 mg/kg) | One injection | 28 | No |
| 8 | Hoar et al. (1998) | Canada | Feedlot | >5 months and < 200 kg | Florfenicol (20 mg/kg, i.m.) given twice with 48 h interval | Tilmicosin (10 mg/kg, s.c.) administered once | Florfenicol was administered twice and tilmicosin once. | 28 | Yes. In 94 calves (3 died). M. bovis was grown from 7 postmortem specimens.” |
| 8 | Van Donkersgoed et al. (2008) | Canada | Feedlot | Not reported (Weight 650–750 lb) | Florfenicol (40 mg/kg, s.c.) | Tulathromycin (2,5 mg/kg, s.c.) | One injection | Until slaughter | Unknown. No sampling. |
| 8 | Perrett et al. (2008) | USA | Feedlot | Not reported | Florfenicol (40 mg/kg, s.c.) | Tulathromycin (2,5 mg/kg, s.c.) | One injection | Until slaughter | Unknown. No sampling. |
| 8 | Jim et al. (1999) | Canada | Feedlot | 7–10 months | Florfenicol (20 mg/kg, i.m., EOD) | Tilmicosin (10 mg/kg, s.c.) | Florfenicol was administered twice and tilmicosin once. | Until slaughter | No |
| 8 | Van Donkersgoed & Hendrick (2013) | Canada | Feedlot | 6–10 months | Florfenicol (40 mg/kg, s.c.) | Gamithromycin (6 mg/kg, s.c.) | One injection | Not reported (probably until slaughter) | Unknown. No sampling. |
| 9 | Fodor et al. (2000) | Hungary | Dairy | 3 days-2.5 months | Tilmicosin (12.5 mg/kg, p.o.) BID | Enrofloxacin (1.25 mg/kg, p.o.) BID | 5 | 15 | Yes. M. Bovis
|
| 9 | Heins et al. (2014) | USA | Dairy | Pre-weaned (over 4 days) | Tulathromycin (2.5 mg/kg, s.c.) | Enrofloxacin (12.5 mg/kg, s.c.) | One injection | 10 | Yes. Detected in 36% of the submitted samples in 3 out of 4 sites. |
| 9 | Robb et al. (2007) | USA | Feedlot | 3–10 months | Tulathromycin (2.5 mg/kg, s.c.) | Enrofloxacin (12.5 mg/kg, s.c.) | One injection | 60 | No |
| 9 | Rowan et al. (2004) | France, Ireland, United Kingdom | Rearing facilities | <15 months | Tilmicosin (10 mg/kg, s.c.) | Danofloxacin (6 mg/kg, s.c.) | One injection. One more injection danofloxacin was given after 48 h if clinical signs had not resolved. Tilmicosin was only given once. | 11 | Unknown. Not tested. |
| 9 | Thomas et al. (2001) | Belgium, France, United Kingdom | Beef | Not reported | Tilmicosin (10 mg/kg, s.c.) given as a single injection | Marbofloxacin (2 mg/kg, i.v. and s.c.) SID for 4 days | Marbofloxacin is administered for 4 days and Tilmicosin for 1 day. | 28 | Yes. On 2/9 sites (M.bovis)
|
| 10 | Grandemange et al. (2012) | France, Germany, Italy | Not reported | 14 to 515 days (mean age = 7.5 months) | Florfenicol (40 mg/kg), s.c.) | Marbofloxacin (10 mg/kg), i.m.) | One injection | 21 | Yes in 9/231 samples (M.bovis) |
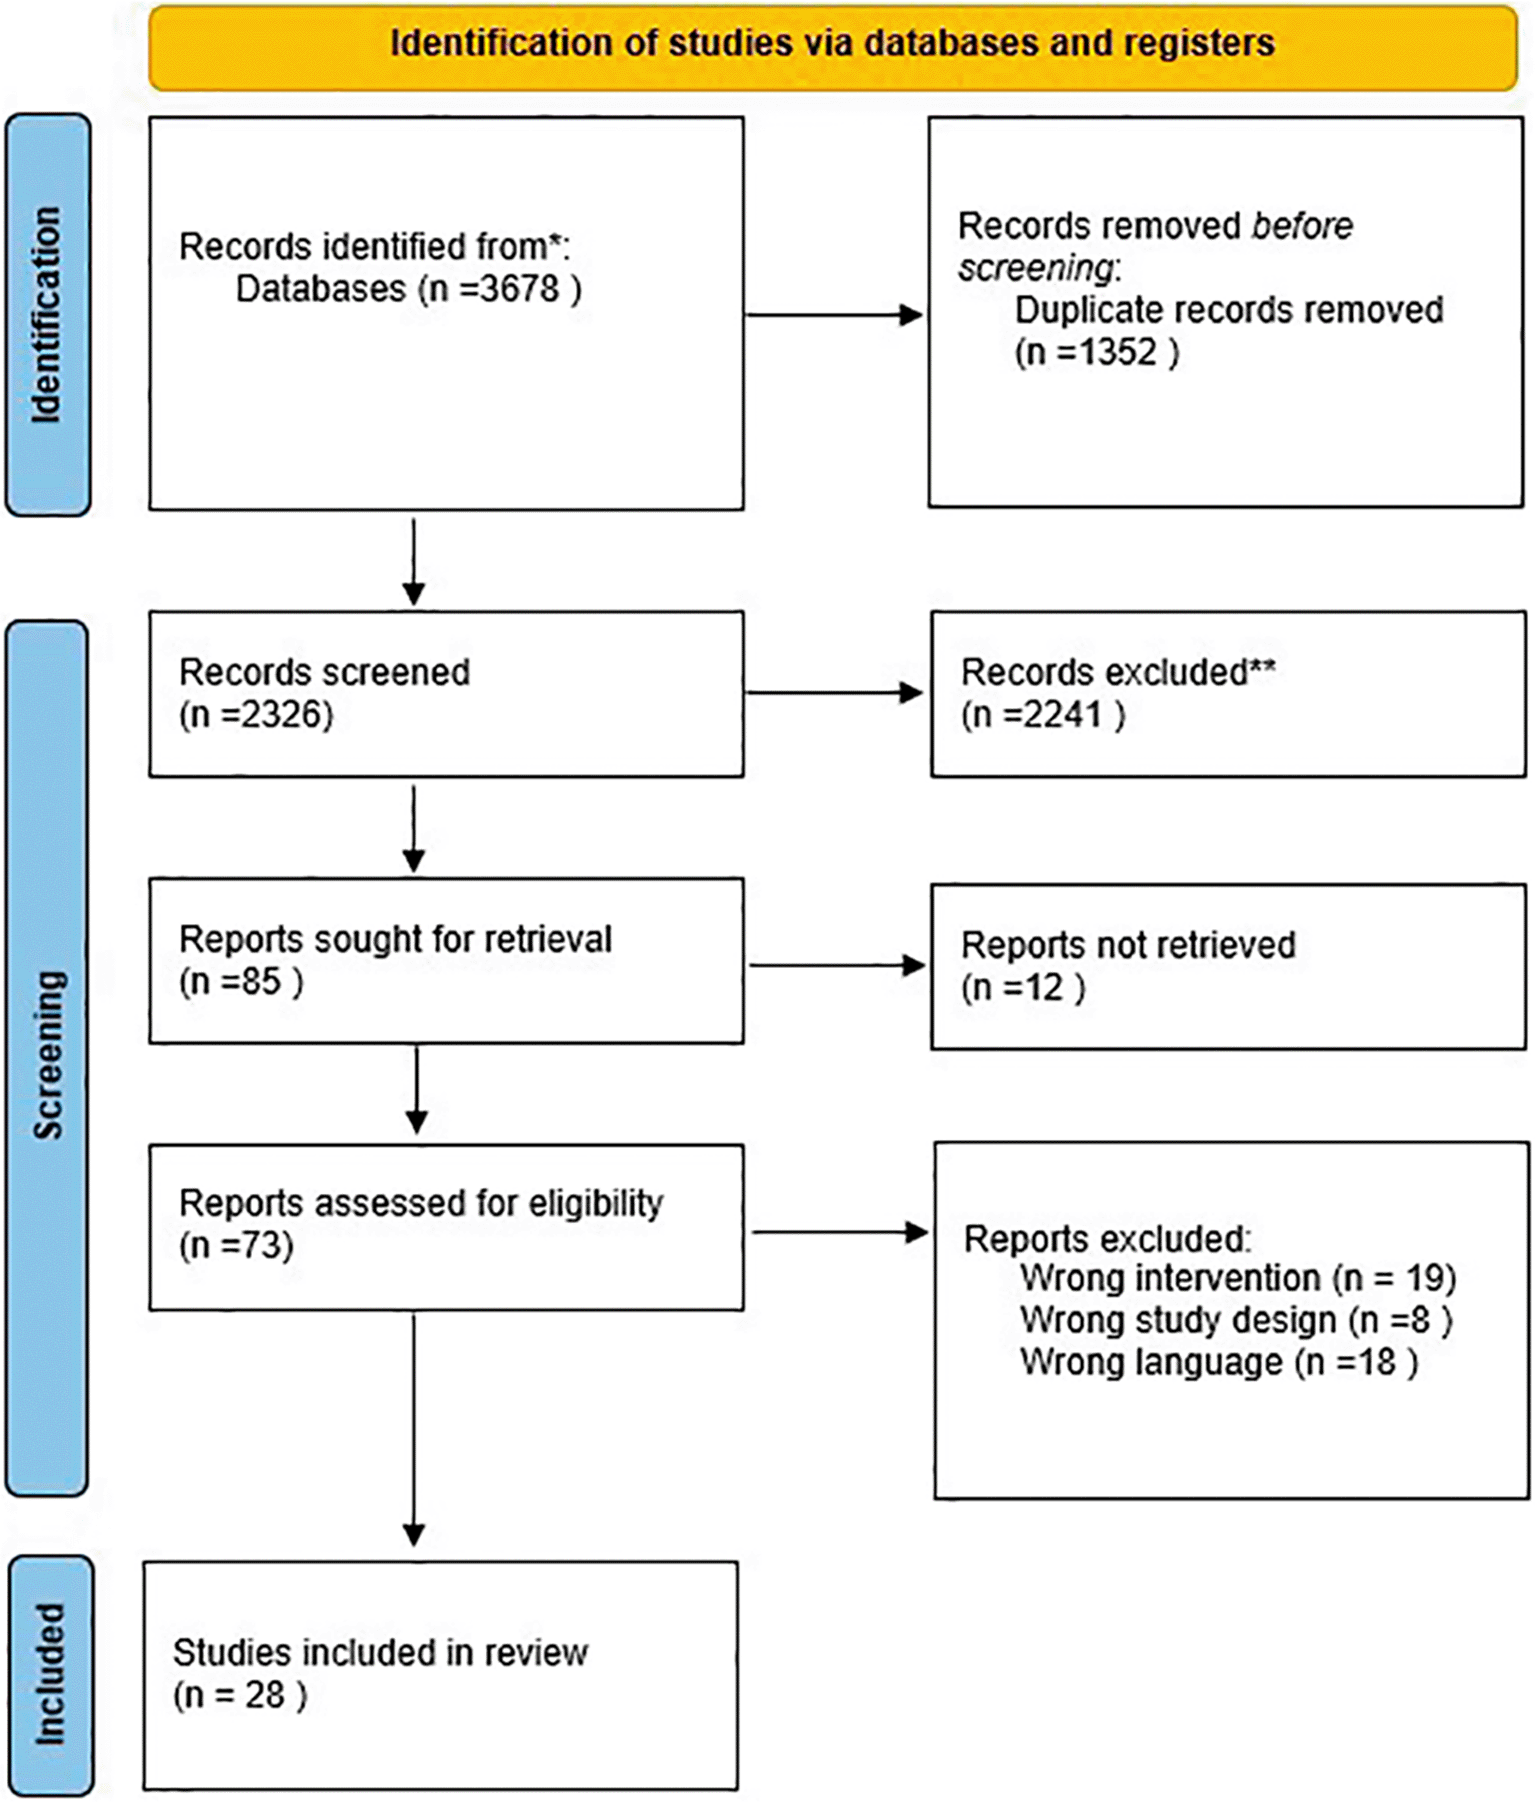
Figure 1. PRISMA flow diagram show the number of screened records, reason for exclusion and number of included studies for PICO 1–10.
PICO 1: Three trials compared penicillin and tetracycline (PNC vs. TET) in a total of 518 animals (Bateman et al., 1990; Mechor et al., 1988; Welling et al., 2020).
PICO 2: No trial compared penicillin and macrolides (PNC vs. MAC).
PICO 3: One trial compared penicillin and florfenicol (PNC vs. FLO) in 77 animals (Welling et al., 2020).
PICO 4: No trials compared penicillin and fluoroquinolones (PNC vs. QUI).
PICO 5: Three trials compared tetracycline with macrolides (TET vs. MAC). Three studies were pooled and included 171 animals (Keita et al., 2007; Laven & Andrews, 1991; Musser et al., 1996).
PICO 6: Two trials compared tetracycline and florfenicol (TET vs. FLO) and provided sufficient information to pool the results, including 873 animals (Schunicht et al., 2002; Welling et al., 2020). One trial assessed lung aeration as an outcome and was described narratively (Jourquin et al., 2022) in Supplementary file 3.
PICO 7: Two trials comparing tetracycline and fluoroquinolones (TET vs. QUI), including 178 animals (Giles et al., 1991; Lekeux & Art, 1988).
PICO 8: Ten trials compared florfenicol with macrolides (FLO vs. MAC) including 4325 animals (Catry et al., 2008; Godinho et al., 2005; Hoar
et al.,1998; Jim et al., 1999; Nutsch et al., 2005; Perrett et al., 2008; Schunicht et al., 2007; Skogerboe et al., 2005; Van Donkersgoed et al., 2008; Van Donkersgoed & Hendrick, 2013). Two trials did not report enough detail to pool the results and were instead reported narratively in Supplementary file 3 (Arslan et al., 2010; Merrill & Tonkinson, 1989).
PICO 9: Five trials compared macrolides with fluoroquinolones (MAC vs. QUI) in 1654 animals (Fodor et al., 2000; Heins et al., 2014; Robb et al., 2007; Rowan et al., 2004; Thomas et al., 2001).
PICO 10: One trial compared florfenicol with fluoroquinolones (FLO vs. QUI) in 207 animals (Grandemange et al., 2012).
Treatment efficacy
No studies have shown a clinically relevant treatment effect, defined as 200 or more treatment failures per 1000 animals, in favor of either the intervention or comparator for any of the PICOs. In some pairwise comparisons, specifically, PICO 1 (PNC vs. TET), PICO 3 (PNC vs. FLO), PICO 6 (TET vs. FLO), PICO 9 (MAC vs. QUI), and PICO 10 (FLO vs. QUI), less critical antimicrobial classes even resulted in fewer treatment failures, although the differences were not clinically significant, when compared with high-priority critically important antimicrobials for human medicine. The absolute treatment effects, statistical results, and certainty of evidence for all the PICOs are presented in
Table 5. The results of individual studies as well as pooled results, risk of bias assessments for all domains, and heterogeneity are visualized in forest plots in
Figure 2–
Figure 9. The full risk of bias assessment is reported in Supplementary File 5.
Table 5. Efficacy results for all pooled PICOs shown in absolute numbers, p-values, risk ratio with 95% confidence intervals (CI), and certainty of evidence.
|
PICO |
Absolute effect |
p-value |
Risk ratio (95% CI) |
Certainty of evidence |
|---|
| 1 | Penicillin treatment resulted in 8 fewer therapeutic failures per 1000 animals (from 65 fewer to 67 more) in comparison to tetracycline treatment | 0.83 | 0.97 (0.76–1.25) | Very low |
| 3 | Penicillin treatment resulted in 38 fewer therapeutic failures per 1000 animals (from 93 fewer to 194 more) in comparison to florfenicol treatment | 0.57 | 0.66 (0.16–2.75) | Low |
| 5 | Tetracycline treatment resulted in 132 more therapeutic failures per 1000 animals (from 38 fewer to 415 more) in comparison to macrolide treatment | 0.15 | 1.45 (0.87–2.41) | Very low |
| 6 | Tetracycline treatment resulted in 7 fewer therapeutic failures per 1000 animals (from 53 fewer to 53 more) in comparison to florfenicol treatment | 0.79 | 0.96 (0.70–1.30) | Low |
| 7 | Tetracycline treatment resulted in 179 more therapeutic failures per 1000 animals (from 60 more to 343 more) in comparison to fluoroquinolone treatment | 0.002 | 1.45 (1.15–1.84) | Very low |
| 8 | Florfenicol treatment resulted in 27 more therapeutic failures per 1000 animals (from 16 fewer to 75 more) in comparison to macrolide treatment | 0.25 | 1.10 (0.94 to 1.28) | Moderate |
| 9 | Macrolide treatment resulted in 48 fewer therapeutic failures per 1000 animals (from 106 fewer to 37 more) in comparison to fluoroquinolone treatment | 0.22 | 0.79 (0.54–1.16) | Moderate |
| 10 | Florfenicol treatment resulted in 102 fewer therapeutic failures per 1000 animals (from 165 fewer to 10 more) in comparison to fluoroquinolone treatment | 0.07 | 0.58 (0.32–1.04) | Low |
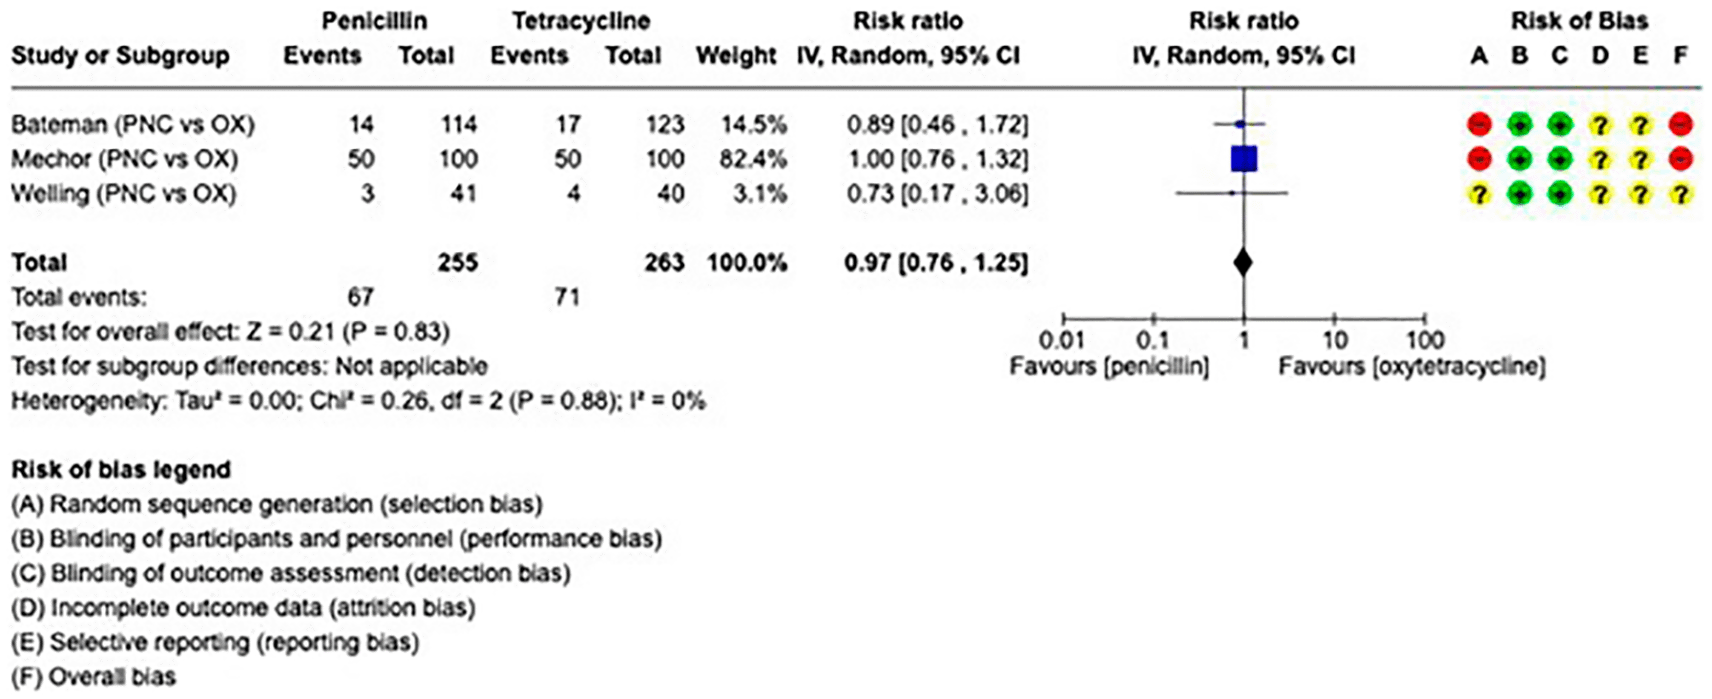
Figure 2. Forest plot for PICO 1 comparing the efficacy of penicillins vs tetracyclines.
The number of events represents the need for re-treatment. PNC = penicillin, OX = Oxytetracycline. In the risk of bias assessment a red “traffic light” mean high risk of bias, yellow means that there are some concerns and green that the risk of bias is low.
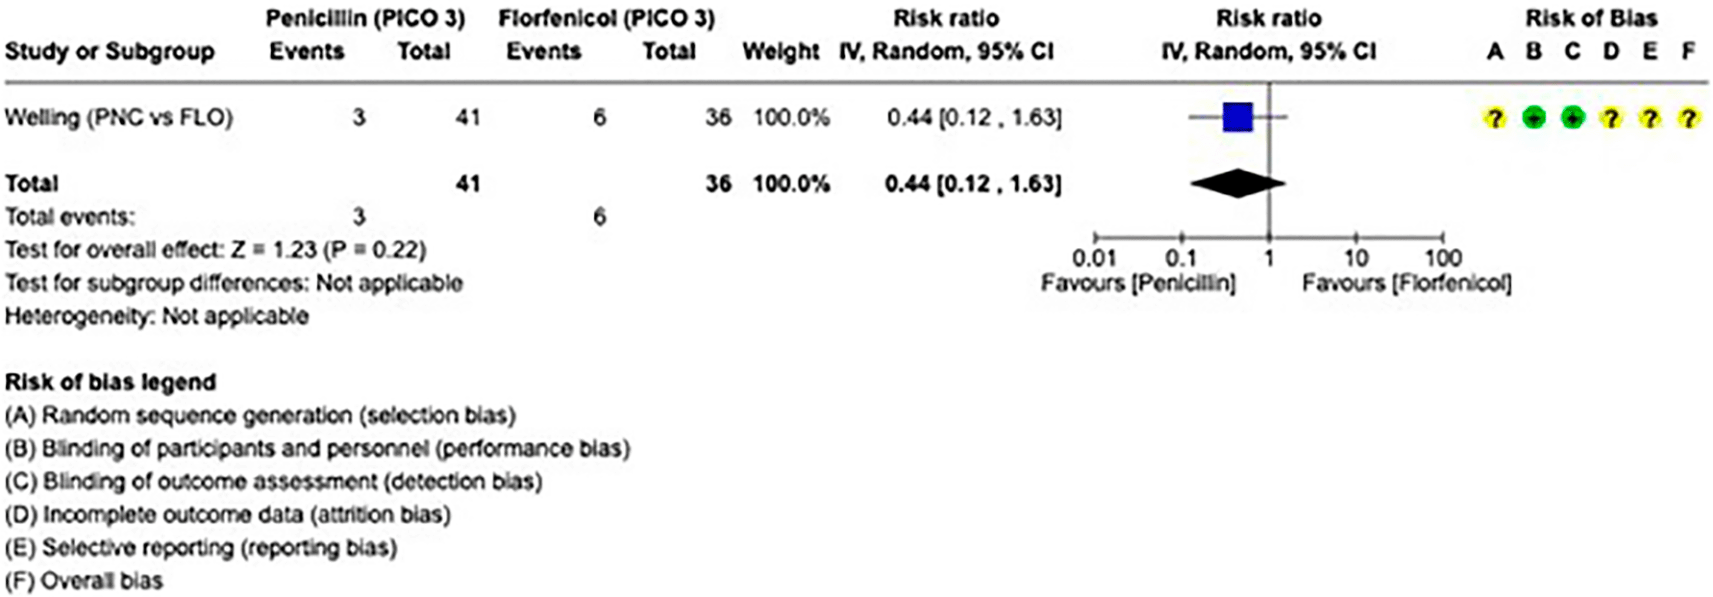
Figure 3. Forest plot for PICO 3 comparing the efficacy of penicillins vs florfenicol.
The number of events represents the need for re-treatment. PNC = penicillin, FLO = florfenicol. In the risk of bias assessment a red “traffic light” mean high risk of bias, yellow means that there are some concerns and green that the risk of bias is low.
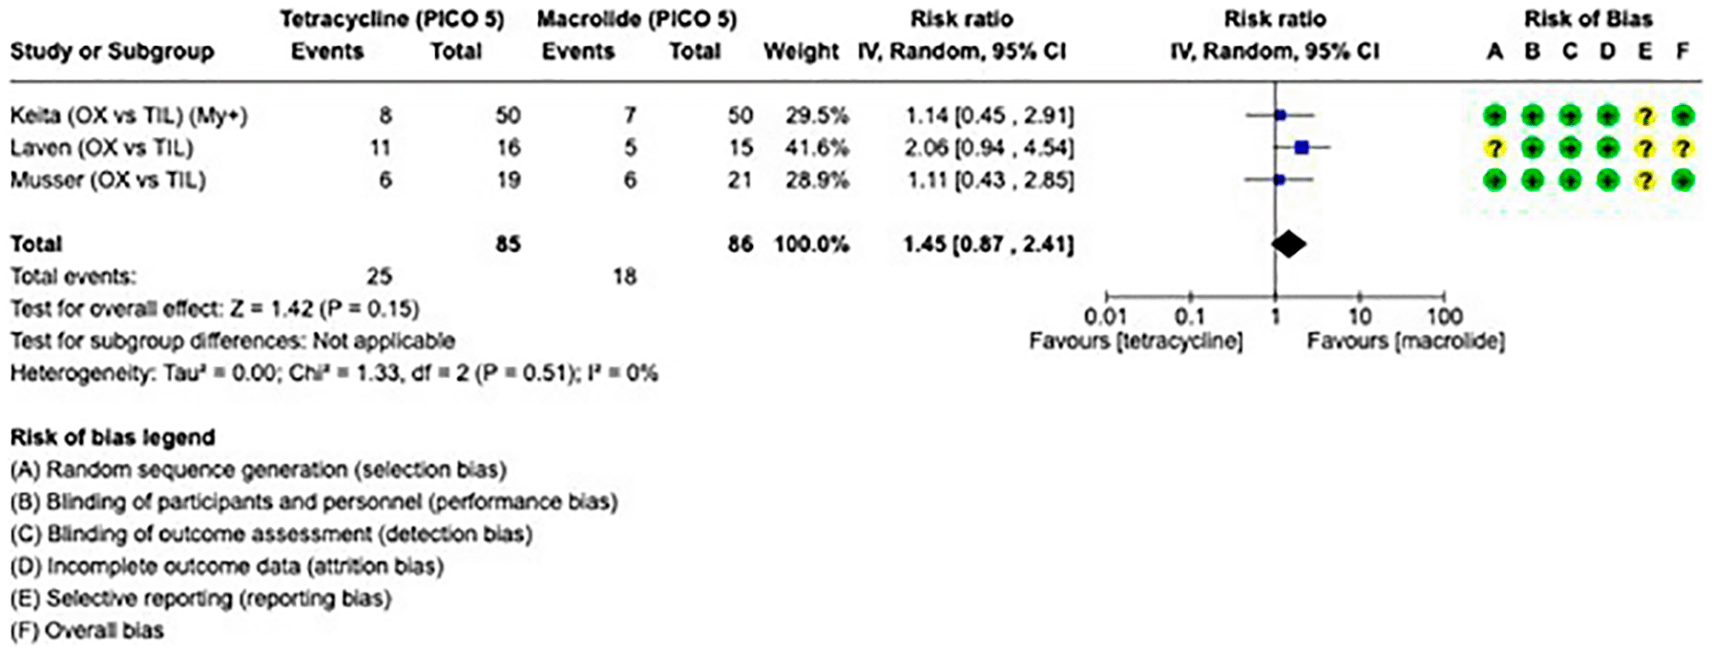
Figure 4. Forest plot for PICO 5 comparing the efficacy of tetracyclines vs macrolides.
The number of events represents the need for re-treatment. OX = oxytetracycline, TIL = tilmicosin, My+ = Mycoplasma-positive animals included. In the risk of bias assessment a red “traffic light” mean high risk of bias, yellow means that there are some concerns and green that the risk of bias is low.
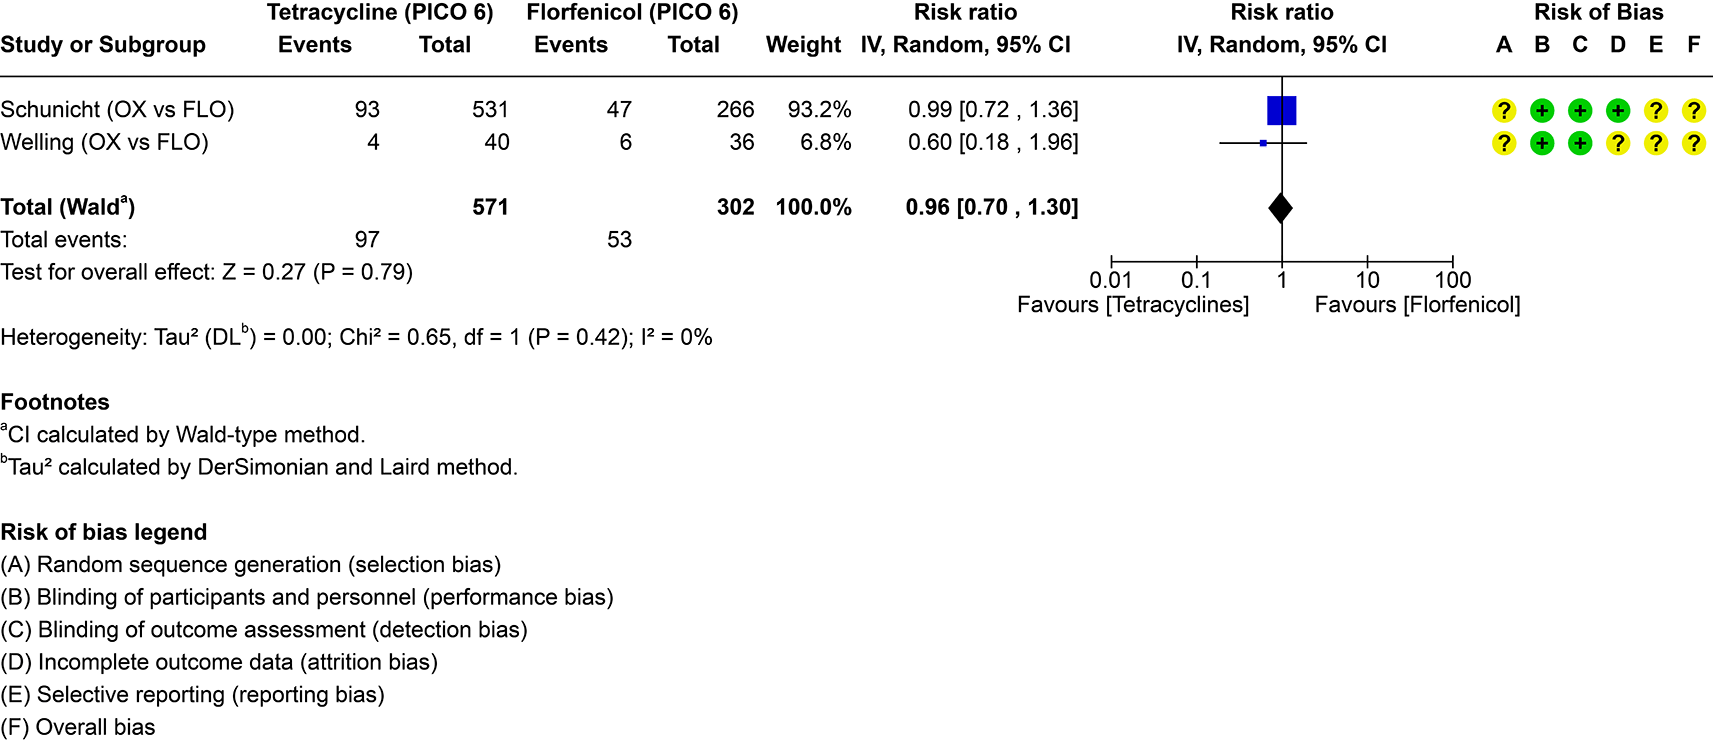
Figure 5. Forest plot for PICO 6 comparing the efficacy of tetracyclines vs florfenicol.
The number of events represents the need for re-treatment. OX = oxytetracycline, FLO = florfenicol. In the risk of bias assessment a red “traffic light” mean high risk of bias, yellow means that there are some concerns and green that the risk of bias is low.
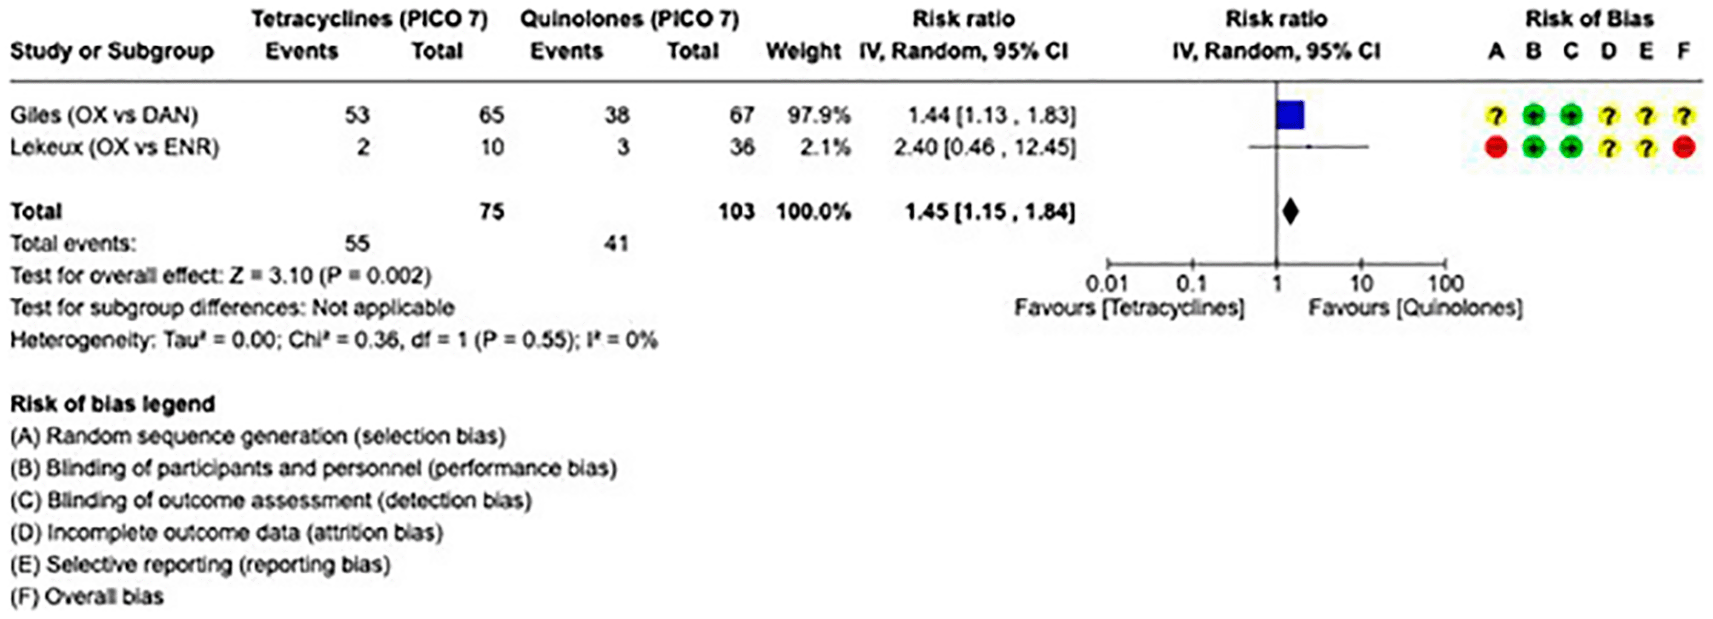
Figure 6. Forest plot for PICO 7 comparing the efficacy of tetracyclines vs quinolones.
The number of events represents the need for re-treatment. OX = oxytetracycline, DAN = danofloxacin, ENR = enrofloxacin. In the risk of bias assessment a red “traffic light” mean high risk of bias, yellow means that there are some concerns and green that the risk of bias is low.
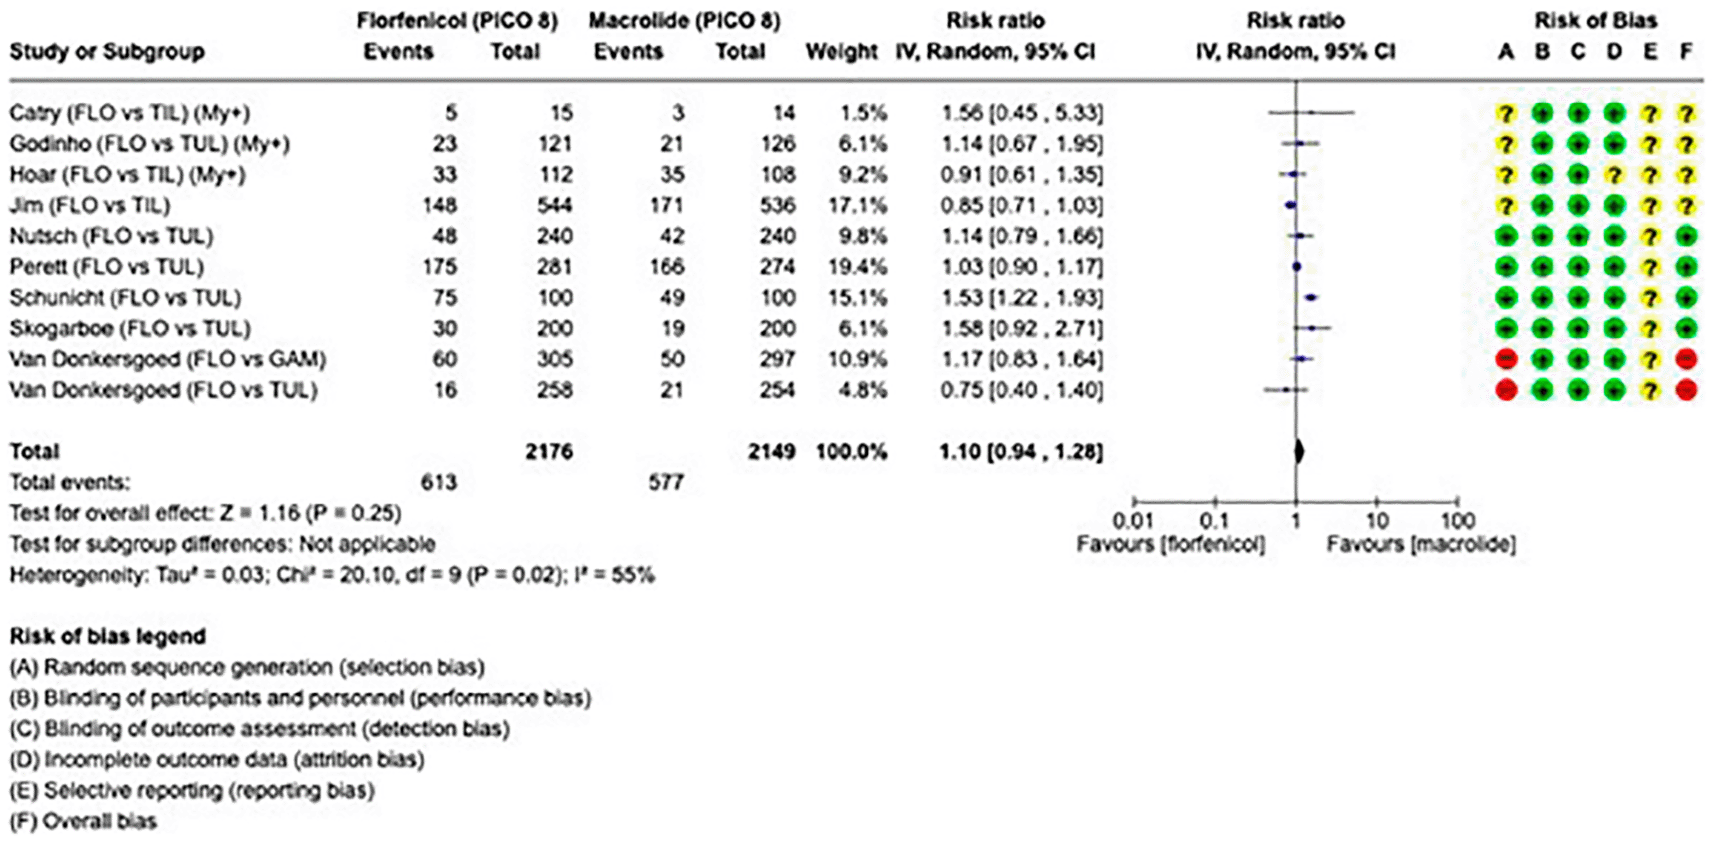
Figure 7. Forest plot for PICO 8 comparing the efficacy of florfenicol vs macrolides.
The number of events represents the need for re-treatment. FLO = florfenicol, TIL = tilmicosin, TUL = tulathromycin, GAM = Gamithromycin, My+ = Mycoplasma-positive animals included. In the risk of bias assessment a red “traffic light” mean high risk of bias, yellow means that there are some concerns and green that the risk of bias is low.
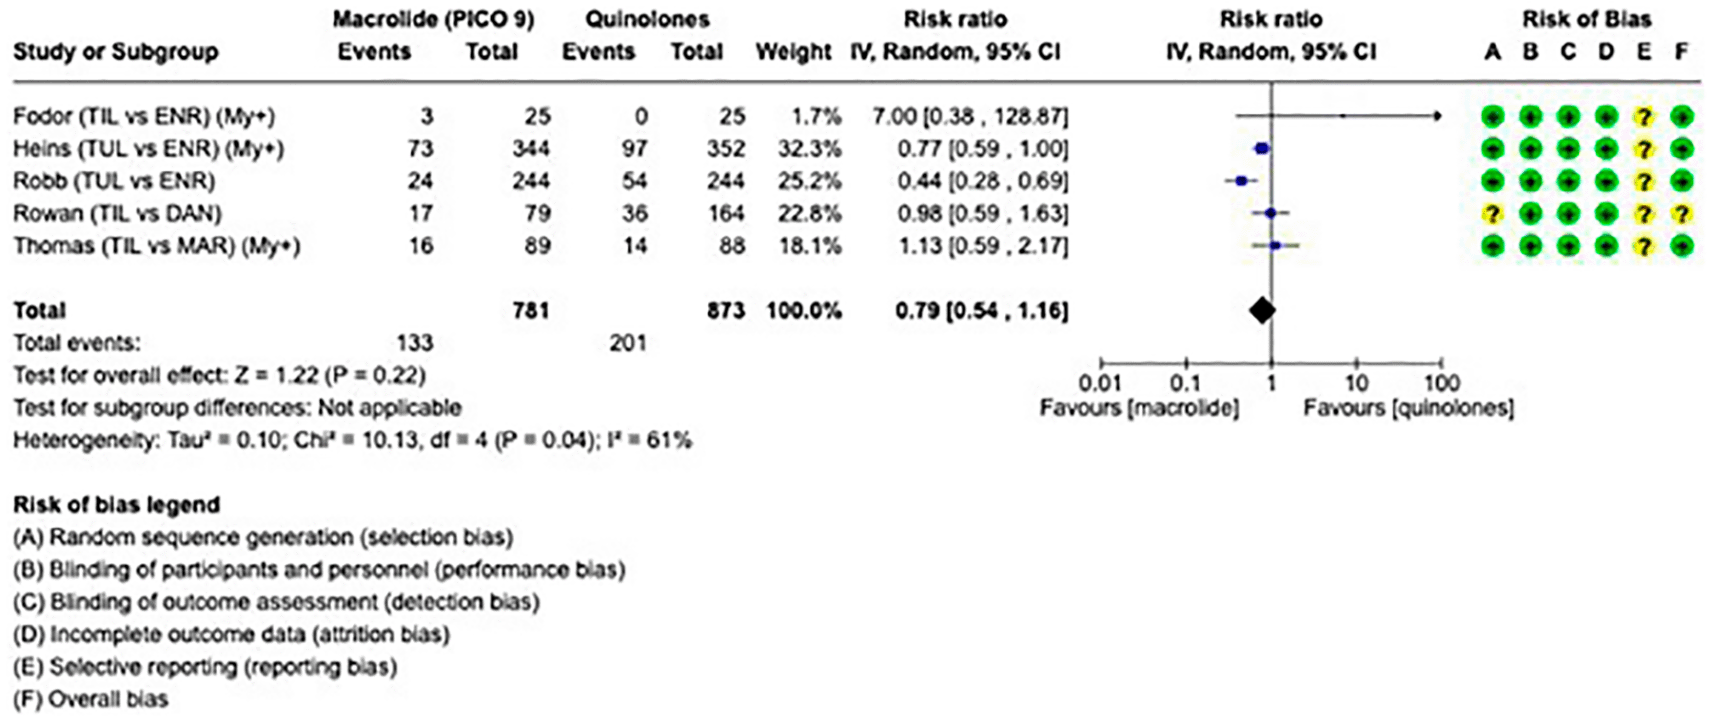
Figure 8. Forest plot for PICO 9 comparing the efficacy of macrolides vs quinolones.
The number of events represents the need for re-treatment. TIL = tilmicosin, TUL = tulathromycin, DAN = danofloxacin, ENR = enrofloxacin, MAR = marbofloxacin, My+ = Mycoplasma-positive animals included. In the risk of bias assessment a red “traffic light” mean high risk of bias, yellow means that there are some concerns and green that the risk of bias is low.
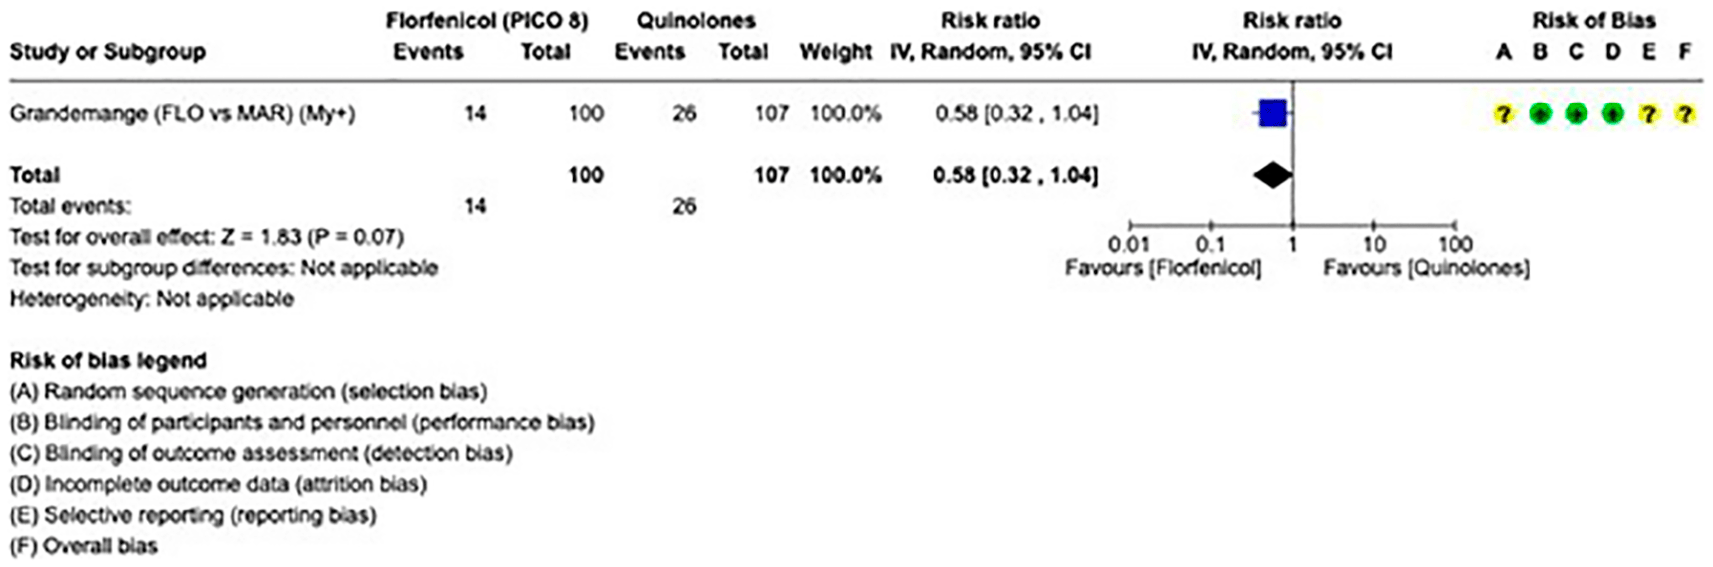
Figure 9. Forest plot for PICO 10 comparing the efficacy of florfenicol vs quinolones.
The number of events represents the need for re-treatment. FLO = florfenicol, MAR = marbofloxacin, My+ = Mycoplasma-positive animals included. In the risk of bias assessment a red “traffic light” mean high risk of bias, yellow means that there are some concerns and green that the risk of bias is low.
Certainty of evidence
Few trials reported short-term therapeutic failure (<7 days), and the need for re-treatment was used as a surrogate outcome, irrespective of the observational period (range 3–60 days). Therefore, all pairwise comparisons were downgraded one level for indirectness. As previously mentioned, other critical outcomes, such as relapse, mortality, and weight gain could not be pooled or reliably assessed, which also contributed to the decision to downgrade all PICOs for indirectness. Only PICO 5 (TET vs. MAC) and PICO 7 (TET vs. QUI) were downgraded for imprecision (three thresholds were crossed for both). In addition to the indirectness, the main reason for downgrading was the risk of bias. PICO 8 (FLO vs. MAC) and PICO 9 (MAC vs. QUI) showed moderate evidence and were downgraded only for indirectness for the reasons mentioned above. The certainty assessment for all domains is reported in
Table 6, and a summary of findings tables can be seen in Supplementary File 4.
Table 6. Certainty assessment for all domains and the overall certainty for the therapeutic failure for PICO 1–10.
|
PICO |
Risk of bias |
Indirectness |
Inconsistency |
Imprecision |
Publication bias |
Overall certainty |
|---|
| 1 | Very serious | Serious | Not serious | Not serious | Undetected | Very low |
| 3 | Serious | Serious | Not serious | Not serious | Undetected | Low |
| 5 | Serious | Serious | Not serious | Extremely serious | Undetected | Very low |
| 6 | Serious | Serious | Not serious | Not serious | Undetected | Low |
| 7 | Very serious | Serious | Not serious | Extremely serious | Undetected | Very low |
| 8 | Not serious | Serious | Not serious | Not serious | Undetected | Moderate |
| 9 | Not serious | Serious | Not serious | Not serious | Undetected | Moderate |
| 10 | Serious | Serious | Not serious | Not serious | Undetected | Low |
Mycoplasma-positive subgroup analysis
Only trials reporting Mycoplasma-positive animals (species-level M. bovis when available) were included in this analysis. This information is available for PICO 5 (TET vs. MAC), PICO 8 (FLO vs. MAC), and PICO 9 (MAC vs. QUI). In this small and imprecise subgroup, point estimates were broadly consistent with those of the main analysis. Overall, these data are insufficient to conclude similar responses. Because many included trials did not assess Mycoplasma status, some Mycoplasma-positive animals were likely present in the main analysis. The effect sizes of the sub-analysis are shown in
Table 7, and the forest plots are shown in Supplementary File 6. The Instrument for assessing the Credibility of Effect Modification Analysis (ICEMAN tool) was not used in the subanalysis because a clinically meaningful effect modification was not found.
Table 7. Efficacy results for the Mycoplasma sub-analysis shown in absolute numbers, p-values, risk ratio with 95% confidence intervals (CI).
Only trials with known Mycoplasma-positive animals were included in the analysis.
| PICO | Absolute effect |
p-value |
Risk ratio (95% CI) |
|---|
| 5 | Tetracycline treatment resulted in 20 more therapeutic failures per 1000 animals (from 77 fewer to 267 more) in comparison to macrolide treatment | 0.78 | 1.14 (0.45–2.91) |
| 8 | Florfenicol treatment resulted in 2 more therapeutic failures per 1000 animals (from 89 fewer to 150 more) in comparison to macrolide treatment | 0.93 | 1.01 (0.64–1.61) |
| 9 | Macrolide treatment resulted in 19 fewer therapeutic failures per 1000 animals (from 103 fewer to 119 more) in comparison to fluoroquinolone treatment | 0.75 | 0.92 (0.57–1.50) |
Production system sub-group analysis
Feedlot production systems were separated from all other production systems in this subanalysis. Non-feedlot production systems included dairy, veal, beef, slaughter, and stocker production systems (
Table 4). The point estimate of effects (
Table 8) did not change in the sub-analysis, indicating that no intervention proved superior to a comparator in relation to the clinical thresholds when feedlot and non-feedlot trials were pooled separately. Furthermore, the point estimates did not cross the null value, even within the trivial effect range, suggesting that feedlot animals have a similar clinical response to treatment as non-feedlot animals for the included antimicrobials. In PICO 6 (TET vs. FLO), the point estimate for feedlot animals was closer to the null (two fewer therapeutic failures per 1000 animals in favor of TET) compared to non-feedlot animals (67 fewer therapeutic failures per 1000 animals in favor of TET), suggesting a smaller difference in treatment effect between TET and FLO in feedlot animals (
Table 8). Conversely, in PICO 9 (MAC vs. QUI), the point estimate in feedlot animals was further away from the null (55 fewer therapeutic failures in 1000 animals) than in non-feedlot animals (28 fewer therapeutic failures in 1000 animals), but this was only based on one trial. Moreover, the p-value was below 0.05 (p = 0.0004) in this comparison, suggesting that results are less likely to be due to random error alone. The ICEMAN tool was not used in this sub-analysis because no clinically meaningful effect modification was found. Forest plots for both feedlot and non-feedlot trials are shown in Supplementary File 6.
Table 8. Efficacy results for the productions system sub-analysis shown in absolute numbers, p-values, risk ratio with 95% confidence intervals (CI).
Non-feedlot productions systems include dairy, slaughter, stocker, beef and veal production systems.
| PICO | Production system | Absolute effect |
p-value |
Risk ratio (95% CI) |
|---|
| 1 | Non-feedlot
| Penicillin treatment resulted in 27 fewer therapeutic failures per 1000 animals (from 83 fewer to 206 more) in comparison to tetracycline treatment | 0.67 | 0.73 (0.17–3.06) |
| 1 | Feedlot | Penicillin treatment resulted in 6 fewer therapeutic failures per 1000 animals (from 72 fewer to 81 more) in comparison to tetracycline treatment | 0.89 | 0.98 (0.76–1.27) |
| 6 | Non-feedlot
| Tetracycline treatment resulted in 67 fewer therapeutic failures per 1000 animals (from 137 fewer to 160 more) in comparison to florfenicol treatment | 0.40 | 0.60 (0.18–1.96) |
| 6 | Feedlot | Tetracycline treatment resulted in 2 fewer therapeutic failures per 1000 animals (from 49 fewer to 64 more) in comparison to florfenicol treatment | 0.96 | 0.99 (0.72–1.36) |
| 7 | Non-feedlot
| Tetracycline treatment resulted in 250 more therapeutic failures per 1000 animals (from 74 more to 471 more) in comparison to fluoroquinolone treatment | 0.003 | 1.44 (1.13–1.83) |
| 7 | Feedlot | Tetracycline treatment resulted in 117 more therapeutic failures per 1000 animals (from 45 fewer to 954 more) in comparison to fluoroquinolone treatment | 0.3 | 2.4 (0.46–12.45) |
| 8 | Non-feedlot
| Florfenicol treatment resulted in 28 more therapeutic failures per 1000 animals (from 12 fewer to 78 more) in comparison to macrolide treatment | 0.1 | 1.16 (0.93 to 1.45) |
| 8 | Feedlot | Florfenicol treatment resulted in 23 more therapeutic failures per 1000 animals (from 43 fewer to 110 more) in comparison to macrolide treatment | 0.45 | 1.08(0.85–1.38) |
| 9 | Non-feedlot
| Macrolide treatment resulted in 28 fewer therapeutic failures per 1000 animals (from 77 fewer to 40 more) in comparison to fluoroquinolone treatment | 0.38 | 0.88 (0.67–1.17) |
| 9 | Feedlot | Macrolide treatment resulted in 55 fewer therapeutic failures per 1000 animals (from 71 fewer to 30 fewer) in comparison to fluoroquinolone treatment | 0.0004 | 0.44 (0.28–0.69) |
Discussion
We did not detect clinically meaningful differences between antimicrobial classes in reducing the need for re-treatment (a surrogate for short-term therapeutic failure). Certainty of evidence ranged from very low to moderate, so these estimates should be interpreted cautiously. In GRADE terms, low certainty means the true effect might be markedly different from the estimate and very low means it is probably markedly different. Our findings therefore do not imply equivalence; rather, within the limits of the available trials and our prespecified clinical thresholds, no class demonstrated a short-term advantage.
This means that other considerations, such as the harm of AMR and its implications for public health, could weigh heavier in the evidence to decision framework and final treatment recommendations. The World Health Organization (WHO) guidelines on the use of medically important antimicrobials in food-producing animals and the European Medicines Agency’s (EMA) classification of antimicrobial use in animals will be instrumental in balancing benefits and harms (EMA, 2025; WHO, 2024).
Different levels of certainty were determined for pairwise antimicrobial comparisons. Three comparisons, PICO 1 (PNC vs. TET), PICO 5 (TET vs. MAC), and PICO 7 (TET vs. QUI), were of very low certainty which means that the true effect probably is markedly different from the estimated effect. There were, however, different reasons for downgrading the evidence, and the GRADE methodology does not distinguish between different levels in the very low spectrum. PICO 7 was downgraded for a very serious risk of bias and extremely serious imprecision, whereas PICO 1 showed no imprecision and bias was not very serious in PICO 5. PICO 7 could thus be considered to be of even lower evidence in comparison to the other PICOs, even though this is not reflected in the final certainty result.
Three comparisons were of low certainty evidence, which means that the true effect could be markedly different from the estimated effect. PICO 3 (PNC vs. FLO), PICO 6 (TET vs. FLO), and PICO 10 (FLO vs. QUI) showed precise results (within the trivial effect threshold), but were downgraded for risk of bias. Most of the trials that were downgraded for risk of bias were rated this way because no comparisons with studies with low risk of bias could be made. When there is concordance between high risk of bias studies and low risk of bias studies (meaning that all trials fall within the same threshold range), no rating down is required even if there are several high risk of bias trials included (Neumann et al., 2025). The decision to rate down one level and in some cases up to two levels, for risk of bias in the included comparisons, could be considered an overly cautious judgement. However, since the requirement to report allocation concealment was excluded from the modified RoB 2 tool that was used to assess the risk of bias in the present study, and there were still “some concerns” (visualized with yellow traffic lights) in the randomization domain, a more conservative decision was made in the end.
Two comparisons, PICO 8 (FLO vs. MAC) and PICO 9 (MAC vs. QUI), were of moderate certainty evidence which means that the true effect is probably close to the estimated effect. This provides evidence that can lead to strong recommendations. The only reason for rating down the certainty of evidence was indirectness of the outcome. The panel had lengthy discussions on the definition and selection of outcomes, and ultimately, it was not possible to pool all critical outcomes. Mortality and relapse of clinical signs were generally measured over a long observational period, during which the animals often received a second and sometimes a third treatment with antimicrobials. This makes the assessment of the efficacy of the initial antimicrobial treatment unsuitable. Most trials measured the need for retreatment, and the first retreatment event (before any other antimicrobials were used) was consequently pooled, similar to previous evidence synthesis in BRD in feedlots (O’Connor et al., 2016). The synthesized evidence, however, does not fully reflect the outcomes generated by the panel and stakeholders; in some trials, the need for re-treatment means that the animals require more than one antimicrobial injection during the first days of treatment, and in some trials, the need for re-treatment after several weeks, which is why all PICOs were downgraded one level for indirectness of outcomes. PICO 8 and PICO 9 could have otherwise been of high certainty, which emphasizes the importance of trialists choosing clinical outcomes that are relevant to end-users. The critical outcomes of short-term clinical cure, relapse of clinical signs after clinical resolution, and mortality can be used in the design of future trials. This study showed that there is discordance in the selection of outcomes, and ideally, a larger stakeholder group should be included in a core outcome set study using the standardized COS-STAD methodology (Kirkham et al., 2017).
Although trials varied in age, production system, dose/route, follow-up window, and BRD case definitions, this diversity did not translate into clinically important inconsistency in comparative effects, which suggest limited effect modification of these parameters. We judged inconsistency (heterogeneity) using the threshold approach which means that study-level and pooled relative effects were converted to absolute risk differences per 1000 animals from a common baseline risk and examined against our a priori clinical thresholds (trivial, small, moderate, large). In PICO 8 and 9, I2 values were around 50–60%, driven mainly by small trials with few events and wide confidence intervals rather than by opposing effects. When converted to absolute effects and thresholds, estimates were within the trivial-to-small ranges and we did not identify outliers suggesting inconsistency. As an example, one trial (Schunicht et al., 2007) showed a larger effect in comparison to other trials in PICO 8 and reported higher event rates in both arms (75% vs 49%), resulting in a larger RR (1.53; 95% CI 1.22–1.93) than the other trials. Excluding this study reduced I2 from 55% to 17% and the pooled effect to RR 1.01 (95% CI 0.90–1.12), corresponding to 3 more per 1000 (from 26 fewer to 31 more) and conclusions were unchanged. Subgroup analyses (feedlot vs non-feedlot; Mycoplasma-positive) showed no credible effect modification, acknowledging limited precision and few studies per comparison. We therefore did not rate down for inconsistency, but we did rate down for indirectness due to variable follow-up windows and reliance on retreatment as a surrogate for short-term failure. Disease pressure varied across trials, with some reporting high first-treatment success (e.g., ≥85–90%) and others much higher re-treatment rates; nevertheless, randomization ensures like-with-like comparisons within trials and, across trials, class-level effects still clustered within the trivial-to-small ranges against our prespecified clinical thresholds. Had baseline risk or disease severity materially modified relative effects across settings, we would expect to see clinically important inconsistency across studies (i.e., study estimates crossing into different threshold ranges); however, when judged against our prespecified clinical thresholds, study-level and pooled estimates clustered within the trivial-to-small ranges. The small number of trials in some PICOs limits power to detect effect modification, so we interpret these findings cautiously.
Sackett et al. (1996) emphasized that evidence-based medicine, and in extension evidence-based guidelines, integrate the best available evidence with the experience of the veterinary clinician (i.e., experience of the veterinary practitioner in this case) and values of the “patient” (i.e., values of cattle farmers in the present study), which is reflected in the clinical thresholds. Interestingly, the a priori clinical thresholds established by the panel and stakeholders were very similar to the overall baseline therapeutic failure across the included trials. This could indicate that the results are generalizable to field conditions, since they seem to correlate with the experiences of clinicians and farmers, which strengthens the results. It should be noted that clinical thresholds are subjective and likely to vary between countries and individuals. The choice of stakeholders to survey was also based on a convenience sample of country-representative clinicians from Europe and North America and is therefore open to bias. However, the interpretation of effect size, confidence intervals, and level of certainty is not meant to be an objective statement of right and wrong, but primarily aims to be transparent. Moreover, evidence interpretation is not supposed to be static but contextualized to the intended setting, which means that different guideline developers can arrive at different conclusions and recommendations based on the same evidence (Kahale et al., 2021; Martins et al., 2024).
A previous network meta-analysis (NMA) of antimicrobial treatment of clinical BRD included feedlot trials from North America (O’Connor et al., 2016) whereas the present trial included trials from all production systems and countries; therefore, these analyses are not directly comparable. Another difference was that antimicrobial substances were compared in the NMA instead of comparing the antimicrobial classes included here. There are many advantages of indirect NMA comparisons: they can facilitate treatment efficacy comparisons from different trials when pairwise comparisons are lacking, increase precision, and rank a network of multiple treatments. However, ranking forest plots are based on relative effects rather than absolute effects, and clinical relevance and certainty of evidence have not been assessed previously. Oxytetracycline (OX) ranked the lowest among all included substances in the NMA, and the effect was comparable to that of the negative control. In the present study, there were more OX treatment failures in pairwise comparisons with QUI (enrofloxacin and danofloxacine) and MAC (tilmicosin), but OX did not show an inferior clinical effect compared to either class. However, the certainty of evidence was classified as very low or low, mainly due to imprecision, which means that the results could have been different if larger trials were available. FLO also ranked much higher in efficacy than OX in the NMA, but in our direct comparison, there was no clinically meaningful difference between OX and FLO. However, the certainty of evidence was low, meaning that the true effect could be markedly different from the estimated effect. The clinical experience of practicing bovine clinicians in the panel supports that OX mostly results in a satisfactory clinical response in the treatment of clinical BRD, not only in Scandinavia but also in central Europe, Turkey, Canadian dairy farms, and cow-calf operations.
A limitation of this study was that only peer-reviewed studies were included, and no grey literature was included. An attempt was made to retrieve unpublished technical reports that were included in O’Connor et al. (2016), but the Internet links were broken and the pharmaceutical companies (today owned by other companies) did not respond to requests, which could explain some differences in the results, besides production systems and geographical location. We restricted inclusion to English-language, peer-reviewed RCTs. Although we screened reference lists to mitigate missed studies, language bias cannot be excluded and may limit applicability in non-English contexts; this consideration is addressed in the companion guideline’s Evidence-to-Decision framework. Another limitation of the present study is that clinical BRD was used as the relevant case selection criterion, and different clinical definitions and scoring systems were used in the studies, which could have introduced some bias. In addition, in recent years, the use of ultrasonography to measure lung consolidation has indicated that this could be a more reliable method to identify animals with a respiratory tract infection in need of antimicrobial therapy (Buczinski et al., 2025). Studies have shown that the prevalence of subclinical pneumonia can be higher than that of clinical BRD (Jourquin et al., 2023). Moreover, calves with clinical signs of BRD have higher odds of being classified as having severe pneumonia with lung consolidation ≥3 cm in depth and lower odds of being cured (Jourquin et al., 2025). Calves detected in the subclinical phase, and hence with mild or moderate pneumonia, have better odds for cure with shorter therapy lengths (Jourquin et al., 2025).
For decades, practitioners and researchers have assumed that BRD treatment efficacy increased with every novel antimicrobial formulation, based on systematic comparisons with the previous molecules marketed, and often based on non-peer-reviewed or published RCTs. The present meta-analysis suggests that differences in therapeutic efficacy between antimicrobials for BRD may be limited with different levels of certainty. This finding supports the concept that older molecules with less importance in human medicine should be re-evaluated in new trials. Unfortunately, comparative studies including PEN, the currently recommended first-choice antimicrobial for BRD in Scandinavia, where M. bovis prevalence is low to absent, are scarce, and the included studies outside Scandinavia date back nearly 40 years. The apparent absence of difference in efficacy may signify that AMR levels for first-intention cases are generally low in the bacterial pathogens associated with BRD, with the exception of moderate levels of resistance to specific antimicrobials in Mannheimia haemolytica and, to a lesser extent, Pasteurella multocida (EFSA Panel on Animal Health and Welfare (AHAW) et al., 2021). Another explanation for the absence of differences in efficacy between antimicrobials identified in this meta-analysis may be that the relatively small number of studies, with relatively small numbers of animals, for most of the PICOs, provided low power to detect differences. The overall importance of viral infection and the ability of the host to self-cure upon administration of bacteriostatic antimicrobials should not be underestimated.
Conclusion
In this systematic review and meta-analysis of primary antimicrobial therapy for clinical BRD (excluding metaphylaxis), we did not detect clinically meaningful differences between the five antimicrobial classes in need for re-treatment, based on prespecified clinical thresholds. Certainty of evidence ranged from very low to moderate, so results should be interpreted with caution. Important outcomes such as mortality and growth were reported too inconsistently to pool. Future trials would benefit from a core outcome set (including short-term clinical cure, relapse after resolution, and mortality) with harmonized case definitions and follow-up windows. These findings will inform ENOVAT’s BRD antimicrobial treatment guideline, where broader considerations (feasibility, stewardship, and applicability across systems) are addressed in the Evidence-to-Decision framework.
Ethics and consent
Ethical approval and consent were not required.
Data availability
The supplementary files including the PRISMA checklist and protocol deviations, data extraction forms/templates, risk-of-bias forms and judgements, GRADE evidence profiles and summary-of-findings tables and stakeholder materials (surveys, clinical thresholds) are openly available at Open Science Framework: https://doi.org/10.17605/OSF.IO/KTHG2 (Scahill, 2025).
This project contains the following data:
• Supplementary file 1.
• Supplementary file 2.
• Supplementary file 3.
• Supplementary file 4.
• Supplementary file 5.
• Supplementary file 6.