1. Introduction
The need for alternative carbon-free energy sources is becoming increasingly crucial in achieving the goals of the Paris Climate Agreement. Although solar and wind power are promising solutions for energy production, their inherent intermittency in both time and location requires efficient energy storage and transport.
The use of metals as energy carriers to decarbonize the energy sector appears to be a promising solution. This approach offers several key advantages: metals are among the most energy-dense zero-carbon energy carriers, are non-toxic in bulk form, relatively easy to recycle, and allow energy to be stored over long periods without losses.1–3
In particular, iron is not classified as a critical or conflict material4 and is abundantly available across all continents and countries.5 If renewable energy is available, the iron energy carrier cycle can operate in a loop, allowing the stored chemical energy to be released as heat (see
Figure 1). Alternatively, it is also possible to react iron powder with water vapor, resulting in the release of hydrogen. Thereby, the iron powder effectively acts as a hydrogen carrier.
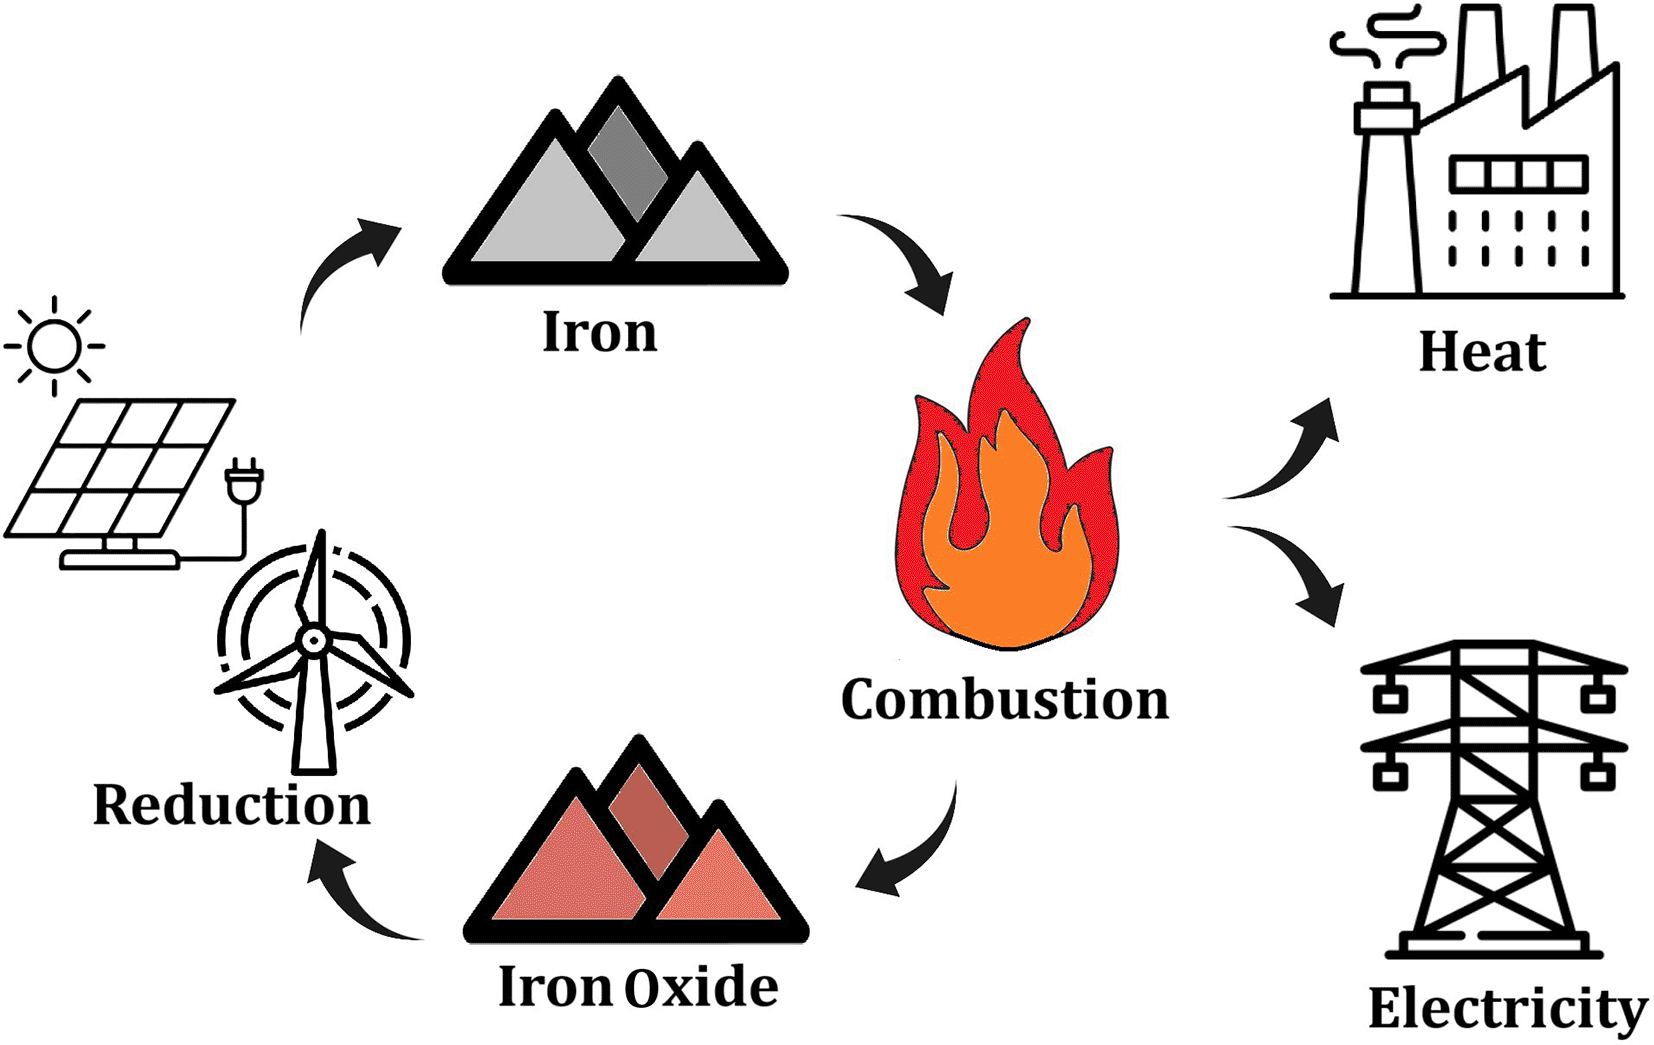
Figure 1. Schematic of the cycle using iron as an energy carrier: If renewable energy is available in surplus, the iron oxide gets reduced. If energy or heat is needed, the iron is burned.
The chemical reactions governing combustion (Eq. 1) and hydrogen production (Eq. 2) are:
(1)
(2)
The re-charging phase with hydrogen reduces the iron oxide formed during combustion back to iron and water (Eq. 3):
(3)
The concept of using iron for long-term energy storage has been known for more than a century6 and is now gaining renewed momentum due to the need for a safe and dense energy carrier to solve the inherent intermittency of renewable energy. Although iron as an energy carrier is largely absent from mainstream discussions,7–9 the landscape is rapidly changing. Start-ups such as RIFT, AMBARtec AG, Fenix Energy, and Iron+ are actively rolling out pilot plants and launching the first commercial installations.10
However, iron powder, as with most energetic substances, can also accidentally ignite when dispersed in air (for instance during handling and/or transport). To enable large-scale deployment, it is essential that the safety characteristics of iron dusts are well understood and appropriate measures for explosion protection are formally addressed through standardized guidelines. This paper makes an important contribution by providing a solid foundation for such efforts through international round-robin testing, providing valuable and reliable data to support the development of dedicated safety standards for applications involving iron energy carriers.
Safety characteristics for gases, vapors, and dusts are typically found in databases, but contrary to gases and vapors, available data for dusts show a large spread and cannot be applied directly, as the results are less reproducible and difficult to implement in practice without conducting additional experiments. This is due to four influencing parameters that significantly affect their safety characteristics.
• Chemical properties (see 3.1)
• Moisture content (see 3.2)
• Particle size distribution (see 3.3)
• Particle morphology
In contrast, this study employs iron powders that were produced under identical conditions and characterized by the same chemical composition, moisture content, particle size distribution, and morphology. This minimizes variability and enables a clear assessment of whether the powders can be considered explosible under standardized testing, with safety aspects integrated from the beginning.
To date, most investigations of the combustion behavior of metallic powders in relation to particle size have focused on single particles,11–14 laminar flames,15,16 or small-scale burners.17–19 Recent studies have begun to explore various process-related parameters,20–26 while safety aspects are still overlooked in research.
Regarding the determination of safety characteristics of combustible dusts, although the test procedure is well described in the standards, there are still degrees of freedom in the execution of the tests and particularities of iron dusts, which often lead to deviating test results. First, iron has a high density, and flame propagation can be observed at concentrations that are higher than for other dusts (e.g., coal or organic dusts such as flour).
The dust concentrations in EN 14034-1/2 are not strictly predefined; instead, a recommendation is given: “The dust concentration is varied over a wide range from 250 g/m3 to 1500 g/m3 (typically 250 g/m3, 500 g/m3, 750 g/m3, 1000 g/m3 and 1500 g/m3) and the pressure increase is measured”.27,28 It is further stated that in the case of high-density materials such as metals, higher concentrations (e.g., up to 2500 g/m3) are permitted. However, the testing procedure has practical limitations due to the need to inject dust with an overpressure through a nozzle.
At concentrations above 1000 g/m3, the injection pressure is no longer sufficient to convey all dust into the sphere while still ensuring an initial pressure of 1 bar abs. There are several ways to cope with this:
• Increasing the pressure in the dust container to pressures above 21 bar (not allowed according to the standard)
• Increasing the beginning pressure in the sphere before injection (also not allowed according to the standard)
• Testing the dust at pressures below ambient pressure (allowed but not recommended)
• Placing some of the dust sample or all of it in the container (allowed but not commonly applied; this also influences all safety characteristics28,29)
It has also been investigated previously that marginally explosible dusts - and especially iron dusts - cause large deviations when tested.30–32 Furthermore, the friction and mass of iron dust lead to insufficient equalization of pressures between the explosion chamber and the dust container before ignition, resulting in ignition occurring at a pressure below atmospheric pressure, which causes a lower measured pressure increase.
Another problem with iron dusts is their slow ignition behavior. It is often observed that a first pressure increase, caused by the igniters, is followed by a delayed second increase when iron dusts are tested.33,34 When the rate of pressure increase is determined automatically by the software, the first slope is used to determine the rate of pressure rise, while the iron itself reacts at a slower rate (see
Figure 5).
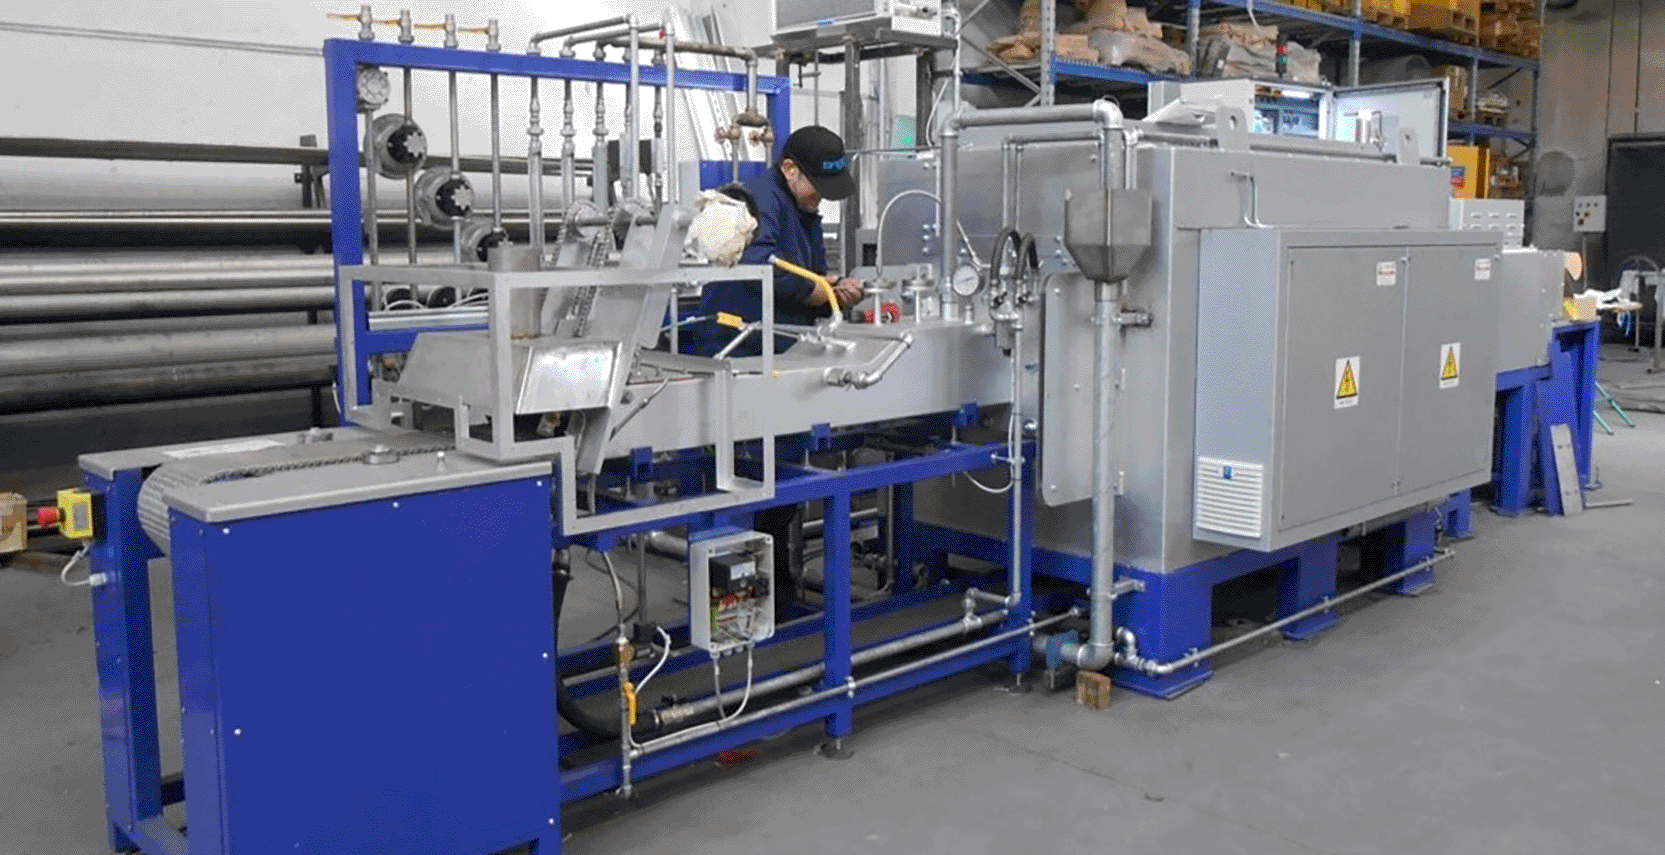
Figure 2. Picture of the reduction belt furnace.
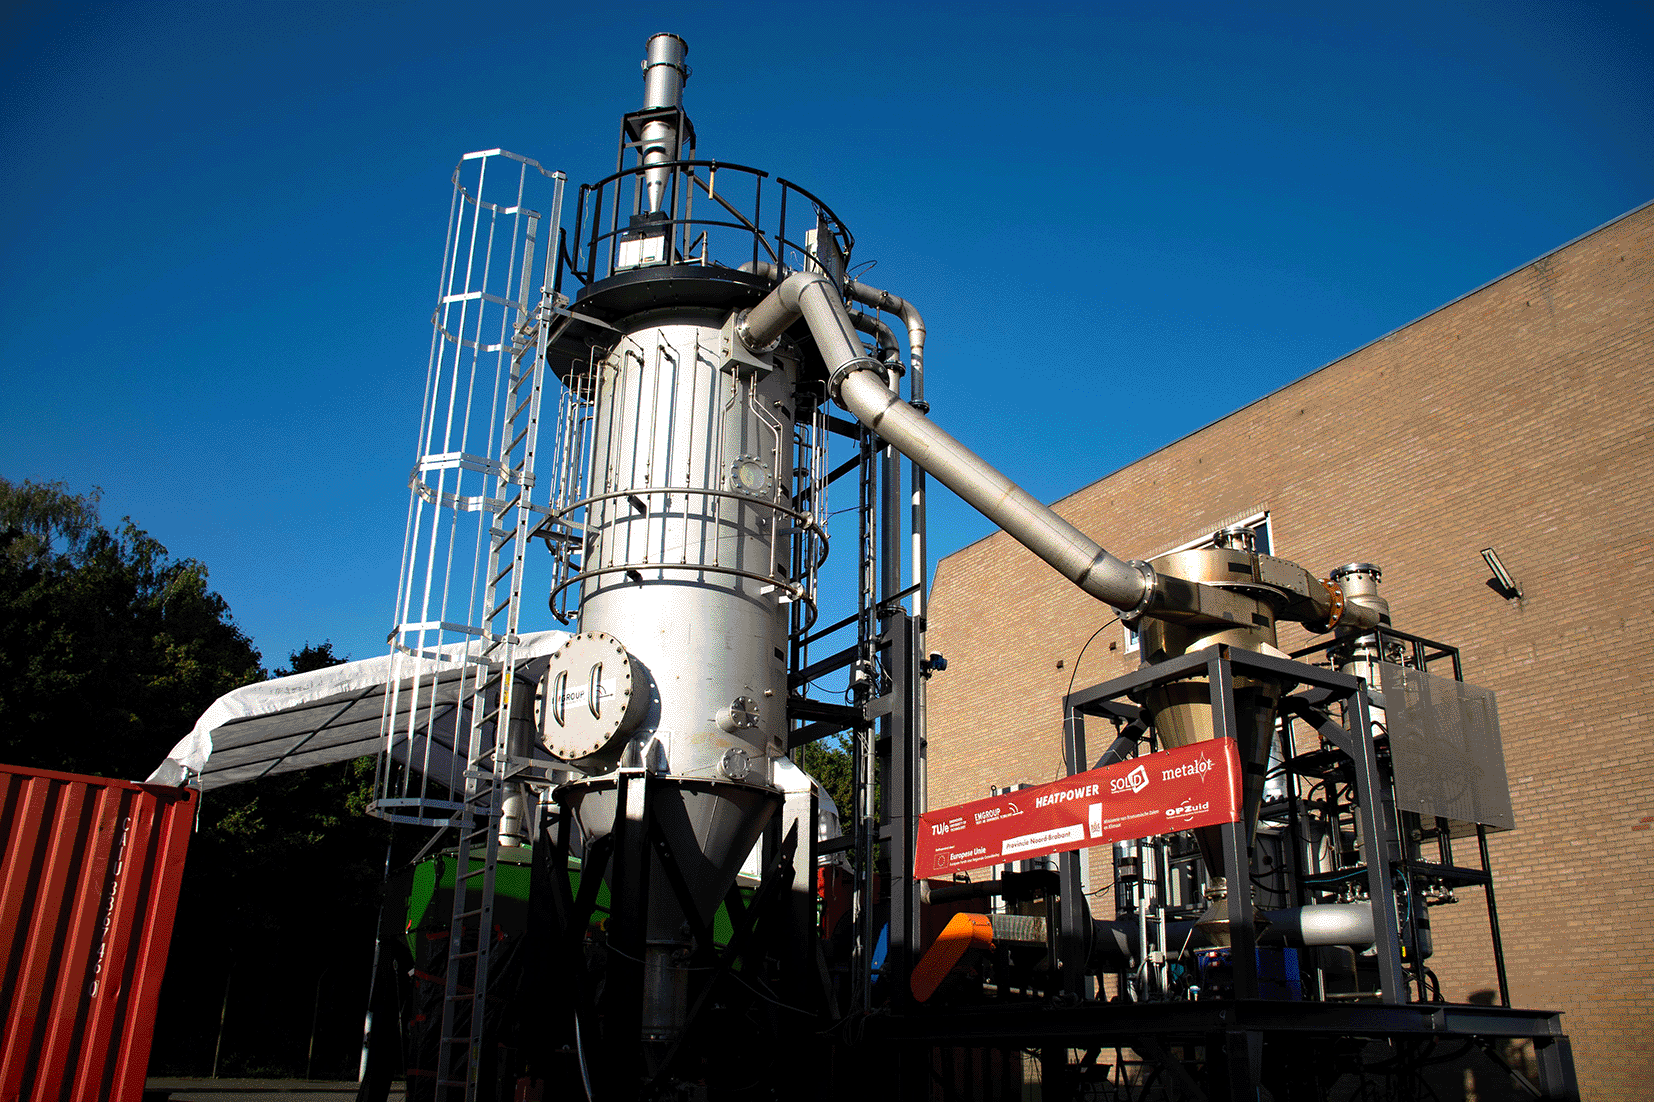
Figure 3. Picture of the MP500 iron powder boiler.
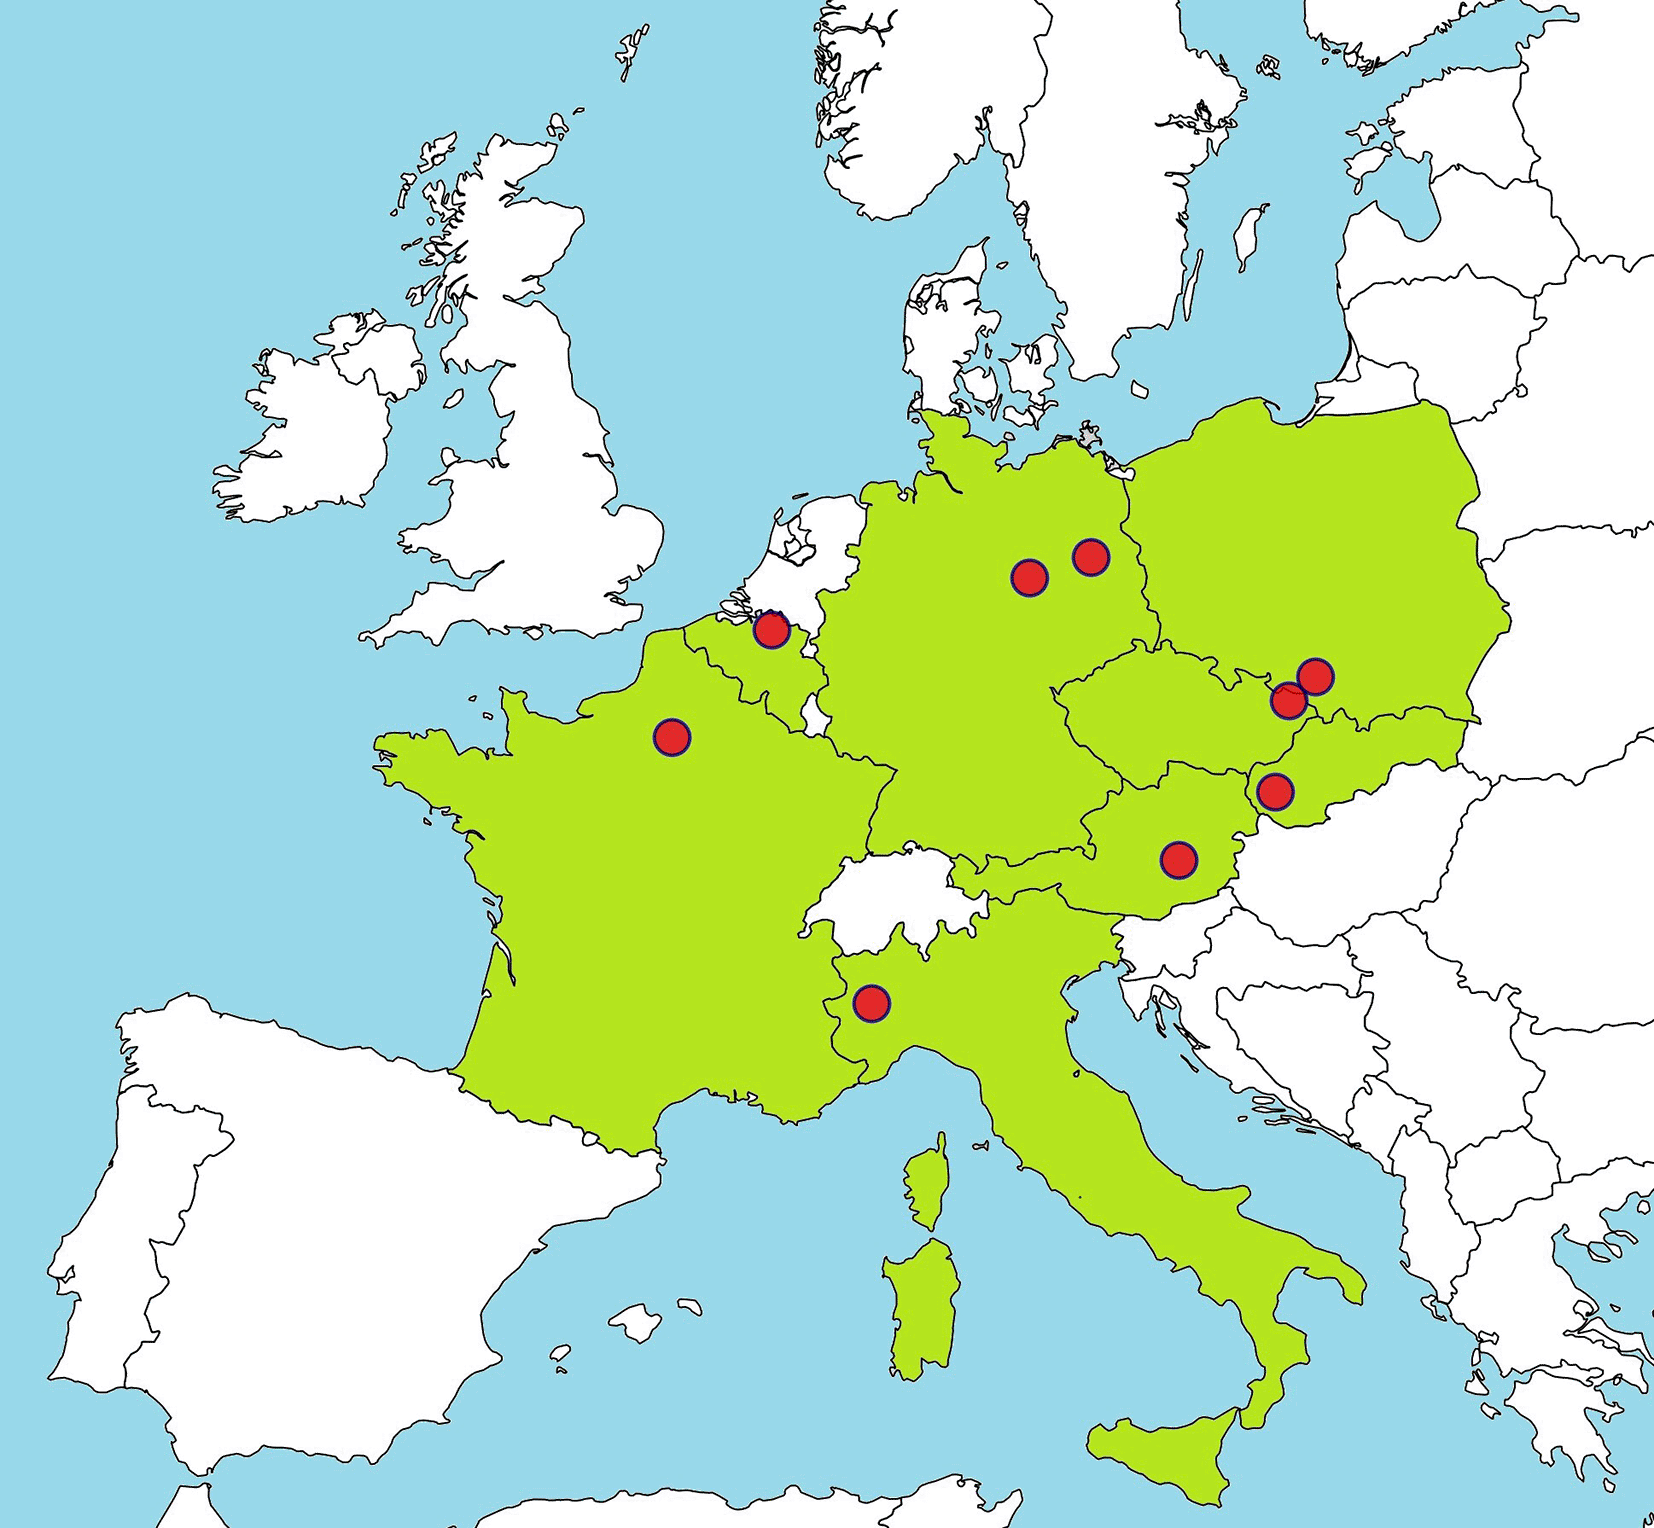
Figure 4. Location of the nine participating facilities in central Europe.
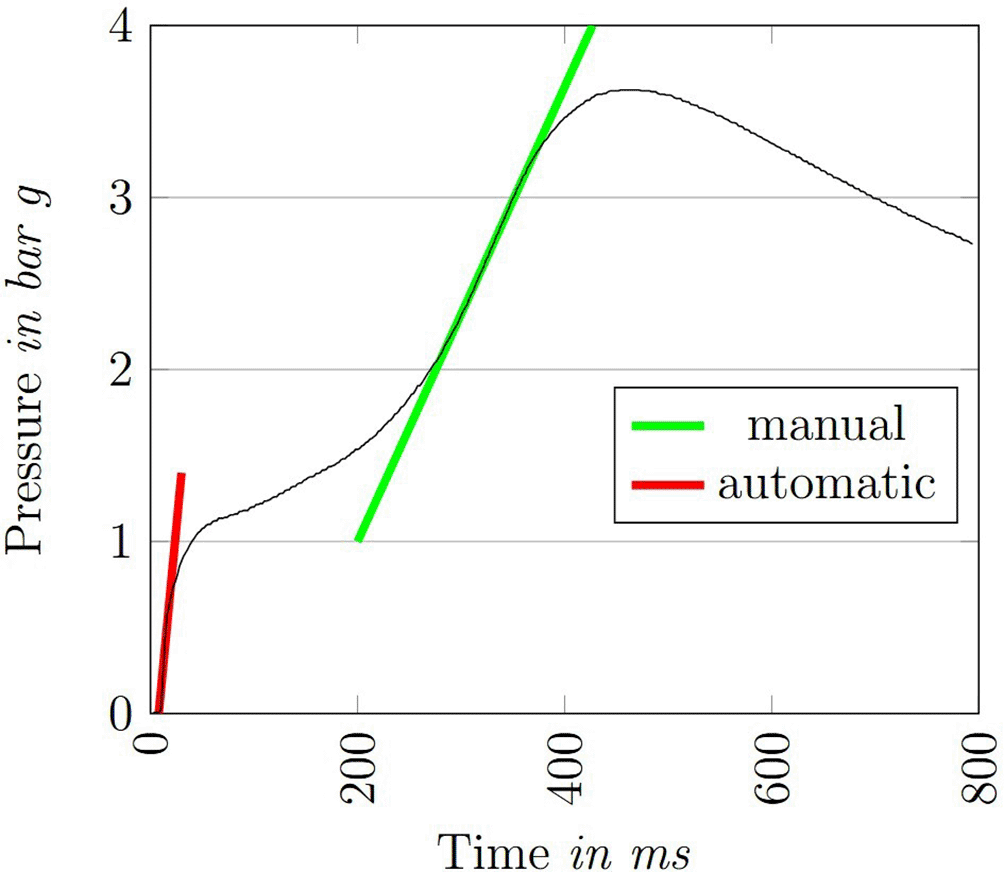
Figure 5. Example of the measured pressure development for MT63 at a concentration of 2000 g/m3: difference in automatic and manual determination of dp/dt.
After a first general approach to an a-priori-prediction of the safety characteristics of pure iron energy carriers,20 this article represents a second step towards the development of a standardized iron powder as a dense energy carrier with the safety aspect implemented from the beginning. The aim is to establish an internationally harmonized understanding of the potential explosion hazards associated with this emerging technology and to define appropriate safety measures, fostering a holistic safety culture from the very beginning of its implementation.
These data are also essential in a regulatory context, for example within the framework of TDG/ADR for transport, REACH for substance registration and Safety Data Sheets, ATEX for the management of explosive atmospheres, and national regulations such as ICPE in France for industrial safety.
2. Experimental
2.1 Experimental materials
The dust samples were provided by Pometon S.p.A. and Eindhoven University of Technology. Four types of iron dusts were tested: MT63, MT150, MT63reg, and MT150reg. The term “reg” indicates regenerated powders that have already undergone one combustion–reduction cycle.
The original MT63 and MT150 powders are produced by water atomization from molten scrap metal. For the regenerated powders, the reduction was performed in a mesh belt furnace operating at temperatures between 1000–1100 °C with the addition of hydrogen, following combustion of the original MT63/150 powder in a 500-kWth pilot-scale industrial burner described in35 (
Figures 2 and 3). After the reduction process, the iron is hammer-milled to produce a suitable particle size for combustion. Regenerated samples have a flaky shape due to this hammer-milling. The MT63reg sample has a wide particle size distribution, while the MT150reg sample would fall outside some standards because it is too coarse to be considered dust [1]. However, all powders have been successfully combusted in the pilot-scale MP500 burner and are therefore representative of iron powder for future power plants.
All samples were characterized by their water content and particle size distribution (see Chapters 3.2 and 3.3). Although the surface morphology is not discussed further, the SEM images are provided in
Figure 8 for reference. The tested iron dusts include:
• MT63: Iron dust freshly produced via water atomization, characterized by irregular, “potato-shaped” particles that are nonporous.
• MT63: Iron dust freshly produced via water atomization, characterized by irregular, “potato-shaped” particles that are nonporous.
• MT63reg: Iron dust regenerated in a belt furnace following one combustion–reduction cycle, resulting in porous, thin, flake-like particles.
• MT150reg: Iron dust regenerated in a belt furnace following one combustion–reduction cycle, with porous, flake-like particles, but coarser than MT63reg.
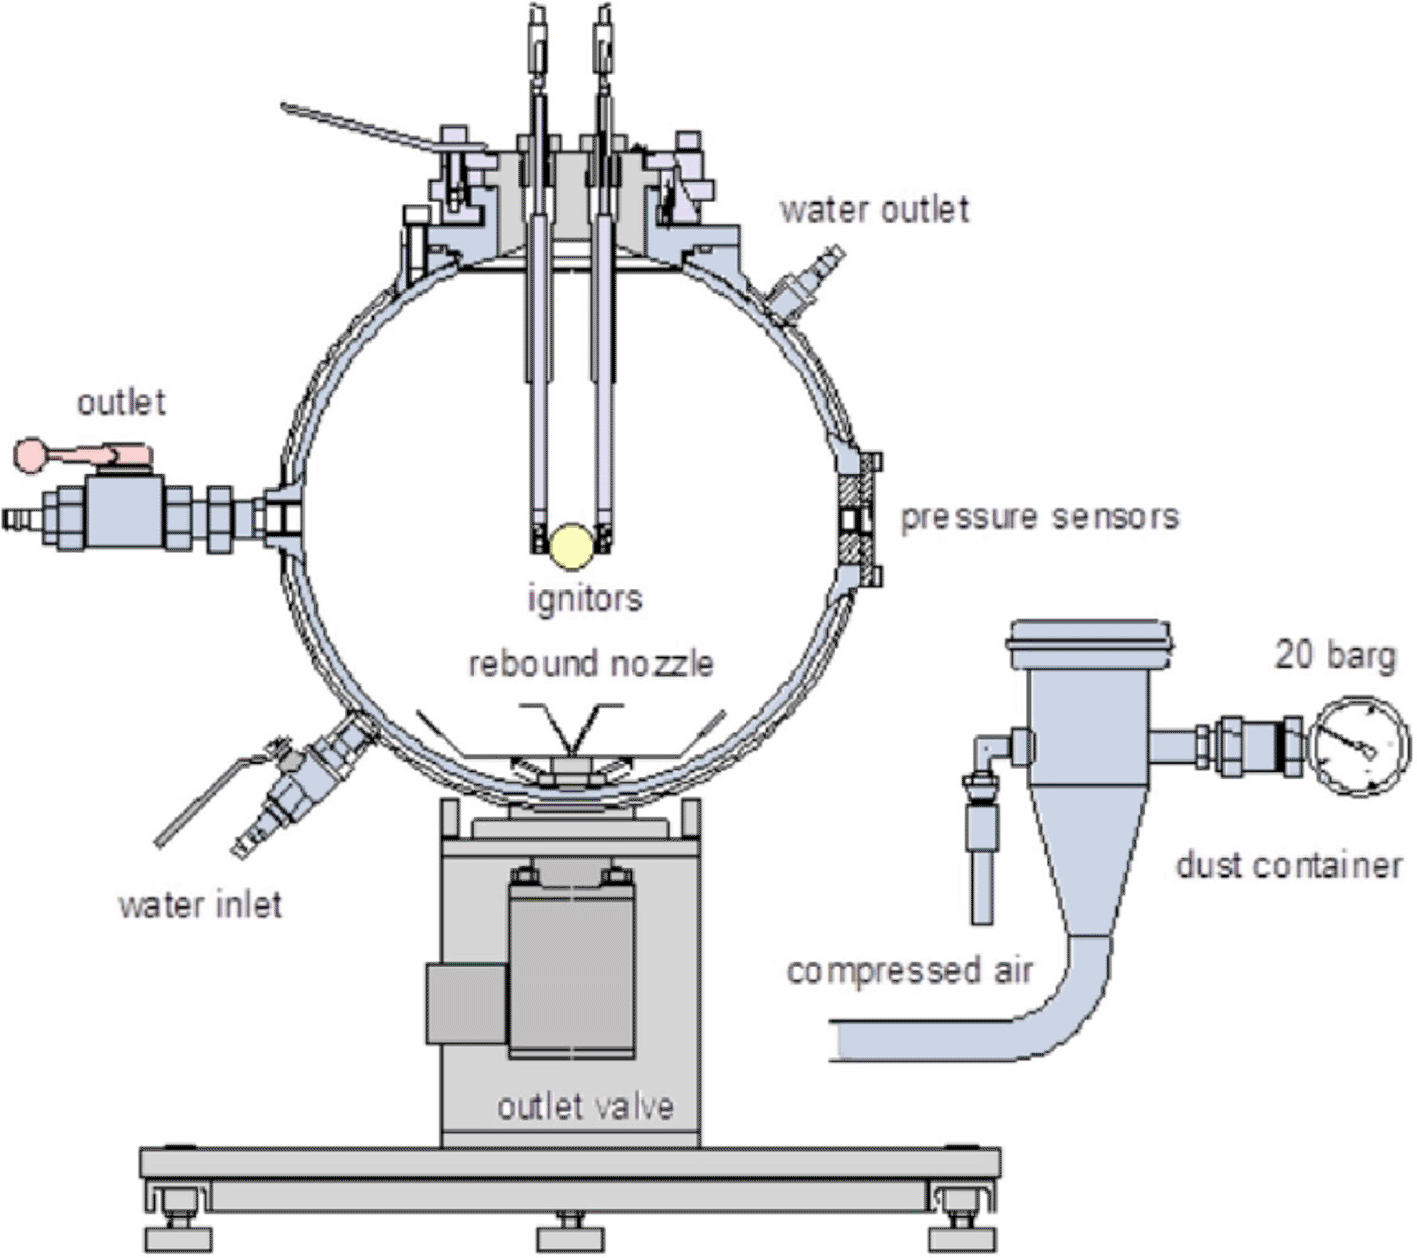
Figure 6. Schematic of the 20 L-sphere. Taken from.44
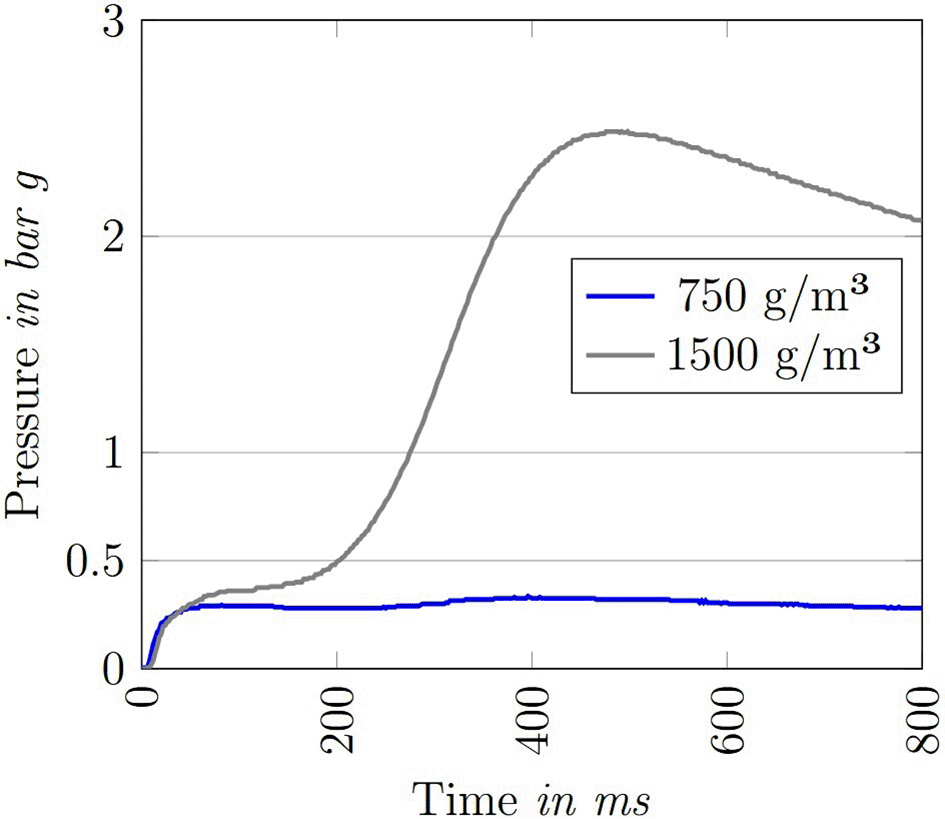
Figure 7. Example of the measured pressure development for an iron dust sample: At a concentration of 750 g/m3 there is no ignition, whereas at 1500 g/m3 the pressure exceeds the threshold value of 0.5 bar g.
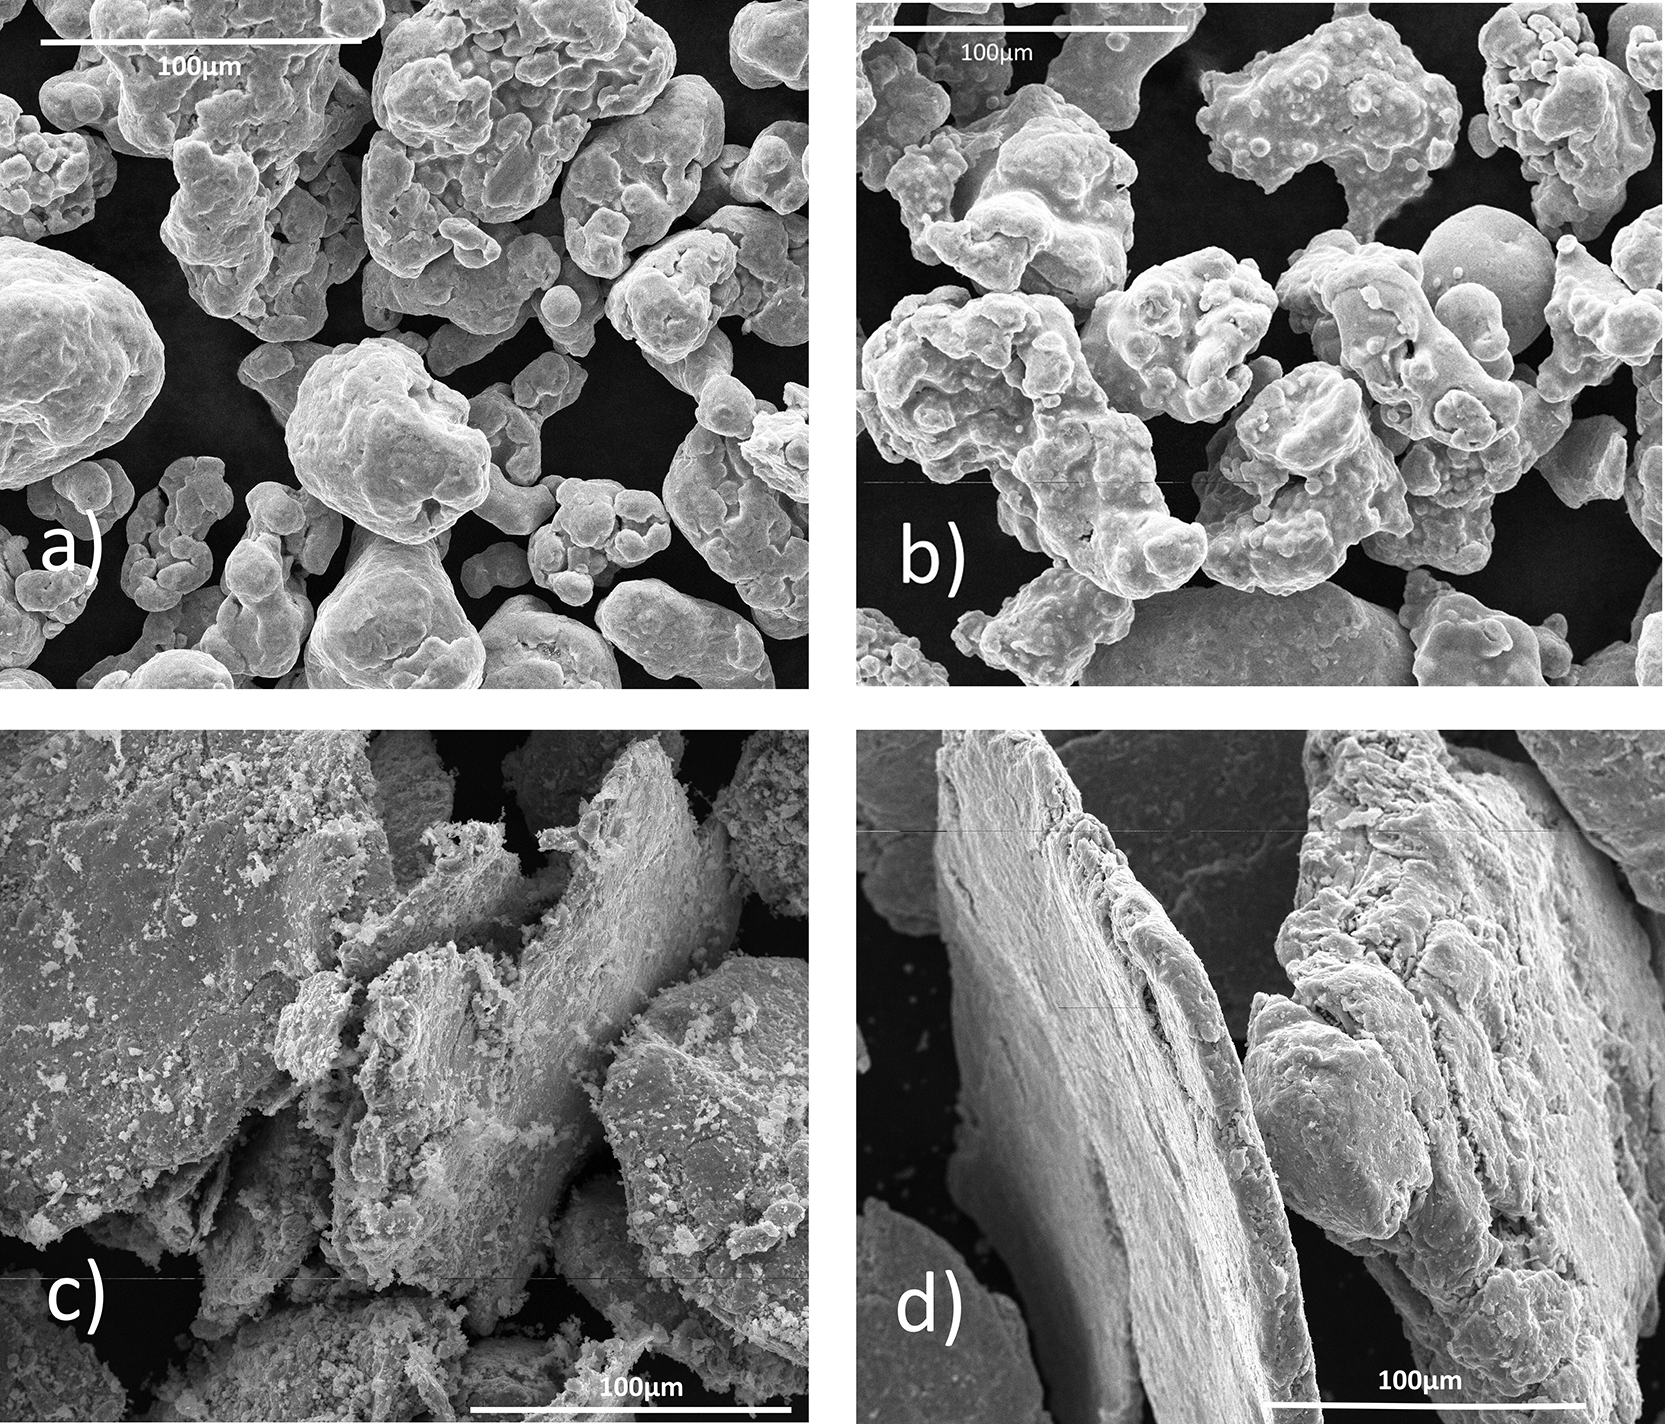
Figure 8. Scanning Electron Microscopy (SEM) images showing a) MT63, b) MT150, c) MT63reg, and d) MT150reg.
2.2 Chemical composition
The chemical composition of the MT63 and MT150 powders was analyzed at the Bundesanstalt für Materialforschung und -prüfung (BAM) using energy-dispersive X-ray spectroscopy (EDX). The measurements were conducted in a Phenom XL G3 SEM (Thermo Fisher Scientific Inc.) with an acceleration voltage of 15 kV at a reduced pressure of 1–6 bar. For each sample, several measurements at different spots were carried out. In addition, line scans and mappings were recorded to investigate the elemental distribution. The level of impurities in the MT63reg and MT150reg powders can be assumed to be similar to the original MT63 and MT150, respectively, considering that no impurities were added during the combustion process. During the first combustion–reduction cycle, only minor changes in impurity concentrations can be expected to occur.42,43 All powders were also tested for their crystalline composition using X-ray diffraction (XRD) and for their oxygen content using inert gas fusion (IGF) at Eindhoven University of Technology.
2.3 Experimental procedures
The dust samples were shipped to the Technical University of Leoben. There, the moisture contents, particle sizes, and safety characteristics were analyzed and subsequently packed and distributed to the other participating institutions:
• VSB – Technical University Ostrava, Czech Republic
• Slovak University of Technology in Bratislava, Slovakia
• ADINEX NV, Belgium
• Otto-von-Guericke University Magdeburg, Germany
• Bundesanstalt für Materialforschung und -prüfung (BAM), Germany
• Politecnico di Torino, Italy
• CMI – National Research Institute – Experimental Mine “Barbara”, Poland
• INERIS, Verneuil-en-Halatte, France
In general, round-robin particle characterization and explosion tests were carried out in nine facilities from eight different countries (see
Figure 4).
As part of the coordinated effort, the institutes provided measurements of the moisture content, the particle size distribution, and the safety characteristics: explosibility, pmax, and (dp/dt)max, or rather KSt, for the four dusts, determined according to standardized procedures described in ISO 80079-20-2 and the EN 14034 series.26,27,38 It has been previously investigated and stated that the reproducibility of safety characteristic measurements of marginally explosible dusts, especially iron dusts, can be poor.30–32
The safety characteristics were determined in standard 20-L spheres from different manufacturers. The main steps for the determination of safety characteristics are as follows (see also
Figure 6):
1. Evacuation of the explosion vessel to a defined vacuum (0.4 bar abs)
2. Pressurizing the dust chamber to a defined overpressure (21 bar abs)
3. Opening of the fast-acting valve
4. Triggering the ignition source (2 × 1 kJ for explosibility, 2 × 5 kJ for pmax and (dp/dt)max after a defined ignition delay time of 60 ms
5. Recording and evaluating the pressure development
The dust is classified as non-explosible if no ignition test with an ignition energy of 2 × 1 kJ shows a pressure rise above 0.5 bar g over a wide dust concentration range38 (see
Figure 7). To determine pmax and (dp/dt)max, three test series are conducted, with each test sample varying the dust concentration in each series over a wide concentration range. The three highest recorded pressure peaks in all three series are averaged and processed with
Equation 4 to determine pmax.26,39 The three highest recorded pressure rises are averaged to determine (dp/dt)max. The KSt value is calculated from (dp/dt)max according to
Equation 6.27
(4)
(5)
(6)
Given the possible deviations caused by different determination techniques, all raw data were collected and analyzed in a consistent way. In this article, the rate of pressure rise is always determined from the second slope, not the first, which is allowed according to the American standard,39 but not stated in the European standard.27
Pci is the pressure increase due to the igniters. It should also be pointed out that Eq. 4 stretches the measured values from a range of 5.5 − pci to 5.5, which leads to an increase in the scattering of 41%. This means that small differences between individual measurements become amplified in the corrected values. This amplification should be considered when interpreting the results, since it may introduce additional apparent variability that is not present in the raw measurements.
3. Results and discussion
3.1 Chemical composition
The results of the chemical analysis for the powders are shown in
Tables 1 and 2.
Table 1. EDX analysis for MT63 and MT150, averaged values from 14, respectively 11 analyses.
The full analysis with all tests for each sample can be found in the Supplementary Material.
| MT63 | Atomic fraction in % |
Weight fraction in % |
|---|
| Iron | 89.2 | 95.9 |
| Oxygen | 9.5 | 3.1 |
| Aluminum | 0.4 | 0.2 |
| Silicon | 0.3 | 0.1 |
| Copper | 0.3 | 0.4 |
| Molybdenum | 0.1 | 0.2 |
| Sulfur | 0.1 | 0.0 |
| MT150 | | |
| Iron | 77.5 | 91.5 |
| Oxygen | 21.5 | 7.8 |
| Aluminum | 0.3 | 0.2 |
| Silicon | 0.5 | 0.3 |
| Chromium | 0.1 | 0.1 |
Table 2. Crystalline composition and oxygen mass fraction of the four powders.
No other compounds were found in the XRD pattern.
| Powder | Fe [wt%] | FeO [wt%] | O wt% by XRD |
O wt% by IGF |
|---|
| MT63 | 98.8 | 1.2 | 0.3 | 0.6 |
| MT150 | 97.3 | 2.7 | 0.6 | 0.9 |
| MT63reg | 82.6 | 17.4 | 3.9 | 4.5 |
| MT150reg | 96.7 | 3.3 | 0.3 | 2.3 |
The EDX analysis data show that, as expected, the samples consist mainly of iron. However, MT63 and MT150 also contain significant amounts of oxygen, which indicates that some of the iron is present in oxidized form. The EDX mappings in the supplementary material, which show the distribution of elements, reveal that, unlike iron, oxygen is not distributed evenly throughout the sample, but rather occurs in distinct oxygen accumulations. This supports the assumption that small amounts of iron oxide are present in the samples.
Apart from oxygen, the samples contain no significant impurities. Although other elements such as copper and molybdenum were detected, their fractions are in very low range of less than 1 per cent.
The XRD measurements, conducted at TU Eindhoven, also show high values of iron and little to no impurities.
3.2 Moisture content
All facilities tested the dusts for their moisture content. The moisture content was analyzed using the DIN EN ISO 18134-1 method.45 The results showed moisture contents for all samples ranging from 0.0 to 0.5 wt%, which is notably low and therefore neglected during further evaluation. The variations in the results presumably arise from differences in the testing methods, environmental conditions during transportation, or the relative humidity of the surrounding air in the laboratory during testing.
The values are so low that their impact on the safety characteristics can be considered negligible, as the mass of water is insufficient to act as a heat sink or influence the dispersion of the powder. Most investigations on the influence of moisture content on the explosion characteristics of dusts deal with values of several percent and higher, not below 1 wt%.46–48
3.3 Particle size distribution
All facilities analyzed the particle size distribution using the laser diffraction method (ISO 13320:2020)49 or mechanical sieving (ÖNORM EN 15415-1).50 The results demonstrated a similar size distribution with only minor differences between laboratories for MT63, MT150, and MT150reg (see
Figure 9). The results for MT150reg show higher variations, presumably because the sample is less homogeneous and contains more coarse particles, which shift the entire particle size distribution toward larger values when present in the subsample (see
Figure 9).
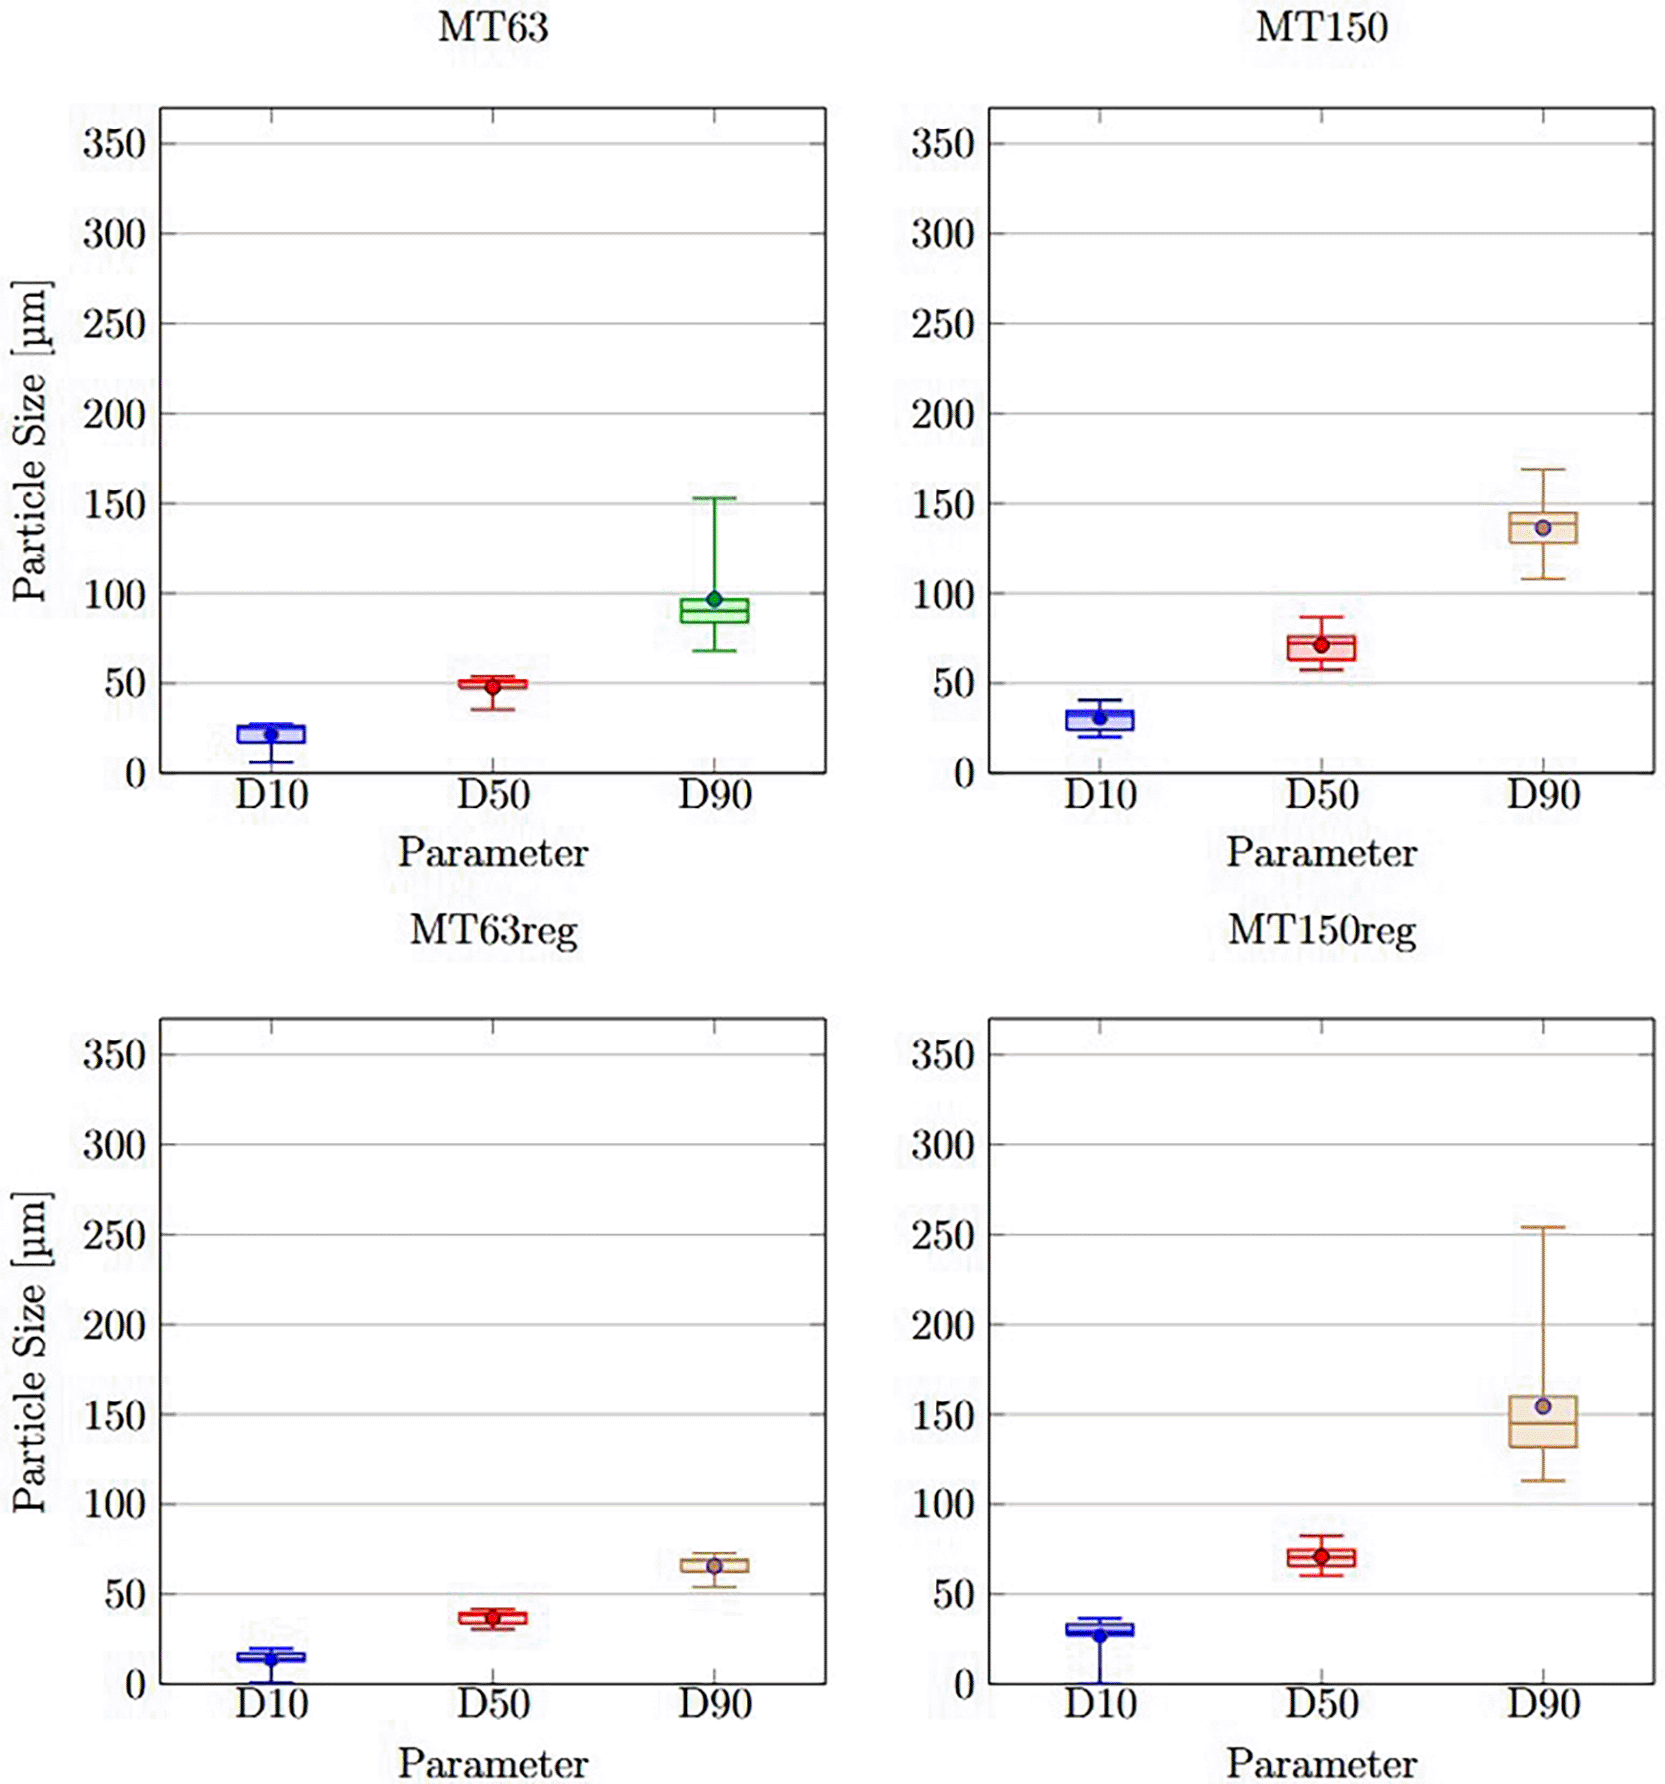
Figure 9. Statistical distribution of particle sizes (D10, D50, D90) for all investigated powder samples.
It should be noted that in cases where discrepancies were observed (MT63, MT150, MT150reg for D90), the laser diffraction results were consistently higher than those from sieve analysis. This reflects the fundamental difference in the measurement principles: laser diffraction evaluates the equivalent spherical volume diameter and is therefore highly sensitive to irregularly shaped coarse particles or agglomerates, which shift the upper percentiles of the distribution to larger values. In contrast, sieve analysis is based on the smallest particle dimension that allows passage through a mesh opening, which can underestimate the contribution of irregularly shaped or weakly agglomerated coarse particles. In samples with narrower distributions (MT150, MT63reg), both techniques yield comparable results, whereas broader or more agglomerated powders (MT63, MT150reg) show a stronger dependence on the measurement method.51
For the interpretation of the explosibility data, it is essential to have reliable information on the particle size range. At the same time, it must be emphasized that different characterization techniques come with inherent limitations. Thus, the observed deviations between laboratories do not indicate different samples but rather reflect method-specific sensitivities (e.g., laser diffraction vs. sieve analysis).
3.4 Safety characteristics
First, all samples were tested for explosibility according to ISO 80079-20-2 using two 1 kJ ignitors. If an explosion was detected, further tests were conducted to determine explosion parameters according to EN 14034-1/2,26,27 using two 5 kJ ignitors.
The explosibility results for all four dusts are summarized in
Table 3. The results of the round-robin test indicate variability in the classification of dust explosibility among laboratories. MT63 was considered non-explosible by six out of nine laboratories, and MT150 by seven out of nine. MT63reg was classified as non-explosible by only one laboratory, whereas MT150reg was classified as non-explosible by six out of nine laboratories. The reasons for these variations may arise from the degrees of freedom in the execution of the tests allowed by the standardized test procedures as discussed above. One the one hand, different concentration ranges or maximum concentrations were taken into account for the determinations. On the other hand, the initial pressures may not have been consistent. To overcome the challenge of conveying the high-density dust at high concentrations quickly from the container to the sphere before ignition some laboratories accepted to ignite at lower initial pressures.
Table 3. Explosibility of all four dust samples.
| N. | MT63 | MT150 | MT63reg |
MT150reg |
|---|
| 1 | Explosible | Non-explosible
| Explosible | Non-explosible
|
| 2 | Explosible | Explosible | Explosible | Non-explosible
|
| 3 | Non-explosible
| Non-explosible
| Explosible | Non-explosible
|
| 4 | Non-explosible
| Non-explosible
| Explosible | Non-explosible
|
| 5 | Non-explosible
| Non-explosible
| Explosible | Explosible |
| 6 | Non-explosible
| Non-explosible
| Explosible | Explosible |
| 7 | Explosible | Explosible | Explosible | Explosible |
| 8 | Non-explosible
| Non-explosible
| Explosible | Non-explosible
|
| 9 | Non-explosible
| Non-explosible
| Non-explosible
| Non-explosible
|
The detailed results of all dust explosion tests conducted by all participating laboratories are provided in the Supplemental Material.
For the cases where an explosion was recorded, the safety characteristics such as the maximum explosion pressure pmax, the maximum rate of pressure rise (dp/dt)max, and the volume-normalized deflagration index KSt were determined (
Tables 4–7).
Table 4. Evaluation of MT63 explosion indices based on data reported by three participants.
| Parameter [N. participant] | Value |
Deviation [%] |
|---|
| pex in bar g
| 3.2 ± 0.6 | ±19 |
| pex in bar g (Lab 1) | 3.8 | - |
| pex in bar g (Lab 2) | 3.6 | - |
| pex in bar g (Lab 7) | 2.6 | - |
| pmax in bar g
| 2.25 ± 0.85 | ±38 |
| pmax in bar g (Lab 1) | 3.1 | - |
| pmax in bar g (Lab 2) | 2.9 | - |
| pmax in bar g (Lab 7) | 1.4 | - |
| (dp/dt)max in bar/s
| 26 ± 7 | ±27 |
| (dp/dt)max in bar/s (Lab 1) | 26 | - |
| (dp/dt)max in bar/s (Lab 2) | 19 | - |
| (dp/dt)max in bar/s (Lab 7) | 33 | - |
| KSt in bar·m/s
| 7 ± 2 | ±29 |
Table 5. Evaluation of MT150 explosion indices based on data reported by two participants.
| Parameter [N. participant] | Value |
Deviation [%] |
|---|
| pex in bar g
| 2.9 ± 0.5 | ±17 |
| pex in bar g (Lab 2) | 3.4 | - |
| pex in bar g (Lab 7) | 2.4 | - |
| pmax in bar g
| 1.85 ± 0.75 | ±41 |
| pmax in bar g (Lab 2) | 2.6 | - |
| pmax in bar g (Lab 7) | 1.1 | - |
| (dp/dt)max in bar/s
| 23.5 ± 6.5 | ±28 |
| (dp/dt)max in bar/s (Lab 2) | 17 | - |
| (dp/dt)max in bar/s (Lab 7) | 30 | - |
| KSt in bar·m/s
| 6.5 ± 1.5 | ±23 |
Table 6. Evaluation of MT150reg explosion indices based on data reported by two participants.
| Parameter [N. participant] | Value |
Deviation [%] |
|---|
| pex in bar g
| 2.9 ± 0.1 | ±3.5 |
| pex in bar g (Lab 5) | 3.0 | - |
| pex in bar g (Lab 7) | 2.8 | - |
| pmax in bar g
| 1.8 ± 0.1 | ±5.6 |
| pmax in bar g (Lab 5) | 1.9 | - |
| pmax in bar g (Lab 7) | 1.7 | - |
| (dp/dt)max in bar/s
| 26.5 ± 8.5 | ±32 |
| (dp/dt)max in bar/s (Lab 5) | 18 | |
| (dp/dt)max in bar/s (Lab 7) | 35 | |
| KSt in bar·m/s
| 7.5 ± 2.5 | ±34 |
Table 7. Evaluation of MT63reg explosion indices based on data reported by seven participants.
| Parameter [N. participant] | Value |
Deviation [%] |
|---|
| pex in bar g
| 2.9 ± 0.3 | ±10 |
| pex in bar g (Lab 1) | 3.2 | - |
| pex in bar g (Lab 2) | 3.0 | - |
| pex in bar g (Lab 3) | 3.15 | - |
| pex in bar g (Lab 4) | 3.1 | - |
| pex in bar g (Lab 5) | 2.9 | - |
| pex in bar g (Lab 6) | 3.0 | - |
| pex in bar g (Lab 7) | 2.6 | - |
| pmax in bar g
| 2.05 ± 0.55 | ±27 |
| pmax in bar g (Lab 1) | 2.2 | - |
| pmax in bar g (Lab 2) | 2.0 | - |
| pmax in bar g (Lab 3) | 2.6 | - |
| pmax in bar g (Lab 4) | 2.1 | - |
| pmax in bar g (Lab 5) | 1.8 | - |
| pmax in bar g (Lab 6) | 2.4 | - |
| pmax in bar g (Lab 7) | 1.5 | - |
| (dp/dt)max in bar/s
| 39.75 ± 12.75 | ±32 |
| (dp/dt)max in bar/s (Lab 1) | 48 | |
| (dp/dt)max in bar/s (Lab 2) | 30 | |
| (dp/dt)max in bar/s (Lab 3) | 52.5 | |
| (dp/dt)max in bar/s (Lab 4) | 35 | |
| (dp/dt)max in bar/s (Lab 5) | 27 | |
| (dp/dt)max in bar/s (Lab 6) | 32 | |
| (dp/dt)max in bar/s (Lab 7) | 32 | |
| KSt in bar·m/s
| 10.5 ± 3.5 | ±34 |
Uncertainty in the results also appeared during the determination of the explosion characteristics. According to the standards, the acceptable deviation for the maximum explosion pressure pmax is within 10%,26 and for the maximum rate of pressure rise (dp/dt)max within 30%.27 However, as shown in
Tables 4 to 7, the observed deviations partially exceed these limits.
A plausible explanation for this behavior lies in the specific combustion characteristics of iron. Iron is often classified as a St 1 Class dust, indicating weak explosiveness, which typically causes poorer reproducibility as discussed above.
It can be seen that the values of pex mostly deviate by less than 20%, while for pmax the deviations become more pronounced. Data evaluation was carried out using
Equations (4) and (5) stated in both American and European standards. This correction increases the scattering by 41%, which might lead to higher deviations than actually measured. Also, the signal-to-noise ratio is inherently low: a typical scattering of 0.5 bar corresponds to a much larger relative deviation when the maximum pressure is 2 bar for weakly reactive iron dust than when it is 10 bar for other commonly tested dusts.
Moreover, it should be noted that the actual pressure increase caused solely by the ignitors is not always exactly 1.6 bar but generally assumed. This phenomenon was described in.52 Laboratories often rely on manual assessment of their ignitors, and the resulting values can deviate; for example, instead of 1.6 bar, values as low as 1.1 bar are reported.52 The scattering of the pressure increase caused solely by the ignitors from one batch to another is about 0.1 bar and has a relatively stronger effect in case of weak explosiveness.53 This re-evaluation contributes to the discrepancies observed between laboratories in terms of pmax.
Regarding the differences observed in (dp/dt)max, the pressure–time curves of explosions often exhibit two distinct pressure rises as described above. This approach may cause large deviations in the determination of the rate of pressure rise for hardly explosible dusts and has been discussed previously54 (see
Figure 5). For this reason the maximum rate of pressure rise in this study was evaluated manually, considering only the portion of the curve starting 50 ms after ignition.39,44
In general, for all samples, (dp/dt)max ≤ 50 bar/s was observed. For MT63reg, the maximum rate of pressure rise was around 40 bar/s. The scattering was with below 30% for all except for one sample within the allowed range of the standards.27,39
In summary, the round-robin test revealed variability in the determination of explosion parameters for weakly explosive iron dust, despite consistent sample properties and standardized procedures. These findings highlight the limitations of the current testing procedure, particularly for low-reactivity dusts. They show that variations in the safety characteristics of different iron dust samples with different properties may be overshadowed by the limited reproducibility of the test methods.
As long as these limitations in the explosion standard persist, the establishment of general safety concepts for a standardized, non-explosive iron energy carrier — intended for large-scale distribution across Europe — remains a challenge. One way to overcome this difficulty is to classify all iron dusts as St 1 (KSt < 200) or to use an a-priori approach as suggested previously20 (see
Figure 10). Further work is required to populate this plot with additional data, but eventually it may allow a classification without the need for further testing of iron energy carriers. Simultaneously, a better understanding of dispersion, turbulence, and combustion/explosion in a 20-liter vessel - for instance through comparison with numerical simulations, as demonstrated in55 - could help explain the observed variation and support the development of an improved standard.
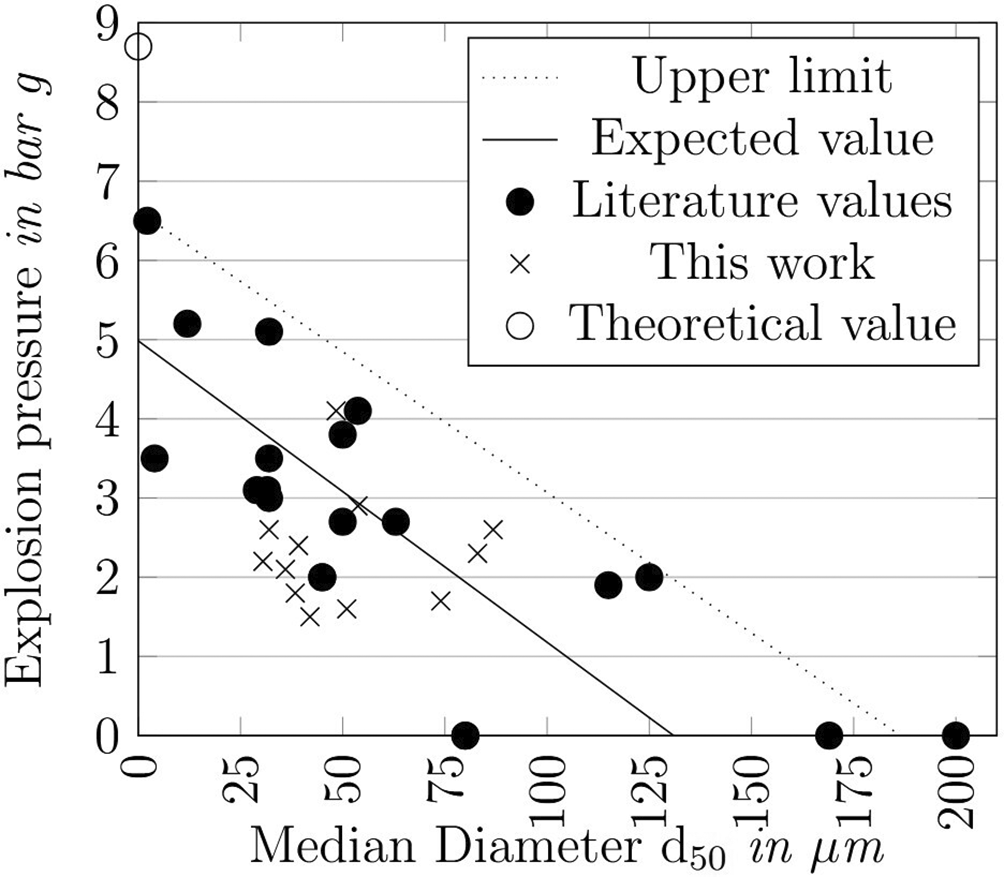
Figure 10. SIE-Chart: Explosion pressures for several iron dusts against the stated d50, Data taken from.20,54,69
4. Conclusion
Compared to many conventional solid, liquid, and gaseous energy carriers, iron dust is relatively safe with regard to explosibility.
Table 8 provides an overview of selected properties for iron and common energy carriers.
Table 8. Comparison of selected energy carriers with respect to energy density and explosion characteristics.
| Energy carrier | Energy density (MJ/kg) | MIE (mJ) | pmax (bar g) |
KSt/G (bar·m/s) |
|---|
| Iron | 758 | n.a. | 5.264 | 5064 |
| Aluminium powder | 3159 | 363 | 12.564 | 110064 |
| Brown coal (dust) | 1060 | 16064 | 9.164 | 14364 |
| Bituminous coal (dust) | 2461 | 6065 | 9.164 | 8664 |
| Wood dust | 1762 | 764 | 9.264 | 10264 |
| Crude oil | 4760 | n.a. | n.a. | n.a. |
| Gasoline | 44-4660 | 0.866 | 7.967 | 47.6668 |
| Diesel | 42-4660 | n.a. | 7.467 | n.a. |
| Methane | 50-5560 | 0.2967 | 7.167 | 56.767 |
| Hydrogen | 120-14260 | 0.01767 | 7.367 | 976.667 |
Four powders currently used in pilot-scale reactors for the iron powder energy carrier concept were tested for their explosion characteristics by performing a round-robin experiment. The round-robin test confirmed that all nine participating laboratories received and analyzed dust samples with consistent physical properties, particularly in terms of moisture content and particle size distribution. Standardized testing procedures were applied for the initial screening for explosibility and the subsequent determination of the explosion parameters, according to ISO 80079-20-236 and EN 14034-1/2.26,27
The results revealed variability in the classification of dust explosibility, where disagreement between laboratories was evident even though all laboratories followed the same standard procedures. The reasons for these variations may arise from differences in the dust concentrations tested or lower starting pressures. A scenario in which this may cause severe problems is easy to imagine: a producer tests the dust in one laboratory and it is classified as non-explosible, then ships it to another company for application. If an accident occurs, the second company may test the dust again in another laboratory, which then classifies it as explosible—despite both following the ISO 80079-20-238 standard. In addition to differing classifications regarding explosibility, deviations were observed in the values of the maximum explosion pressure and the maximum rate of pressure rise, partially exceeding the tolerances defined in the standards.
These discrepancies can be attributed to the specific combustion behavior of weakly reactive iron dusts. For the maximum explosion pressure, the main contributing factors are:
• A lower signal-to-noise ratio, with a typical scattering of 0.5 bar on a maximum pressure of approximately 2 bar for weakly reactive iron dusts, compared to about 10 bar for other commonly tested dusts.
• Correction of the measured pressures to the standardized reference pressure below 5.5 bar g. This correction increases the scattering by 41%, which may lead to higher deviations than actually measured.
• The inherent scattering of the overpressure generated by the ignitors, typically around 0.1 bar from one igniter batch to another.
• Differences in the initial pressure arising from friction in the injection process.56
• The concentration limits unto which the samples were tested.
For the maximum rate of pressure rise, the dual pressure-rise pattern should be addressed in the standards, and it should be clearly indicated which pressure rise has to be taken. Inconsistencies in the evaluation methods (manual vs. automated) otherwise lead to a wide spread of the data.
The findings reveal limitations in current explosion testing procedures for low-reactivity dusts, highlighting the need for methodological improvements and clearer evaluation criteria.
However, the round-robin test confirmed that all four powders investigated were classified either as non-explosible or as Class 1 marginally explosible dust. This provides a clear picture of the level of explosion protection measures that need to be considered for the safe use of iron powders in energy-carrier applications. Despite the discrepancies in the explosion parameters measured between laboratories, the overall results demonstrate that the explosibility of iron powders remains low.
This round-robin test, which represents one of the very few inter-laboratory studies on iron powders, contributes both to improving our understanding of iron dust explosibility and to supporting future refinement of safety standards.
An a priori approach, such as the one presented in this study, could provide a viable solution for the characterization of pure dusts, reducing uncertainties and complementing standardized methods. Together, the results not only show where methodologies can be improved but also provide confidence that iron powders can be handled safely as a recyclable energy carrier in large-scale applications, provided that appropriate protective measures are implemented.
Ethics and consent
Ethical approval and consent were not required.