Introduction
Peatlands are critical to Europe’s climate and biodiversity strategy, and in particular the EU Green Deal. These terrestrial wetland ecosystems only cover an estimated 5.85% of the EU’s land surface (241,213 km2), yet they store an estimated 51% of the region’s soil carbon.1 Despite their importance as natural carbon sinks, decades of drainage for agriculture and industrial use have transformed the majority of European peatland systems into net greenhouse gas (GHG) emitters. Mitigating climate change and achieving the EU’s 2050 climate-neutrality target rely on the dual strategy of peatland protection and restoration,2 a process that requires decisive policy action to bridge the gap between scientific goals and implementation.2–4
With the final approval of the EU Nature Restoration Law in June 2024, Member States are now legally mandated to restore 30% of degraded habitats by 2030, including specific targets for rewetting organic soils like peatlands. As of early 2026, a primary barrier to achieving these targets is a persistent “data gap”-- policymakers often lack standardized, real-time evidence to monitor peatland condition, verify restoration progress, and quantify GHG mitigation at a landscape scale.5 Traditional monitoring is often hindered by the remote and inaccessible nature of these terrains, making fieldwork costly and infrequent.
Despite its importance for effective implementation, a review of eight national strategies across Europe found that all were failing to reach the level of policy integration required for meaningful action.6 Chen et al. (2023) also found that EU peatland governance landscape is currently full of policy conflicts, both vertically across governance levels and horizontally across sectors.4 Peatland experts have provided recommendations for policies to protect peatlands,7,8 but evidence-based policy often requires compromise with other factors impacting the selection of policy actions.9 As peatland policies are scattered across levels and domains, it is difficult for policymakers to efficiently traverse the policy landscape and determine best practice when developing policy solutions in their own contexts.
The European peatland policy portal
In order to address the diffused nature of peatland policies and tools, this paper introduces the European Peatland Policy Portal (PPP), a novel digital toolkit developed by the ASPECT Unit at the University of Galway through the EU LIFE Multi Peat project together with multiple European partners. The portal serves as a centralized evidence-based policy platform and toolkit that integrates:
• Machine Learning (ML) & AI: A public platform using ML and AI tools to reference over 400 policies from the EU and all EU member states plus the UK.
• Advanced Analytics: Deploying predictive tools, such as the Site Emissions Tool and the Financial Feasibility and Pricing tool and a paludiculture tool to estimate the viability of carbon credit schemes and specialised wetland farming methods for specific sites using the Greenhouse Gas Emissions Site Type (GEST) methodology10 and a blended financial model.
• Evidence-based Policymaking: Support the analysis, alignment and development of policies by aligning technical data with policies to facilitate cross-sectoral collaboration.
By demonstrating these novel tools, we highlight how high-resolution, data-driven insights can bridge the gap between scientific observation and legislative implementation, helping to ensure that European land use policies are both effective and verifiable in the face of the climate crisis.
The contributions of this paper to the realm of European public policy are threefold. First, we present a curated peatland policy dataset as a unified collection of the global, EU-level, national, and subnational peatland-affecting policies scattered across disjointed regional, national, and international policy repositories. Secondly, we demonstrate an interactive map tool which allows policy researchers the opportunity to engage with the policy landscape on a geospatial level. Finally, we propose a retrieval-augmented generation (RAG)-based question-answering tool that enables users to engage with the entire policy dataset in a matter of seconds. Through these contributions, we hope to more efficiently facilitate the analysis and development of policies pertaining to peatlands in Europe (
Figure 1).
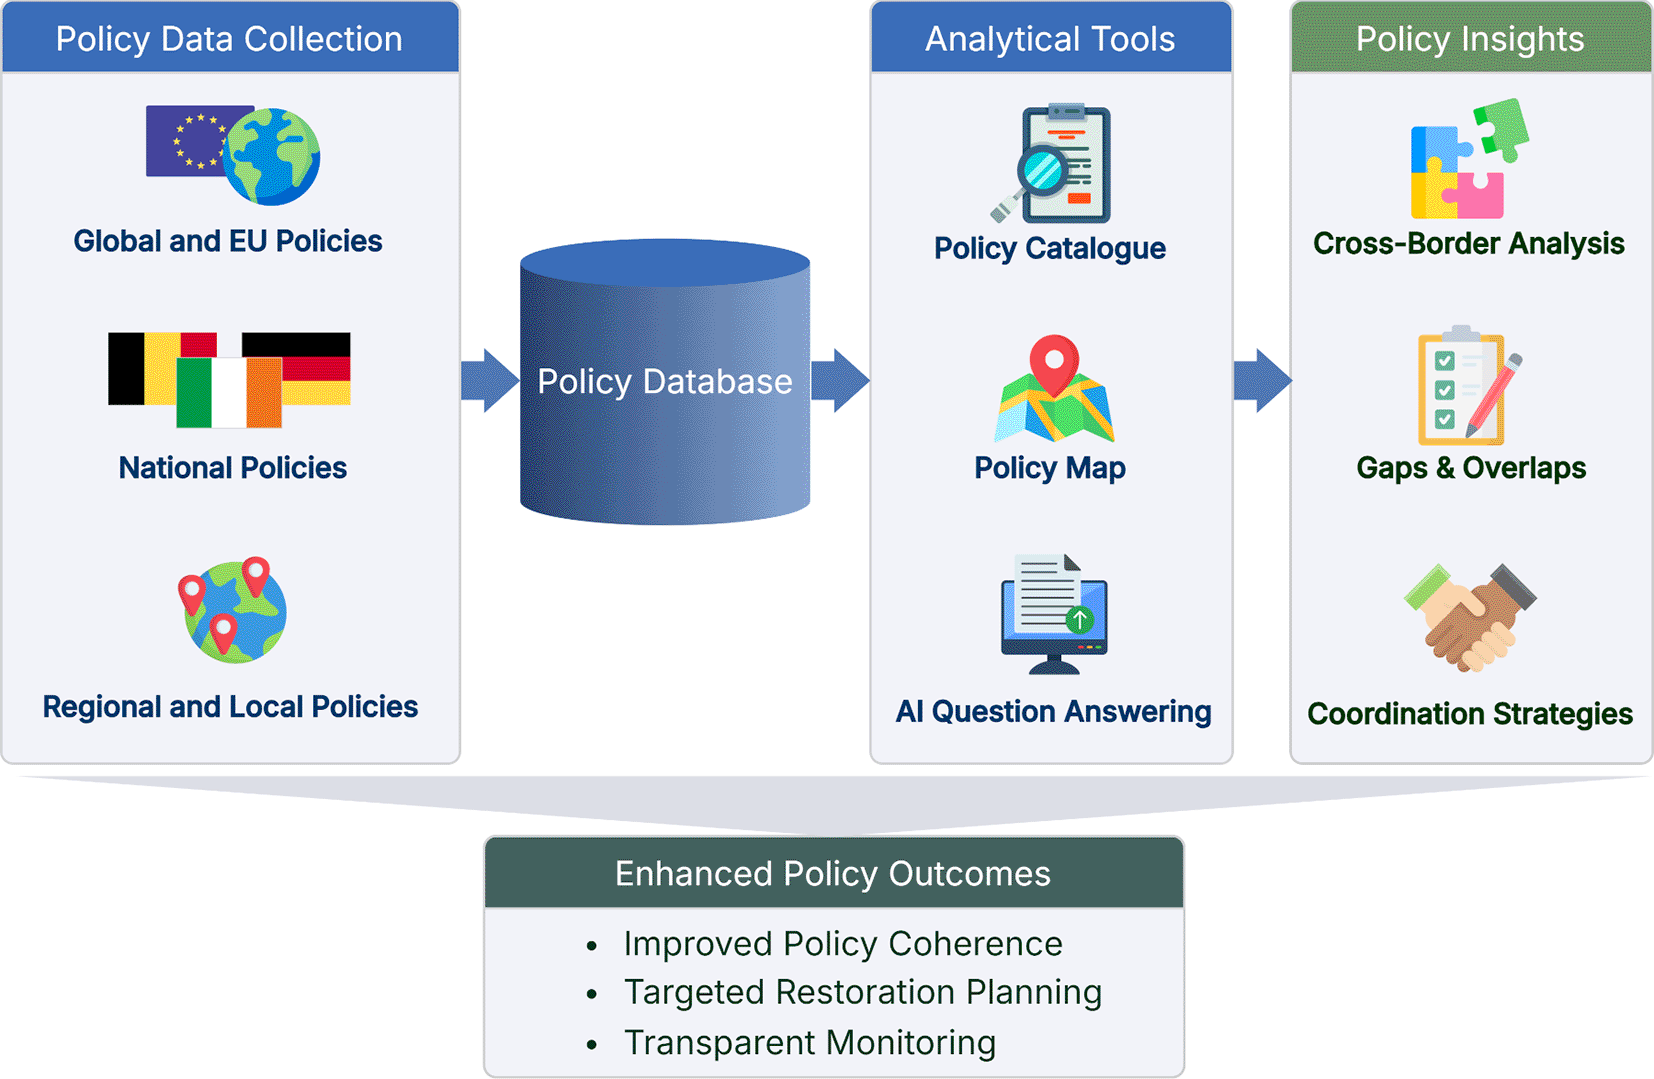
Figure 1. A diagram outlining the contributions of the European Peatland Policy Portal and its intended impacts.
The project perspective
The EU LIFE Multi Peat project (2021–2026) is the result of the urgent need to address the climate crisis and contribute to reaching national and global targets of carbon emissions reductions. A consortium of partners from peatland rich countries --Poland, Germany, Netherlands, Belgium, and Ireland-- united to rewet and monitor degraded peatlands, promote the exchange of knowledge in key aspects of peatland restoration, and explore the driving forces that impact restoration at a greater scale.
We developed the European Peatland Policy Portal in the frame of this consortium to contribute to a more cohesive and integrated approach to peatland restoration through policy. Thus, the portal addresses policy and knowledge gaps as well as fragmented and conflicting legislations within and across European countries, which represent significant obstacles to larger scale restoration, hindering effective climate change mitigation initiatives.
The combined experience within the project consortium and its networks of navigating peatland policies and legislations to implement long-term peatland restoration was essential in creating the portal. Establishing a platform that hosts a Europe-wide peatland policy catalogue and various policy development tools that support policy analysis, including an interactive map of the peat soils of the EU and the UK, the portal will facilitate the development and implementation of integrated approaches, as well as improve the knowledge base for governance of peatlands and restoration initiatives.
Portal mission and intended audience
The portal works with data providers to gather and display data relating to the most important policies affecting the protection, restoration and management of peatlands at regional and transnational level. Through this, it provides a useful cross-referencing tool for evidenced-based policy development. In addition, the platform showcases examples of peatland protection and restoration activities, highlighting enabling factors as well as challenges in implementation.
The portal promotes evidence-based policy development and supports integrated restoration across regional and transnational levels by engaging a wide array of stakeholders. These range from direct decision-makers, such as politicians and public servants, to indirectly involved actors like researchers, journalists, and lobby groups. To maximize utility for these key users, the platform ensures that all data remains accessible, reliable, and user-friendly, with a commitment to regular updates.
The portal helps key users understand regional and national differences in peatland policies, identify best practices of policy development, and obtain ideas on how to improve policies. Additionally, the portal addresses actors that seek to develop or engage in different peatland projects, including non-governmental organisations (NGOs), government bodies, private landowners or fund holders, by presenting, among others, best practices, funding opportunities, and actor networks. Further, the portal provides tools that help users estimate the financial viability of peatland restoration initiatives, calculate GHG emissions before and after rewetting scenarios, as well as tools that allow them to compare peatland data, like peatland cover across regions and countries.
Related resources and work
Policy portals
The portal’s Policy Catalogue draws inspiration from EUR-Lex[1] and Carbon Gap’s Policy Tracker[2], which both have created centralised repositories of policies from scattered sources. EUR-Lex, created and maintained by the Publications Office of the European Union, is a multilingual repository of EU legal documents which presents users with the ability to explore not only the documents, but their metadata and connections to other documents as well. While the site is mostly focused on international law, it does include the texts of national transposition measures for some member states, and includes references to both national transposition measures and national case-law related to EU law. This repository is a complete, regularly-updated record of EU-level legal documents, but national and subnational policies are out of its scope.
Carbon Gap’s Policy Tracker, with a focus on policy topic rather than level, aims to enable the systematic assessment and comparison of carbon dioxide removal (CDR) policy environments in different countries around the world. The tracker provides a collection of national policies concerning CDR, country-specific profiles of the CDR policy landscape, and the site’s own determinations of best practice in the area. Like our portal, this resource records national policies, but it does not include sub-national policies; there are also minor overlaps in our policy datasets since healthy peatlands’ carbon sequestration capacities make peatland restoration a topic of interest for CDR.
The UK R&D Policy Toolkit[3], though it focuses on research and development policy instead of peatlands, also aligns with our portal in its mission to provide resources, tools, and evidence for policy development.
Spatial policy analysis
The interactive Peatland Policy Map introduces a new paradigm for applying geospatial analysis in the policy domain. In policy contexts, spatial analysis is most often used to understand data when defining a problem or opportunity,11,12 to determine optimal policy solutions by predicting the effects of proposed actions,13,14 or to evaluate policy impacts.15,16 Reinvestment Fund’s Policy Map[4] provides interactive maps and data analysis tools for these sorts of policy-oriented spatial analyses, focused on statistical geospatial data. In contrast, the portal’s policy map tool enables spatial analysis of policies themselves; by assigning each policy a geometry based on its administrative extent, the tool provides spatial visualisation of the policy landscape, showing all the policies across departments and administrative levels that affect a single coordinate.
AI for policy analysis
The portal’s RAG-based Question-Answering tool follows a growing trend of integrating AI into public policy research through both analytical17–19 and generative20–23 machine learning methods, specifically natural language processing (NLP). Policy Bot, of Nagarajan et al. (2025), receives a policy document from its user and provides question-answering in a dialogue format, drawing its responses from the policy document’s text using retrieval-augmented generation.21 While the portal’s RAG tool does not operate in a dialogue format, it does generate its responses by drawing from the hundreds of policies in the portal’s policy dataset, and its generated text response is accompanied by the policy documents used to create the response, ranked for contribution. This added explainability addresses a key concern of the trustworthiness of incorporating generative AI into public administration.24
The European peatland policy dataset
The project first began to address the fragmented nature of the peatland policy landscape by gathering all the contemporary peatland-affecting policies of Europe into one central collection. Policy documents were collected according to the following guidelines, and were recorded with additional metadata for later filtering and display in the portal’s Policy Catalogue.
Dataset curation
The discovery and annotation task for building the European peatland policy dataset occurred in three phases.
Phase I
In the first phase, approximately 100 policies were collected from workshops with policy researchers in the Multi Peat project’s partner countries, as well as found by searching Google for country names and “peatland” or broad categories like “biodiversity”. These policies and their annotations were added to a database in the portal’s content management system, Odoo[5].
Phase II
The second phase of discovery and annotation centred around national adaptations of EU-level directives, regulations, frameworks, strategies, etc. The collection process began by conducting a keyword search—“peatland” and “peat” especially—on EUR-Lex to find documents relevant to peatland conservation and peat or peatland use. After internal discussions and consultation with subject experts, the process identified 19 key EU laws and strategies which became the 19 sets of keywords used in the rest of the second phase, as can be seen in
Table 1.
Table 1. List of the 19 keywords or keyword sets drawn from key peatland-affecting EU laws and used to search for national implementations.
| Habitats directive | Soil strategy |
| Natura 2000 | Nature restoration regulation/nature restoration law |
| Biodiversity strategy | Environmental impact assessment/EIA |
| Forestry strategy | Farm to fork/food system |
| Common agricultural policy | Land use, land use change, and forestry/lulucf |
| Birds directive | Carbon removals certification/crcf |
| Methane strategy | National energy and climate plans/necp |
| Water framework | Renewable energy/red iii |
| Taxonomy regulation | Methane strategy |
| Climate-adapt
| |
In the continuation of the second phase, policy researchers used the keywords and their linguistic equivalents to search for relevant national or subnational policies in EU member states or the UK. After first identifying a document from the keyword search, the next step was to determine its eligibility to be added to the dataset.
Except for a handful of special cases, the core requirement for an item to be included was that it contained the word “peat”, “peatland”, or “wetland” either in English or in the policy’s original language. For non-English materials, researchers used Google Translate to guide their policy exploration. Language barriers were a main limitation to how deeply or broadly researchers could explore a given country’s collection, but this method still functioned to give each country a relatively standardised starting point of peatland policies.
In addition to the keyword search, researchers also combed through government websites and local literature like EU project reports to ensure the collection of other prominent peatland-specific documents missed by the 19 keywords. The government websites of many countries have “site maps” that provide access to topical policy collections unable to be accessed by a general web search; these repositories became a core source for policy documents less prioritised in the algorithms of traditional search engines.
Finally, researchers also relied on the policy framework sections of policies immediately relevant to peatlands (e.g. a peatland strategy) to ensure they were not missing any additional documents pertaining to peatlands. The end of the second phase yielded a total of 405 policies across 27 countries and 22 languages.
Phase III
The final phase of policy collection is ongoing. Policies collected in this phase mostly come from workshops held with experts in different European countries, as well as submissions via the portal’s Policy Suggestion Form. Future work in AI may enable automatic updates of the policy collection when new documents are released, updated, or expired. A snapshot of the policy collection at the time of writing has been saved and archived on Zenodo.25
Guidelines and Criteria
The policy researchers developed and refined these guidelines throughout the first and second phases of the dataset creation:
• Policies in the portal database should ideally refer to “Peat”, “Peatlands” or “Wetlands” or translations or synonyms of these words in the native language of the policy; however, a case can be made for those policies which do not contain the words but may potentially have an impact on peatlands.
• Policies must be democratically approved by one of the following: the United Nations, the European Union, a government of an EU member state or an associated country within Europe, including officially-recognised, elected, national, regional, and local governments. This includes policies that are approved by individual conventions, ministries, departments or agencies which have been democratically mandated to act on behalf of the government.
• Policies must be in the form of a written document.
• Documents that are used primarily by the legal system to enforce the law should not be included in any list of policies on the portal as such documents relate to the enforcement of regulations and not to decision-making.
• When a policy is released with an official English translation, prioritise the English translation.
• Policies in the portal database should be categorised by one or more of the 8 categories in
Figure 2.
• Policies should be entered into the portal database with this additional metadata provided: Name of policy in English, Name of policy in original language, Administrative level, Beginning and end year of policy duration, Country (if national or subnational), Region (if subnational), Language of policy text, Keywords, Publisher, Link to the document PDF, Link to the policy page (if exists), Excerpt of text that proves peatland relevance (in English and in original language), Overview of policy from text or policy page (in English and original language), and Table of Contents (in English and original language).
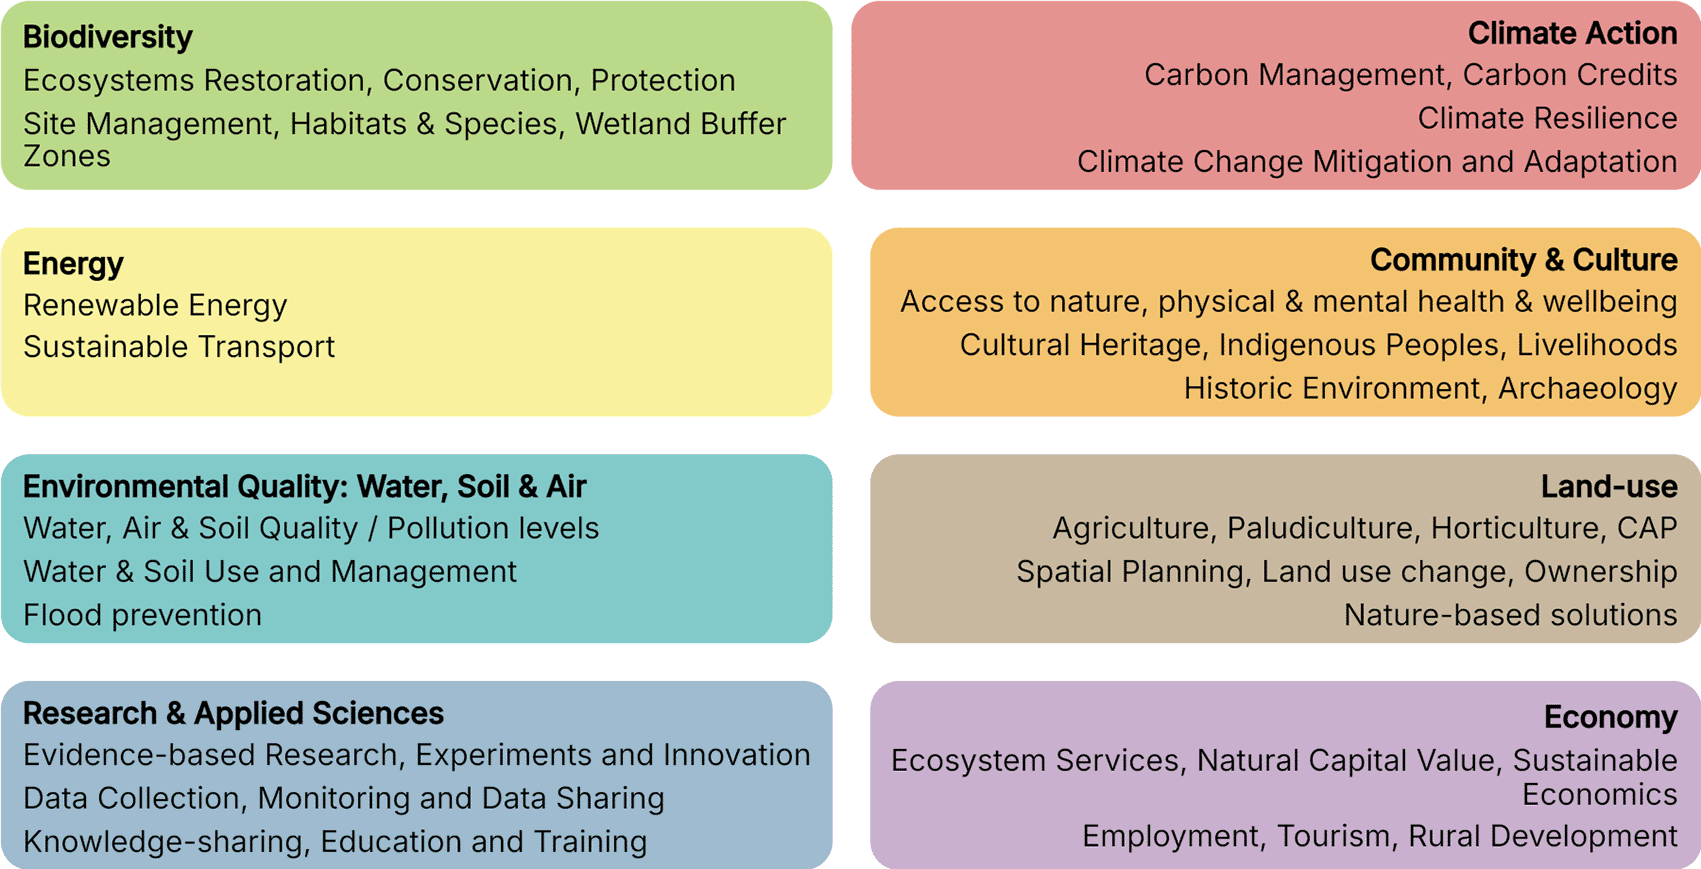
Figure 2. The names and definitions of the eight policy categories used to classify the policies of the European Peatland Policy Dataset.
Categories
The policy categories detailed in
Figure 2 were developed prior to Phase I by evaluating a selection of peatland-affecting policies for key themes. This analysis yielded eight core categories of policies relevant to peatlands. The policies are labelled with a single primary category, then all other relevant categories, allowing users to identify the main sectors engaging with peatlands in a given region.
Characteristics
As of this paper’s publication, the current collection of European peatland policies consists of 421 policy documents across 27 countries and 22 languages. The countries include all EU member states except for Malta, and include the United Kingdom. The languages include the 24 official EU languages except Irish and Maltese, and the languages additionally include French (BE) and Flemish for some regional Belgian policies.
Country composition
Figure 3 provides a visual illustration of the relative contributions of policies to the dataset from different countries. Germany has the most policies pertaining to peatlands, followed by Ireland, the Netherlands, Estonia, and the United Kingdom. Malta has no policies, but of countries with policies, Italy has the fewest, followed by Croatia. As can be seen in the Peatland Policy Map, these trends in policy coverage also largely align with a country’s relative peatland coverage.
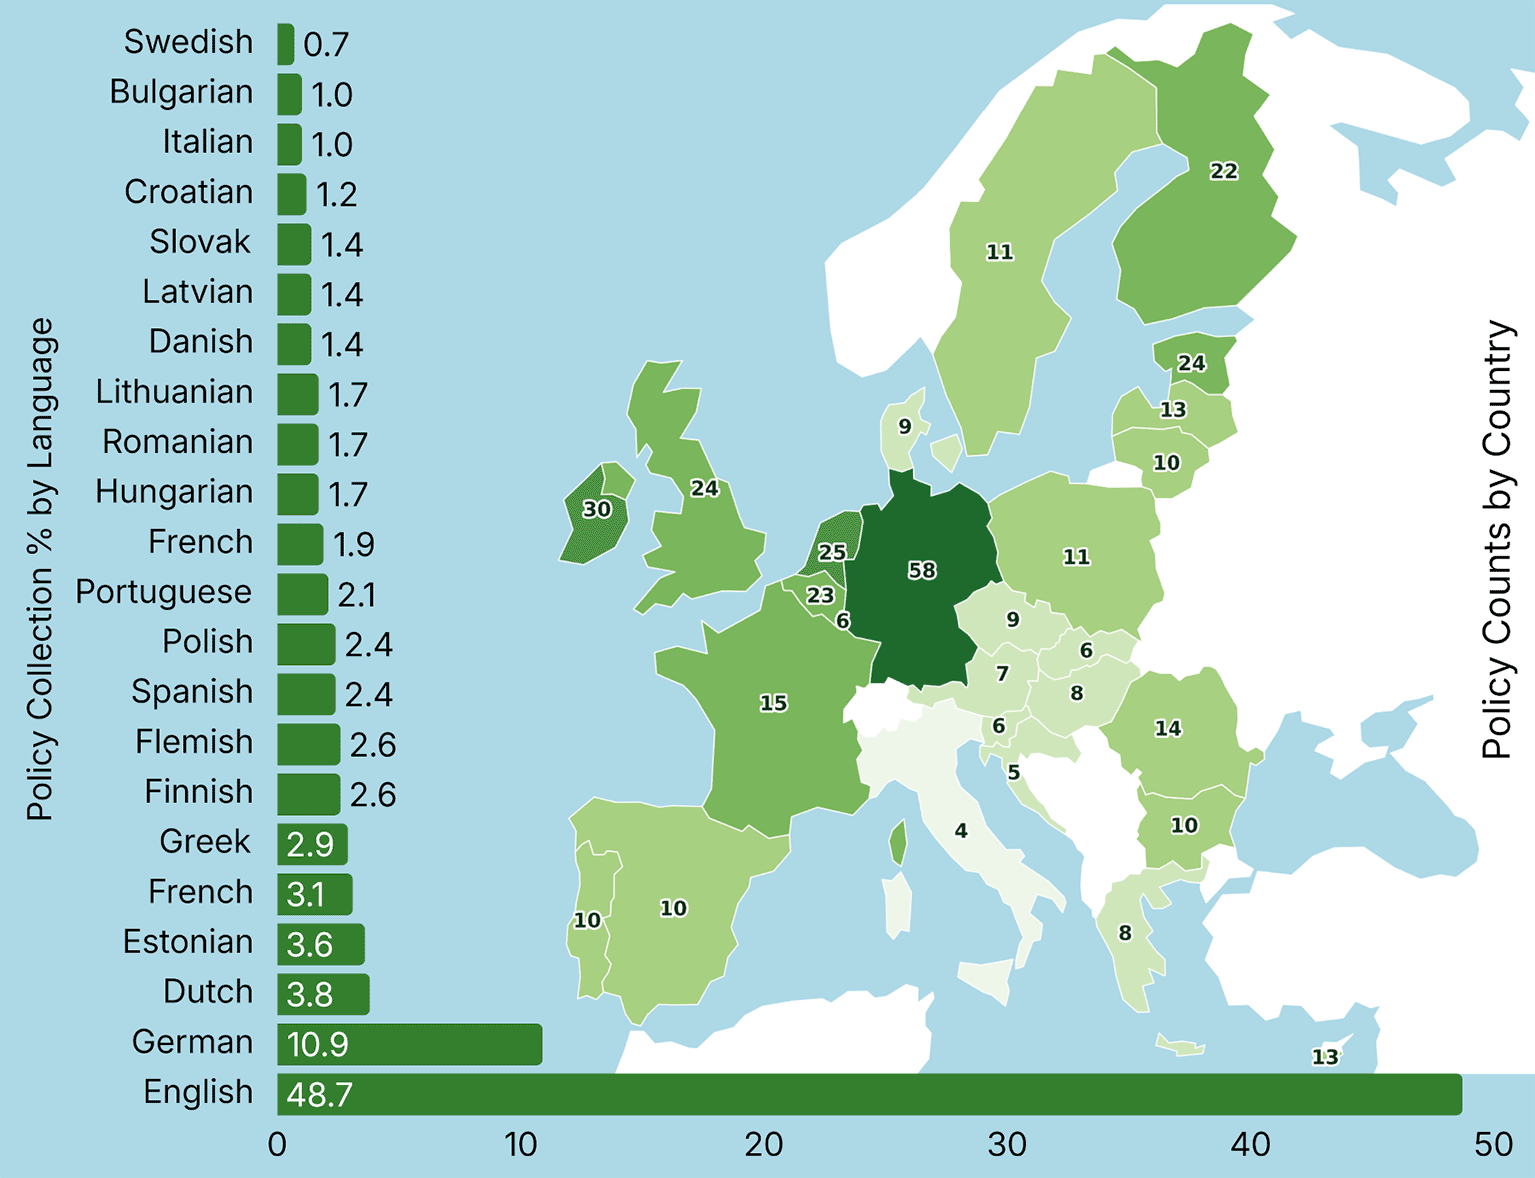
Figure 3. A visualisation of the European Peatland Policy Dataset using a bar chart to represent the number of policies for each language and using a choropleth map to represent the number of national and subnational policies for each country.
Language composition
Figure 3 additionally shows the makeup of the policy collection by document language. As researchers were directed to default to collecting the official English translations of policies when available, English is overrepresented in the dataset. Following English, German is the most common document language, correlating with the large number of policies from Germany in the dataset.
Governance level and category composition
The composition of the policy dataset by governance level and primary category is illustrated in
Figure 4. National policies represent the vast majority of the collection (75.8%) and are the dominant document type across most thematic categories. In terms of thematic distribution, “Land Use and Agriculture” is the most prevalent primary category (25.2%), followed by “Biodiversity” (22.1%) and “Climate Action” (19.7%). In contrast, certain categories show high specificity to governance levels: “Research and Applied Sciences” is exclusively derived from national policies, while “Community and Culture” originates primarily from local levels. These themes, alongside “Energy” and “Economy”, constitute the least frequent primary categories within the dataset.
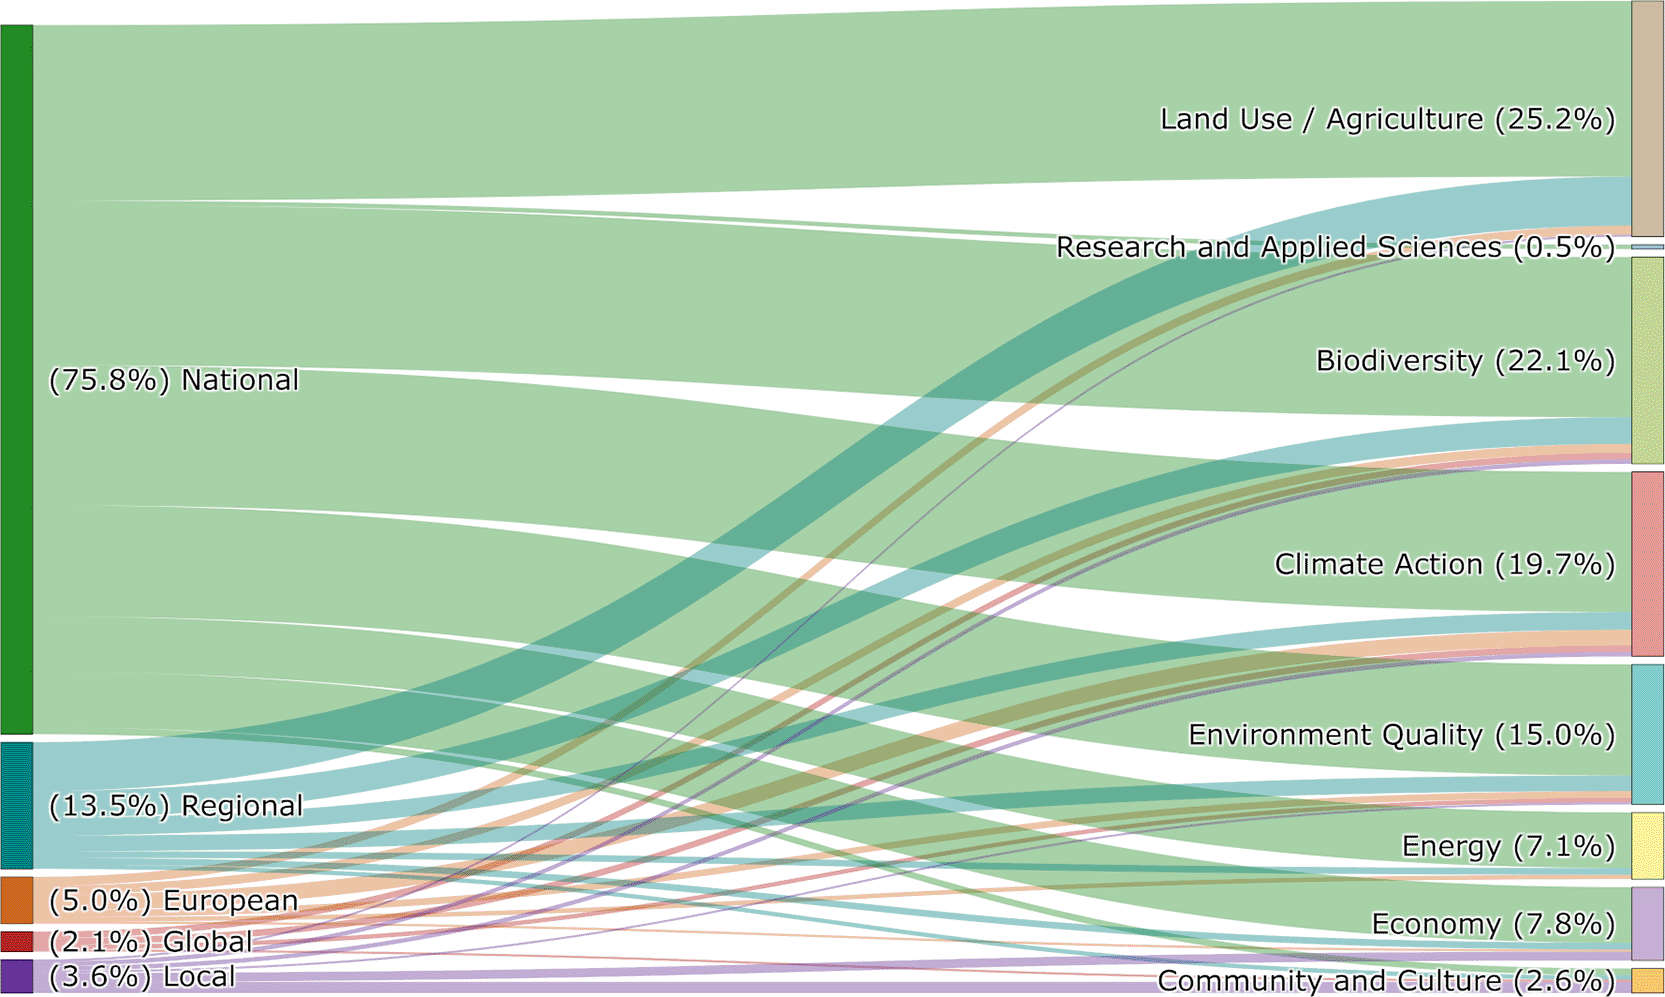
Figure 4. A Sankey diagram demonstrating the makeup of the policy collection across governance levels and primary categories.
Policy exploration tools
The goal of the portal was not just to compile these scattered policies, but also to provide useful interfaces for policy researchers to explore the dataset. This resulted in the project producing three main avenues of interaction with the collection: first, a simple tabular interface for viewing and filtering the policies, as well as more-detailed policy profiles for each document; next, a map interface which shows the peatlands and peat soils of the EU and, with the click of a mouse, reveals all the policies that affect a single point; and finally, a RAG-based question-answering tool built on the full texts of all the policy documents, allowing users to ask questions and receive responses alongside the source documents of each answer.
Policy catalogue
The Policy Catalogue provides a structured, tabular interface for exploring the European Peatland Policy Dataset (
Figure 5a). The collection is filterable by country, level, and category, as well as searchable. Each policy additionally has its own profile page with more detailed overviews of the policies including the original PDF document and contribution mappings to both the EU Green Deal’s goals and the UN’s Sustainable Development Goals (
Figure 5b).
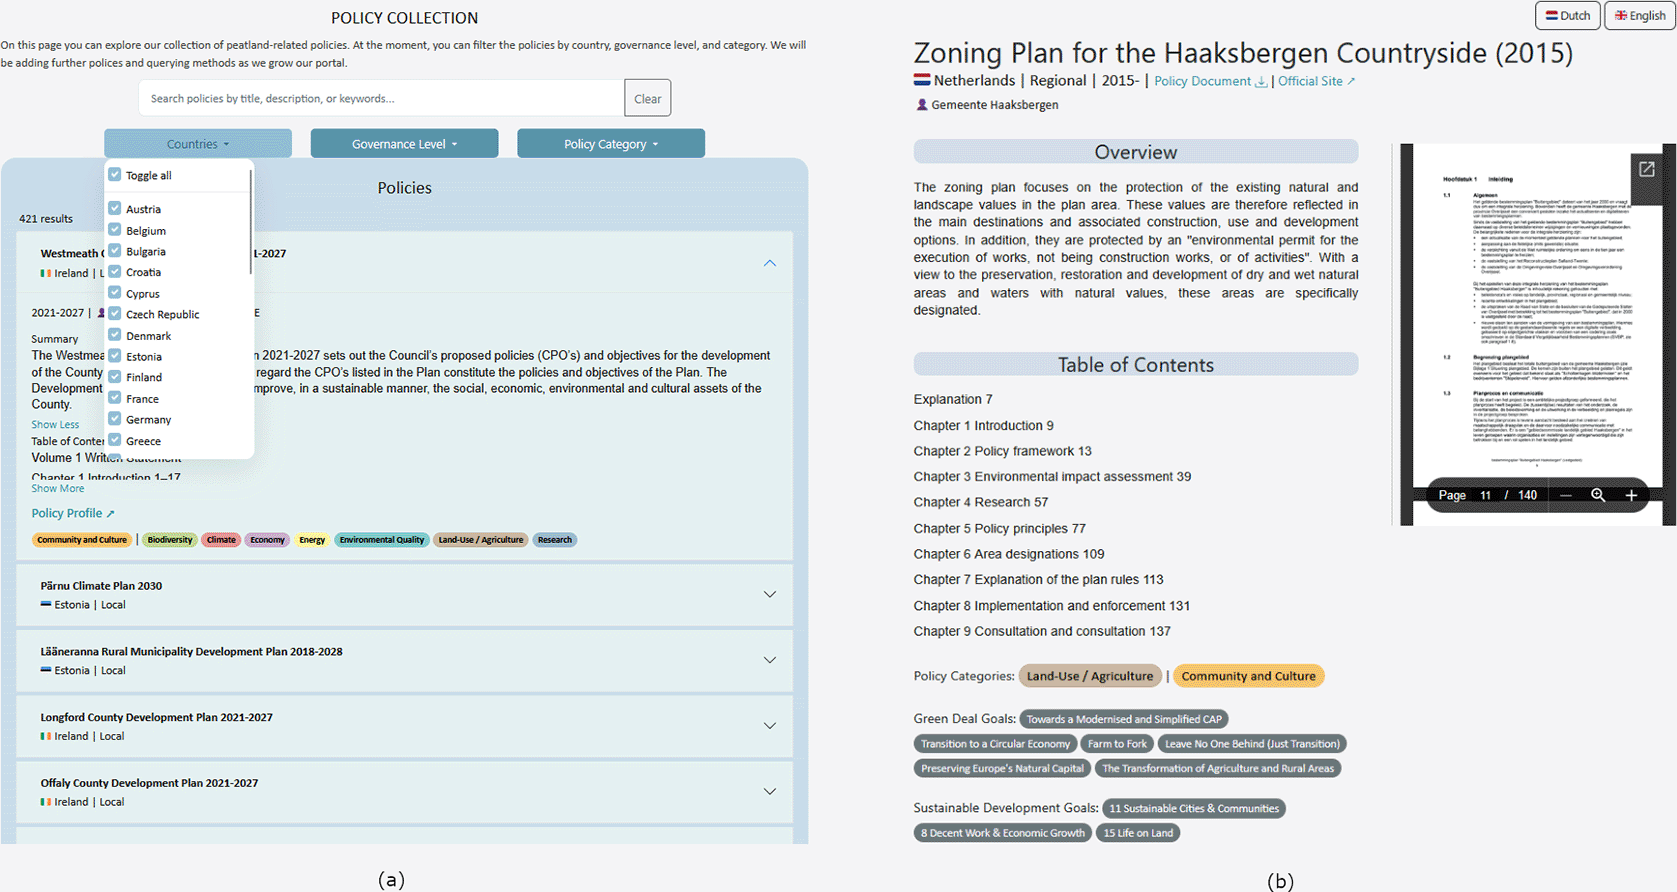
Figure 5. The portal’s Policy Collection page.
(a) The page’s tabular list view of all policies, searchable and filterable by country, governance level, and category. (b) An example of the profile page view for each policy, containing any additional information and resources recorded in the dataset.
The design of this interface is typical for policy research: lists of policies with a few key details included like Title and Location; filters for location, level, and category; a search function matching titles and overview text to find relevant documents. The portal presents the policy dataset in this format to streamline the most common policy discovery tasks. Though created with policy researchers in mind, the page’s design is simple enough to help any user explore the catalogue.
Peatland policy map
While a catalogue structure is the traditional way to explore a policy dataset, the portal’s Peatland Policy Map provides a spatial view of the peat soils and peatland policy landscape of Europe. This tool allows any user to explore which policies affect which peatlands, and provides policy researchers with unique insights into the peatlands requiring policy attention.
Figure 6 provides an example of the interface when a point on the map has been selected.
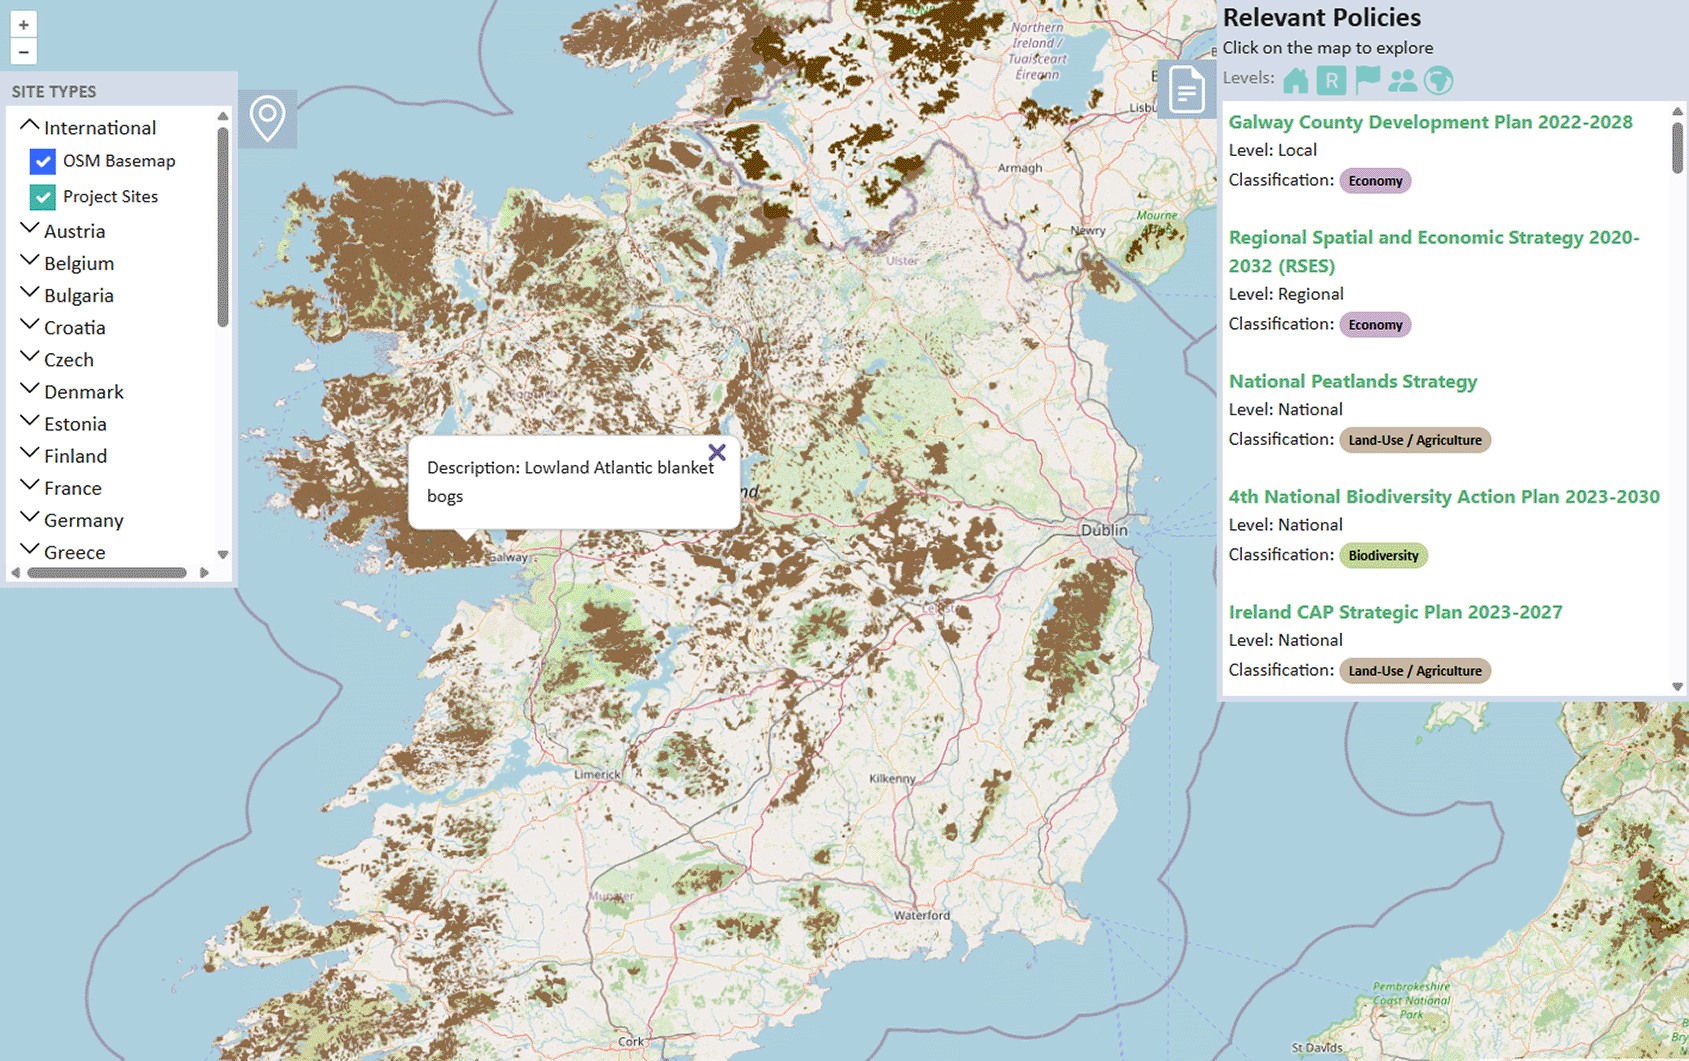
Figure 6. The Peatland Policy Map enables hyper-local spatial analysis of the policy landscape alongside visualisations of recorded peatlands.
The peatland polygons
There is no official, complete map of the peatlands of Europe, largely due to persistent lack of a standardized definition of what constitutes a peatland,26 as well as the lack of a targeted effort throughout Europe to record peatlands in a unified, systematic way. Tanneberger et al. (2017) produced a peatland map of Europe, estimating peat soil coverage from various types of national datasets and proxy variables,1 and more recently Tegetmeyer et al. (2025) released the European Wetland Map (EWM), also pieced together using national datasets with differing types of data sources.27 Our peatland map of Europe also follows in this vein, using national datasets of peatlands if they exist,28 otherwise using sources like general soil maps or topographic databases. When the EWM was released, the portal updated some of its national peatland maps to use the EWM data, filtering it to only include wetlands specifically designated as “peatland.” A full list of the source datasets and their transformations can be found on the portal[6].
Initially, the map included polygons for countries from the CORINE Land Cover (CLC)[7] dataset of the EU’s Copernicus Programme, filtered to only include class 412 “Peatbogs.” We removed this polygon, however, due to its low resolution and its exclusion of converted peatland soils to other land cover classes (e.g. forest, or grassland).
When a user selects a peatland on the map, a small pop-up displays information about the chosen polygon. Due to a lack of cohesive structures across peatland datasets, the information fields provided in the pop-up differ across data sources and even between countries of the EWM. Despite this, most polygons will include the type of peatland present; though the terminology may vary, this is still useful information for policymakers aiming to target specific classes of peatlands.
The Policy Polygons
While the policy polygons are invisible to the user during navigation, they serve as the underlying spatial triggers for the map interface. By georeferencing national and sub-national policies to the territorial boundaries of their respective regions, the portal defines each document’s specific geographic extent. When a user selects a coordinate on the map, a sidebar populates with all applicable policies, organized in ascending order of governance level: local, regional, national, EU, and finally, global policies. This hierarchical display, combined with integrated filtering tools, allows researchers to isolate specific administrative levels or thematic categories to analyse the multi-layered regulatory environment of a single point.
This method of exploring the policy landscape spatially is impactful especially in investigating the conflicts noted in.4 Further, as peatlands are ecosystems which do not respect administrative boundaries, this spatial visualisation is also useful for identifying gaps where policies are only in force for one small region of a peatland ecosystem. Ultimately, the goal of this tool is to help policy researchers to understand the peatland policy landscape in a given area and identify policy conflicts and gaps to be addressed.
RAG Question-Answering
The final method of interaction with the policy dataset is in the form of an AI Question-Answering tool. Any user can interact with the tool by submitting natural-language questions about peatland restoration policies in any major European language, without requiring prior knowledge of the original policy language or jurisdiction (
Figure 7). Upon receiving a query, the system retrieves and analyses relevant evidence from a curated collection of EU- and UK-level peatland policy PDFs, generating a response that is explicitly grounded in the source documents. This approach addresses the phenomenon of hallucinations in large language models (LLMs), where models generate plausible but incorrect content.29 RAG’s use of the retrieval step forces the LLM to constrain its generated response to the evidence in its library, increasing the reliability of the model.30 The generated answer is accompanied by transparent citations and a ranked list of the most relevant policy documents, enabling users to verify the provenance of each claim and explore the underlying legal or strategic texts directly.
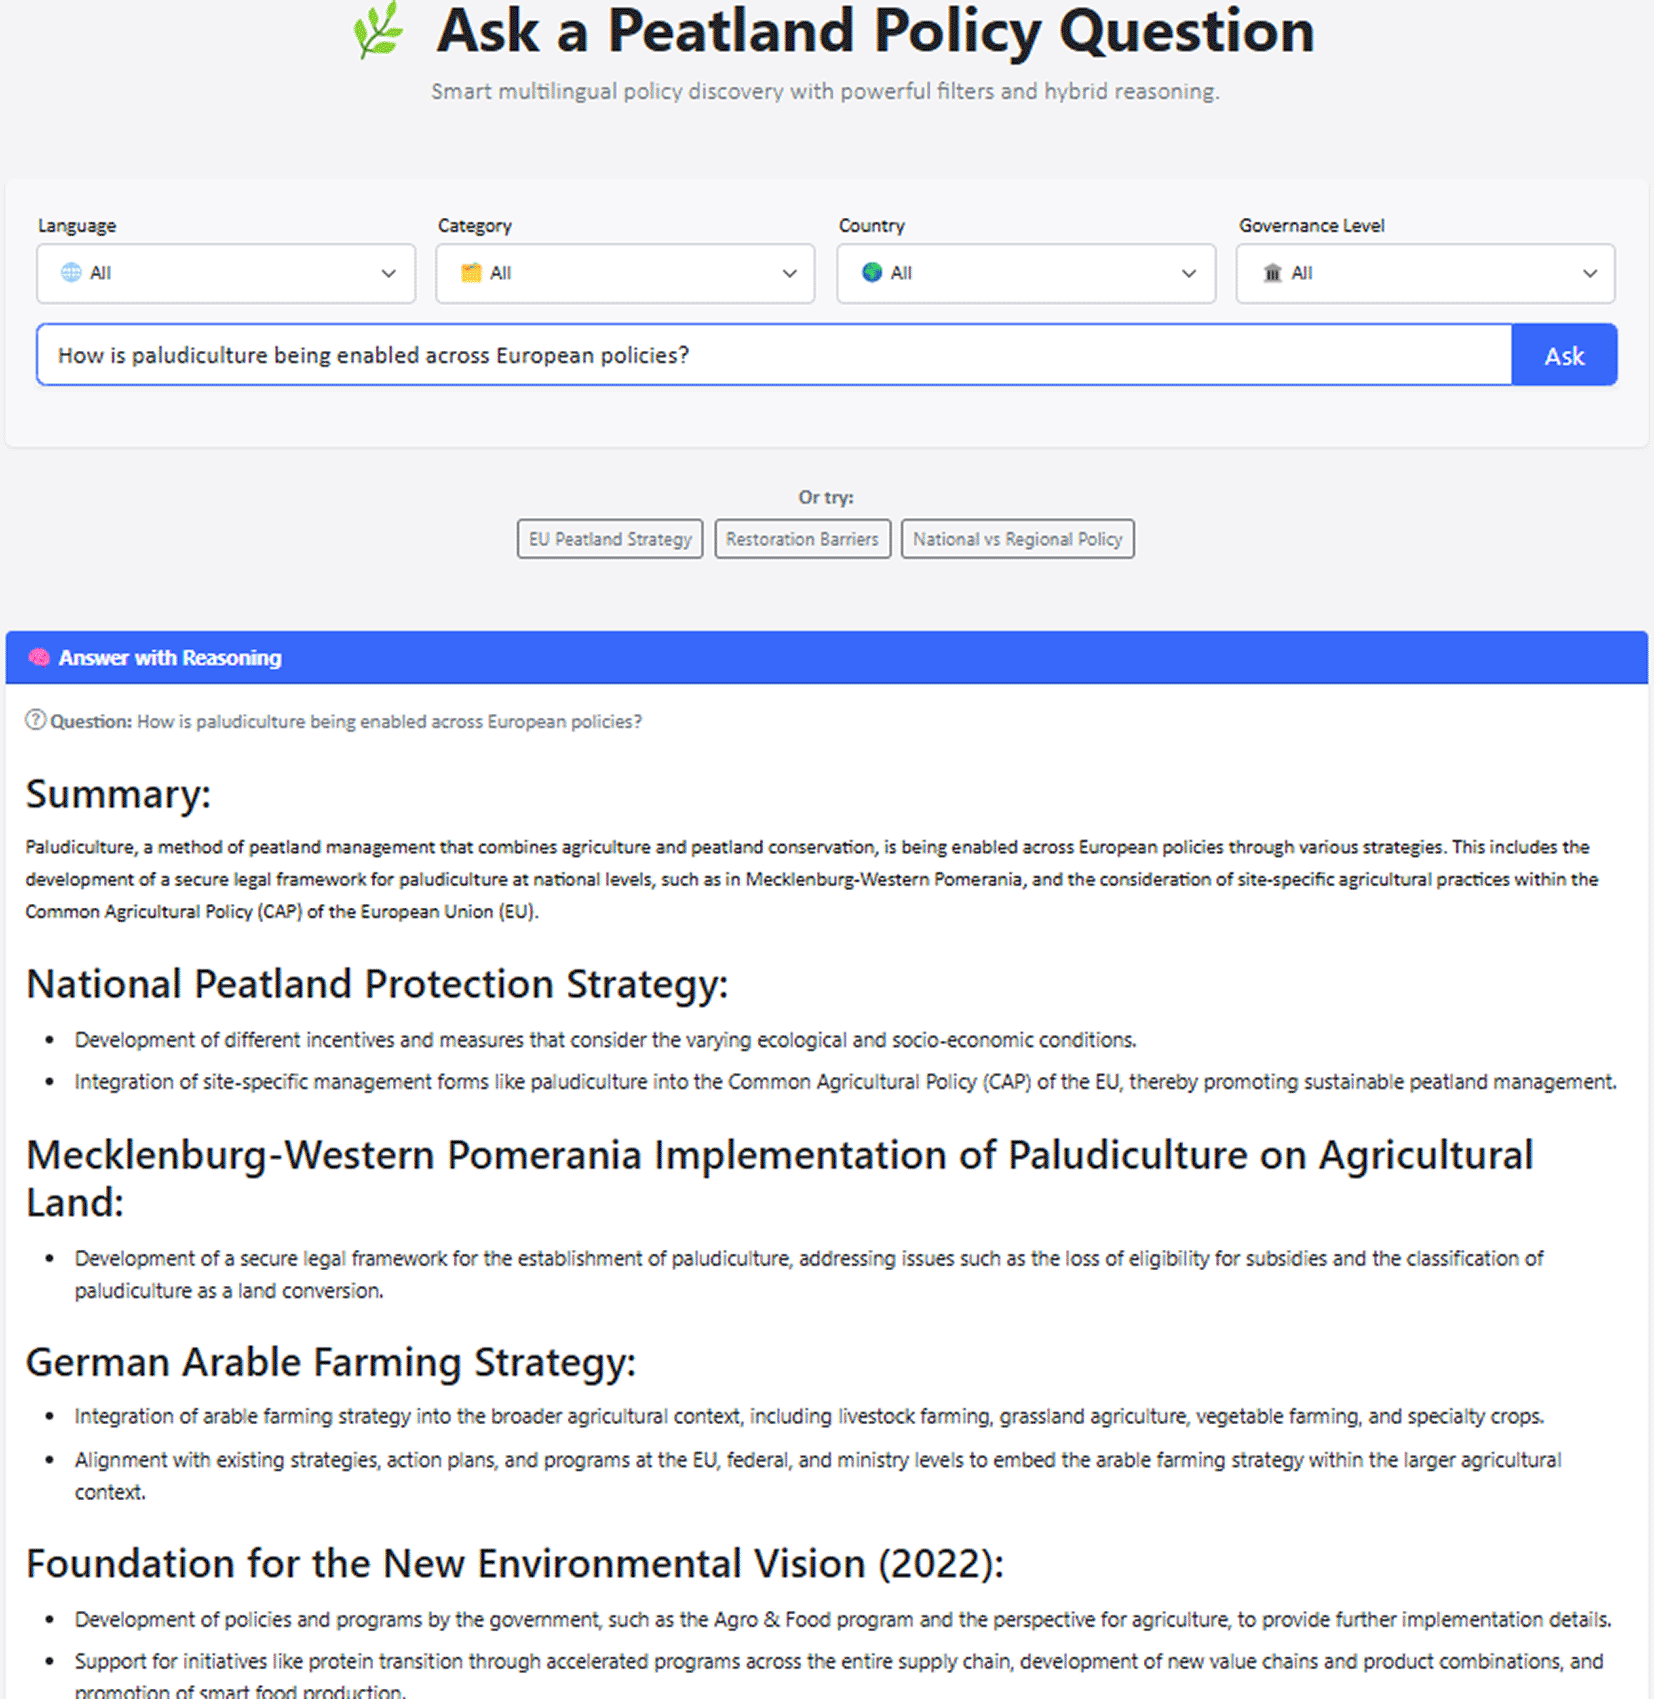
Figure 7. The RAG-based question-answering tool allows users to query the entire policy dataset and receive both a response and sources in seconds.
Beyond basic question answering, the system provides fine-grained control over the retrieval scope through metadata-based filtering. Users may refine the policy dataset used for answering by specifying constraints such as governance level (e.g., EU-wide directives, national strategies, regional plans), policy language, or country of origin. These filters are applied consistently across both dense semantic retrieval and lexical search components, ensuring that only contextually and jurisdictionally appropriate documents contribute to the final response. This capability is particularly important in peatland governance, where similar policy goals may be articulated differently across countries, languages, and regulatory levels.
Together, multilingual querying, hybrid evidence retrieval, explicit citation, and user-controlled filtering allow the AI tool to support trustworthy, transparent, and context-aware policy discovery. The system is designed not only to answer questions, but also to assist researchers, policymakers, and practitioners in navigating complex, multilingual policy landscapes while maintaining traceability to authoritative sources.
Qualitative evaluation
We provide two example questions and responses from the tool's development stage in
Table 2, as well as a judgment of the answer by a restoration worker. The questions were asked in German and the response was given in English at the time, but feedback led us to refine the model so that responses are given in the same language as the question.
Table 2. Sample questions, responses, and evaluations of the RAG tool in its development phase.
| Question 1 |
Question 2 |
|---|
| Wie hoch ist der anteil der bewaldeten Moore in Deutschland? [What percentage of Germany’s peatlands are forested?] | Gibt es anreizprogramme für renaturierung für bewaldete moore in deutschland? [Are there incentive programs for the restoration of forested bogs in Germany?] |
| Answer: The provided documents do not contain specific information about the percentage of forested peatlands in Germany. National Peatland Protection Strategy (nationale_moorschutzstrategie_-bf.pdf
) Most peatlands in Germany are drained and heavily polluted with nutrients. More than three quarters of these areas are used for agriculture or forestry. National Strategy on Biological Diversity 2030 (NBS 2030) (nbs_2030_strategie_bf.pdf
) Natural and semi-natural peatlands are rare in Germany. Almost all intact high moors are protected, while low moors are only partially protected. | Answer: Yes, there are incentive programs for the rewetting and sustainable management of peat soils used for forestry in Germany. This is part of the National Peatland Protection strategy. The Federal government supports projects with the Waldklimafonds, which can fund model projects to protect, conserve, and rehabilitate moors in forests and forested moorlands (Section 3). Additionally, the Federal Action Plan on Nature-based Solution for Climate and Biodiversity also mentions the preservation of smaller wilderness areas, including forests and peatlands, as part of its plan (Section 9). However, it is important to note that the specific details about these programs, such as eligibility criteria and funding amounts, may vary and can be found in the respective policy documents. |
| Sources: National Peatland Protection Strategy (nationale_moorschutzstrategie_-bf.pdf
), National Strategy on Biological Diversity 2030 (NBS 2030) (nbs_2030_strategie_bf.pdf
) | Sources: Section 3 of National Peatland Protection strategy (nationale_moorschutzstrategie_-bf.pdf
), Section 9 of Federal Action Plan on Nature-based Solution for Climate and Biodiversity (ank_publikation_en_bf.pdf
) |
| Evaluation: Off-topic
| Evaluation: Very good |
The response to Question 1 was judged as off-topic, however this prompted a discussion of the scope of questions that the tool should be able to answer. Question 1 was not relevant to policy or the policy documents used to create the response, and instead was a specific factual question. Rather than limit the scope of questions to the policy domain, we expanded the RAG tool’s utility by developing a novel fact injection method.31 This feature enables the system to detect purely factual queries and retrieve answers from the curated factsheets detailed in the “Area Information Pages” section. This hybrid approach allows the portal to handle both broad factual inquiries and specific policy questions, such as the inquiry regarding incentive programs in Question 2, which yielded a highly accurate, referenced response. Additional examples of questions asked to the tool and subsequent user feedback were collected and are available on Zenodo.32
Additional tools
The aforementioned tools are the core contributions of the portal to the area of policy analysis, but the portal has additional tools aimed at other specialisations which still offer useful evidence and reference for policy researchers.
Project catalogue
The Project Catalogue showcases the portal’s collection of European peatland projects. While the vision is for the catalogue to encompass projects down to the local level, the first stage of building the collection has focused primarily on peatland-affecting EU LIFE projects from the last 15 years.
The portal defines its peatland projects of interest to be those which are concerned with practical restoration, conservation, and monitoring of peatlands. This includes projects ranging from drain-blocking, a common method of rewetting peatlands, to paludiculture, a new agricultural practice of wetland farming on rewetted peatlands. Most peatland restoration projects receive financial support from governmental institutions, often through a funding mechanism from a policy or national implementation of an EU directive. The EU LIFE program that funds the majority of projects in the catalogue is managed by the EU’s European Climate, Infrastructure and Environment Executive Agency (CINEA)[8] which manages the grants that fund projects to support the goals of the EU Green Deal. This project collection can provide policymakers with examples of practical solutions and actions to include in their policy proposals for supporting peatlands.
The catalogue interface itself, as seen in
Figure 8a, is a simple tabular structure like the Policy Catalogue. Each project entry contains the project title and official project code in a simplified information view, with dates of operation, partner countries, project site names, and a link to the project page available upon selection of the project.
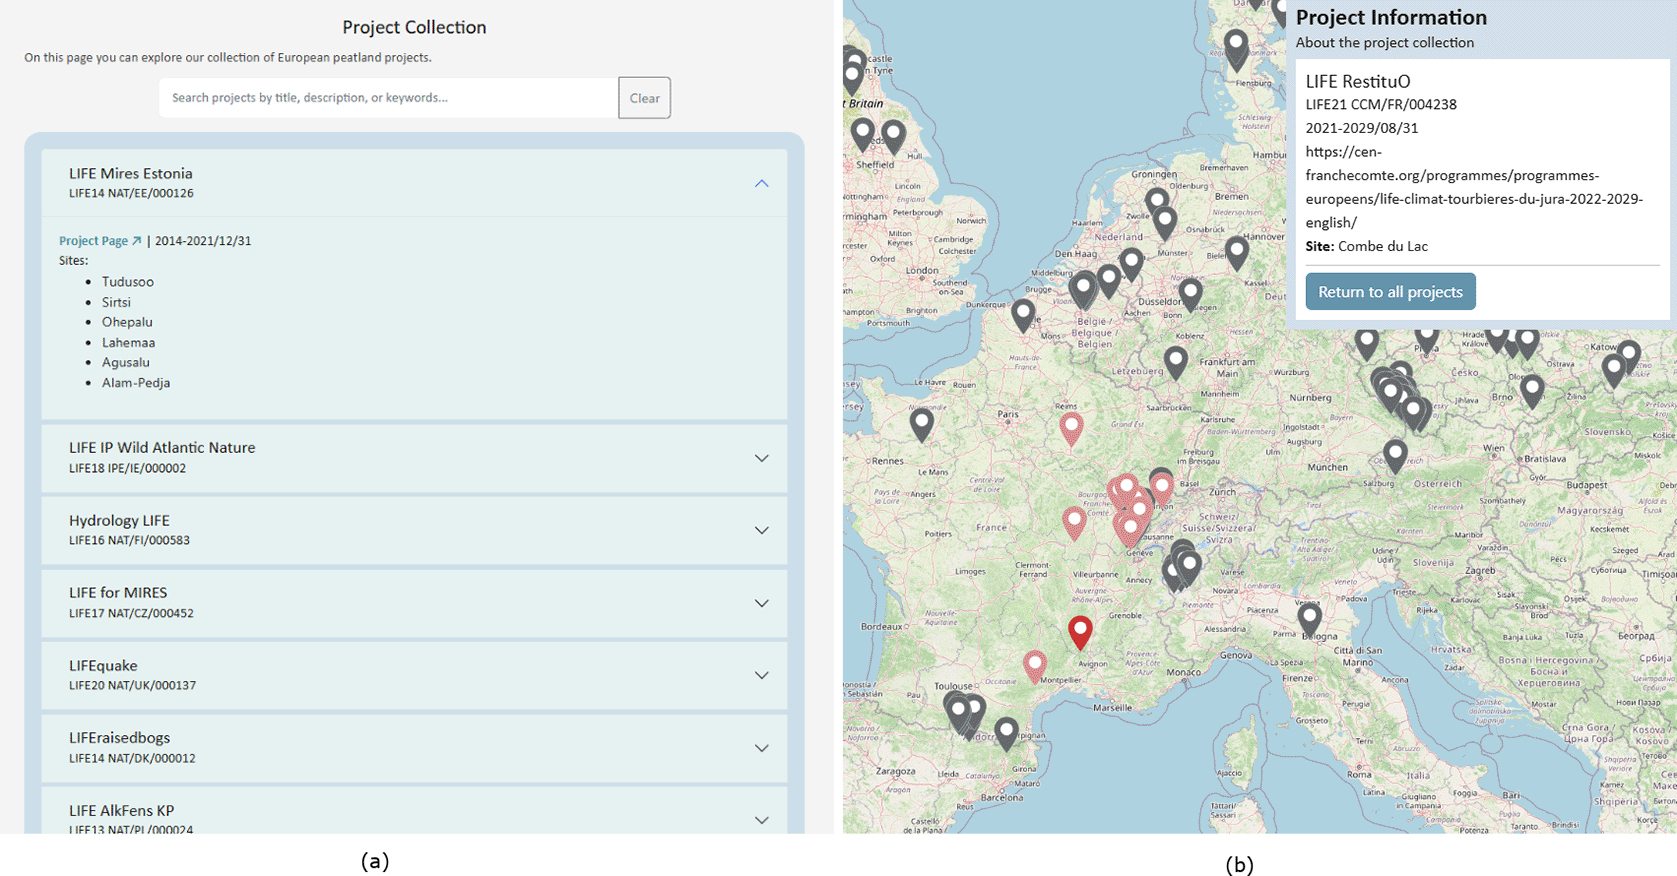
Figure 8. The Project Catalogue page.
(a) The tabular list view of all projects, searchable and filterable by country. (b) The map display of projects across their various sites.
Project map
The Project Map provides a spatial representation of the peatland project landscape in Europe. This view of the project collection allows policymakers to see where projects are occurring, identify gaps in project coverage, and examine the diversity of projects active within their own administrative regions.
This map, like the Peatland Policy Map, uses OpenStreetMaps as its basemap, then displays all project sites from the catalogue distributed geographically. Projects may have more than one site in more than one country, so the sites for each project all appear on the map first as grey location icons, accompanied by a sidebar which lists all projects.
Selecting a project site on the map triggers a dynamic visual query: the chosen icon transitions to red, while all associated sites within that project are highlighted in pink to indicate their connection. Simultaneously, the sidebar populates with detailed project metadata, including operation dates and partner countries,. This interface allows users to evaluate specific site data while maintaining a visual overview of the project’s broader geographic footprint, facilitating a better understanding of multi-site restoration initiatives. This view is provided in
Figure 8b.
Area information pages
The portal provides area information pages in the form of country or region-specific factsheets containing information about the peatlands, projects, and most important peatland policies in that area. These pages allow users from any domain to get an efficient, informed summary of the peatland and policy landscape for a given area.
The peatland facts provided include an area’s total peatland coverage, and of that, its natural, cutover, forested, or agricultural peatland coverage. As definitions of peatlands vary however, even within countries26 and between organizations reporting different values of each type of peatland coverage, the portal is scrupulous in its fact management. Instead of arbitrarily choosing one correct value of peatland coverage, the area information pages instead provide any reliable figures, if they exist. Alongside the value and unit for a certain statistic, the page also provides a link to the source and the date of the fact’s publication (
Figure 9a). This transparency allows users to see the range of values, definitions, and methods used in quantifying peatland coverage, and to decide for themselves which figures to use in their own work.
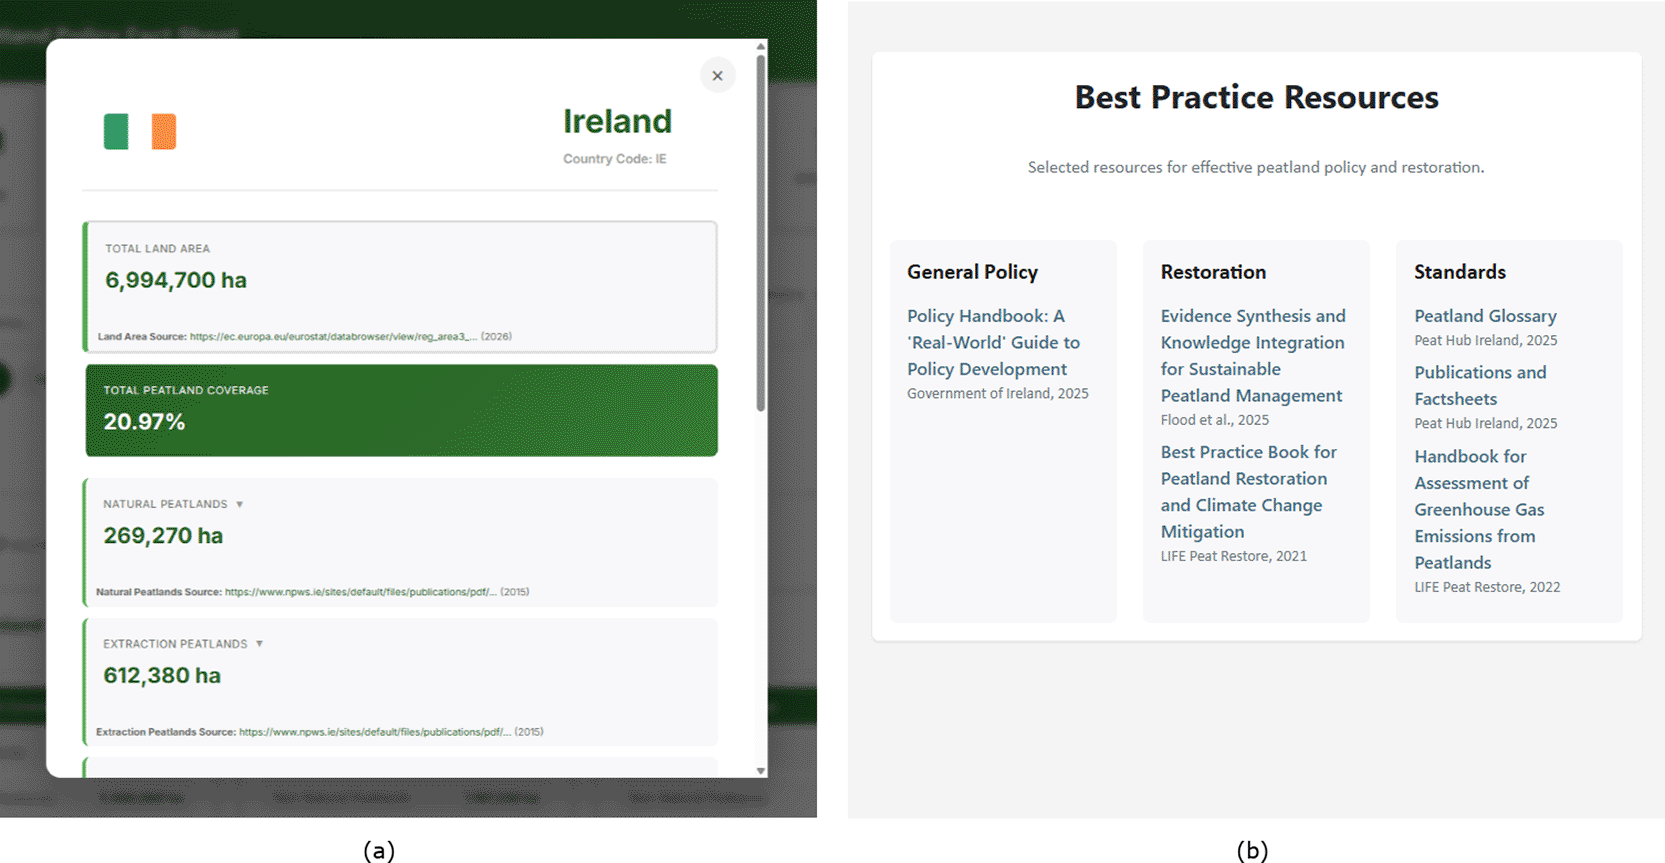
Figure 9. The portal’s general reference pages.
(a) Ireland’s Factsheet. (b) Best Practice Reference page.
The key policies in a factsheet are selected subjectively by policy researchers in the factsheet’s area, and are intended to be a simple overview of the most influential or notable policies in an area. Those users looking for the complete list of an area’s policies can filter the policy catalogue page to achieve that goal.
Best practice reference
The other general reference tool provided by the portal is the Best Practice Reference page (
Figure 9b). The page’s topics are separated into “General Policy”, aimed at policymakers looking for best practice in policy development, “Restoration”, for users interested in best practice for practical peatland management and restoration tasks, and “Standards”, to encourage researchers and experts in the peatland domain to work from centralised terminologies and measurement methodologies. The Best Practice Reference page is intended to grow as more users share their recommendations, with special attention given to the policy reports from EU projects.
Restoration calculators
The Restoration Calculators evaluate peatland restoration scenarios for efficacy and financial feasibility. These tools are mostly aimed at land managers and project managers, but they can additionally provide policy researchers with an understanding of the financial scope of restoration projects funded by EU policies. The tools were developed prior to the Multi Peat project, however their initial format made them inconvenient and uninviting for non-experts. The portal adapted these tools to an online format to make them accessible both in use and in comprehension.
Site emissions tool
The Site Emissions Tool, developed in the EU Interreg Carbon Connects project, uses the Greenhouse Gas Emission Site Types (GEST) methodology10 to calculate the estimated GHG emissions of a managed agricultural peatland both before and after a water level, crop, or other management change.33 This helps land managers predict the tonnes of GHG per hectare per year that would be saved by a proposed change in the peatland’s management, which is equivalent to the carbon credits that would be generated by the restoration. While the tool currently provides an adequate estimate, the GEST method is limited to measurements from sites in continental Europe; as such users are made aware that the application of this estimator outside this region may under or overestimate emissions. In the future, the tool will be updated to allow users to select their region for a more accurate estimate.
Figure 10a shows the tool and the information required for emissions estimation, including peat type and thickness, groundwater level and vegetation to determine the site type, management information including grazing animals and growing crops.
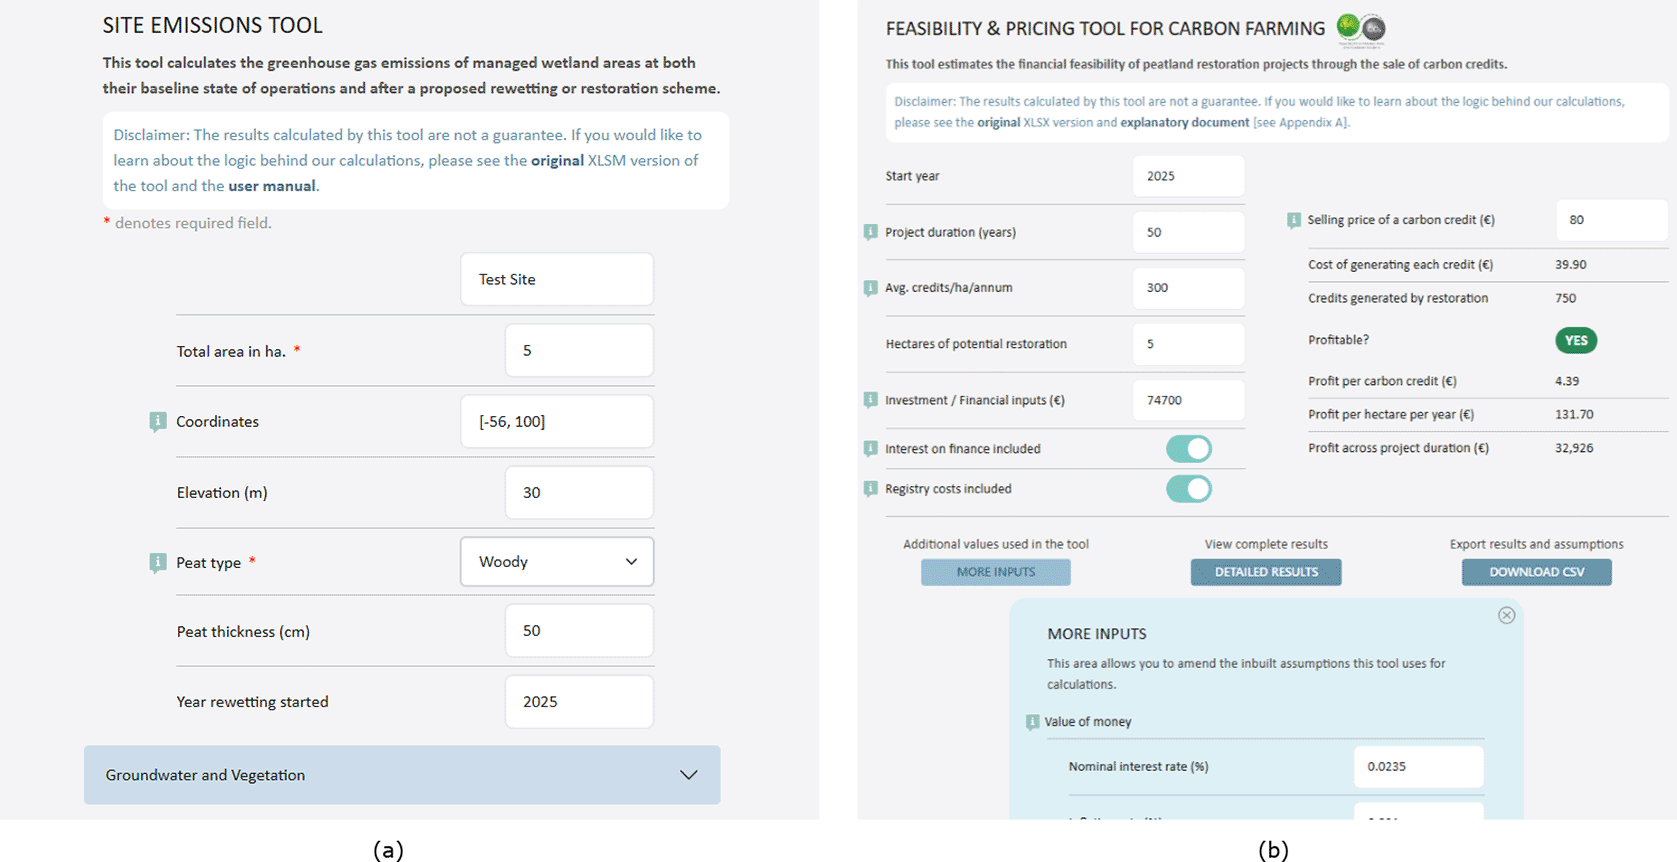
Figure 10. Restoration calculators available on the portal.
(a) The Site Emissions Tool,33 adapted to the web from an XLSM file. (b) The Financial Feasibility and Pricing Tool,34 adapted to the web from an XLSX file.
Financial feasibility and pricing tool
The Financial Feasibility and Pricing Tool, or the Carbon Farming tool, was developed in the EU Interreg Care-Peat project to provide an estimate of how financially feasible a peatland restoration project would be, based on the number of carbon credits the site would be able to generate and sell per hectare each year.34 The tool has an assumptions tab which can be updated to tune values such as the rate of inflation, but the main part of the tool can be seen in
Figure 10b. The essential data needed for calculation is the project duration, the number of carbon credits generated per hectare per year which can be obtained from the Site Emissions tool, hectares of restoration, financial investment, and the selling price of a carbon credit in the region. Policymakers can explore this tool to develop an understanding of how carbon credits, a key mechanism of blended finance, can be used to fund peatland restoration outside of government grants.
Conclusion
The European Peatland Policy Portal introduces a novel, centralized dataset of peatland-affecting policies across administrative levels, departments, geographic areas, and languages, as well as new tools for exploration of that policy dataset through spatial analysis and the power of generative AI. While the portal focuses on improving the process of analysing and developing effective, evidence-based peatland policies due to their importance for emissions reduction and climate change mitigation, the tools of spatial analysis of the policy landscape and the RAG interface with the policy collection are transferable to any policy domain. Further, the project methodology including dataset creation can be extended even outside of policy to any domain with scattered, disconnected libraries or repositories needing knowledge integration.
The portal’s many tools provide unique analytical capabilities, but their main contribution lies in addressing specific policy issues that scholars and policymakers must address. The link between important policy issues, the related portal technologies, and the policy-relevant results they facilitate is summarized in
Table 3.
Table 3. How the portal’s tools assist in addressing policy challenges.
| Policy challenge | Portal tool |
Policy outcome |
|---|
| Fragmented multi-level policy landscape | Policy catalogue | Rapid identification of all applicable peatland policies across governance levels |
| Regulatory overlaps and gaps | Peatland policy map | Detection of policy conflicts, gaps, and cross-border inconsistencies |
| Limited accessibility of policy evidence | RAG-based QA tool | Transparent, citation-grounded policy synthesis and exploration |
| Difficulty transferring best practices | Project & best practice catalogues | Knowledge transfer across regions and policy contexts |
Policy fragmentation across governance levels is addressed in the structured policy dataset and its corresponding catalogue page, which consolidates peatland-affecting policies from international, European, national, and subnational levels into a unified, searchable dataset. The lessens the need for dispersed national repositories and ad hoc searches by enabling policymakers to quickly discover all pertinent regulatory instruments impacting peatlands within a specific jurisdiction.
Lack of spatial awareness in policy analysis is addressed in the Peatland Policy Map, which models policy applicability geographically with administrative extents and peatland locations. The representation allows policymakers to identify regulatory overlaps, gaps, and inconsistencies affecting specific peatland sites, particularly in cross-border or multi-level governance contexts.
Limited transparency and accessibility of complex policy texts is addressed by the multilingual RAG question-answering tool to enable users to query the full policy dataset using natural language AI while maintaining explicit citations to authoritative sources. This supports rapid evidence synthesis, improves interpretability, and reduces barriers to policy engagement for both non-legal experts and anyone exploring policies in languages they do not understand.
Looking forward
The long-term vision of the portal is continual development of new and existing tools as well as updates to the policy and project collections through the portal’s suggestion forms. Future projects will include work on the portal as part of the project tasks, allocating time to conduct this development and approval of suggestions. With these added resources, the portal will also conduct evaluations of the efficacy of its tools for policy analysis and development, a task which was outside the scope of the current project.
Future development of the portal tools centres around further AI integration, using it to detect new peatland-affecting policies at national and subnational scales, as well as to update existing policies when they are amended, renewed, or expired. Additionally, the portal aims to incorporate AI into the extraction of relevant policy information like key instruments and metrics in proposed actions, and policy connections such as inheritance between national and subnational implementations of international guidance. These innovations again will be developed in a project focused on peatland policy, but will be transferable to other policy domains.
Additionally, future work includes the development of AI tools for policy analysis tasks more specific than identifying simple policy design elements. Given the need to address climate problems with a robustly diverse array of solutions across departments, the evaluation of policy alignment and divergence is a particularly important step in creating efficient, effective, climate-friendly policies.35,36 With further development of the RAG tool and knowledge extraction models, AI can help policymakers identify the points of convergence and divergence in policies without taking weeks to read through thousands of pages of text.
We expect this portal will be a source for reference and analysis to improve the creation of evidence-based peatland policies and projects, ultimately leading to healthier environments and emissions reductions throughout Europe and the rest of the world.
Supplementary data
The code of the portal itself and its various tools is open-source and available on GitHub[10] under an MIT license.
Further qualitative evaluations of the RAG tool have also been archived on Zenodo32:
DOI: 10.5281/zenodo.19185913 (Waskow, 2026). Additional Example Questions, Responses, and Evaluations of the PPP RAG Tool.
This dataset consists of an XLSX file that contains the question asked of the RAG tool, the tool’s response, the documents referenced, and the user’s feedback for four questions. The data is available under the terms of the Creative Commons Attribution 4.0 International license.
Ethics and consent
Ethical approval and consent were not required.
Data availability
The policy data compiled and referenced in this study is available via the European Peatland Policy Portal’s Policy Collection[9]. This portal is a dynamic resource; its policy dataset is updated as new policies are published and identified.
For transparency and reproducibility, a static version of the dataset has been archived on Zenodo25:
DOI: 10.5281/zenodo.19097515 (Ó Brolcháin et al., 2026). The European Peatland Policy Dataset (March 2026 Snapshot).
This dataset contains the JSON and XLSX export of the policy collection at the time of analysis and is available under the terms of the Creative Commons Attribution 4.0 International license.
Acknowledgements
We would like to thank Cáit Gleeson, Piaras Ó Giobúin, Samuel Kessler, and the dedicated interns who helped build our portal: Raquel Sabater Canovas, Andrea O’Connor, Lily Bineau, Erica Zanovello, Joseph Casey, Raimey O Boyle, Meret Stursberg, Mella O’Brolchain, Aoife Monaghan, Darren Casserly, Marcel Šimon, Oktavia Dewi Rizka Alam, Shanmathi Magesh, Mary Hachey, David Cunningham, and Sajin Stanislaus.
We additionally would like to thank Jennifer Merten of Naturschutzbund Deutschland e.V., Maria Nolan of Liverpool John Moores, Marelle van der Snoek of Hogeschool Van Hall Larenstein, and Freya Connelly of Abhainn Beo for their expertise.
Flaticon credits for Figure 1: Global, Europe, Belgium, Germany, Ireland, Research, Map, Puzzle, Checklist icons by Freepik; Region icon by Awicon; Retrieve icon by Pop Vectors; Hand shake icon by Aranagraphics.
Bibliography
- 1.
Tanneberger F, Tegetmeyer C, Busse S, et al.:
The Peatland Map of Europe.
Mire Peat.
2017; 19: 22. Publisher Full Text
- 2.
Humpenöder F, Karstens K, Lotze-Campen H, et al.:
Peatland protection and restoration are key for climate change mitigation.
Environ. Res. Lett.
2020; 15(10): 104093. Publisher Full Text
- 3.
Urák I, Hartel T, Gallé R, et al.:
Worldwide peatland degradations and the related carbon dioxide emissions: the importance of policy regulations.
Environ. Sci. Pol.
2017; 69: 57–64. Publisher Full Text
Reference Source
- 4.
Chen C, Loft L, Matzdorf B:
Lost in action: Climate friendly use of European peatlands needs coherence and incentive-based policies.
Environ. Sci. Pol.
2023; 145: 104–115. Publisher Full Text
Reference Source
- 5.
Minasny B, Adetsu DV, Aitkenhead M, et al.:
Mapping and monitoring peatland conditions from global to field scale.
Biogeochemistry.
2024; 167(4): 383–425. Publisher Full Text
- 6.
Nordbeck R, Hogl K:
National peatland strategies in Europe: current status, key themes, and challenges.
Reg. Environ. Chang.
2024; 24(1): 5. Publisher Full Text
- 7.
Bonn A, Allott T, Evans M, et al., editors.
Peatland Restoration and Ecosystem Services: Science, Policy and Practice.
Cambridge:
Cambridge University Press;
2016. (Ecological Reviews). Publisher Full Text
- 8.
Flood K, Wilson D, Renou-Wilson F:
Evidence Synthesis and Knowledge Integration for Sustainable Peatland Management.
Land.
2025; 14(7). Publisher Full Text
Reference Source
- 9.
Head BW:
Reconsidering evidence-based policy: Key issues and challenges.
Polic. Soc.
2010; 29(2): 77–94. Publisher Full Text
- 10.
Couwenberg J, Thiele A, Tanneberger F, et al.:
Assessing greenhouse gas emissions from peatlands using vegetation as a proxy.
Hydrobiologia.
2011; 674(1): 67–89. Publisher Full Text
- 11.
Cobb CD:
Geospatial Analysis: A New Window Into Educational Equity, Access, and Opportunity.
Rev. Res. Educ.
2020; 44(1): 97–129. Publisher Full Text
- 12.
Brody SD, Zahran S, Grover H, et al.:
A spatial analysis of local climate change policy in the United States: Risk, stress, and opportunity.
Landsc. Urban Plan.
2008; 87(1): 33–41. Publisher Full Text
Reference Source
- 13.
Berger T:
Agent-based spatial models applied to agriculture: a simulation tool for technology diffusion, resource use changes and policy analysis.
Agric. Econ.
2005; 25(2–3): 245–260. Publisher Full Text
- 14.
Macharis C, Pekin E:
Assessing policy measures for the stimulation of intermodal transport: a GIS-based policy analysis.
J. Transp. Geogr.
2009; 17(6): 500–508. Publisher Full Text
Reference Source
- 15.
Scott G, Rajabifard A:
Sustainable development and geospatial information: a strategic framework for integrating a global policy agenda into national geospatial capabilities.
Geo-spat. Inf. Sci.
2017; 20(2): 59–76. Publisher Full Text
- 16.
Fezzi C, Bateman IJ:
Structural agricultural land use modeling for spatial agroenvironmental policy analysis.
Am. J. Agric. Econ.
2011; 93(4): 1168–1188. Publisher Full Text
- 17.
Alsamhi SH, Rowan NJ, Hawbani A, et al.:
AI-Empowered Peatland Management for Climate-Resilient and Sustainable Future: Challenges and Opportunities.
2024 4th International Conference on Emerging Smart Technologies and Applications (eSmarTA).
IEEE;
2024; p. 1–8. Publisher Full Text
- 18.
Firebanks-Quevedo D, Planas J, Buckingham K, et al.:
Using machine learning to identify incentives in forestry policy: Towards a new paradigm in policy analysis.
Forest Policy Econ.
2022; 134: 102624. Publisher Full Text
- 19.
Waskow MA, McCrae JP:
Enhancing Policy Analysis with NLP: A Reproducible Approach to Incentive Classification.
Proceedings of the 21st Conference on Natural Language Processing (KONVENS 2025): Workshops.
2025; p. 74–85.
Reference Source
- 20.
Choi SJ:
Mapping and Comparing Climate Equity Policy Practices Using RAG LLM-Based Semantic Analysis and Recommendation Systems.
arXiv.
2026.
Reference Source
- 21.
Nagarajan G, Kumar O, Santhiappan S:
PolicyBot - Reliable Question Answering over Policy Documents.
arXiv.
2025.
Reference Source
- 22.
Sun J, Luo Z:
ForPKG: A Framework for Constructing Forestry Policy Knowledge Graph and Application Analysis.
2025 International Joint Conference on Neural Networks (IJCNN).
IEEE;
2025; p. 1–8. Publisher Full Text
- 23.
Belete E:
AI-Powered Climate Policy Analysis Using Natural Language Processing and Large Language Models.
Zenodo.
2025. Publisher Full Text
- 24.
Cantens T:
How will the state think with ChatGPT? The challenges of generative artificial intelligence for public administrations.
AI & SOCIETY.
2025; 40(1): 133–144. Publisher Full Text
- 25.
Ó Brolcháin N, Khan MY, Wang Y, et al.:
The European Peatland Policy Dataset (March 2026 Snapshot). [Dataset].
Zenodo.
2026. Publisher Full Text
- 26.
Lourenco M, Fitchett JM, Woodborne S:
Peat definitions: A critical review.
Progress in Physical Geography: Earth and Environment.
2023; 47(4): 506–520. Publisher Full Text
- 27.
Tegetmeyer C, Kaiser M, Barthelmes A:
The European Wetland Map (‘EWM’). [Dataset].
Zenodo.
2025. Publisher Full Text
- 28.
Gilet L, Morley TR, Flynn R, et al.:
An adaptive mapping framework for the management of peat soils: A new Irish peat soils map.
Geoderma.
2024; 447: 116933. Publisher Full Text
- 29.
Rawte V, Chakraborty S, Pathak A, et al.:
The Troubling Emergence of Hallucination in Large Language Models – An Extensive Definition, Quantification, and Prescriptive Remediations.
Proceedings of the 2023 Conference on Empirical Methods in Natural Language Processing.
Association for Computational Linguistics;
2023; p. 2541–2573. Publisher Full Text
- 30.
Lewis P, Perez E, Piktus A, et al.:
Retrieval-augmented generation for knowledge-intensive NLP tasks.
Proceedings of the 34th International Conference on Neural Information Processing Systems (NIPS’20).
Curran Associates Inc.;
2020. Publisher Full Text
- 31.
Khan MY, O’Brolchain N, Waskow MA, et al.:
Toward Trustworthy Policy Discovery: A Multilingual Hybrid RAG Approach Applied to EU and UK Peatland Restoration.
Proceedings of the 33rd Irish Conference on Artificial Intelligence and Cognitive Science.
Cham:
Springer;
2025.
- 32.
Waskow MA:
Additional Example Questions, Responses, and Evaluations of the PPP RAG Tool. [Dataset].
Zenodo.
2026. Publisher Full Text
- 33.
van Belle J , Elferink E:
Site Emissions Tool User Manual: A user-friendly tool to estimate GHG-emission reductions from peat rewetting.
Interreg North-West Europe: Carbon Connects;
v1.2 ed2020.
Reference Source
- 34.
Ó Brolcháin N, Field C, Tzoulas K, et al.:
Validating the bespoke model for the social and economic impact of Carbon farming and developing a theoretical model for the impact of Paludiculture.
Interreg North-West Europe: Care-Peat;
2023.
Reference Source
- 35.
Greer A, Grant W:
Divergence and continuity after Brexit in agriculture.
J. Eur. Publ. Policy.
2023; 30(11): 2326–2348. Publisher Full Text
- 36.
Armstrong KA:
Regulatory alignment and divergence after Brexit.
J. Eur. Publ. Policy.
2018; 25(8): 1099–1117. Publisher Full Text




