The processed test results of the heat pump are initially presented over a sufficient range of temperatures. After that, the results of the verified semi-empirical model are given, identifying the compressor losses and their magnitude.
Results of the developed semi-empirical model with vapour injection
The developed model is initially calibrated and its results compared with the available data from the manufacturer with R407C and the same compressor (ZH13KVE) for verification purposes. As a second step, the model is fine-tuned based on the test data, identifying the main reasons for underperformance.
Vapour injection semi-empirical model verification with R407C. The operating conditions consider a suction superheat of 10 K, condenser subcooling of 3 K, and frequency of 50 Hz. By doing so, 36 operating datasets46 are extracted, covering compressor suction temperatures from -15 to 25 °C and condensing temperatures from 25 to 60 °C, all within the compressor envelope.
The semi-empirical model parameters are then fine-tuned35, when using the standard suction pressure drop model (with a constant friction factor) and the improved model (with the logarithmic correlation presented previously).
The calibration work resulted in the same values of the parameters with the standard and improved suction pressure drop models, with the exception of the two friction factor parameters. The values of all parameters are shown in Table 7.
Table 7. Semi-empirical model parameters with vapour injection and R407C.
| Parameter | Sub-processes | Standard suction pressure drop | Improved suction pressure drop | Units |
|---|
| AUamb,cp | Heat transfer coefficient for heating-up during supply | 12.6 | W/K |
| AUex,cp,n | Heat transfer coefficient for heat loss during the exhaust | 11.72 | W/K |
| AUsu,cp,n | Heat transfer coefficient for heat losses to the ambient | 218.7 | W/K |
| Aleak, cp | Effective area of leakages | 6.41E-08 | m2 |
| Ẇloss0,cp | Constant term of the electrical power losses | 276.1 | W |
| αcp | Coefficient of the variable term of the electrical power losses | 0.227 | - |
| Vs,cp | Swept volume of the compressor | 71.03 | cm3 |
| rv,in | Built-in volume ratio of the compression | 3.54 | - |
| K | Lumped friction factor parameter | 3.99E+08 | - | 1/m4 |
| | Constant term of the friction factor correlation adjusted parameter | - | 3.401E+08 | 1/m4 |
| | Variable term of the friction factor correlation adjusted parameter | - | 5.114E+06 | 1/m4 |
Significant heating of the refrigerant at the suction is observed, since the suction heat transfer coefficient is one order of magnitude higher than the other two heat transfer coefficients. In addition, there is an over-estimation of the swept volume of the compressor by 5.6%, which is also observed in the findings of relevant literature26,31,47. This is because the identified swept volume does not correspond to the actual one, but considers several other processes. The built-in volume ratio rv,in, is also an identified parameter of the model and represents the ideal volume ratio of the compressor.
Due to the compatibility of R407C and the examined compressor with all operating conditions included in the envelope, the suction fluid flow is a fully developed turbulent flow. This is identified by the parameter values of the logarithmic expression for suction pressure drop that gives an almost constant friction factor, and thus expecting the results of the two models to be similar. Specifically, the parameter is related to the logarithmic part of Equation. (13) and is two orders of magnitude lower than the , which represents the constant part of the correlation with a value similar to the constant friction factor (K).
The results of the semi-empirical model using the standard and improved models for suction pressure drop are depicted in Figure 10–Figure 12 comparing the calculated mass flow rate, the electric power and the discharge temperature of R407C with all available data from the manufacturer. The 5% margins for electric power and mass flow rate and 3 K margin for the discharge temperature are also indicated.
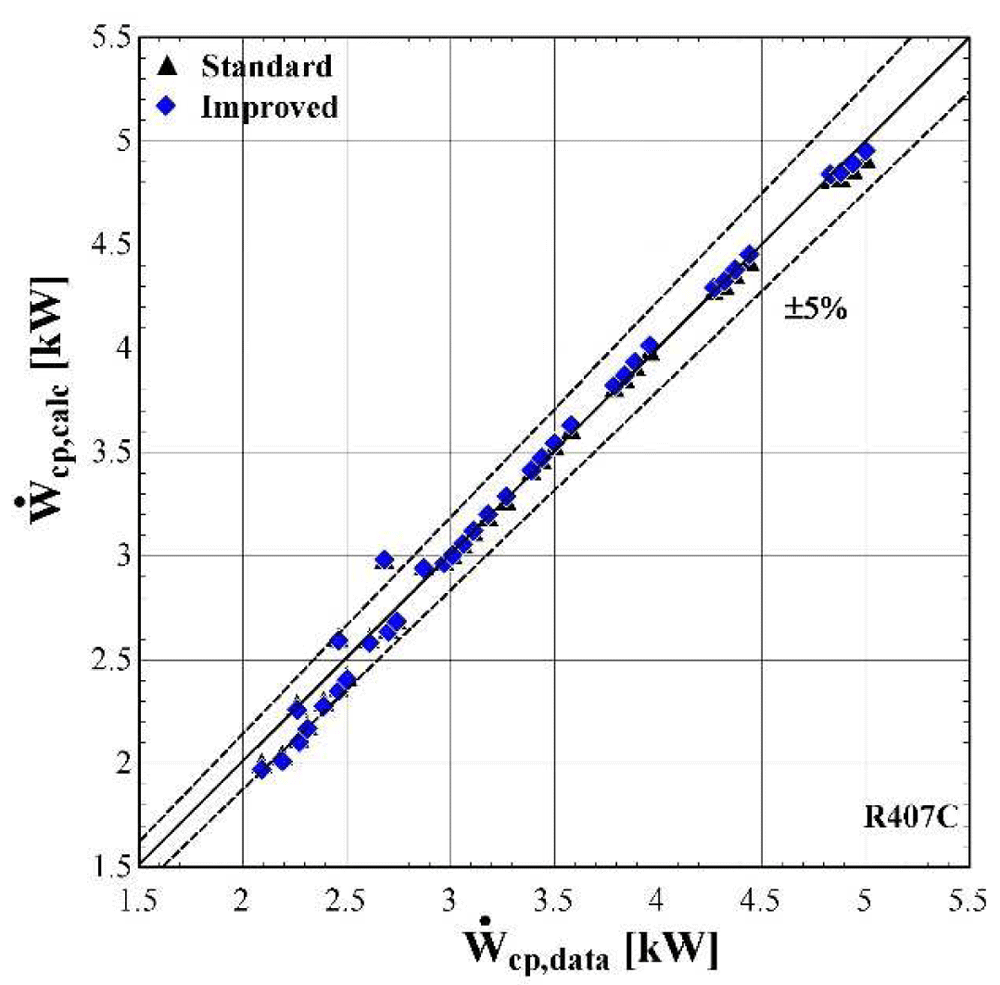
Figure 10. Comparison of the calculated electrical power, Ẇcp,calc (with the standard and improved suction pressure drop) with the available one (Ẇcp,data).
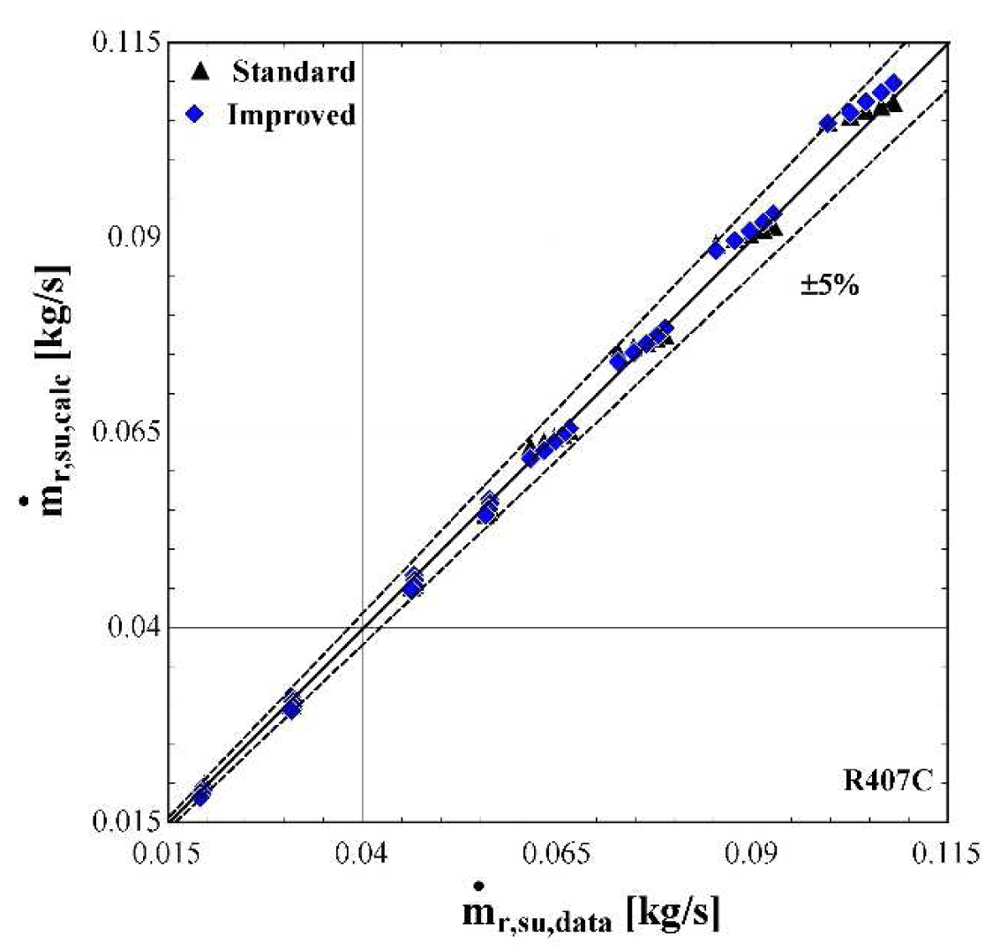
Figure 11. Comparison of the calculated mass flow rate, ṁr,su,calc (with the standard and improved suction pressure drop) with the available one (ṁr,su,data).
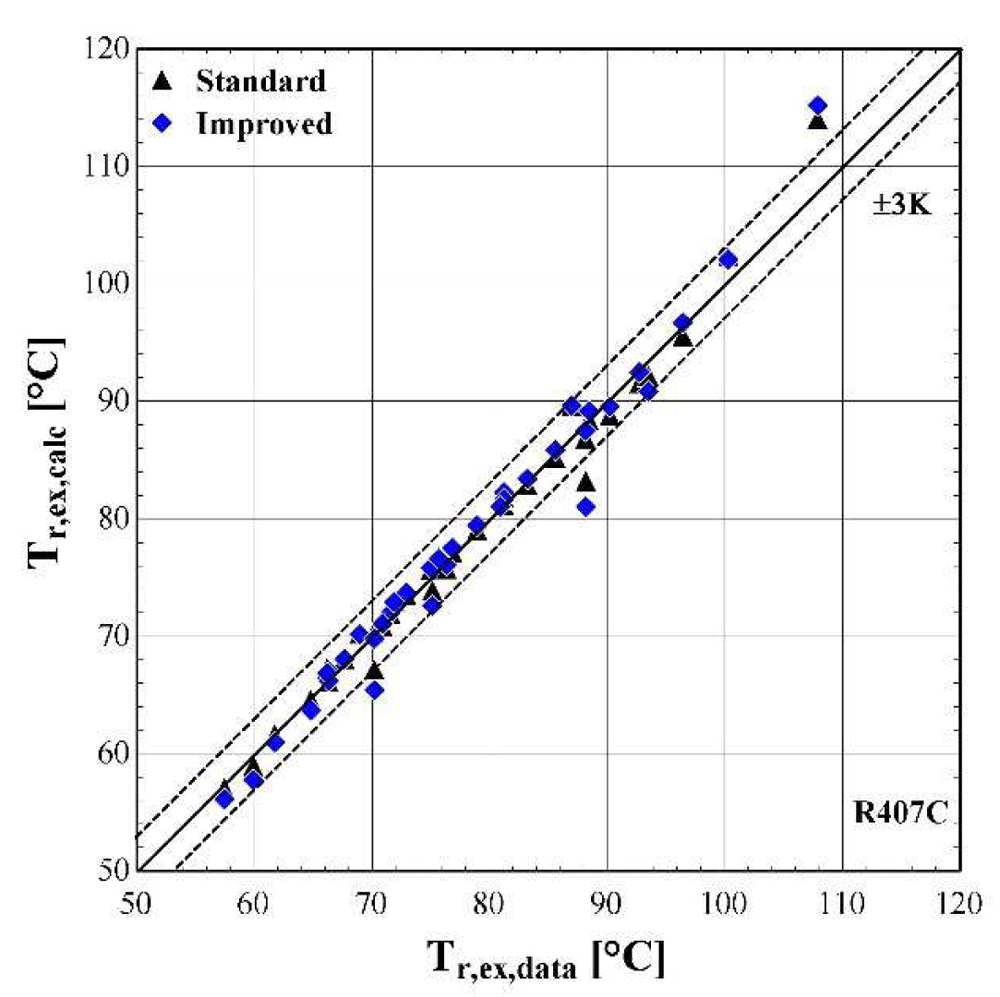
Figure 12. Comparison of the calculated discharge temperature, Tr,ex,calc (with the standard and improved suction pressure drop) with the available one (Tr,ex,data).
As shown in Figure 10, the electric power prediction for the compressor is sufficiently calculated for the whole range, keeping the deviation within ±5% for the majority of testing points, observing very few diversions. These are to be expected, since the calibration process has been accomplished for a very large range of conditions. However, the electric power prediction for moderate and high values is almost identical to the available one. This is achieved for both standard and improved suction pressure drop models, since the mass flow rate and refrigerant velocity is increased, assuring the fully developed flow of the refrigerant.
As far as the mass flow rate is concerned, the prediction is always within a 5% margin showing better accuracy for low and moderate rates (below 0.07 kg/s). Comparing the results of the standard and improved suction pressure drop models, it is evident that there is no clear improvement since the values are almost identical.
Finally, the discharge temperature is adequately calculated with most of the operating conditions within the 3 K range. Only two conditions of moderate discharge temperature and one of high temperature exceed the ±3 K limit, being underestimated by almost 6 K. This discrepancy can be explained because these points are characterized by very low evaporating temperatures (below -10 °C) and are located in the boundaries of the compressor envelope making it very challenging for the model to accurately predict the behaviour. The results of the two suction pressure drop models are similar, with the improved model having a better accuracy for moderate temperatures in the range of 70–90 °C.
The minimum, maximum and average deviation of the predicted variables for both standard and improved suction pressure drop model are presented in Table 8.
Table 8. Minimum, maximum, and average deviation of the predicted variables of the semi-empirical model compared with the available data.
| Discharge temperature deviation (K) | Mass flow rate deviation (%) | Electric power deviation (%) |
|---|
| Min | Max | Average | Min | Max | Average | Min | Max | Average |
|---|
| Standard model | -5.88 | 5.06 | 1.07 | -4.47 | 3.43 | 1.77 | -11.30 | 6.96 | 1.99 |
| Improved model | -5.41 | 5.43 | 1.06 | -5.52 | 2.61 | 1.54 | -11.23 | 6.85 | 1.97 |
Although there are a few values that have greater deviations than the defined limits, in all cases the average error is kept below 2% for the mass flow rate and electric power respectively, and 1.07 K for the discharge temperature. The accuracy of the two suction pressure drop models seems to be the same with negligible differences, as indicated by the average deviations of Table 8.
Finally, the verification of the developed model is proved by the low deviation values for the main properties. These deviations could be even lower, if the range of the conditions were restricted, for example by considering compressor suction temperatures from -10 to 15 °C and condensing temperatures from 40 to 60 °C. Moreover, the results of the two suction pressure drop models are almost identical, indicating that the use of the improved model does not bring any improvements at these specific conditions.
Semi-empirical model calibration to experimental data with R1234ze(E) and the effect of suction pressure drop. The vapour injection semi-empirical model is then calibrated with the use of the test data. The inputs concern the refrigerant suction pressure and temperature, the discharge pressure and the vapour injection pressure, temperature and mass flow rate (Table 5 and Table 6). This calibration process is followed for both the standard and improved suction pressure drop approach. The fine-tuned values of all parameters are given in Table 9, which significantly differ from the ones for R407C presented in Table 7.
Table 9. Semi-empirical model parameters with vapour injection and R1234ze(E).
| Parameter | Sub-processes | Standard suction pressure drop | Improved suction pressure drop | Units |
|---|
| AUamb,cp | Heat transfer coefficient for heating-up during supply | 1600 | W/K |
| AUex,cp,n | Heat transfer coefficient for heat loss during the exhaust | 320.8 | W/K |
| AUsu,cp,n | Heat transfer coefficient for heat losses to the ambient | 10.02 | W/K |
| Aleak, cp | Effective area of leakages | 1.77E-07 | m2 |
| Ẇloss0,cp | Constant term of the electrical power losses | 487.8 | W |
| αcp | Coefficient of the variable term of the electrical power losses | 0.5496 | - |
| Vs,cp | Swept volume of the compressor | 63.43 | cm3 |
| rv,in | Built-in volume ratio of the compression | 4.726 | - |
| K | Lumped friction factor parameter | 8.35E+08 | - | 1/m4 |
| | Constant term of the friction factor correlation adjusted parameter | - | -2.3975E+10 | 1/m4 |
| | Variable term of the friction factor correlation adjusted parameter | - | 1.2593E+12 | 1/m4 |
The suction’s overall heat transfer coefficient is rather low, leading to a minor heating up of the refrigerant by about 1–2 K. This is because the mass flow rate of the vapour injection is increased, reducing at the same time the suction flow rate. Also, overall heat transfer coefficient of the discharge is high, which enhances the heat losses of the compressed refrigerant, although the ambient temperature was even 30 °C in some cases.
In addition, the electric compressor losses are also higher with R1234ze(E) than with R407C, presenting a 76% increment on the constant electrical losses factor (Ẇloss0,cp) and an increase of over 100% for the variable losses factor (αcp). This was expected to some extent, since the constant inverter losses of the tested compressor with R1234ze(E) are included in the measured electric power. Moreover, the energy balance at the compressor’s shell imposes a very high heat transfer coefficient at the casing. This could indicate that the assumption of the isothermal wall with a constant temperature is not entirely valid.
The friction factor of the standard suction pressure drop approach has a similar value to the case with R407C (although two times higher). On the other hand, the improved model gives a parameter of the logarithmic part two orders of magnitude greater than the constant part, revealing a significant variation in the friction factor as the evaporation temperature changes. This will become clearer later in this work, when the compressor losses are examined.
Figure 13–Figure 15 compare the model results of the standard and improved friction factor approach with the measured data.
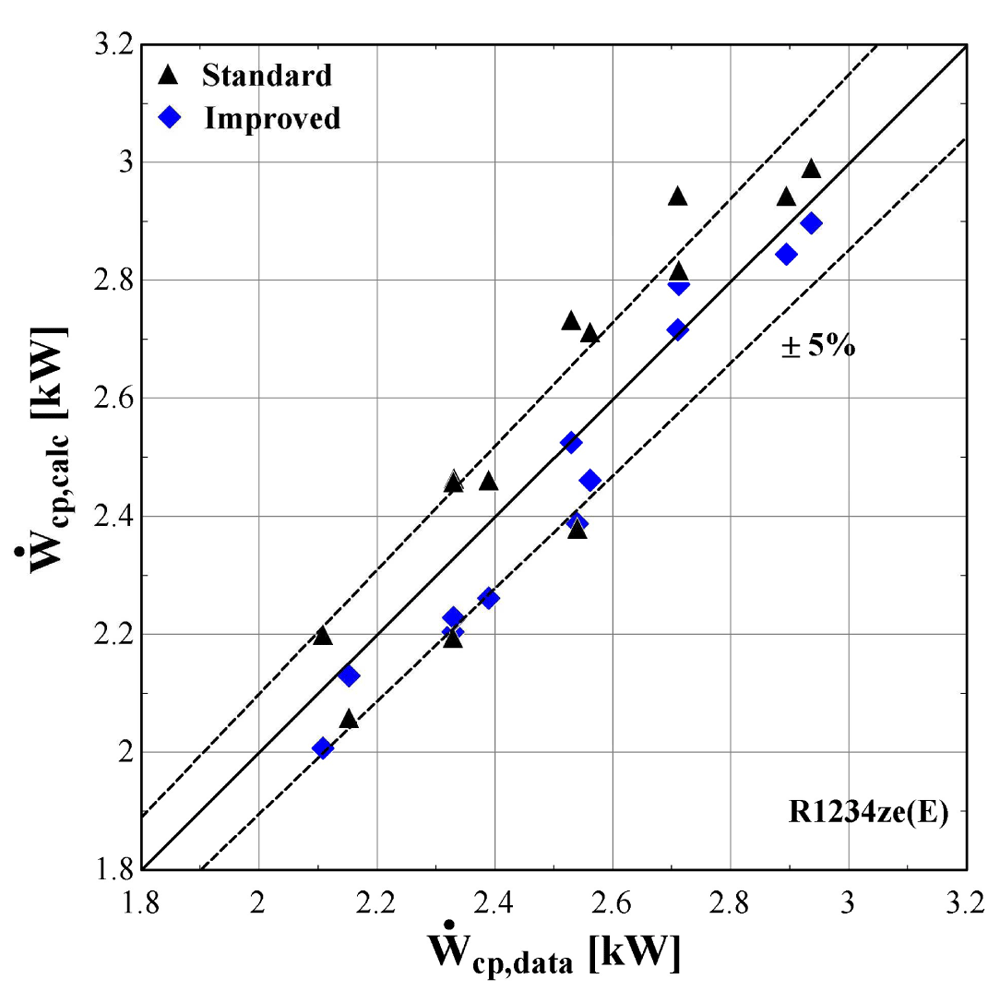
Figure 13. Comparison of the calculated electrical power, Ẇcp,calc (with the standard and improved suction pressure drop) with the measured one (Ẇcp,data).
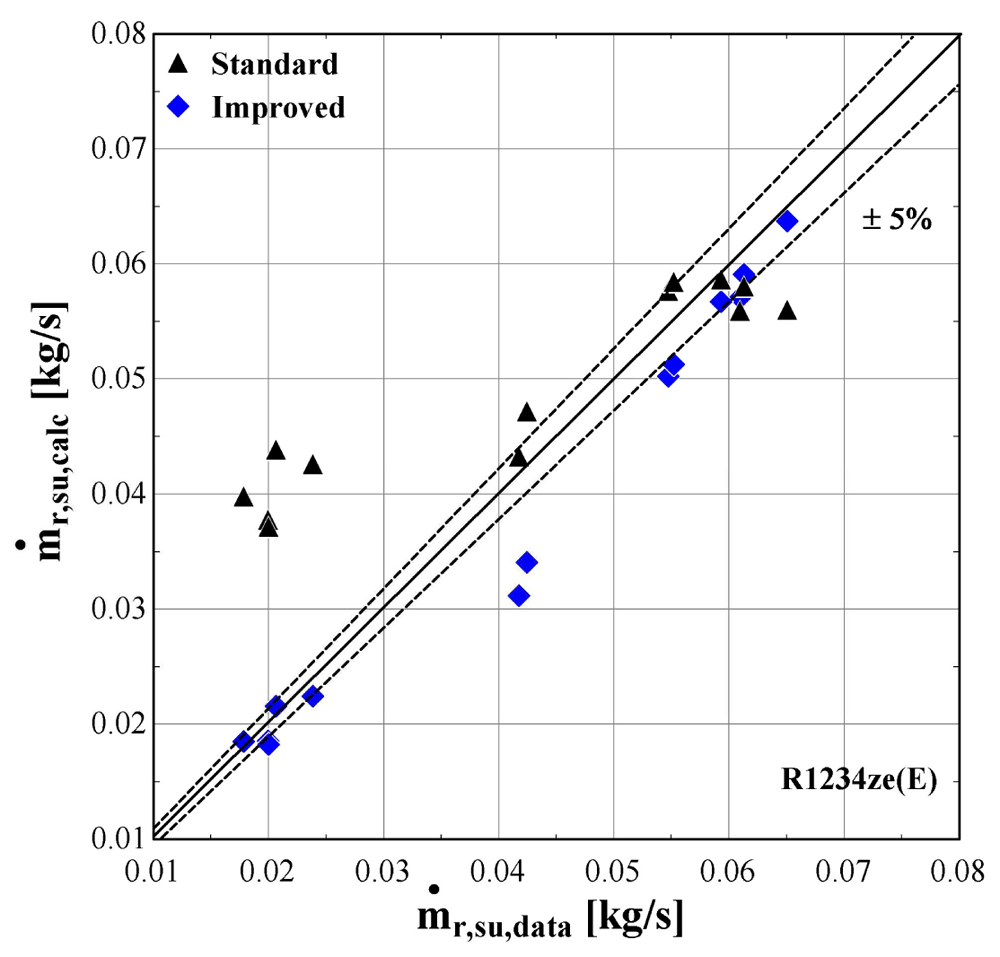
Figure 14. Comparison of the calculated mass flow rate, ṁr,su,calc (with the standard and improved suction pressure drop) with the measured one (ṁr,su,data).
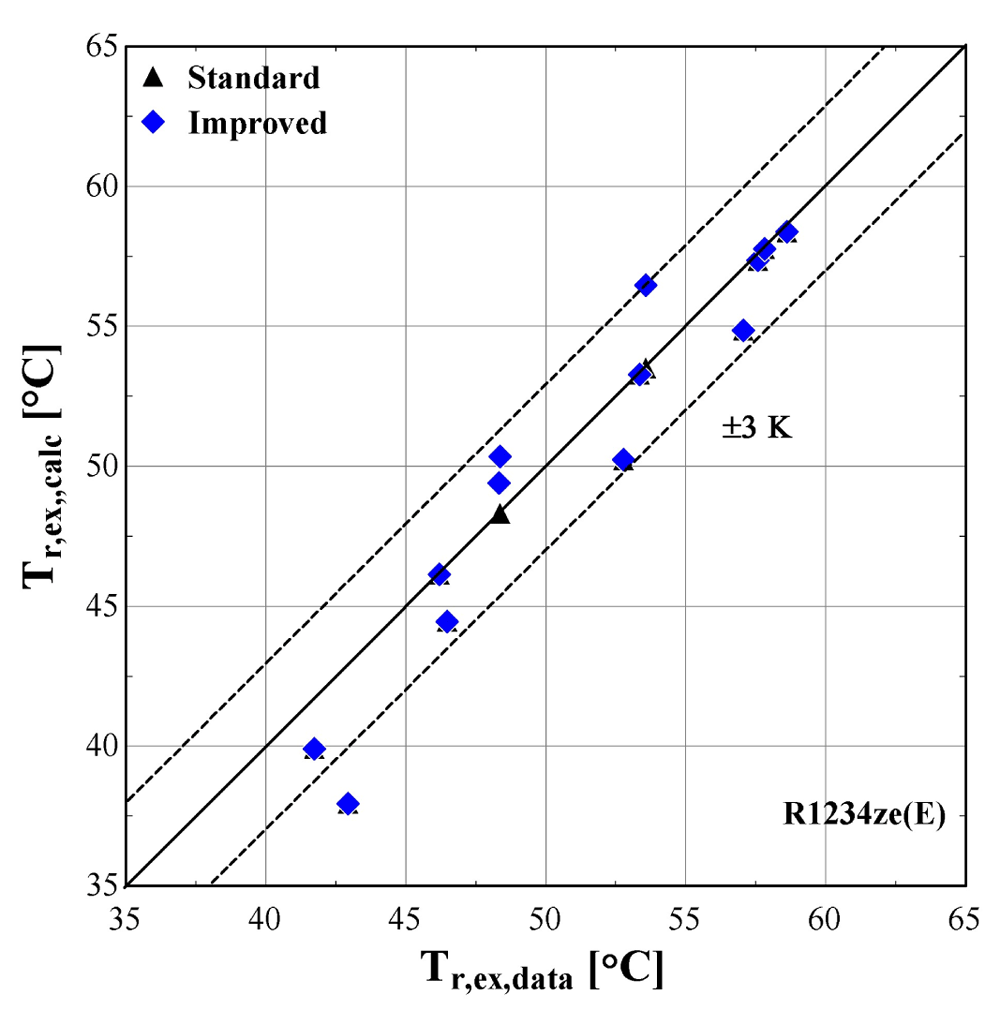
Figure 15. Comparison of the calculated discharge temperature, Tr,ex,calc (with the standard and improved suction pressure drop) with the measured one (Tr,ex,data).
The electric power calculated by the improved model (Figure 13) seems to be consistent with the experimental results always staying within the ±5%. Moreover, the majority of examined conditions are closer to the experimental data than the data obtained using the standard model.
The standard suction pressure drop introduces large deviations to the mass flow rate, especially for the lower values, whereas for moderate/high flow rates (in the range of 0.04-0.06 kg/s) the results are similar to the measured ones. On the other hand, the improved suction pressure drop model reduces the discrepancies in the whole range. Especially for the lower mass flow rates, the error is significantly reduced, with the calculations ranging within the ±5% bandwidth. For the moderate mass flow rates, the logarithmic trend of the suction pressure drop seems to be less accurate, showing a maximum underestimation of about 25%. This can be explained from the calibration process that aims to minimize the total error, with the algorithm compromising between reaching a lower accuracy for these conditions and a higher accuracy for conditions within low and high mass flow regions.
The calculated discharge temperature with the two suction pressure drop models show similar results, with a small deviation from the measured values. The majority of examined conditions are within the ±3 K range, except for one that almost reaches a 5 K underestimation and corresponds to an extreme condition with a very low pressure ratio and temperature lift (discharge temperature of 43 °C).
In order to further examine the impact of the improved model on the overall prediction accuracy, the isentropic and volumetric efficiencies are calculated and presented in Figure 16, the trendline of each dataset is also shown (3rd order polynomial for the isentropic efficiency and 2nd order polynomial for the volumetric efficiency, also well approached with a linear correlation).
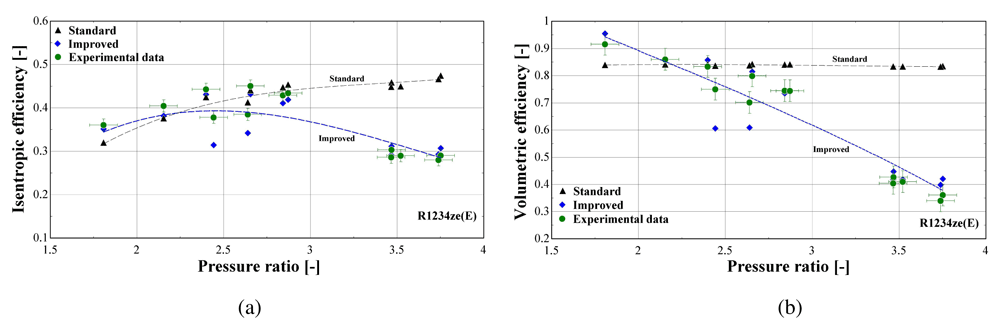
Figure 16.
Comparison of the calculated efficiencies (with the standard and improved suction pressure drop) with the available ones from the test data: (a) Isentropic efficiency; (b) Volumetric efficiency.
Both standard and improved friction factor models adequately predict the isentropic efficiency in a pressure ratio range from 1.5 to 3. This range corresponds to higher mass flow rates with a low suction pressure drop. For higher pressure ratios, the accuracy of the improved model improves, with its results closely following the experimental data that reach an isentropic efficiency of just 30%.
Regarding the volumetric efficiency, the standard model only provides adequate accuracy for low pressure ratios (below 2.5), while its calculations lead to a constant volumetric efficiency for all conditions, equal to about 85%, instead of declining with the pressure ratio, with the maximum deviation exceeding 140%. The results of the improved model are very close to the experimental values for the whole operating range, capturing the linear reduction of the volumetric efficiency with the pressure ratio. Finally, the very low volumetric efficiency of even 40% is the result of the high suction pressure drop, being the main cause of the compressor underperformance, as will be discussed later.
The previous outcomes are supported by the minimum, maximum and average deviations of the three key properties considering the two suction pressure drop correlations, given in Table 10.
Table 10. Minimum, maximum and average deviation of the predicted variables of the semi-empirical model with standard and improved suction pressure drop approach compared to the measured data.
| Discharge temperature
deviation (K) | Mass flow rate deviation (%) | Electric power deviation (%) |
|---|
| Min | Max | Average | Min | Max | Average | Min | Max | Average |
|---|
| Standard | 0.05 | 4.98 | 1.10 | -123.0 | 14.00 | 41.80 | -8.63 | 6.29 | 5.01 |
| Improved | -2.90 | 4.98 | 1.54 | -4.46 | 25.34 | 8.20 | -3.02 | 5.95 | 3.20 |
The deviation of the discharge temperature is about the same for both cases, and similarly for the electric power. However, the mass flow rate deviation is significantly decreased when using the improved suction pressure drop approach, as the average deviation is reduced by 75%, compared to the standard model. This indicates that the new model approach for suction pressure drop recreates the experimental points more accurately, since for pressure ratios above 2.5 the flow is closer to a laminar one with high friction factor rather than the standard turbulent conditions. Therefore, the improved model will be used from now on, so that to evaluate the compressor losses with a higher accuracy.
Compressor losses. The previous analysis leads to identifying the losses mechanisms, which are related to the pressure drop, heat losses and electrical losses. Figure 17 presents the suction pressure drop of the same compressor with R407C and R1234ze(E), when using the improved model. In order to perform an impartial comparison between the two refrigerants, a subset of the initial data set of R407C is obtained, which corresponds to the same range of evaporating and condensing temperatures with the test data of R1234ze(E).
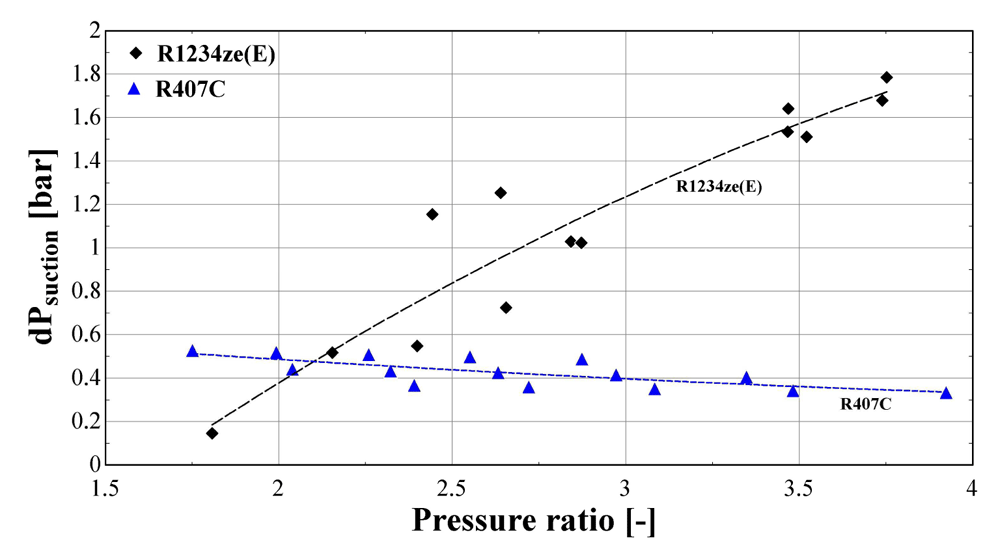
Figure 17. Calculated suction pressure drop (dPsuction) of R407C and R1234ze(E) as a function of the pressure ratio.
The suction pressure drop with R1234ze(E) ranges from about 0.2 bar for low temperature lifts, reaching 1.8 bar for a pressure ratio of 3.8. This drop is very high and has a significant impact on the refrigerant density, leading to a very low volumetric efficiency, as presented in Figure 16. On the other hand, the pressure drop of R407C varies within a reasonably small range (0.3-0.6 bar), and slightly decreases for larger pressure ratios. It should be highlighted that the discharge pressure drop of the two refrigerants is similar and always lower than 0.2 bar. This drop is within the reported values found in the literature28,45, and has a negligible impact on the compressor performance.
The above results reveal the main reason for compressor underperformance which is related to the low suction pressure of R1234ze(E) for low evaporation temperatures. The suction pressure is about 3–4 bar less than with R407C for the same temperature levels (although the pressure ratio range is very similar), indicating that the flow approaches the laminar regime due to a reduced fluid velocity and Reynolds number, increasing, in that case, the friction factor as presented previously. The result is a very high pressure drop at the suction line of the compressor, resembling the operation of a chocking valve that imposes the refrigerant to flow through the alternative path of the vapor injection line. This is depicted in Figure 18 and shows the measured and calculated suction mass flow rate and the mass flow rate ratio (vapour injection-VI to suction flow) as a function of the suction pressure for R1234ze(E) refrigerant.
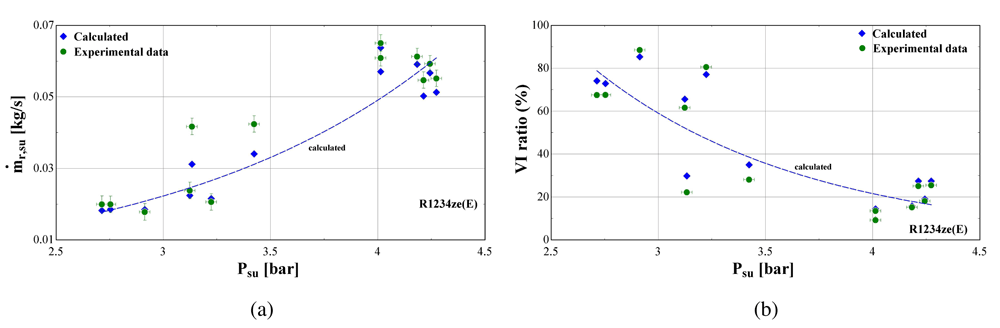
Figure 18.
Suction mass flow rate (ṁr,su) and vapour injection mass flow rate ratio (VI ratio) as a function of the suction pressure (Psu) of R1234ze(E): (a) Suction mass flow rate; (b) Vapour injection mass flow rate ratio.
The ratio between injected and suction mass flow rate of R1234ze(E) is extremely high reaching about 80% at low suction pressure and temperature, whereas it reduces to typical values of about 20–30% for a lower pressure ratio. This is still rather high compared with the one of R407C that ranges from about 7 to 36%.
Apart from the pressure losses, the energy flows of the compressor are examined. These are related to the energy balance at the fictitious isothermal wall (negative values once leaving the shell, positive ones to the shell), involving the suction heat gain, discharge heat loss, ambient heat losses and electrical losses. These are presented in Figure 19 for both R1234ze(E) and R407C.
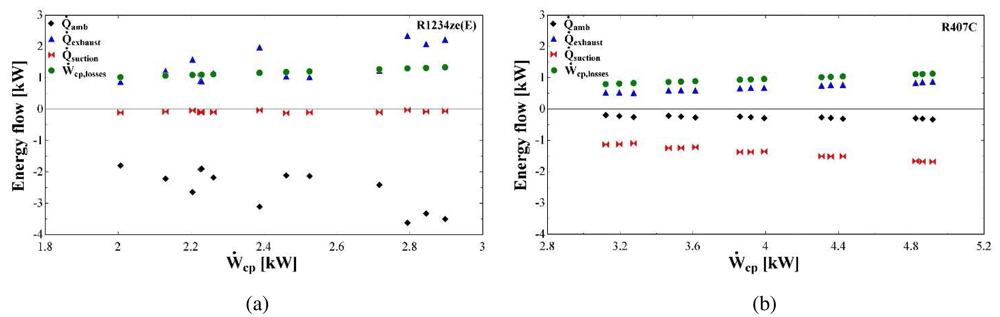
Figure 19.
Energy flows (heat losses to the ambient: amb, heat losses to the exhaust: exhaust, heat gain at the suction: suction, compressor losses: Ẇcp,losses) at the fictitious isothermal wall as a function of the compressor power (Ẇcp): (a) R1234ze(E); (b) R407C.
The thermal and electrical losses with R1234ze(E) are significantly higher compared with the ones of R407C, which is a direct outcome of the higher parameter values identified during the model calibration (Table 7 and Table 9). Almost all variables are linearly related to the compressor work with R407C, while both thermal and electrical losses are in close agreement with the results presented in Reference 30.
The heat transfer at the suction in the case of R1234ze(E) has a minor effect on the overall energy balance with negligible heating of the refrigerant. This is not the case with R407C, for which the 35% of the compressor power heats the supplied refrigerant. Moreover, the electrical losses have a linear dependency on the compressor work and their values are about the same for both refrigerants and range between 0.8 and 1.3 kW. However, the relative electrical losses are much lower with R407C, due to its higher compressor power.
The heat transfer at the exhaust as well as the ambient losses with R1234ze(E) dominate the energy balance applied to the compressor casing. The cooling down of the refrigerant takes values from 0.9 to 2.3 kW which corresponds to 45–76% of the total compressor work, while this fraction is reduced for R407C to 10–20%. This reveals that due to the significant pressure drop of R1234ze(E) the temperature is reduced and only a small fraction of the total supplied energy is transferred to the refrigerant. In addition, the heat of the R1234ze(E) cooling down and the electrical losses are practically transferred to the surrounding environment, since their sum is about the same with the ambient losses which are in the range of 1.9-3.6 kW. These losses are much lower for R407C, due to the minor refrigerant cooling down and the increased suction heating up, as it was mentioned before.








