Introduction
Secondary metabolites are organic low-molecular mass compounds produced by bacteria, fungi and plants. They are often species-specific, important in intraspecies communication and thereby increasing the survival of the producer (Böttger et al., 2018). Plants produce a large variety of metabolites with defensive roles against herbivores and pathogens or providing protection against abiotic stress (Harborne, 1999). For a small fraction of the large chemical diversity produced by plants there is evidence that they attract beneficial organisms such as predators of herbivores and symbiotic micro-organisms. An example of the latter is a group of secondary metabolites called strigolactones (SLs): they attract arbuscular mycorrhizal (AM) fungi, which help the plant cope with phosphate (Pi) stress (Akiyama et al., 2005; López-Ráez et al., 2008; Ruyter-Spira et al., 2011). This is beneficial for the plant, because AM fungi supply the plant with extra P, thus overcoming suboptimal growth conditions (Akiyama et al., 2005; López-Ráez et al., 2008). Moreover, SL regulates, among others, shoot branching and root architecture (Akiyama et al., 2005; Gomez-Roldan et al., 2008; Ruyter-Spira et al., 2011; Umehara et al., 2008), further improving P uptake and efficient P use. However, contrastingly, SLs were initially discovered for their detrimental effect on the plant host that secretes them, since they induce germination of parasitic plants (Cook et al., 1966). Hence, parasitic plants have hijacked the communication system between plant host and AM fungi.
The eclepins are another group of secondary metabolites that have been discovered for their role as kairomone (chemical emitted by one organism that is perceived by another species which gains advantage from this). Glycinoeclepin A, B and C and solanoeclepin A (solA) induce hatching of the parasitic cyst nematodes of the genera Heterodera and Globodera, respectively (Fukuzawa et al., 1985; Masamune et al., 1982; Schenk et al., 1999). These triterpenoid secondary metabolites are exuded into the rhizosphere by kidney bean (glycinoeclepins) and Solanaceae (solA) where they are perceived by dormant cyst nematode eggs, which subsequently hatch (Masamune et al., 1982; Tanino et al., 2011). The hatched larvae migrate towards the host root where they establish a syncytium (Hunt et al., 2005). Through this specialised feeding structure, cyst nematodes extract nutrients from the plant and thereby cause large yield losses. Potato cyst nematode (PCN) species Globodera pallida and Globodera rostochiensis are economically relevant pests of crops of the Solanaceae family, such as tomato (Solanum lycopersicum) and potato (Solanum tuberosum) (Jones et al., 2013). Sub-nanomolar concentrations of solA are enough to induce high hatching rates in PCN (Guerrieri et al., 2021; Sakata et al., 2021; Tanino et al., 2011).
Hence, SL and solA have in common that they are plant-derived cues/signalling molecules that betray the plant’s presence to its enemies. For the SLs there is compelling evidence that its signalling function for symbiotic micro-organisms was hijacked as a reliable host presence cue by parasitic plants (Bouwmeester et al., 2021). Here, we use early transcriptional event monitoring in tomato and Arabidopsis in response to exogenous solA treatment to show that solA also has a signalling role. SolA application inhibits the immune and hypoxia response, as well as ethylene biosynthesis and signalling, and promotes growth. This response is particularly strong under simultaneous N and P deficiency.
Methods
Plant material and growing conditions
Tomato Moneymaker and Arabidopsis Col-0 lines were used for all experiments. In this study, we used synthetic solA, kindly provided by K. Tanino (Tanino et al., 2011). Tomato seeds were sterilized by immersion in 70% EtOH (2 min), 25% bleach (20 min) and 6x 6 min wash in sterilized milliQ. Subsequently, they were germinated in between wetted filter paper at 24°C. Seedlings were grown for 20 days in glass vials, containing 1 mL of ½ MS medium (20x diluted MS basal salt micronutrient solution (Merck, Darmstadt, Germany), 0.825 g/L NH4NO3, 0.22 g/L CaCl2·2H2O, 0.185 g/L MgSO4·7H2O, 0.95 g/L KNO3, 0.085 g/L KH2PO4 and 0.04% agar). in a climate room at 24°C with alternating 8h dark, 16h light. On day 20, 20 μL of 250 μM solA in 50% ethanol (v/v) or 50% ethanol (v/v) carrier was pipetted on the agar close to the stem to reach an end concentration of 5 µM; control seedlings were treated with the same volume of ethanol/water, etc. Each treatment consisted of 6 replicates. Seedlings were harvested after 2h (root and shoot separately), which is the typical timeframe for transcriptomic experiments with externally applied hormones, such as for example SL (Zhan et al., 2018; Zha et al., 2019). Samples were collected into Eppendorf vials, snap-frozen in liquid nitrogen and stored at -80°C until further use. The 5 replicates with the best RNA quality after extraction were used for sequencing.
Arabidopsis seeds were sterilized by submersion in 1% bleach with 0.1% Tween for 5 min and were sown, 3 seeds per well, 6 replicates per treatment, in a 96-well plate containing ½ MS medium as described above but supplemented with 1g/L sucrose (control medium). After 10 days of growth, seedlings were transferred to a new plate with ½ MS with or without N and/or P (Table S1, (Vlaar, 2022)). For control conditions, we transferred seedlings into the same medium. For P deficiency, we used 20x diluted MS basal salt micronutrient solution (Merck, Darmstadt, Germany), 0.825 g/L NH4NO3, 0.22 g/L CaCl2·2H2O, 0.185 g/L MgSO4·7H2O, 0.95 g/L KNO3, 0.932 g/L KCl and 0.04% agar), for N deficiency we used 20x diluted MS basal salt micronutrient, 0.22 g/L CaCl2·2H2O, 0.185 g/L MgSO4·7H2O, 0.085 g/L KH2PO4, 0.35 g/L KCl, and 0.04% agar), for combined N and P deficiency we used 20x diluted MS basal salt micronutrient solution, 0.22 g/L CaCl2·2H2O, 0.185 g/L MgSO4·7H2O, 0.397 g/L KCl and 0.04% agar. Seedlings were grown in a climate room at 22°C with alternating 8h dark, 16h light. After 24h in the new plate, 5 μL of 200 μM solA standard in 40% ethanol (v/v) or 40% ethanol carrier (v/v) was applied on the agar to reach an end concentration of 5 µM. After 2 h, the three seedlings of one well were combined into one sample (Table S1). Samples were collected into Eppendorf vials, snap-frozen in liquid nitrogen and stored at -80°C until further use.
cDNA library preparation and high throughput sequencing
For RNA extraction, frozen samples were ground to a fine powder in a cooled mortar and pestle, and total RNA was extracted using the RNeasy Micro Kit (Qiagen, cat nr 74004) and stored at -80°C. RNA-Seq libraries were generated from 500 ng RNA according to the manufacturers’ protocols using the QuantSeq 3′ mRNA-Seq Library Prep Kit FWD for Illumina (Lexogen, cat nr 015.96). The size distribution of the libraries with indexed adapters was assessed using a 2200 TapeStation System with Agilent D1000 ScreenTapes (Agilent Technologies). The libraries were quantified on a QuantStudio 3 Real-Time PCR System (Thermo Fisher Scientific) using the NEBNext Library Quant Kit for Illumina (New England BioLabs, cat nr E7630S) according to the instructions of the manufacturer. The libraries were clustered and sequenced (1 x 75 bp) on a NextSeq 550 Sequencing System (Illumina) using a NextSeq 500/550 High Output Kit v2.5 (75 Cycles) (Illumina, cat nr 20024906).
Read quality control, mapping and counting was done with a Snakemake pipeline (Mölder et al., 2021) containing fastp v0.19.5 (Chen et al., 2018), STAR v2.7.6a (Dobin et al., 2013) and featureCounts v1.6.0 (Liao et al., 2014) (Bliek et al., 2021). The ITAG4.0 and the TAIR9 releases were used as a reference genome for tomato and Arabidopsis, respectively. For detailed settings we refer to the /input/ folders in the Supplemental materials. Shortly, reads were checked for quality with default settings of fastp, then mapped with STAR. Multimappers were allowed to a maximum of 10 and mismatches to a maximum of 4 for both species. A raw read count table was produced with featureCounts and this was used for all downstream analyses.
Clustering, differential gene expression analysis and GO term enrichment analysis
PCA analysis, heatmap plotting and Differentially Expressed Gene (DEG) analysis and visualization were done using packages ggplot2 (v3.3.3), pheatmap (v1.0.12), DESeq2 (v1.28.1), ComplexUpset (v1.3.0) and EnhancedVolcano (v1.6.0) in R (v4.0.2) (Blighe et al., 2018; Kolde, 2015; Krassowski & Lagger, 2021; Love et al., 2014; Wickham, 2016). A gene was considered differentially expressed if log2FC ≠ 0 and adjusted p value < 0.05, as determined by the Wald test in the DESeq2 package. The log2FC values were shrunk using the package apeglm (v1.10.0) (Zhu et al., 2019). Detailed scripts can be found in R markdown files in the Supplemental materials. GO enrichment analysis was done in Panther (go.pantherdb.org) using the statistical overrepresentation test GO biological process with FDR correction < 0.05.
Results
SolA affects gene expression in tomato seedlings
Tomato seedlings were treated with 5 μM solA or carrier, and roots and shoots were harvested separately, after which RNA was extracted and sequenced. On average, 18.8M reads per sample were obtained. Fastq files were trimmed using fastp (Chen et al., 2018), and over 93% of the sequences passed the quality filters (average 96.9%). The mapping percentage was 65.8% on average (Table 1), which is within the expected range for the library preparation method used (Moll et al., 2014).
Table 1. Mapping percentages for experiments in this study (averages).
| Average #
reads (xM) | Quality filter
pass % | Unique
mapping % | Total
mapping % |
|---|
|
S. lycopersicum n = 20 | 18.8 | 96.9% | 54.0% | 65.8% |
| Arabidopsis control n = 10 | 19.6 | 97.4% | 59.7% | 70.8% |
| Arabidopsis starvation n = 25 | 19.2 | 97.6% | 63.9% | 73.2% |
Principal component analysis (PCA, unsupervised) plots revealed a strong difference in transcription between shoot and root, but not of solA treatment (Figure 1A). When root and shoot samples were analysed separately, root samples clustered mostly according to solA treatment especially on the second component that explains roughly 20% of the total variance (Figure 1B). Shoot samples also clustered according to solA treatment but to a lesser extent (PC5, 9% of the total variation, Figure 1C). Differentially expressed genes were called using the DESeq2 package in R, using the Wald test (Love et al., 2014). This resulted in the identification of 46 and 22 unique DEGs, respectively (Table S2).
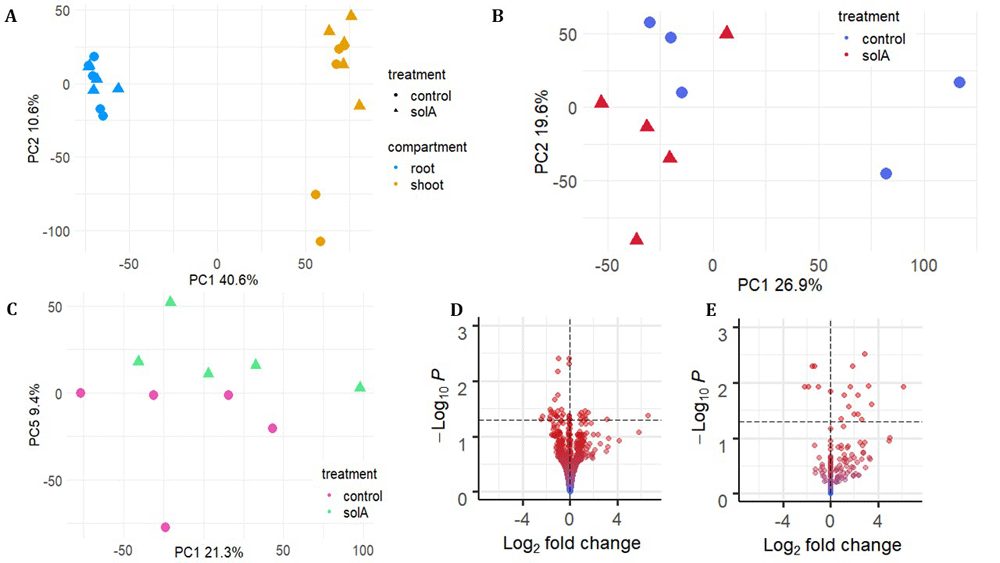
Figure 1. Two-week-old S. lycopersicum seedlings were treated with 5 uM solanoeclepin A and shoot and root were harvested separately after 2h of incubation and gene expression analysed using RNAseq.
A: PCA plots of tomato root and shoot samples treated with/without solanoeclepin A showing the clustering based on organ. B: PCA plots of tomato root samples treated with/without solanoeclepin A. C. PCA plots of tomato shoot samples treated with/without solanoeclepin A. D. volcano plot showing DEGs distribution in shoot E. volcano plot showing DEGs distribution in root. The particular shape of the plot in E is caused by many root genes having a low base mean of counts, resulting in a log2 fold change of 0 after shrinkage with apeglm.
SolA affects transcription of genes involved in biosynthesis of secondary metabolites, ethylene signalling, immunity, and cell wall modification in tomato
In the root, solA treatment resulted in the upregulation of genes annotated as being involved in biosynthesis of specialised metabolites, such as STRICTOSIDINE SYNTHASE 2 (STR-2) and UDP-GLYCOSYL TRANSFERASE (UGT-73C3) (Solyc07g055740.1.1, log2 fold change (log2FC) 6.1, and Solyc10g085870.1.1, log2FC 2.3) (Table S2). In Catharanthus roseus, STR-2 catalyses the production of strictosidine, the precursor for terpenoid indole alkaloids, compounds with pathogen repellent effects and anti-cancer drugs (Stöckigt & Zenk, 1977). Tomato does not contain indole alkaloids, but STR-2 and UGT-73C3 are involved in the biosynthesis of α-tomatine and anthocyanins (Chen et al., 2019). Furthermore, the expression of tomato flavonoid-3-O-rutinoside-4‴-phenylacyl transferase (Solyc12g088170.2.1) and CHALCONE SYNTHASE 1 (CHS1, Solyc09g091510.3.1) – both also involved in flavonoid biosynthesis (O’Neill et al., 1990; Tohge et al., 2015) – were induced by SolA with a log2FC of 4.3 and 2.0, respectively (Table S2).
The transcription of genes involved in ethylene biosynthesis and signalling were affected by solA treatment, but exclusively in the shoot. Expression of the gene encoding rate-limiting biosynthetic enzyme ACC OXIDASE1 (ACO1), was downregulated (Solyc07g049530.3.1, log2foldchange -1.3), just as its close homologue, but not functionally characterized, ACC OXIDASE 4 (ACO4) (Solyc02g081190.5.1, log2foldchange -1.0) (Houben & Van de Poel, 2019). Furthermore, the transcription of ETHYLENE RESPONSE FACTOR 10-2 (ERF10-2, Solyc08g007820.1.1, log2foldchange -0.1), a small HEAT SHOCK PROTEIN regulated by ethylene (Upadhyay et al., 2020) (HSP17.7B, Solyc09g015020.1.1, log2foldchange -0.1) and ETHYLENE RESPONSE HEAT SHOCK PROTEIN COGNATE 70 (Solyc04g011440.4.1, log2foldchange -1.0) were all down-regulated by solA. Interestingly, previous studies showed that the latter gene is upregulated during the immune response against nematode invasion in tomato (Kulshrestha et al., 2020).
Indeed, also transcription of other genes involved in the plant immune response were affected by solA treatment. In both root and shoot, expression of SERINE PROTEIN INHIBITOR3 (Serpin 3) (Solyc04g079450.4.1) was strongly downregulated (log2foldchange -7.1). Serpins play a role in neutralizing pathogen effector proteins (Clemente et al., 2019). A MULTIDRUG AND TOXIC COMPOUND EXTRUSION (MATE) DETOXIFICATION TRANSPORTER PROTEIN (Solyc02g032660.3.1), which extrudes xenobiotics, was downregulated in the root as well, with a log2FC of -1.0. Other plant-pathogen interaction-related transcripts, too, were repressed under solA treatment: in the shoot, DISEASE RESISTANCE PROTEIN (Solyc07g052790.3.1) (log2FC -1.4); in the root GERMIN-LIKE PROTEIN 4 (GLP4, Solyc01g102895.1.1) (log2FC of -1.4). Remarkably, in the shoot, another GLP homologue, Solyc03g123410.1.1, was upregulated with a log2FC of 1.3. GLPs play a role in defence reactions, such as the catalysis of dismutation of reactive oxygen species (Dunwell et al., 2008). Hence, we see mostly an inhibiting effect of solA on immunity-related transcripts in the root, while in the shoot there is a combination of up- and downregulation.
Among the genes of which expression is upregulated by SolA, there are four that are related to photosynthesis. Curiously, three of these are specifically upregulated in the root, some involved in light-independent reactions (a ribulose bisphosphate carboxylase/oxygenase activase (Solyc09g011080.3.1) and TRANSKETOLASE (TKL1, Solyc10g018300.3.1)), but also some involved in light-dependent reactions (RUBP CARBOXYLASE SMALL SUBUNIT (Solyc03g034220.3.1)), with a log2FC of 1.6, 1.5 and 1.2, respectively. In the shoot, a photosynthetic NDH subcomplex B2 (NDF2, Solyc03g062720.3.1, log2FC 0.9) was upregulated.
Lastly, two transcripts encoding cell wall modifying proteins, CELL WALL PROTEIN (CWP) Solyc09g097770.3.1 and XYLOGLUCAN ENDOTRANSGLUCOSYLASE-HYDROLASE 7 (XTH7) Solyc02g091920.3.1 were strongly upregulated in the roots (log2FC of 2.6 and 2.9, respectively). These proteins contribute to modifications to the cell wall in response to abiotic and biotic stresses (Iberkleid et al., 2015) and cell wall expansion (Rose et al., 2002), respectively. In the shoot, a cell-wall degrading enzyme was downregulated with a log2FC of -1.6 (Solyc07g064870.3.1).
SolA induces a similar transcriptional response in Arabidopsis
To evaluate the conservation of the transcriptional response to solA between plant species, we set out to analyse the transcriptional response to solA in Arabidopsis. In the Arabiodpsis RNAseq analysis, the average number of reads per sample was 19.6M and the total mapping percentage 70.8% (unique mapping percentage 59.7%, Table 1), within the range expected for the library preparation method used (Moll et al., 2014). PCA showed partial clustering according to treatment in PC 2 and 3 (Figure 2A), and DEG analysis resulted in the identification of 110 significant DEGs, of which 21 were up- and 89 were downregulated (Figure 2B, Table S3).
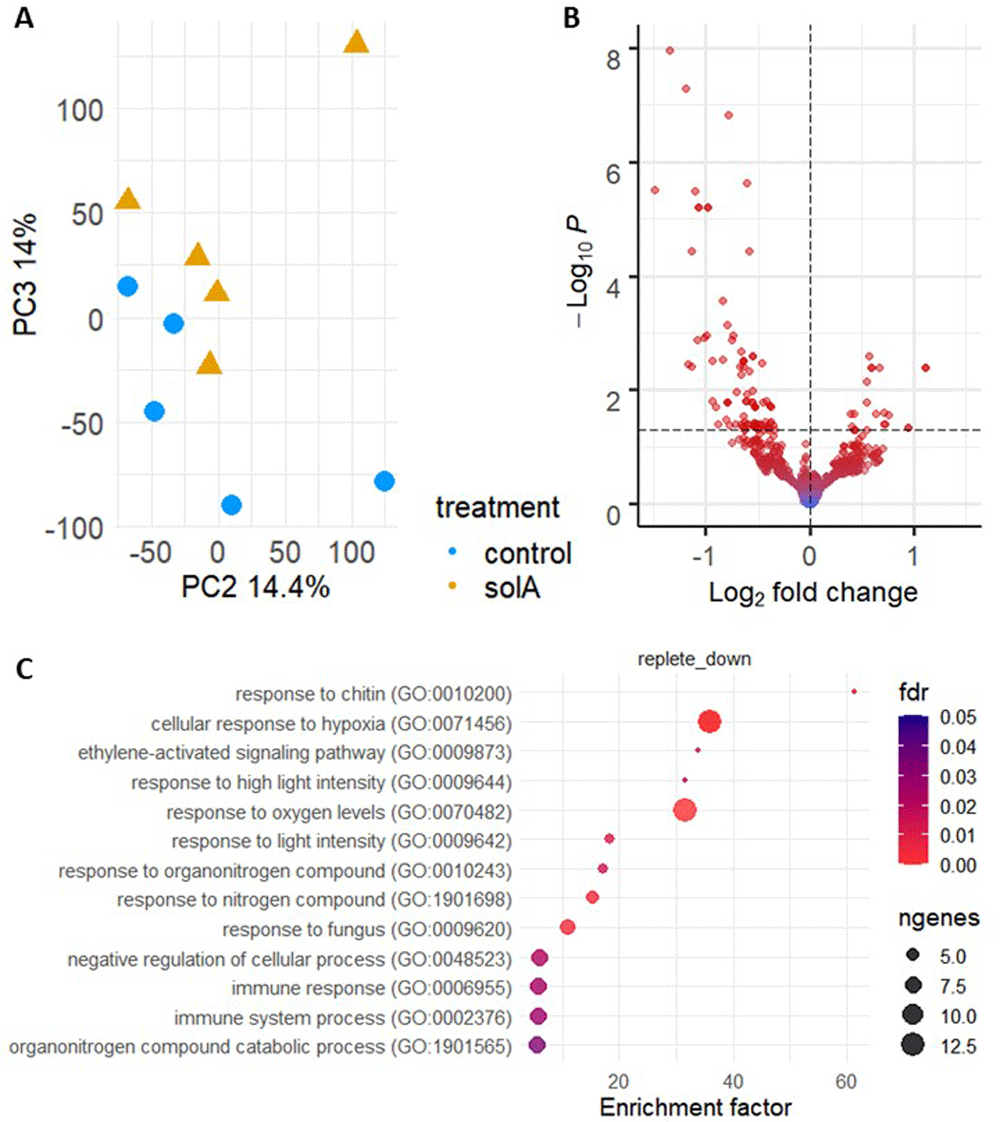
Figure 2.
SolA effect on gene expression in Arabidopsis in A) PCA plot and B) volcano plot, and C) the significantly enriched GO terms for downregulated DEGs, summarized using the ReviGO tool (removal of redundant GO terms).
GO term/pathway analysis showed that solA treatment upregulates specialised metabolite biosynthesis and cell wall expansion, and downregulates ethylene biosynthesis and signalling, and the immune response, just as in tomato (Figure 2C), although no direct homologues were similarly differentially expressed. The only aspect of solA-induced gene expression of tomato that could not be confirmed in Arabidopsis was the upregulation of photosynthesis-related genes; the only photosynthesis-related gene in the Arabidopsis DEG list (Table S3) is PHOTOSYSTEM II BY (PSBY, AT1G67740.1) which was slightly downregulated (log2FC -0.4). The confirmation of the upregulation of secondary metabolite biosynthesis was not ubiquitous, but significant: the downregulation of two F-box/kelch repeat proteins (AT1G80440.1 and AT1G23390.1, log2FC -0.4 and -0.3, respectively) which inhibit phenylpropanoid (precursor of, among others, flavonoids) biosynthesis. Ethylene biosynthesis was inhibited through the downregulation of ACC SYNTHASE 7 (ACS7, AT4G26200.1, log2FC -0.9) and MITOGEN-ACTIVATED PROTEIN KINASE KINASE 9 (MKK9, AT1G73500.1, log2FC -0.6); MKK9 induces, and ACS7 is involved in ethylene biosynthesis. Furthermore, ethylene signalling was inhibited as well, visible in the GO term analysis where “ethylene-activated signalling pathway” was significantly enriched in the down-regulated DEGs (Figure 2C). Although the direct homologue of the tomato ERF that was downregulated, Sl-ERF10-2, was not affected, several other ERFs were downregulated: ERF060 (AT4G39780.1, log2 foldchange -1.0), ERF6 (AT4G17490, log2FC -0.7), ERF1A (AT4G17500.1, log2 foldchange -0.6), ERF104 (AT5G61600.1, log2FC -0.5), RELATED TO AP2.4 (RAP2.4, AT1G22190.1, log2FC -0.3), TEMPERANILLO 1 (TEM1/RAV1, AT1G25560, log2FC -0.6) and TEMPERANILLO 2 (TEM2/RAV2, AT1G68840, log 2 FC -0.6). Interestingly, one of the ERFs, RAP2.4, belongs to the ERFVII transcription factors that mediate the elongation of adventitious root growth under hypoxic conditions (Eysholdt-Derzsó & Sauter, 2019). Indeed, the expression of several hypoxia-induced genes is downregulated by solA and multiple GO terms related to hypoxia are enriched for the downregulated genes (Figure 2C). Moreover, under solA treatment, a gene involved in N-end rule degradation is downregulated. This pathway degrades ERFVII proteins in an oxygen-dependent manner. In short, solA results in downregulation of the response to hypoxia and ethylene.
The downregulation of immunity observed in tomato was reflected by the downregulation in Arabidopsis of NEMATODE-RESISTANCE PROTEIN-LIKE 2 (HSPRO2, AT2G40000.1, log2 foldchange -0.8), AVIRULENCE PEPTIDE AVR9 (AT1G32928.1, log2 foldchange -1.1), RESPONSE TO WOUNDING PROTEIN (AT1G32920.1, log2FC -1.4) and BOTRYTIS-INDUCED KINASE 1 (BIK1, AT2G39660.1, log2FC -0.4). Additionally, RING-type ubiquitin ligases ATL6 and ATL31 (AT3G05200.1 and AT5G27420.1) were both downregulated (log2FC -0.5 and -0.9, respectively). These are upregulated in response to microbe-associated molecular patterns elicitors such as chitin or flg22 and overexpression of both ATL’s results in higher resistance against Pseudomonas syringae (Maekawa et al., 2012). The downregulation of immunity was confirmed by the GO term “Response to chitin”, “Response to fungus”, “Immune system response” and “Immune response” that were enriched for the downregulated DEGs. Lastly, the upregulation of cell wall expansion was confirmed through the upregulation of UDP-D-GLUCURONATE 4-EPIMERASE 6 (GAE6, AT3G23820.1, log2FC 0.4), which is involved in pectin biosynthesis in the cell wall. In conclusion, the results of solA-induced/repressed gene expression in tomato were largely confirmed by the results in Arabidopsis, except for the upregulation of photosynthesis-related genes.
SolA treatment in Arabidopsis did also result in a number of interesting DEGs that we did not see in tomato. For example, the expression of RAV1/TEM1 was downregulated by solA treatment (log2FC of -0.6). Interestingly, RAV1/TEM1 expression is also inhibited by epi-brassinolide (Hu et al., 2004), which is a hormone that is structurally related to solA. RAV1/TEM1 inhibits lateral root growth and hence its downregulation by solA might promote lateral root outgrowth. Furthermore, ZAT10 and ZAT12 (AT1G27730.1 and AT5G59820.1), two zinc-finger proteins that are involved in the activation of ROS-related antioxidant genes upon cold stress, were both downregulated with log2FCs of -0.7 and -0.6, respectively. Together with the downregulation in the response to hypoxia, this indicates not only a downregulation of the response to biotic, but also abiotic stress.
N deficiency affects the Arabidopsis transcriptome more than P
Since SL biosynthesis is upregulated under N and particularly P deficiency and has an important role in helping the plant cope with that stress (Akiyama et al., 2005; López-Ráez et al., 2008; Ruyter-Spira et al., 2011), we decided to assess if the effect of solA on gene expression is affected by nutrient availability. Since the transcriptional starvation response is highly context-dependent (Gutiérrez et al., 2007), we first tested the effect of several starvation conditions - P starvation, N starvation and N+P starvation - on transcription under our experimental conditions. For this experiment, the average number of reads per sample was 19.2M and total mapping percentage was 73.2% (Table 1), within the range anticipated for the used library preparation method (Moll et al., 2014). Seedlings were grown for 10 days on complete medium and subsequently transferred to starvation or complete medium (control). PCA revealed a clear effect for N starvation on transcription, while the effect of P starvation was not clearly visible on PC1 and PC2 (Figure 3A, Figure S1C), nor in the other first 10 PCs (results not shown).
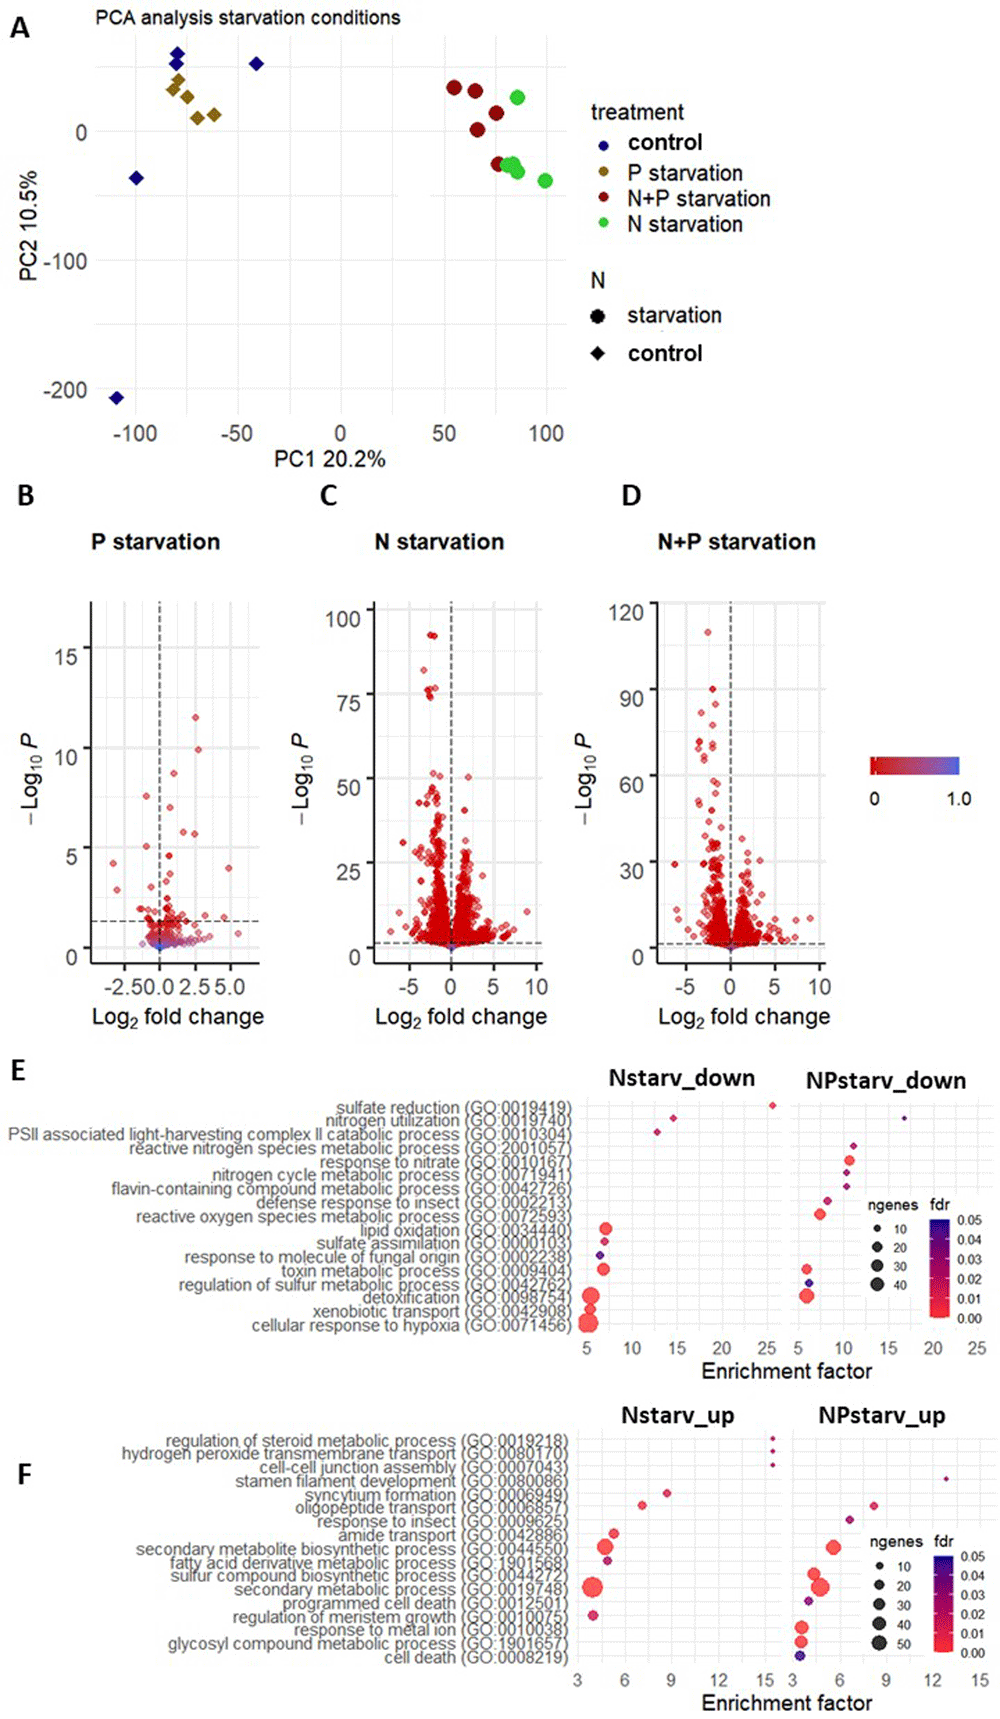
Figure 3.
A, B) PCA plots, C, D) volcano plots showing the effect of P and N+P starvation vs. control conditions on gene expression in Arabidopsis and E–F) dot plots showing the top 10 enriched GO terms (redundancy removed using ReviGO) in down- (E) and upregulated (F) genes of N and N+P starvation vs. control conditions. A full list of all enriched GO terms is shown in Table S5. The comparison P starvation vs. control did not yield any significantly enriched GO terms.
DEG analysis resulted in the identification of 45 DEGs for P starvation, of which only 15 with a |log2FC| > 1.0 (Figure 3B). The P stress response was clear from the upregulation of PHOSPHATE STARVATION INDUCED PROTEIN 3 (PS3, AT3G47420, log2FC 2.7), SPX1 (AT5G20150.1, log2FC 2.5), INDUCED BY PI STARVATION 2 (IPS2, AT5G03545.1, log2FC 2.4), PEPC1 (AT1G17710, log2FC 1.8) and PHOSPHATE TRANSPORTER 1 (PHT1, log2FC 1.7). PS3 and PHT1 were upregulated in tomato, rice and Arabidopsis in earlier studies, confirming their ubiquitous P starvation responsiveness (Cai et al., 2012; Wang et al., 2021b) and SPX1 is regarded as a P starvation marker (Puga et al., 2014). Strongly downregulated under P starvation were genes involved in iron uptake, such as Fe-uptake inducing peptide 3 (FEP3, AT1G47400.1, log2FC -3.3) and FEP2 (AT1G47395.1, log2FC -3.0). Additionally, plants showed a response to oxidative stress by the upregulation of FE-SUPEROXIDE DISMUTASE (FSD1, AT4G25100, log2FC 0.7), FERRITIN-1 (FER1, AT5G01600, log2FC 1.0), ARGININE DECARBOXYLASE 2 (ADC2, AT4G34710.1, log2FC 0.5) and the downregulation of COPPER CHAPERONE FOR SUPEROXIDE DISMUTASE (AT1G12520, log2FC -0.7) and ISOFLAVONE REDUCTASE P3 (AT1G75280, log2FC -0.7). The metal, and specifically iron, status of the plant has been linked to phosphate availability before (Hirsch et al., 2006). The upregulation of PURPLE ACID PHOSPHATASE 17 (PAP17, AT3G17790, log2FC 0.5) signifies the strategy from the plant to solubilize inorganic P via the excretion of phosphatases (Zhang et al., 2014). Finally, differential expression of multiple transporter genes was observed, for example CATION/H+ ANTIPORTER 17 (CHX17, AT4G23700, log2FC 1.3) and CATION/CALCIUM EXCHANGER 1 (CCX1, AT5G17860.2, log2FC 0.5).
N starvation treatment of Arabidopsis seedlings in our system resulted in 5249 DEGs, of which 1459 had a |log2FC| > 1.0 (Table S4). Hence, the plant’s transcriptional response to N starvation was much stronger than to P starvation. The N starvation gene expression response shows considerable overlap with N starvation studies in Arabidopsis reported earlier, such as upregulated auxin transport, affected cell wall biogenesis and nitrogen-containing compound transport (Krapp et al., 2011). GO term analysis on downregulated DEGs showed highest enrichment for sulphate reduction and assimilation, nitrogen utilization, PSII associated light-harvesting complex II catabolic process, lipid oxidation, response to molecule of fungal origin, toxin metabolic process and detoxification, xenobiotic transport and cellular response to hypoxia (Figure 3E, full list of enriched GO terms in Table S5). For upregulated DEGs, enrichment was highest for regulation of steroid metabolic process, hydrogen peroxide transmembrane transport, cell-cell junction assembly, syncytium formation, oligopeptide transport, amide transport, secondary metabolite biosynthetic process, fatty acid derivative metabolic process, sulphur compound biosynthetic process and regulation of meristem growth.
N and P starvation responses have been shown to be linked. For example, P starvation reduces the uptake, transport and assimilation of N (Krouk & Kiba, 2020). However, N starvation strongly represses the P starvation response, suggesting that N deficiency responses are prioritised over the P deficiency response (Krouk & Kiba, 2020). In our experiment, combined N+P starvation resulted in the identification of 3403 DEGs, of which 948 had a |log2FC| > 1.0. There was indeed considerable overlap between enriched GO terms of N and N+P starvation for the induced DEGs (Figure 3E, F, Table S5), such as for the upregulation of nitrogen-containing compound transport and photosynthesis, and the downregulation of amino acid metabolic processes and sulfate reduction and assimilation. Unique GO terms for N+P starvation are marked (Table S5) and were mostly related to response to reactive oxygen species, response to light, development and biosynthetic/metabolic processes for downregulated DEGs, and to response to metal ions (iron and zinc), immune response, response to hypoxia and nutrient starvation response for upregulated DEGs.
An upset plot (Figure S3) shows the overlap of DEGs between the different treatments. There are only 20 genes that are differentially expressed in all three treatments. Most overlap is indeed visible between the N and N+P starvation treatments, although N starvation alone leads to much more unique DEGs, which make up more than half of the total DEGs for that treatment. In conclusion, nutritional starvation treatments of Arabidopsis seedlings in our growth system resulted in considerable differential gene expression, especially in the N and N+P starvation treatments. The DEGs show considerable overlap with other studies on the transcriptional response in plants to N and P deficiency.
SolA-induced transcriptional changes in P starved Arabidopsis are similar as in non-starved plants
In a next step we decided to analyse the effect of SolA on gene expression under nutrient deficiency conditions. Because of the overlap in the transcriptional response between N and N+P starvation we did this analysis on the P and N+P starvation treatments. Hereto, plants were grown for 24h under nutrient deficiency and then treated with solA for 2 h.
SolA treated and untreated P-starved plants separated in a PCA plot in the third component (Figure 4A) and DEG analysis resulted in the identification of 36 DEGs (Table S3). From the strongly downregulated genes, 3 are heat shock proteins (AT5G59720.1, AT3G46230.1 and AT1G16030.1, log2FCs -2.5, -1.4 and -1.2 respectively), of which the two former were also downregulated by solA treatment in the shoot of tomato, but not in Arabidopsis (grown under normal nutrient conditions). Furthermore, three of the ERFs that were downregulated by solA under control conditions were downregulated by solA under P starvation as well (ERF071, TEM1, TEM2). Enriched GO terms were only detected for downregulated DEGs and included response to hypoxia, response to organonitrogen compound, response to chitin and protein folding.
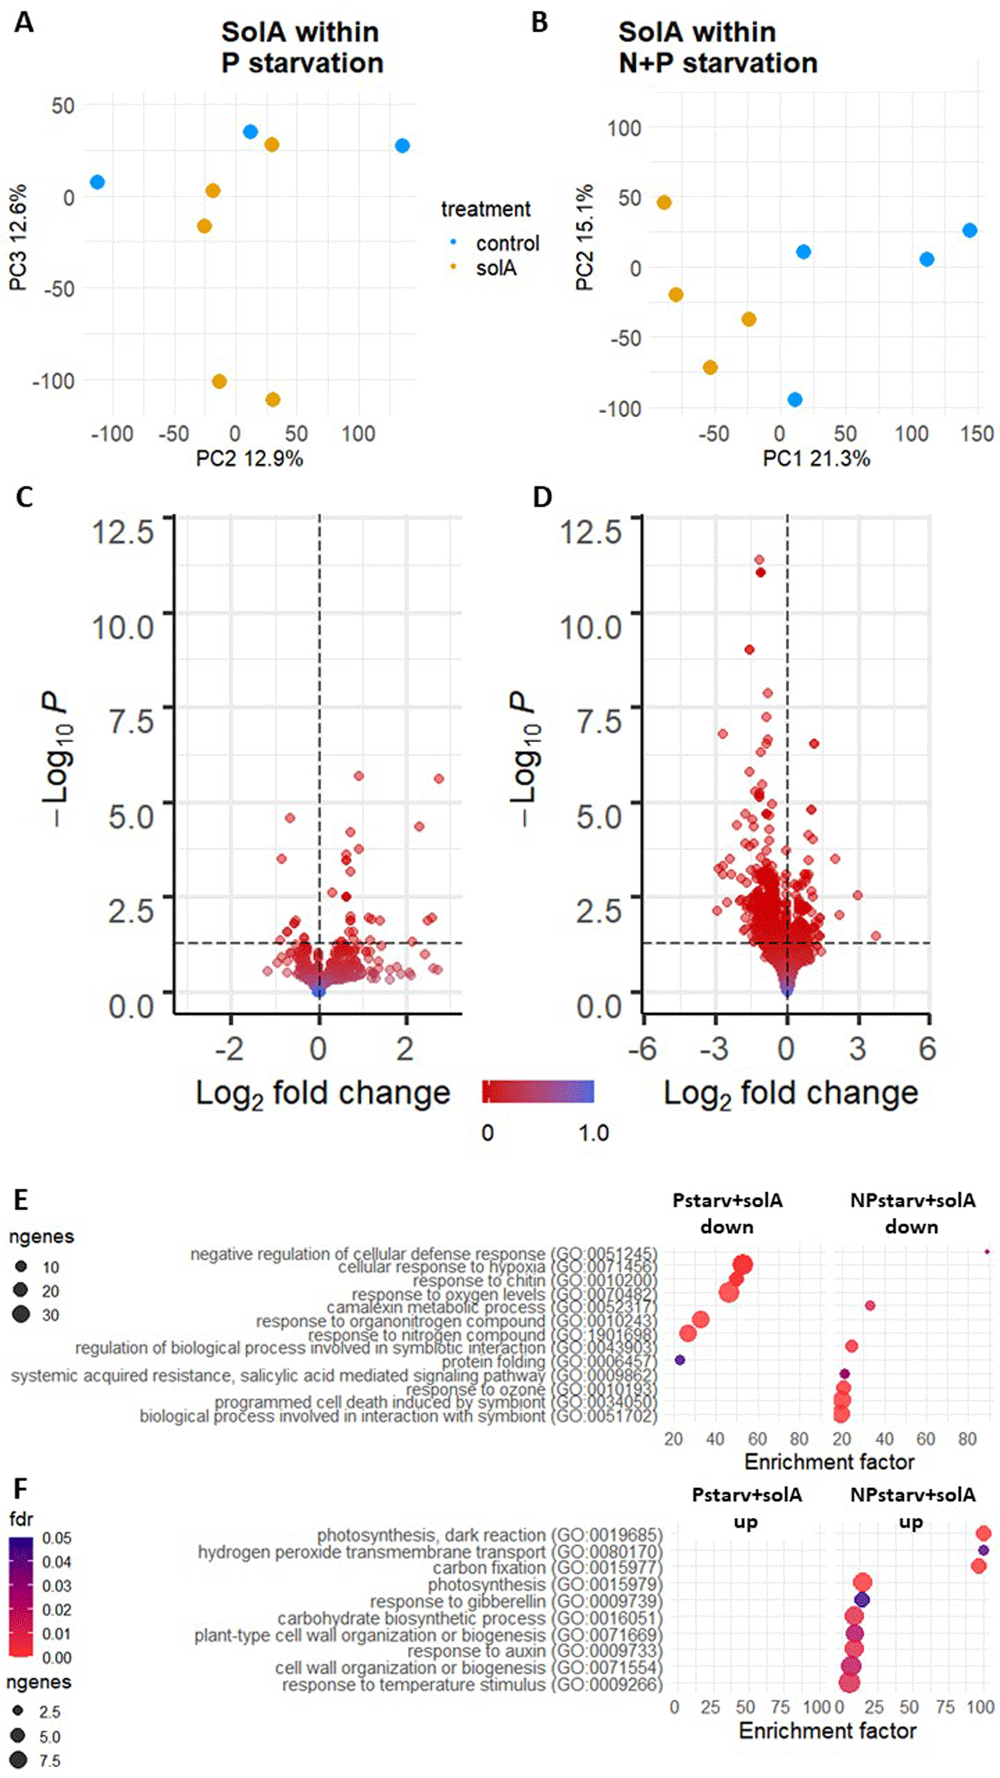
Figure 4.
A, B) PCA plots, C, D) volcano plots and E–H) dotplots with top enriched GO terms (redundancy removed using ReviGO) showing the effect of solA within the P and N+P starvation treatments on gene expression in Arabidopsis. The full list of enriched GO terms is shown in Figure S4.
In conclusion, the effect of solA under P starvation is roughly comparable to the effect of solA under control conditions (Figure 2C, Figure 4E). Under both conditions, solA results in downregulated genes involved in chitin response, hypoxia response, ethylene signalling, and organonitrogen compound response. Furthermore, solA treatment of Arabidopsis seedlings under P starvation shows overlap with solA treatment of tomato seedlings under control conditions, since in both cases several heat shock proteins, some of which are homologues, are downregulated, and XTH genes and genes involved in photosynthesis, such as LIGHT HARVESTING COMPLEX PHOTOSYSTEM II (LHCB4.2, AT3G08940, log2FC 0.4), are upregulated.
SolA treatment of N+P starved plants results in strong downregulation of ethylene, immune and hypoxia response, and upregulation of photosynthesis and carbon fixation
In the N+P starvation treatment, one outlier (sample S46) was detected after visual inspection and removal was justified by the fact that it lies more than six standard deviations from the other points in the group in PC1 (Figure S1A, B). Analysis of the solA effect showed that the solA-treatment clustered separately from the control samples along PC1 (Figure 4B), showing that solA application represents the main source of variation.
The treatment with solA under N+P starvation resulted in many more DEGs than under control (Figure 2B) or P starvation conditions (Figure 4C) that were also more strongly differentially expressed (Figure 6, Figure S2). Interestingly, the overlap between solA-induced DEGs under the different nutritional conditions was low (Figure 5). Only 6 genes were differentially expressed in all three conditions, and 382 out of 412 DEGs (93%) under N+P starvation were unique for that condition.
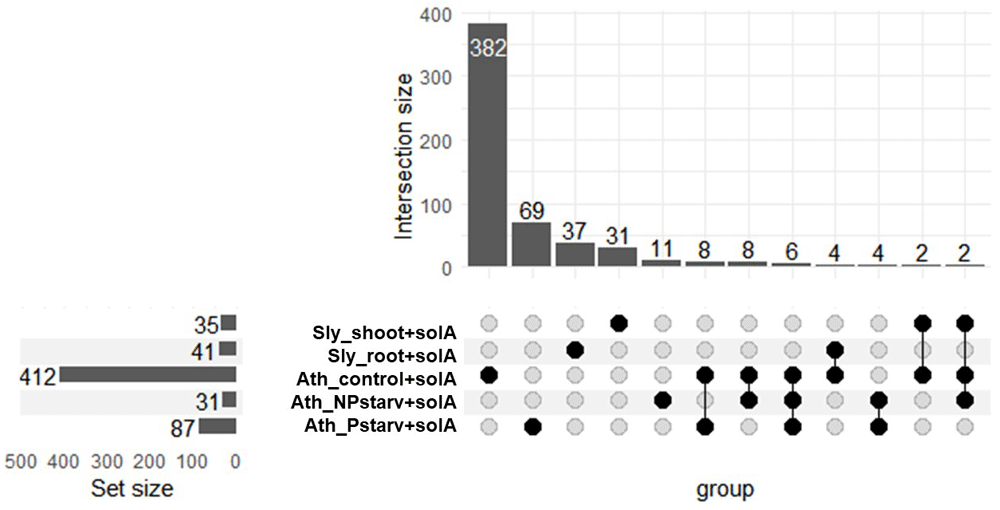
Figure 5. Upset plot showing the overlap between all solA-treatments and the total number of DEGs per treatment.
GO term analysis of N+P starved solA treatment retrieved mostly enriched terms in the downregulated DEGs. The top 10 terms were related to immune response, response to hypoxia, and camalexin biosynthesis (Figure 6, Figure 4E), but digging deeper shows also enrichment for phytoalexin biosynthesis and a wider array of terms linked to immune response and symbiont relationships (Figure S4A). Upon further inspection, these terms are enriched because of a downregulation in defense-related genes, which could point towards the facilitation of (a) symbiotic relationship(s). There is overlap with the solA induced response in tomato with JACALIN-LIKE LECTIN 3 (AT5G18130, log2FC -0.5, in tomato -1.1) and two heat shock proteins that share a homologue in tomato (AT5G59720.1 and AT3G46230.1, log2FC -0.1 and -1.5, in tomato -0.1).
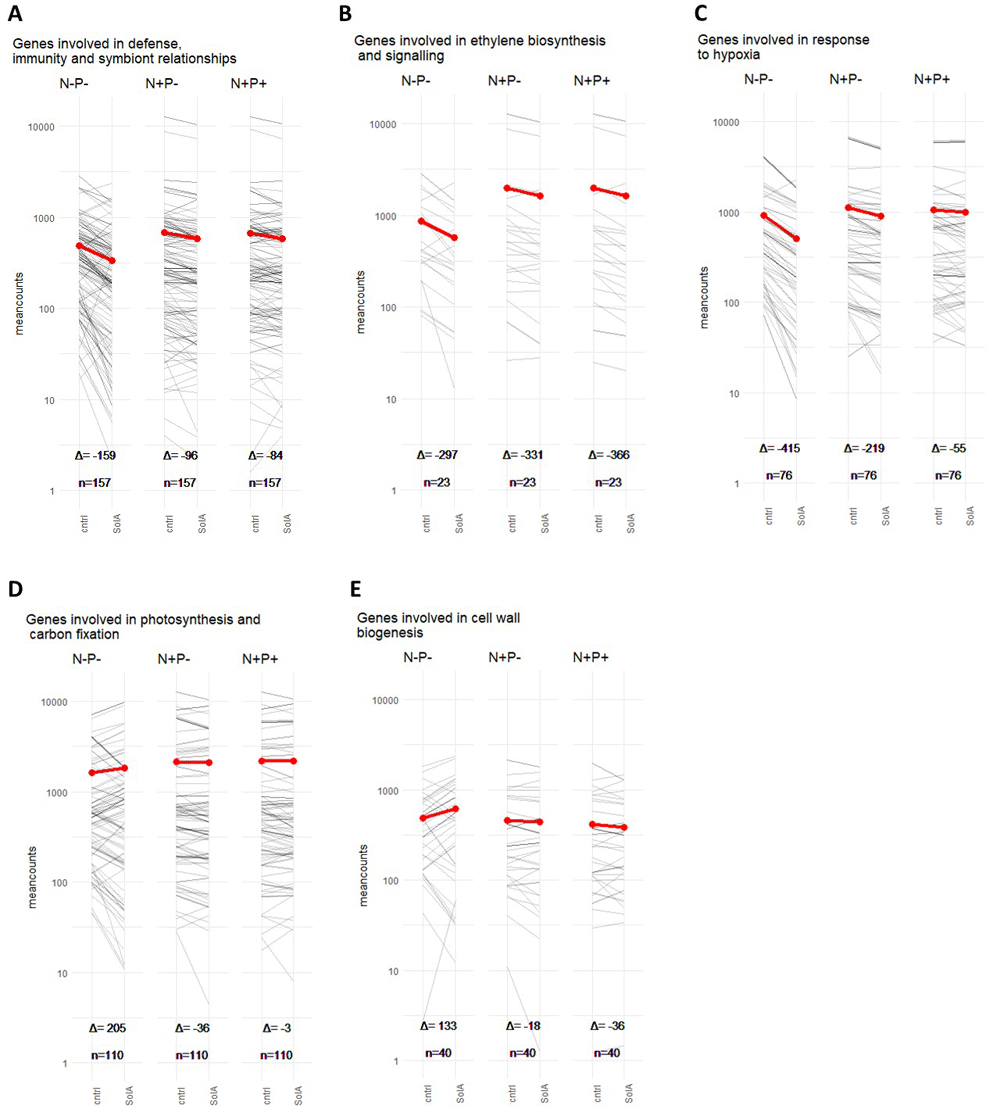
Figure 6. Plots of normalized gene counts of all genes labelled with specific GO terms in gray, with in red the average normalized gene count, under control or solA treatment, respectively.
A) genes involved in defense, immunity and symbiont relationships. B) genes involved in ethylene biosynthesis and signalling C) genes involved in response to hypoxia D) genes involved in photosynthesis and carbon fixation E) genes involved in cell wall biogenesis. Δ indicates the difference between average normalized gene count with solA treatment and average normalized gene count control, and hence the slope of the red line. n is the number of genes in the group on which the averages were based.
For the upregulated genes, the top-10 enriched GO terms were related to photosynthesis and carbon fixation, response to hormones, hydrogen peroxide transmembrane transport and cell wall biogenesis and organization (Figure 4F, Figure 6, Figure S4B). The hormone response to gibberellin is enriched because of the upregulated expression of the aquaporin TIP1-1 (AT2G36830.1, log2FC 0.4), the expansin EXPA1 (AT1G69530, log2FC 0.6), the transcription factor GLABROUS INFLORESCENCE STEMS (GIS, AT3G58070.1, log2FC 2.0) and GATA TRANSCRIPTION FACTOR 21 (AT5G56860.1, log2FC 0.5) (Table S3). The latter gene is also responsible for the “response to auxin” enriched term, in addition to 4 small auxin upregulated RNA (SAUR) transcripts: SAUR78 (AT1G72430.1, log2FC 0.6), SAUR16 (AT4G38860.1, log2FC 0.8), SAUR14 (AT4G38840.1, log2FC 0.9) and SAUR6 (AT2G21210.1, log2FC 1.0) (Table S3). SAURs play a role in cell elongation and growth, which they might achieve by regulating expansins (Stortenbeker & Bemer, 2019). SAURs induce cell elongation by inhibiting PP2C.D phosphatases, which leads to cell wall acidification and thereby elongation according to the acid growth theory (Spartz et al., 2014). This matches with the results in tomato, in which CWP (CELL WALL-MODIFYING PROTEIN) and XTH-7, which affect cell wall expansion, were upregulated. Further overlap with tomato is the upregulation of CHS (AT5G13930.1, log2FC 0.5, in tomato 2.0) which is involved in flavonoid biosynthesis. There was also overlap in carbon fixation-related genes between tomato and Arabidopsis under N+P starvation with the upregulation of NDH-DEPENDENT CYCLIC ELECTRON FLOW, NDF2 (AT1G64770, log2FC 0.5, in tomato 0.9), a component of photosystem I, and TRANSKETOLASE 1 (TKL1, AT3G60750.1, log2FC 0.3, in tomato 1.5), which participates in the pentose phosphate and the Calvin cycle.
Discussion
Plants have been shown to exude compounds into the rhizosphere that not only reflect the plant’s nutritional status but are also involved in the adaptation to the corresponding nutrient deficiency stress (Canarini et al., 2019). For example, SLs play a role in alleviation of P starvation stress by altering root architecture and attracting beneficial micro-organisms (Akiyama et al., 2005; López-Ráez et al., 2008). Here, we hypothesized that solanoeclepin A (solA), hitherto only known as potent hatching factor for Potato Cyst Nematode, might have similar specific effects under nutrient deficiency which we tested for the two most crucial elements for plant growth, P and N. We show, through transcriptomics analysis, that solA affects gene expression in tomato and Arabidopsis particularly under nutrient starvation (Figure 1, Figure 2, Figure 4). SolA treatment of N+P starved Arabidopsis induces an approximately 10-fold stronger response in gene expression (412 DEGs) than in tomato (shoot and root, 35 and 41 DEGs, respectively) and Arabidopsis grown under control nutrient conditions or P starvation (87 and 31 DEGs, respectively; Figure 5). Downregulated DEGs are ubiquitously involved in immune response and symbiont relationship signalling (Figure 6A), hypoxia and ethylene signalling (Figure 4E, Figure 6B, C) and upregulated DEGs are mostly involved in photosynthesis and carbon fixation (Figure 6D), and growth and development through hormone signalling of auxin and gibberellin and cell wall expansion (Figure 4F, Figure 6E). Additionally, some genes involved in secondary metabolism are up- (for example, chalcone synthase involved in flavonoid biosynthesis) or downregulated (for example, camalexin biosynthesis). For most of these processes, the differential expression encompassed more genes and a higher absolute log2FC on average if the plants were grown under N+P deficiency (Figure 6).
Before evaluating the effect of solA, we studied the effect of P, N and N+P starvation alone on Arabidopsis. In our system, P starvation only induced small transcriptional changes (45 DEGs) (Figure S3). The low amount of DEGs induced by P starvation was confirmed by other studies: for example, Hammond et al. (Hammond et al., 2003) found only 4 DEGs after 28h of P starvation in Arabidopsis shoots in a microarray. Still, several P starvation marker genes were upregulated in our analysis (Table S4), proving that a P shortage was perceived by the plants. We found a downregulation of cation transporters, which is probably due to the fact that the absence of the phosphate anion results in higher availability of cations, for example Fe2+ (Li & Lan, 2015). This leads to oxidative stress, and indeed we saw altered expression levels of genes involved in the response to oxidative stress. N and N+P starvation resulted in a much stronger transcriptional response, with 5222 and 3384 DEGs, respectively, of which 2362 are overlapping (Figure S3). For both conditions, typical N starvation response genes were affected, such as the ubiquitous upregulation of 10 root nitrate transporters (NRT), with the exception of NRT1.8 that was downregulated in both N and N+P starvation. N starvation in plants results in the recycling of vacuolarly stored N and hence an increase in transport (Krouk et al., 2010), which is reflected in our data (Figure 3F, Table S5). Furthermore, N deficiency increases auxin transport towards the shoot and thereby represses lateral root formation, whereas mild N shortage results in accumulation of auxin in the root, which does result in increased lateral root growth (Asim et al., 2020; Jia & von Wirén, 2020). Indeed, for both N and N+P starvation, this is reflected in our data (Table S4). However, N control of gene transcription is dependent on additional conditions, since from many microarray studies, only around 300 genes were found to be context-independently differentially expressed (Gutiérrez et al., 2007). Overall, the transcriptional responses to the three starvation conditions in our study agree with the existing literature (Asim et al., 2020; Cai et al., 2012; Jia & von Wirén, 2020; Li & Lan, 2015; Puga et al., 2014).
The most ubiquitously affected process in our analyses was immune response and defence (Figure 6A). These processes are downregulated under N and P starvation, and are even further repressed upon solA treatment. Indeed, the general idea is that under nutrient stress, plants favour nutrient acquisition over immune response. Hence, from our data, it can be speculated that solA promotes the inactivation of the immune system, possibly to preserve energy for coping with nutrient stress. Moreover, since solA is excreted into the rhizosphere, it could have a similar function to SLs, to recruit a beneficial rhizobiome or endophytes that enhance nutrient uptake. Lowering of the immune response can facilitate the colonisation of plant roots by beneficial micro-organisms and hence improve nutrient acquisition (Hacquard et al., 2016). Rozpadek et al. suggested that SLs might mediate this immune suppression under P starvation for some endophytes (beneficial fungi) (Rozpadek et al., 2018). Furthermore, solA induces the biosynthesis of alkaloids and flavonoids, in tomato, and there are indications that the same happens in Arabidopsis, where phenylpropanoid biosynthesis inhibitors are downregulated. These compounds are excreted in root exudates and function as repellents against pathogens (terpenoids/alkaloids) and attractants for AM fungi (flavonoids) (Tian et al., 2021). On the other hand in Arabidopsis the biosynthesis of the antimicrobial camalexin (Umezawa & Shin, 1999) is downregulated. It is already known that P starvation induces metabolic changes (Pant et al., 2015), and from our data it becomes apparent that solA further affects the plant’s intricate cocktail of signalling molecules, on the one hand suppressing its immune system, possibly to welcome beneficial microbes that can help overcome nutrient deficiencies, on the other hand upregulating a selection of pathogen repelling metabolites.
Under both N and N+P starvation, GO terms related to response to hypoxia are enriched; under N starvation, only in downregulated genes, under N+P starvation, in both up- and downregulated genes. SolA induces a further downregulation of hypoxia response, especially under N+P starvation. Furthermore, solA downregulates ethylene biosynthesis and signalling (Figure 6). Hypoxia affects root architecture; it inhibits primary root growth, whereas it promotes adventitious root growth, which is achieved through ethylene response factor VII (ERFVII) signalling (Eysholdt-Derzsó & Sauter, 2017; Eysholdt-Derzsó & Sauter, 2019). ERFVII are unstable proteins, but are stabilized under hypoxia because of the inhibition by oxygen of plant cysteine oxidases. ERFVIIs then move to the nucleus to induce transcription of anaeroby related genes (Loreti & Perata, 2020). The resulting altered root architecture might aid the plant in nutrient acquisition and this would fit with the stronger downregulation by solA of genes involved in response to hypoxia under N+P stress compared to only P stress or control conditions (Figure 6D). However, there are also various other possible explanations for the reduction in hypoxia response under starvation conditions and under solA treatment. Some tissues, like the meristem, have a permanently hypoxic state, and hence, it can be a non-stress state required for the production of new leaves (Weits et al., 2019). The loss of the hypoxic state under nutrient starvation may be a means to inhibit growth. Alternatively, tissues can become hypoxic when metabolic activity is high, and removal of hypoxic state can imply a repression of anaerobic fermentation (Loreti & Perata, 2020). Thirdly, hypoxia is linked to biotic interactions, detrimental or beneficial. For example, nitrogen-fixing rhizobia need a hypoxic environment since the nitrogenase enzyme is inactivated by O2. Hypoxia-induced genes are also activated at the interface between plant and pathogen, although it is unclear whether this is to help the plant fight the invader, or is caused by increased metabolic activity of both organisms (Loreti & Perata, 2020). In te present study, reduction of the hypoxia response can be linked to the suppression of the immune response that is detected mostly under N starvation in our dataset. Lastly, hypoxia signalling has been shown to use the same signal transduction pathway as P starvation response (Klecker et al., 2014); hence, the GO term might be enriched because the DEGs involved are responding to the starvation, not a change in oxygen supply.
The downregulation of ethylene biosynthesis and signalling could, besides or instead of its putative role in altering root architecture described above, also be linked to suppression of defence. Ethylene Response Factors (ERFs) are involved in relay of signals that lead to the transcription of ethylene and jasmonate-induced defence genes (Huang et al., 2016). For example, ERF6, which is downregulated in Arabidopsis both in control as well as in N+P starvation, is involved in resistance against Botrytis cinerea (Moffat et al., 2012). Additionally, prevention of ethylene induced defense responses are essential for the symbiotic relationship with nitrogen-fixing rhizobia (Berrabah et al., 2018). The resulting increased association with rhizobia might be a means for the plant to cope with and relieve N deficiency stress.
Lastly, genes related to growth are upregulated by solA in tomato and in Arabidopsis under N+P starvation. For example, cell wall expanding proteins and inducers thereof are upregulated in tomato and Arabidopsis, respectively. Furthermore, photosynthesis and carbon fixation-related genes are upregulated by solA, but in Arabidopsis only under N+P stress (Figure 6F). Upregulation of photosynthesis-related genes in root has been shown before, in Brassica napus, under SL treatment (Ma et al., 2017). All this suggests that solA promotes growth. Indeed, plant immunity and growth are usually antagonistic, however, plants grown under nutrient stress usually exhibit reduced growth, rather than enhanced. Perhaps the increased growth is analogous to the stimulation of growth by SLs, simulating lateral root growth under P starvation, to improve uptake of phosphate from the soil (Ruyter-Spira et al., 2011).
Conclusion and future perspective
In the present study, exogenous solA treatment followed by transcriptomics was used to explore a putative signalling function of solA in plants. Both solA and SLs were discovered because of their detrimental effect on the plant: solA for the hatching activity on parasitic cyst nematodes, and SLs for the germination of parasitic plants. Later, the SLs were discovered to also have an indispensable beneficial role for the plant, facilitating the symbiosis with AM fungi. In the present study, we show that solA represses the hypoxia response and ethylene biosynthesis and signalling, which might result in adapted root architecture. SLs affect root architecture as well (Ruyter-Spira et al., 2011). Furthermore, the immune response was suppressed under exogenous solA treatment and specialised metabolite biosynthesis was affected. The relevance of these findings cannot be explained by only transcriptomics, but it is tempting to link this to the attraction of beneficial microbial symbionts, and facilitation of their colonization of the plant root. SLs, too, are signalling molecules in the rhizosphere (they induce hyphal branching of AM fungi (Akiyama et al., 2005) and alter the rhizobiome (Schlemper et al., 2017). Additionally, the biosynthesis of specialised metabolites was differentially expressed under exogenous SL treatment (Zhan et al., 2018). Lastly, solA and SLs both enhance the expression of genes involved in photosynthesis and carbon fixation pathways (Zhan et al., 2018), although solA does this mostly under N+P starvation.
SolA is only produced by members of the Solanaceae (Guerrieri et al., 2021), but our experiments show that it elicits a similar response in tomato and a distantly related species that has not been reported to produce this metabolite, Arabidopsis. However, solA is not the only eclepin: glycinoeclepin A, B and C are produced by kidney bean and act as a hatching factor for soybean cyst nematode (Heterodera glycines) (Fukuzawa et al., 1985). The cross-species activity of the eclepin used in our study may be qualified as interspecific facilitation (Wang et al., 2021a). Furthermore, it raises the option that more eclepins exist in the plant kingdom, and that, although specific eclepins, such as solA, are only produced by a (group of) species, other plant species can detect a range of eclepins, which would qualify the eclepins as a new class of plant signalling molecules.
Phenotypic and molecular studies on the beneficial role of solA on the plant should shed more light on the effect of solA on plant development, which could potentially qualify it as a new plant hormone and for which we laid the foundation with this transcriptomics study. To this end, the molecule should become more readily available, possibly through purification from root exudates, since chemical synthesis is very complicated and time-consuming (Tanino et al., 2011). SolA is produced in low sub-nanomolar concentrations by 4-6 week old Solanaceae species, but considerable variation exists between genotypes (Guerrieri et al., 2021). Using high producers in combination with an optimized extraction and purification protocol should yield enough solA to test a variety of conditions, species and mutants.
In this study, for the first time, the beneficial role of a cyst nematode hatching factor, solA, was investigated. RNAseq experiments on both tomato and Arabidopsis showed overlapping results, namely, a suppression of the immune response, ethylene biosynthesis and signalling, and hypoxia response. Furthermore, solA induces growth through enhanced photosynthesis, carbon fixation and cell wall expansion. These effects were more severe under N+P starvation in Arabidopsis, and might aid in optimizing plant physiology towards uptake of nutrients and recruiting a beneficial rhizobiome. Therefore, this study improves our understanding of the plant response to an important, hitherto considered detrimental, rhizosphere signalling molecule, and the outcomes might aid in understanding the plant’s adaptation strategy to cope with nutrient starvation.
Ethics and consent
Ethical approval and consent were not required.