Plain summary
The fungi present in the human gut have not been widely studied. Most laboratory sequencing techniques and data analyses protocols still impose limitations on the study of the fungal composition of the human gut. In this study, we assessed the capacity of the nanopore sequencing methodology to correctly classify a fungal mock community of known composition and abundance. The artificial community was composed of Candida glabrata, Meyerozyma guilliermondii, Pichia kudriavzevii, Clavispora lusitania, and Candida parapsilosis. The approach was implemented using the MinION system and involved the previous amplification of a target genomic region called internal transciber spacer from the five species. These amplified regions were mixed in equal concentrations and then the nanopore sequencing protocol was performed. Nanopore sequencing successfully retrieved the composition of the fungal mock community. However, the approach was unable to correctly assess the expected relative abundances of each species, showing some yet undetermined bias that may be related to the size of the respective target DNA fragments. C. lusitaniae was consistently overrepresented in the mixtures, while C. glabrata was underrepresented. The remaining three species showed relative abundances more aligned with the expected values. Although not yielding the expected results for the relative abundances, the values obtained from two sequencing runs were similar for all species, suggesting a good reliability but questionable accuracy in this sequencing approach.
Introduction
The global fungal diversity is underestimated (Garcia-Solache & Casadevall, 2010; Pal, 2017; Taylor et al., 2001; Tedersoo et al., 2014). The gut mycobiome is shaped from birth, and ongoing analysis from this early stage provides a window for study of its development and maturation. After the early development years, the gut mycobiome stabilizes, although possessing a lower alpha-diversity in comparison with the bacterial microbiota (Nash et al., 2017; Raimondi et al., 2019). The most abundant and observed phyla at this stage are Ascomycota, Basidiomycota, and Mucoromycota, the last one much less abundant than the rest (Nash et al., 2017; Raimondi et al., 2019; Wu et al., 2020). Even though more stable, the mature gut mycobiome is still characterized by relative instability with both inter- and intra-individual differences occurring over time (Nash et al., 2017; Raimondi et al., 2019). Transient gut colonization can potentially explain the fungal composition instability, because some fungi reach the gut as a result of environmental exposure and via dietary intake (Nash et al., 2017; Raimondi et al., 2019). Despite recent advances in mycobiome studies, associations with the onset of some human diseases remains to be further explored. As per the bacterial microbiome, the fungal microbiome’s variability between individuals presents further challenges in identifying patterns between mycobiome and remaining host physiology (Hallen-Adams & Suhr, 2017). For example, it is not clear how dynamic the mycobiome is in relation with ageing. Prolonged exposure to a processed diet and high isolation periods in pathogen-free environments has been shown to reduce fungal gut diversity (Mims et al., 2021). While metabarcoding approaches have been used to assess the diversity and role of the gut mycobiome, differences in experimental design and downstream analyses may induce bias and differential outcomes (Nilsson et al., 2019a). Nanopore sequencing is a recently developed third-generation sequencing technology allowing the development of fast, cost-effective, and portable approaches to study complex ecosystems, such as the gut microbiome, and it represents a promising tool to further unveil the fungal component of these microbial communities (Wang et al., 2021). Thus, it is necessary to further investigate the impact of environmental and pharmacological agents on the whole gut microbiome, specifically the mycobiome component, allowing a more detailed comprehension about its composition, functionality and relationship with the host (Gutierrez & Arrieta, 2021).
Methods
Fungal growth conditions
A fungal mock community was prepared with five strains, representing species Meyerozyma guilliermondii, Candida glabrata, Pichia kudriavzevii, Candida parapsilosis, and Clavispora lusitaniae, that are usually found as members of the human gut mycobiota. These strains were obtained from a collection of historical clinical fungi isolates stored at -80° located at the School of Applied Sciences, University of Brighton (United Kingdom) originally obtained from the Instituto de Higiene e Medicina Tropical, Universidade Nova de Lisboa (Portugal). All stock isolates were grown in 5 mL of Sabouraud dextrose broth in universal flasks for 2 days at 37°C under shaking (270 rpm). After growth was observed, isolates were plated and streaked twice to achieve purification in Potato Dextrose Agar and incubated at 30°C for 18–24h until DNA extraction.
Fungal DNA extraction and amplicons generation
Fungal isolates identification confirmation. For DNA extraction, a custom protocol was performed. From fresh culture plates (typically 18 to 24 h), a small amount of yeast cells was collected and transferred to a 1.5 mL microtube containing 500 µL sterile water. The microtube was vortexed at 10,000× g for 5 min and the supernatant discarded. Then, 300 µL of lysis buffer (100mM Tris-HCl [pH 8.0], 1 mM EDTA, 2% Triton X-100) were added to the pellet and mixed with the equivalent of 100 µL glass beads (ø = 0.5 mm). The mixture was briefly vortexed and incubated at 95°C for 10 min before cell’ disruption in the Savant Bio 101 FastPrep FP120 (Savant Instruments, India) (maximum speed = 6.5; 40 sec). A final centrifugation step was performed for 5 min at 10,000× g. The supernatant containing the extracted DNA was stored at -20°C. Polymerase chain reaction (PCR) was performed to amplify the ITS region with diluted genomic DNA (1:10) from each isolate, with the following primer sequences: ITS1F – CTTGGTCATTTAGAGGAAGTAA; ITS4 – TCCTCCGCTTATTGATATGC (Op De Beeck et al., 2014). The PCR mixture (25 µL total volume) contained between 1 and 4 ng of DNA template (or 6 µL of unquantified initial DNA), 1X Standard Taq Reaction Buffer, 0.2 mM of dNTPs, 0.4 µM of ITS1F and ITS4, and 0.625 U of Taq DNA Polymerase (New England Biolabs, United Kingdom). The PCR thermal profile consisted of an initial denaturation of 1 min at 95 °C, followed by 35 cycles of 30 s at 95°C, 40 s at 50°C, 60 s at 68°C, and a final step of 5 min at 68°C. The PCR products were visualized in an agarose gel 1.1% (w/v) running for 1 hour at 220 V (ThermoFisher, United States of America). After positive band check, the PCR products were purified with GeneJET purification kit according to the manufacturer’s protocol (Thermofisher, United States of America) and sequenced by Sanger sequencing using the same primers (Eurofins, Germany).
Fungal mock community amplicons generation and library preparation. To achieve the best quality gDNA, purified isolates’ DNA extraction was performed with MasterPure Yeast DNA Purification Kit, according to the manufacturer’s protocol (Lucigen, United States of America). Extracted DNA was stored at -20° C until further use. The PCR mixture and thermal profile performed was described above. PCR products were visualized in an agarose gel 1.1% (w/v). Then, PCR products were purified with GeneJET purification kit, according to the manufacturer’s protocol and stored in the fridge at 4°C until further use. To build the mock community, equimolar concentrations of the purified PCR products originating from the five strains were pooled together for library preparation, i.e., 40 fmol per strain, accordingly to ONT protocols.
Nanopore sequencing approaches
Library of ITS amplicons from a fungal mock community. For the nanopore sequencing approach, optimization using a fungal mock community, the Ligation Sequencing Kit (SQK-LSK 109, ONT, United Kingdom) was applied. A mixture comprising ITS amplicons previously generated by PCR were used as template for DNA library preparation. Two independent DNA sequencing libraries were prepared for separate sequencing runs. The pooled ITS amplicon concentration was adjusted to reach 1 μg in a volume of 47 μL, with 1 μL of DNA CS (sequencing positive control containing DNA obtained from lambda phage), 3.5 μL of NEBNext FFPE DNA Repair Buffer (New England Biolabs, United Kingdom), 2 μL of NEBNext FFPE DNA Repair Mix (New England Biolabs, United Kingdom), 3.5 μL Ultra II End-prep reaction buffer, and 3 μL of Ultra-prep enzyme mix (New England Biolabs, UK), completed with molecular biology-grade water. The mixture was incubated in a thermal cycler at 20°C for 5 min and 65 °C for 5 min. A purification step using 1× Agencourt AMPure XP beads was performed. Briefly, the mixture was incubated at room temperature with gentle mixing for 5 min, washed twice with 200 μL fresh 70% ethanol, with pellet allowed to dry at room temperature for 1 min before DNA being eluted in 61 μL nuclease-free water, and incubated at room temperature for less than 5 min. A 1 μL aliquot was quantified by fluorometry using Qubit 4 Fluorometer. For the adapter ligation step, the total 60 μL of end-prepped DNA from the previous step were added in a mix containing 25 μL of ligation buffer LNB (NEBNext Quick Ligation Module, New England Biolabs, United Kingdom), 10 μL NEBNext Quick T4 DNA Ligase (New England Biolabs, United Kingdom), and 5 μL of Adapter Mix (ONT, United Kingdom), and incubated at room temperature for 10 min. A purification step using 0.4× Agencourt AMPure XP beads was performed. Briefly, the mixture was incubated at room temperature with gentle mixing for 5 min, washed twice with 250 μL of short fragment buffer (ONT, United Kingdom) (to allow the recovery of fragments of all sizes), pellet allowed to dry at room temperature for 1 min before DNA being resuspended in 15 μL of elution buffer (ONT, United Kingdom), and incubated at room temperature for 10 min or more. The mixture was retained and coined as ‘DNA sequencing library’. A 1 μL aliquot was quantified by fluorometry using Qubit 4 Fluorometer and quality measured with DeNovix DS-11 Spectrophotometer to ensure no contaminants were present before the library loading step. If the DNA sequencing library did not show A260/280 between 1.8–2.0 and A260/230 between 2.0–2.2, it was discarded, and the protocol repeated.
MinION sequencing and basecalling. Nanopore sequencing was performed using MinION MK1B sequencer (ONT, United Kingdom) and flowcells R9.4.1 (FLOW-MIN106D, ONT, United Kingdom) using MinKNOW software v.21.02.1 (ONT, United Kingdom). After the MinION Flow Cell was setup accordingly to manufacturer’s instructions, the pre-sequencing mix was prepared by adding 12 μL of the DNA sequencing library containing at least 50 fmol, 37.5 μL of sequencing buffer (ONT, United Kingdom), and 25.5 μL of Loading Beads (ONT, United Kingdom). The flowcell was primed with a mixture of 30 μL Flush Tether introduced directly into the flush buffer tube (Flow Cell Priming Kit, EXP-FLP002), according to manufacturer’s protocol (ONT, United Kingdom). Five minutes after the priming of the flowcell, the DNA nanopore sequencing library was mixed by pipetting and loaded in a dropwise fashion using the SpotON port, according to manufacturer’s protocol. Once the DNA sequencing library was loaded, the 24 h sequencing run was initiated using MinKNOW software v.21.02.1. Basecalling was performed with guppy v3.2.6 (Oxford Nanopore Technologies) from the command line using the fast basecalling mode, with the quality score filter of 8, and adapters’ trimming mode on. Quality controls were performed using the nanoplot tool (De Coster et al., 2018) with the length filters parameters of maximum length at 1300 and minimum at 300.
Taxonomical classification
What’s in my Pot and BugSeq. WIMP (version 2021.11.26) was used as a first try for the classification assignments in the fungal mock community nanopore sequencing profile experiments. WIMP is a workflow available in the EPI2ME Desktop Agent (ONT, United Kingdom), for the taxonomic classification of basecalled sequences (reads) generated by nanopore sequencing. Firstly, WIMP filtered FASTQ files with a quality Qscore below a minimum threshold (default is 7). The sequencing read quality was also measured by the Qscore. For reads that pass the quality threshold, Centrifuge software (Kim et al., 2016) was used to assign a taxon to each read, and thus a score was attributed to every assignment. Additionally, BugSeq online software (Fan et al., 2021) was also employed. The BugSeq algorithm performs minimap2 alignments using a nucleotide database, followed by Bayesian reassignment and Lowest-Common Ancestor identification (Fan et al., 2021).
Results
Fungal mock community nanopore sequencing
Nanopore sequencing quality control assessment. The mock community was generated by amplifying the ITS regions of five fungal species - C. glabrata, C. parapsilosis, C. lusitaniae, M. guilliermondii, and P. kudriavzevii. Two independent DNA sequencing libraries were prepared and sequenced in separate experiments. One first classification attempt was tried with WIMP that produced an inaccurate taxonomical assignment (Figure 1).
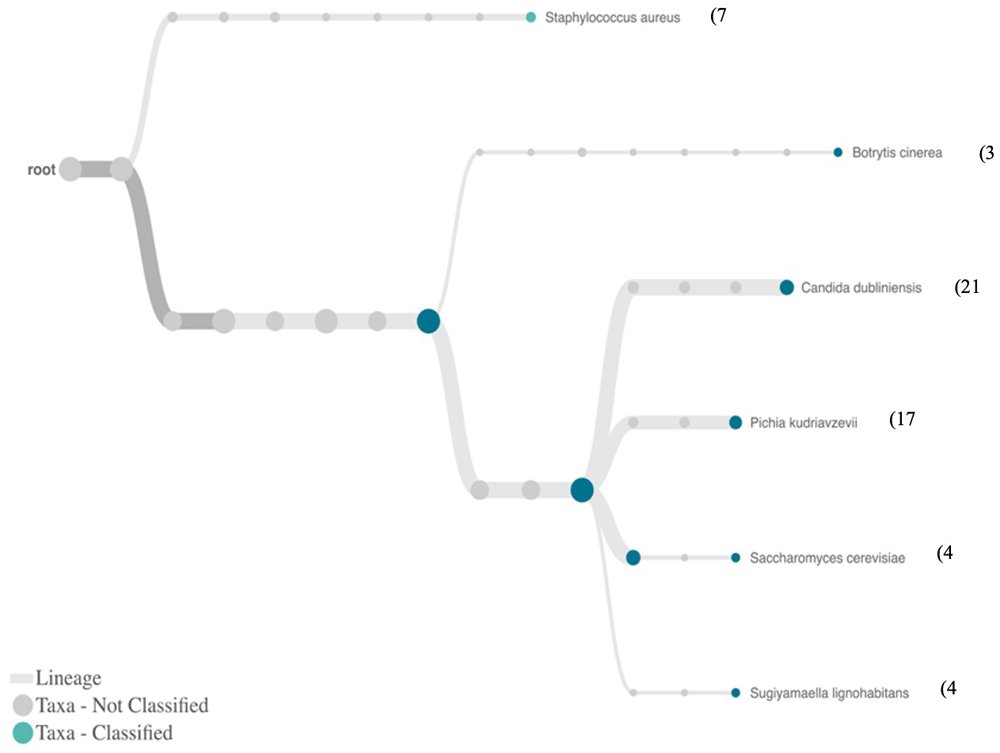
Figure 1. Heat tree displaying the community structure of the Mock community A.
A total of 1,314,572 reads were analysed with WIMP, from which 1,084,471 were classified. The average quality score was 9.43 and the average sequence length was 550 bases. Only taxa with relative abundances above 3% are showed (in parenthesis are depicted their relative abundances).
Therefore, BugSeq’s pipeline may be more curated than WIMP’s, since it includes a post-classification step to remove and quality control the assignments which is absent in WIMP pipeline (Fan et al., 2021; Marti, 2019). Therefore, BugSeq pipeline was employed for nanopore sequenced reads data analyses (Table 1).
Table 1. Nanopore sequencing performance overview of two independent sequencing runs from the same fungal mock community targeting ITS amplicons.
Sample
ID | Quality control1 | Alignment parameters |
|---|
No.
reads | Average
Qscore | No. analysed
reads | recentrifuge
score average | Average read
length (b) | No. taxa
detected |
|---|
| Run A | 1,314,571 | 12.03 | 1,308,263 | 56.9 | 512 | 146 |
| Run B | 4,879,747 | 10.65 | 4,655,632 | 58 | 543 | 255 |
Both average Qscore and recentrifuge scores revealed a high basecalling error-rate (~6–9%) and a low alignment score (56.9–58.0, with 57–58% of the sequenced reads matched to one entry in the reference databases). Indeed, nanopore sequencing could retrieve the correct assignments of the mock community in both sequencing runs (Table 2). BugSeq could attribute the expected taxa identifiers even when the recentrifuge assignment score barely surpassed the 50% of matching. However, the presence of ITS sequences in the references databases is sufficiently represented in the way that a 50% match is considered sufficient to assign the correct taxon using BugSeq bioinformatic pipeline. Still, the relative abundances of these species in the fungal mock community did not yield the expected value (Table 2). C. lusitaniae was consistently overrepresented in the mixtures, showing relative abundances of 40% to 47% of the assigned reads instead of the expected 20%, while C. glabrata was underrepresented, with only 4% to 8% of the assigned reads.
Table 2. Nanopore sequencing performance overview of two independent runs (termed ‘Run A’ and ‘Run B’) from the same fungal mock community targeting ITS amplicons.
Taxonomic assignments were retrieved through recentrifuge tool in BugSeq pipeline.
| Taxa ID | ITS
fragment
size (b) | No. reads | Relative
abundance
(%) | Normalized
average
recentrifuge score |
|---|
| Run A | Run B | Run A | Run B | Run A | Run B |
|---|
| Clavispora lusitaniae ATCC 42720 | 552 | 607,695 | 1,842,887 | 46 | 40 | 53.5 | 56.7 |
| Candida parapsilosis | 690 | 237,533 | 532,047 | 18 | 11 | 62.4 | 65.3 |
| Meyerozyma gulliermondii ATCC 6260 | 775 | 207,528 | 773,358 | 16 | 17 | 60 | 63.1 |
| Pichia kudriavzevii | 679 | 179,138 | 859,268 | 14 | 18 | 60.6 | 62.6 |
| Candida glabrata | 1050 | 54,718 | 376,756 | 4 | 8 | 61.3 | 64 |
The two independent fungal mock community nanopore sequencing runs showed high precision. Despite a difference of around 3.5 million reads between the two sequencing runs, the average Qscore (12.03 vs 10.65), recentrifuge alignment score (56.9 vs 58), and average read length (512 vs 543) were similar. The five species were detected and were the most abundant taxa observed between the assigned taxa. The overall performance here described revealed an expected nanopore sequencing accuracy, with relatively high error-rate and a long list of ‘taxonomic noise' (146 total taxa found in Run A, and 255 in Run B). Indeed, a higher number of taxa detected was observed in Run B, the sequencing run where the most sequenced reads were generated. In the Run A, 1% of the total reads were not assigned, and less than 1% was assigned to bacteria (0.2%), synthetic constructs (0.2%), viruses (0.2%), and archaea (less than 0.01% assigned to Sulfolobus acidocaldarius). In the Run B, 5% of the total reads were not assigned, and less than 1% was assigned to bacteria (0.6%), synthetic constructs (0.1%), viruses (less than 0.01%), and archaea (less than 0.01% assigned to Euryarchaeota). However, the average classification score and the high error-rate observed were not sufficient to hamper the fungal mock community taxonomic assignments since the original fungi mock community’s members were correctly assigned (Table 2).
Discussion
A fungal mock community comprising C. lusitaniae, C. glabrata, C. parapsilosis, M. guilliermondii, and P. kudriavzevii was used to assess the precision and accuracy of targeted nanopore sequencing protocols based on the use of the fungal ITS genomic taxonomical marker. The goal was to check the capacity of nanopore sequencing to correctly assign the community composition while detecting the correct abundances of each species. The incongruent output retrieved by WIMP strange and cannot be related to the increased representation of closely related sequences in the database. However, WIMP’s developers stated that by allowing increased specificity of assignments at the family and genus level it also might blur the line between lower levels of taxonomic classification, such as genus and species (ONT technical team, personal communication). Despite less curated entries in the reference databases, the bioinformatic pipeline behind WIMP might not be the best choice to analyse our type of data. Although the advantage of centrifuge is that it is optimized for solving metagenomic classification problems and it is capable of accurate identification of reads even when databases containing multiple highly similar references genomes are used (ONT technical team, personal communication), it has limitations compared with other algorithms such as minimap2 (Ammer-Herrmenau et al., 2021). Thus, it can be hypothesized that a different approach based on BLAST/MEGAN can surpass these limitations (Bağcı et al., 2019).
WIMP attributes a score after determining the most reliable place in the taxonomy tree for those reads (Kim et al., 2016). On the other hand, the BugSeq pipeline assigns taxonomical classifications based on the recentrifuge algorithm instead of centrifuge performed by WIMP, and it relies on a three-step pipeline node to assign taxonomical identifiers to every read (Fan et al., 2021). The first step is the reads mapping using minimap2, the second is the reassignment of mapped reads based on a Bayesian statistical framework using pathoscope (Francis et al., 2013). This reassignment step optimizes the multiple strains coverage, mediating the absence of target taxa in the reference database, surpassing the need of multiple alignments, extensive homology searches, or genome assembly steps (Francis et al., 2013). The last step in the BugSeq pipeline is the calculation of the Lowest-Common Ancestor as input for recentrifuge (Marti, 2019), which facilitates vigorous contamination removal (such as crossovers) and quality comparative analysis of multiple samples, giving a confidence level score for every result that propagates to further downstream analyses.
Recently, D’Andreano et al. (2020) were successful in developing a nanopore sequencing approach to assess the fungal composition from clinical samples. The authors targeted a 3.5 kb region (V3, 18S-ITS1-5.8S-ITS2-28S D2) and a 6 kb region (V1, 18S-ITS1-5.8S-ITS2-28S D12) for amplicons generation, performed taxonomical assignments using WIMP, and compared the performance with a known fungal mock community – ZymoBIOMICS (D’Andreano et al., 2020). Besides using longer amplicons than the approach tested here, the authors also removed barcodes and adapters using porechop (which is unsupported since October 2018). However, it is unlikely that the inclusion of barcodes and adapters to downstream analyses could explain such significant discrepancies found in the fungal mock community analysed in this report, because C. parapsilosis (Table 2, run A), M. guilliermondii (Table 2, run B), and P. kudriavzevii (Table 2, run 2) showed relative abundances as expected (Table 2). Moreover, there was a difference of 1–7 percentage points between the two independent runs attributed to the same taxa, which was more probably explained by chance or other factors, such as basecalling error-rate, or centrifuge indexation, than to the presence of barcodes and adapters. In another study, Hu et al. (2021) evaluated a nanopore sequencing approach to study a fungal mock community comprised of 43 species. The authors generated amplicons by amplifying the ITS1 regions of the rRNA gene with the universal fungal primers ITS1F and ITS2 and performed adapters and barcode trimming with qcat after a barcoded nanopore sequencing run (Hu et al., 2021). The authors compared classification and community analysis pipelines for nanopore sequencing data in amplicon and shotgun approaches from fungal mock communities comprised of 43 species (Hu et al., 2021). Their approach consisted of a generation of a custom reference database comprised solely with the species from the mock community, i.e., all the genomes of the 43 species in the mock community were downloaded from the NCBI (Hu et al., 2021). Then, the authors used kraken2 to perform a search to identify potential contaminated regions in the concatenated FASTA and masked those regions using bedtools (Quinlan & Hall, 2010). Low complexity regions were also masked using dustmasker from the BLAST+ package (Camacho et al., 2009). Lastly, they used makeblastdb to construct the mock community custom database (Hu et al., 2021). In regard to the amplicon-based approach, the authors used kraken2 as the k-mer based-algorithm and minimap2 as the alignment-based algorithm. In the minimap2 analysis, the accessions of the best hits were extracted from the output files and their taxonomic correspondence were searched in the NCBI taxonomic map using python pandas module (Hu et al., 2021). Finally, the authors merged information from different output files and performed ete3 module again to assign taxonomic information to each read (Hu et al., 2021). The authors concluded that combining BLAST with the fungal specific RefSeq fungal database was the best approach to obtain the most precise classifications for the fungal mock community data sets (Hu et al., 2021). However Unite is a consistently better tool for metabarcoding (Nilsson et al., 2019b) The classification can also be improved if cutoffs on query coverage were applied, including flow-on effects on downstream community composition analysis sourced from complementary shotgun/metagenomics data sets (Hu et al., 2021). Such curated nanopore sequencing approach decreased the chance of misclassification and mismatches in the classification. These results cannot be explained by PCR amplification biases since the mock community was built with equimolar concentrations of each species ITS amplicons after PCR (Hu et al., 2021). In detail, PCR amplification biases derive mainly from inconsistent amplification of the genomic barcoding region that differs in every species, caused by copy number variations and different primer binding specificities (Nearing et al., 2021; Silverman et al., 2021). Additionally, in fungi, variations in barcode genomic regions lengths are the most probable cause to explain biases in recording fungal community compositions, with longer amplicons being underrepresented (Castaño et al., 2020). Thus, these results give evidence that we can treat nanopore sequence data with confidence despite the high error-rate. Since nanopore sequencing is a recent technology, there is a lack of experimental and analytical standards for particular approaches like the one here tested and so it is challenging to define what could be accepted or not as a correct approach (Leggett & Clark, 2017). Additionally, recent studies have observed that the extra length of nanopore reads overcome the accuracy limitations (Pearman et al., 2020). Still, it is expected that ONT or other researchers develop better sequencing chemistry and bioinformatic tools to improve these challenges, as it is already expected by the super-accurate basecalling model (announced as <2% error-rate).
Taking the limitations of WIMP into consideration, the fungal mock community was also analyzed with the BugSeq pipeline. It was observed that a BugSeq’s recentrifuge classification score as low as 54 could still perform the correct taxonomical assignments and reasonably differentiate the different species’ relative abundances. Therefore, it is absolutely crucial to carefully evaluate the bioinformatic pipeline choice, since they can profoundly impact the taxonomic and microbial abundances analyses in the samples under study. In conclusion, these preliminary results suggest that either upstream experimental steps, downstream bioinformatics analyses, or both, can introduce biases that are confounding the fungal relative abundances from biological samples.
In conclusion, these results confirm that nanopore sequencing is a very sensitive approach, and the protocol execution must be performed with care and optimized to the specific biological sample and scientific question under investigation. Impairments may occur either upstream during sample collection, DNA extraction, PCR amplicons generation (among others), or downstream, during or post-sequencing, such as basecalling errrors, and further issues in the bioinformatic pipeline performed. These conclusions are supported by recent papers that performed similar but more complete approaches (Conti et al., 2023; Hu et al., 2022). Their results were improved in terms of reducing the taxonomic noise and better sequence-based classification by applying custom-based analysis pipelines on fungal mock communities.