Disclaimer
The mention of specific companies or manufacturers’ products does not imply that they are endorsed or recommended by the Joint Research Centre (JRC) of the European Commission in preference to others.
Introduction
Food additives containing nanomaterials have been used for many years throughout Europe and the rest of the globe. For example, E171 titanium dioxide, now banned as a food additive in the European Union since 2022 (2022/63), is still widely used in food products outside the European Union. Another example, this time still approved for use in the European Union (EU), is the iron based additive E172, which is widely used as a natural colouring agent offering yellow, brown, red, or even black colour to food, drink, supplements, medicine, or cosmetics.
Different instrumental techniques exist to measure particle size distributions (Rauscher et al., 2019), but none can reliably identify the size distribution of primary nanoparticles because they are based on indirect or measures which cannot distinguish single particles from aggregates and agglomerates. In samples, where the presence of agglomerates/aggregate of nanoparticles cannot be excluded, Electron Microscopy (EM) remains the only method which is able to unambiguously confirm the size distribution of the primary particles according to the European Commission recommended definition (2022/C 229/01).
In the case of additives already incorporated into a food matrix, a pre-requisite for reliable EM analysis is avoiding experimental artefacts by minimising or eliminating residues of the food matrix. It is thus critical to use extraction procedures to separate the nanomaterials from food in a way which guarantee an efficient removal of the matrix without damaging the material itself.
The following operating procedures describe fast protocols for the extraction of nanomaterials from: (i) sugar-based confectionary products, containing, according to the manufacturers’ declaration, around 80–90% of carbohydrates. This protocol is based on the use of Ethanol and ultrapure water (Geiss et al., 2020); (ii) lipid rich food products, such as tartare sauce, which, according to the manufacturers, contain around 70–80% of fats. The protocol is based on the use of enzymes to sequentially degrade lipids and carbohydrates (Facchetti et al., 2020).
In each case, the final product of the extraction process is a purified, water-based suspension of nanoparticles, which can be deposited on appropriate supports for subsequent analyses by Scanning (SEM) and/or Transmission Electron Microscopy (TEM).
The protocols also detail the additional steps necessary to deposit the suspension on typical silicon wafer support or grid for SEM or TEM, respectively. As a verification of the efficiency of each step, samples of the various wash solutions were examined by EM to confirm the absence of food additives particulate materials. It should be noted that these procedure extract, non-specifically, all particulates, which are not soluble in water, Ethanol or digested by the enzyme. In the case of commercial alimentary products, where mixtures of different particle types may be present, it is recommend that steps be taken to directly verify the identity of extracted particles using EM equipment coupled with chemical analysis, e.g. energy dispersive X-Ray spectroscopy (EDX). Where direct analysis of individual particles is not possible, then bulk elemental analyses by e.g. inductively coupled plasma mass spectrometry (ICP-MS) or Total Reflection X-ray Fluorescence (TXRF) may permit the exclusion of other inorganic or metal-organic particles.
Methods
Extraction of E171 from commercially available sugar-based jelly beans
The details of the following procedure are based on the observation that E171 is principally a component of the jelly beans’ external coating, and that the content of TiO2 material varies with the colour of the confectionary product. It was found that the highest amount of E171 is present in yellow, white and green jelly beans and including material from jelly beans of other colours (e.g. violet, pink, red) is undesirable, as it serves only to increase the proportion of matrix which must be removed. The procedure is developed on a fixed amount (100mg) of external coating of jelly beans containing E171 food additive. Adaptation of reagents’ concentrations are allowed, if necessary. Reagents, ultrapure water and absolute Ethanol, are filtered using syringe filter of 0.22µm pores, before use to avoid possible external contamination. Representative steps of the sample preparation are shown in Figure 1.
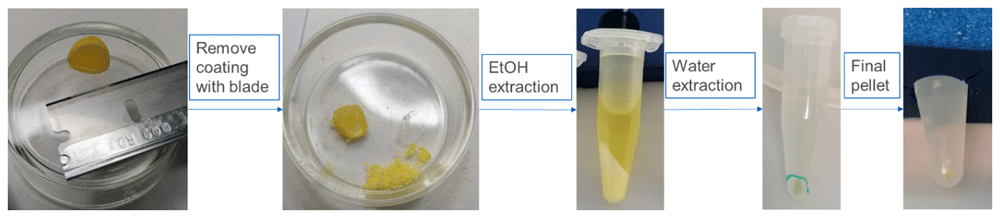
Figure 1. This figure represent different steps of the preparation protocol starting from removal of the external coating of the jelly beans to the final pellet containing TiO2 particles to be analysed; (EtOH is Ethanol).
First, remove 100 mg of the external coating of the jelly beans using blade avoiding the removal of the jelly internal part that is not considered in this sample preparation procedure. Collect the sample in Eppendorf tube of 1.5 mL, add 1 mL of absolute Ethanol, vortex for 30 seconds and ultra-sonicate using ultrasonic bath for 10 minutes. Centrifuge the suspension at 16000 rcf (relative centrifugal force) for 15 minutes, remove the supernatant ant store it in case of need of further analysis. Add 1 mL of absolute Ethanol and repeat the previous centrifugation step once, remove supernatant and add 1 mL of ultrapure water and mix, centrifuge, as previously described, twice. In the end of the procedure, we obtain a clean pellet ready for the preparation of sample for EM analysis after addition of 500 µL ultrapure water and sonication (e.g. vial tweeter 20 minutes, 75% amplitude, 0.5 cycle).
Once sonicated, the sample is enough dispersed to be deposited on the electron microscopy support and analysed to assess primary size distribution of E171 food additive.
The sample grid, 200 mesh Cu-Formvar carbon coated grid, or equivalent, for TEM analysis (Figure 2) and silicon wafer for SEM analysis are prepared by deposition of 3 µL of suspension; to improve particle adhesion and suspension distribution on supports, Alcian Blue (Verleysen et al., 2019), glow discharge or equivalent pre-treatment should be used. Samples are left to dry according to equipment needs and analysed.
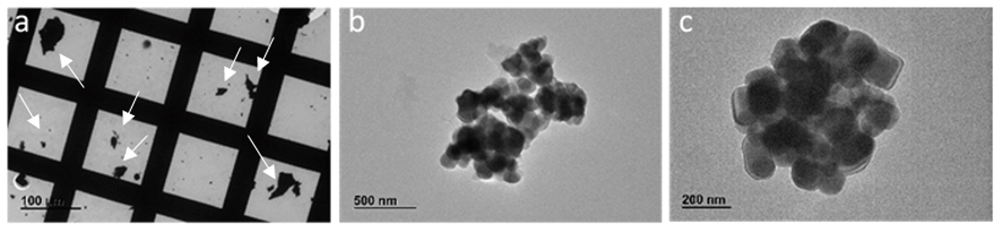
Figure 2. These figures show images obtained by TEM JEOL-JEM 2100 at 120 kV.
The grid appear with some residues of matrix (arrows) (a) that do not interfere with the final analysis (b) where particles, at higher magnification (c), can be visualised and measured.
Even if the pellet results enough clean for EM analysis, it could be that some interference remain after the drying step, for this reason it is recommended to gentle wash samples on grids or on silicon wafer with absolute Ethanol and completely left to dry, before analysis.
Extraction of E172 from commercially available sugar-based red pearls
The hereafter described procedure is based on the observation that E172 is mainly contained and distributed on the red pearls’ external coating. The advantage of E172 colour based material, in this case red, is that we can optically see the phase with higher probability to contain the material. In addition, since the nanomaterial concentration is quite low, for the EM analysis, the ultrapure water volume used is 1 mL for 35–40 red pearls, to avoid sample dilution. Reagents, ultrapure water and absolute Ethanol, are filtered using syringe filter of 0.22µm pores, before use to avoid possible external contamination. Adaptation of reagents’ concentrations are allowed where necessary.
Please note that even if this protocol remove most of the sugar-based matrix, some could remain and appear as white part of the pellet. Repeat the washing steps, hereafter described, indicatively 2 times each, if the sugar matrix is still visible. Observe that in the end of the extraction procedure, the major part of the sample is red and the white part of the matrix is negligible. Relevant steps of the protocol are shown in Figure 3.
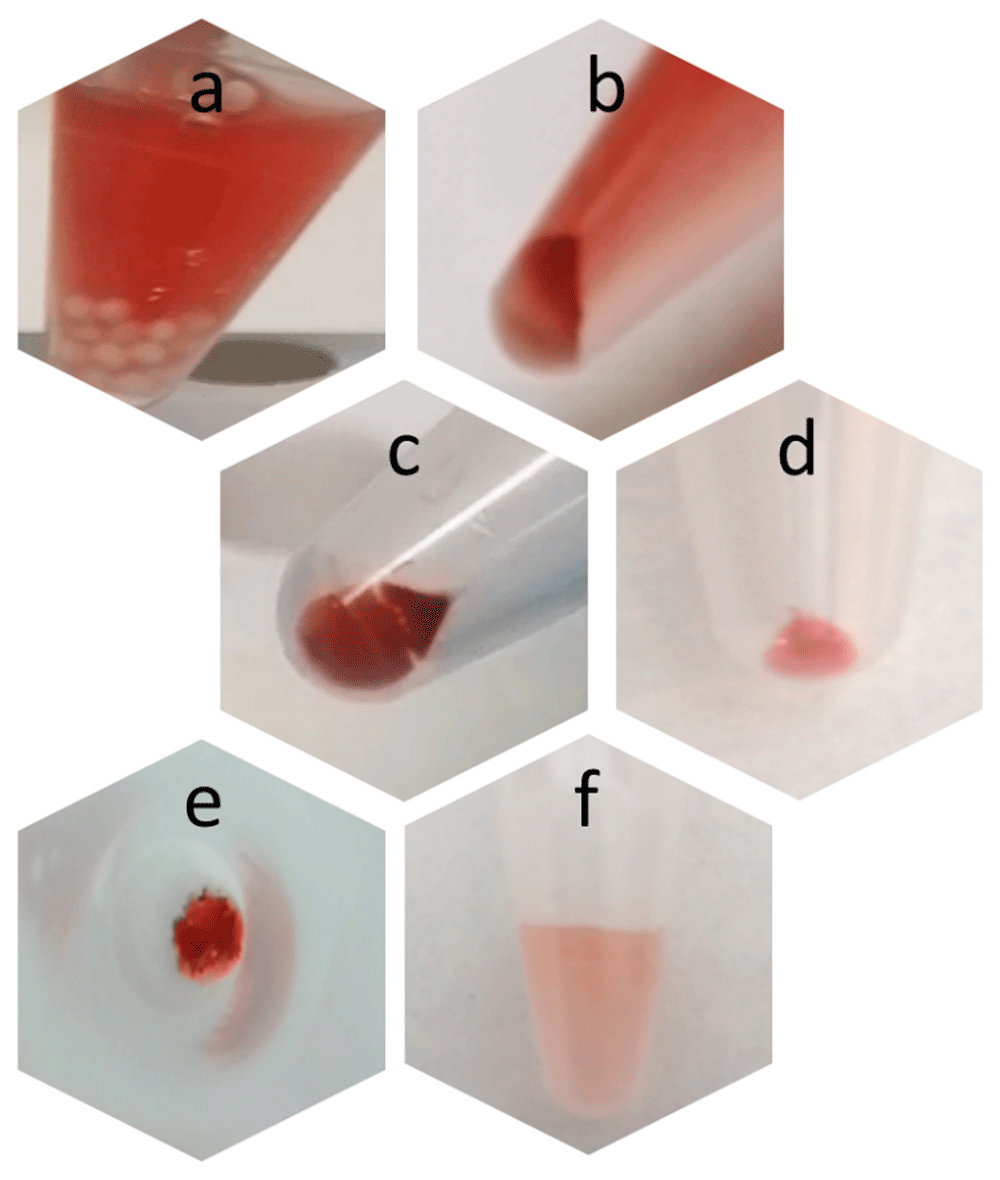
Figure 3.
Images of the results obtained after different steps of the extraction protocol: a) 30 seconds after water addition, red pearls become white; b) after first centrifugation; c) after first Ethanol wash; d) after second Ethanol wash and e) same sample upper view; f) after water addition and sonication.
First, collect 35–40 red pearls in a 1.5 mL Eppendorf tube, add 1 mL of ultrapure water and gently shake for 30 seconds. Remove supernatant, transfer in 1.5 mL Eppendorf tube and discard the remaining part of the pearls. Centrifuge the suspension at 16000 rcf (relative centrifugal force) for 5 minutes, remove 500 µL of the supernatant and store it in case of need of further analysis.
Observe the pellet in which you can see a white and a red part, remove this last only using the 500 µL of supernatant present in the tube. Transfer this volume in a clean tube and add 500 µL of ultrapure water reaching 1 mL volume in total. Centrifuge the suspension at 16000 rcf for 2 minutes and if the white part is still visible in the pellet, repeat the last steps (from remove 500 µL point), twice.
If not, remove the supernatant, add 1 mL of absolute Ethanol, centrifuge suspension at 16000 rcf for 2 minutes and remove the supernatant leaving, as described above, 500 µL of Ethanol. Again, observe the pellet and remove the red part only. Transfer the 500 µL in a new tube and add 500 µL of absolute Ethanol reaching 1 mL volume in total. Centrifuge the suspension at 16000 rcf for 2 minutes. Remove the supernatant, add 100 µL of ultrapure water, and sonicate (e.g. vial tweeter 20 minutes, 75% amplitude, 0.5 cycle).
Once sonicated, the sample is enough dispersed to be deposited on the EM support and analysed to assess primary size distribution of E171 food additive.
The sample grid, 200 mesh Cu-Formvar carbon coated grid, or equivalent, for TEM analysis (Figure 4) and silicon wafer, for SEM analysis are prepared by deposition of 3 µL of suspension; to improve particle adhesion and suspension distribution on supports, Alcian Blue (Verleysen et al., 2019), glow discharge or equivalent pre-treatment should be used. Samples are left to dry according to equipment needs and analysed.
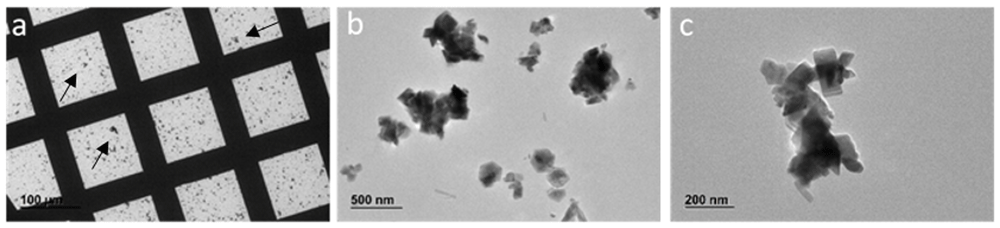
Figure 4. Images obtained by TEM JEOL-JEM 2100 at 120 kV.
The grid appear with some residues of matrix (arrows) (a) which do not interfere with the final analysis (b), where particles, at higher magnification (c), can be visualised and measured.
Even if the pellet results enough clean for EM analysis, it could be that some interferences remain after the drying step, for this reason it is recommended to gentle wash samples on grids or on silicon wafer with absolute Ethanol and completely left to dry, before analysis.
Extraction of E171 from lipid-based tartare sauce
The hereafter described operating procedure is developed to extract E171 single particles and/or agglomerates from food product rich in lipid content such as tartare sauce, where around 70–80% of fats, are generally declared. The protocol is based on the use of enzymes to degrade lipids and carbohydrates. The aim of this procedure is to give detailed instructions on how to prepare sample, using relatively low amount of tartare sauce (500 mg), removing most of the matrix effect, and deposit drop of final obtained sample on grids for EM analysis. Adaptation of reagents’ concentrations are allowed, if necessary. The protocol cannot guarantee a complete removal of matrix, but can produce a sample suitable for E171 detection and measurement of primary size distribution.
Before staring the extraction, prepare solutions as follow: (i) 0.2 M Na-Cacodilate (CAS 6131-99-3; Sigma Aldrich C4945-25G) buffer solution (pH 6-8 to 7.4), weigh 4.88 g of Na-Cacodilate powder and dissolve in 100 mL of ultrapure water, measure pH and adjust if necessary, store at 4°C; (ii) prepare 0.05 M of Na-Cacodilate buffer (pH 6-8 to 7.4) with 50 mL Na-Cacodilate 0.2 M + 3 mL HCl 0.2 N + 147 mL ultrapure water and adjust the pH after adding 2–3 mL HCl, if necessary; (iii) prepare 1 mL of lipase from Aspergillus niger (200 UI, CAS 9001-62-1; Sigma Aldrich 62301-1G-F) weight 2 mg of lipase powder and add 1mL of 0.05 M Na-Cacodilate, if necessary adjust pH at 6.8–7.4.
Remove 500 mg tartare sauce from the original envelop with a clean spatula (to avoid external contamination) taking care of removing the creamy part, only, put in 1.5 mL Eppendorf tube and add 1 mL of absolute Ethanol. Vortex for 30 seconds and incubate in the ultrasonic bath for 10 minutes. A solid part will appear in the vial, remove it using tweezers or spatula or directly remove the solvent using a pipette. Centrifuge the solvent at 16000 rcf (relative centrifugal force) for 15 minutes, remove supernatant and store it, in case needed for further analysis. Add 1mL absolute ethanol to the pellet, mix and centrifuge at 16000 rcf for 15 minutes, again remove supernatant and store it, in case needed for further analysis.
Add 1mL of 50 mL Na-Cacodilate 0.05 M, transfer the suspension in a 20 mL glass vial and add 1 mL of lipase, incubate under agitation, if possible, at 50°C in the hoven, overnight (for glass vial smaller than 20 mL, it is recommended to leave the cap slightly open). The day after add 100 µL amylase solution (α-Amylase from Bacillus sp. (CAS 9000-85-5; Sigma Aldrich A4862-250 mL) for 2 hours at 50°C in the hoven, under agitation.
Then, transfer the obtained suspension in 2 Eppendorf tubes of 1.5 mL each and centrifuge at 16000 rcf for 15 minutes, remove supernatant and store it, in case needed for further analysis. Add 1mL ultrapure water to each tube and mix, centrifuge at 16000 rcf for 15 minutes, remove supernatant, twice.
Add 100 µL ultrapure water and sonicate (e.g. vial tweeter 20 minutes, 75% amplitude, 0.5 cycle). Representative steps of the protocol are summarised in Figure 5.
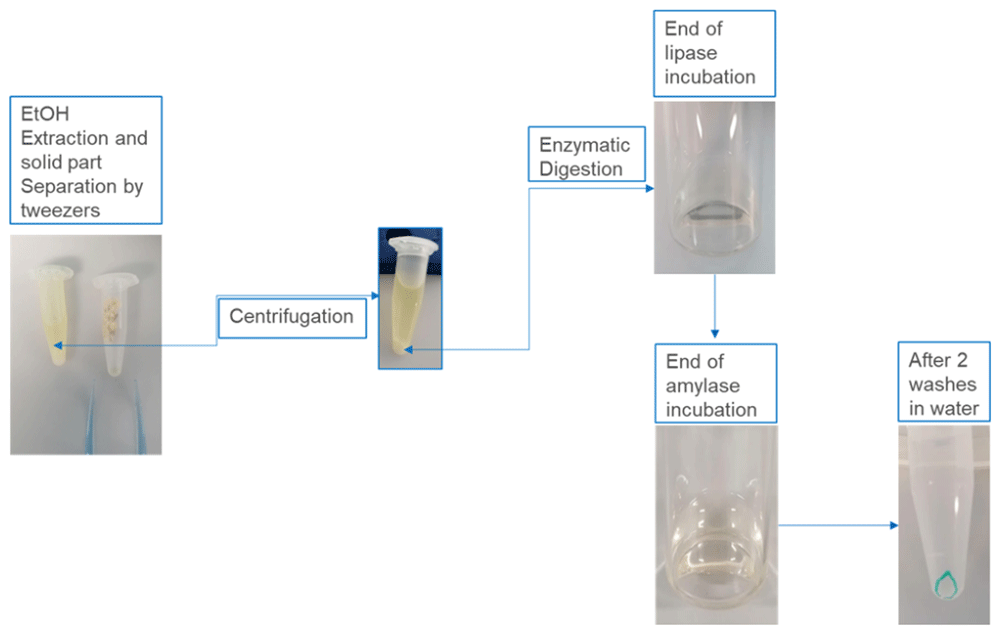
Figure 5. Images of the results obtained after different steps of the extraction protocol, as described in the corresponding legends.
The sample grid, 200 mesh Cu-Formvar carbon coated grid, or equivalent, for TEM analysis (Figure 6) and silicon wafer, for SEM analysis are prepared by deposition of 3 µL of suspension; to improve particle adhesion and suspension distribution on supports, Alcian Blue (Verleysen et al., 2019), glow discharge or equivalent pre-treatment should be used. Samples are left to dry according to equipment needs and analysed.
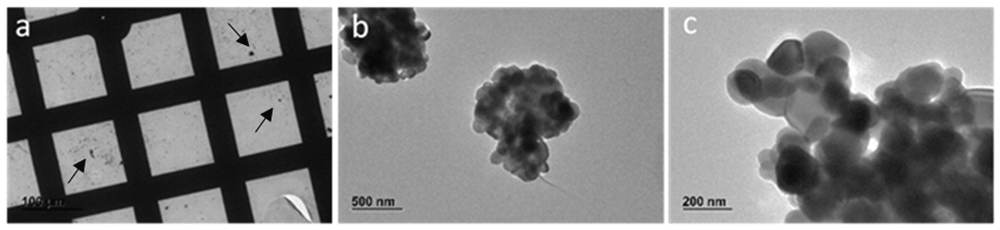
Figure 6. Images obtained by TEM JEOL-JEM 2100 at 120 kV.
The grid appear with some residues of matrix (arrows) (a) that do not interfere with the final analysis (b) where particles, at higher magnification (c), can be visualised and measured.
Even if the pellet results enough clean for EM analysis, it could be that some interferences remain after the drying step, for this reason it is recommended to gentle wash samples on grids or on silicon wafer with absolute Ethanol and completely left to dry, before analysis.
Discussion and conclusion
Extracting food additives from complex matrices is a multifaceted challenge that requires careful consideration of extraction methods, analytical techniques, and the inherent complexities of food compositions. Ongoing advancements in extraction technologies and a growing emphasis on sustainability are paving the way for more efficient and effective methodologies. As food safety and quality continue to be paramount concerns, further research in this field is essential for developing standardized, reliable extraction protocols that meet regulatory requirements and consumer expectations.
The three protocols developed and here described are simple and relatively fast, they are based on the use of low amount of material and few reagents. They aim is to provide detailed instructions list that can be applied for qualitative and quantitative analysis of food additives presence in food matrices. The reagents used, gently extract the material of interest without damaging it or without creating changes in their chemical composition, size and morphology.
Protocols are designed to give to the operator the possibility to obtain suspensions to be analysed by electron microscopy, but also by other techniques, if needed. Additional steps to better purify the obtained suspensions can be added and optimised based on specific requirements.
Ethics and consent
Ethical approval and consent not required